
Last updated: September 2026. All MLS data reflects closed single-family sales from 9/1/2025 through 8/31/2026.
If your budget is closer to $500,000, you have meaningfully more of Austin to choose from than buyers working with $400,000. The price difference opens up new areas of the city, more established neighborhoods with larger lots, and in several cases, access to school districts that do not come with the $500k price tag you might expect.
If school quality is your primary driver alongside budget, our complete guide to the best neighborhoods in Austin for families ranks 10 neighborhoods by GreatSchools ratings and real MLS data.
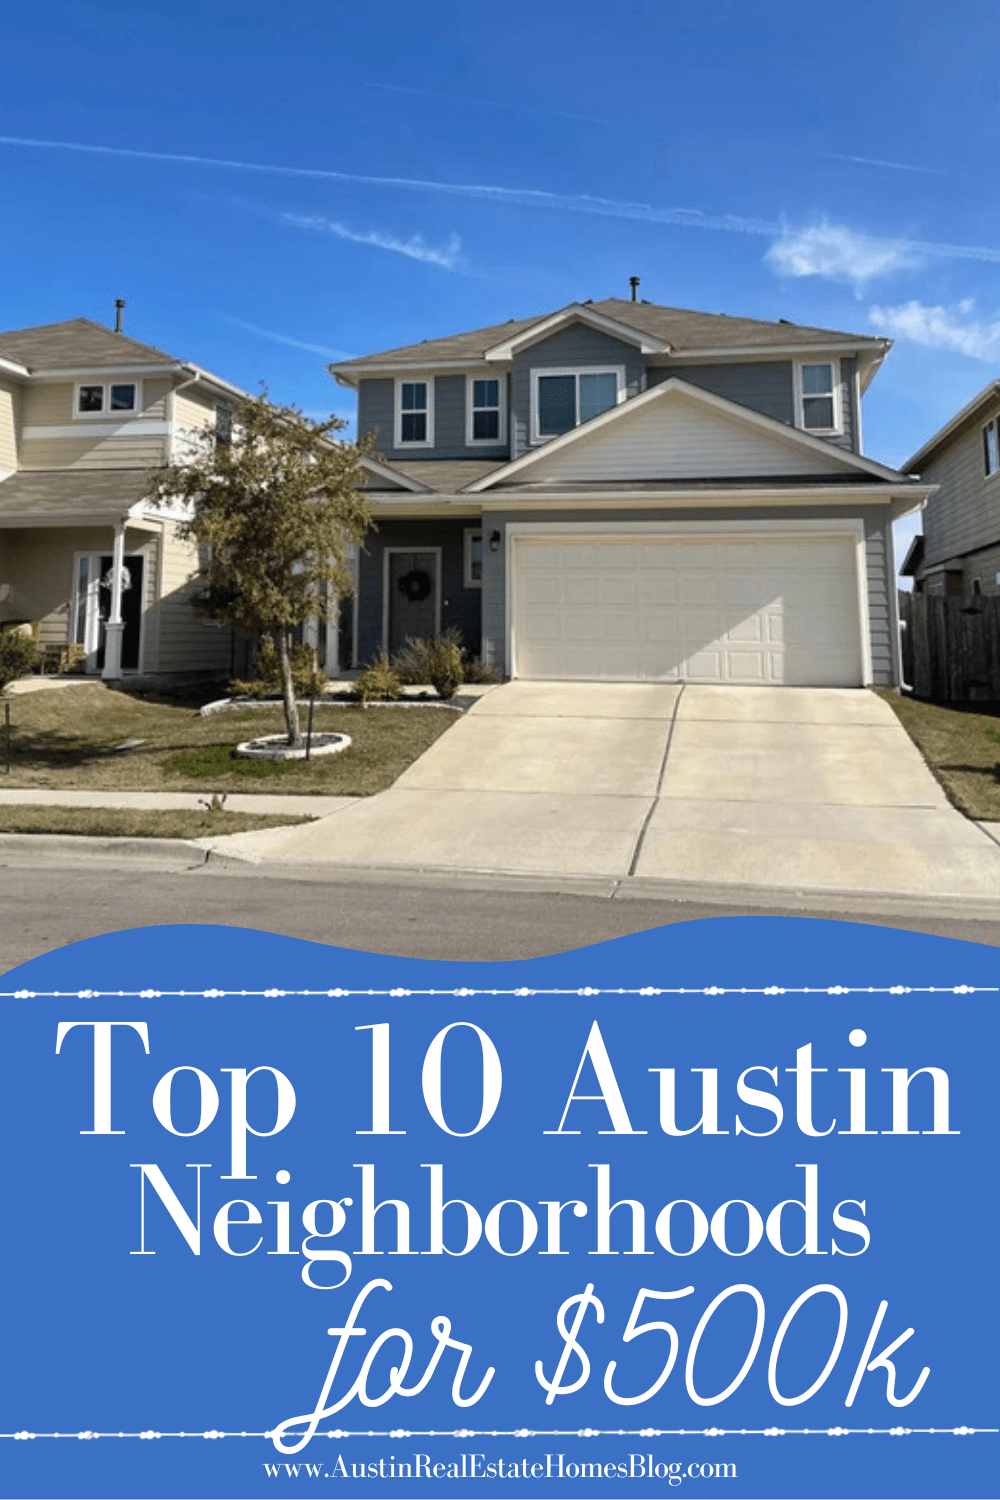
The eleven neighborhoods on this list all had median sale prices at or below $500,000 over the past twelve months based on closed sales data from UnlockMLS. They span Southeast Austin, Southwest Austin, and Northwest Austin, which means different school districts, different commute patterns, different tax rates, and different types of housing stock. We have included all of that information so you can make a direct comparison rather than chasing data across multiple sources.
One thing worth saying upfront: this list covers a wide tax rate range. The difference between the lowest and highest tax rate on this list is nearly one full percentage point. On a $450,000 home, that gap is worth roughly $4,200 per year, or $350 per month. That is not a footnote. Run the full payment before you fall in love with a price.
If your budget is closer to $400,000, we cover six neighborhoods in that range in our companion post on Best Austin neighborhoods under $400k.
Neighborhood Comparison at a Glance
| Neighborhood | Median Sale Price | Avg Sq Ft | Avg Days on Market | HOA | Tax Rate | Distance to Downtown |
|---|---|---|---|---|---|---|
| Anderson Mill | $417,900 | 1,856 | 55 | None | 2.0856 | 16.8 mi |
| Cascades at Onion Creek | $388,000 | 2,097 | 82 | $65/mo | 2.2465 | 14.6 mi |
| Estancia | $417,450 | 2,230 | 103 | $140/mo | 1.6225 | 13.8 mi |
| Forest North Estates | $475,900 | 1,998 | 48 | None | 1.5273 | 16.7 mi |
| Goodnight Ranch | $393,846 | 2,175 | 109 | $40-$120/mo | 2.3465 | 11.1 mi |
| Hunters Chase | $475,000 | 2,297 | 43 | ~$33/mo | 1.9513 | 13.9 mi |
| Milwood | $466,500 | 1,851 | 46 | Varies | 2.0465 | 15.1 mi |
| Parkwood | $380,000 | 1,644 | 53 | None | 2.0465 | 7.9 mi |
| Tanglewood Forest | $417,500 | 1,464 | 49 | None | 2.2845 | 13.3 mi |
| Walnut Crossing | $455,000 | 1,538 | 58 | None | 2.0465 | 12.2 mi |
| Wells Branch | $399,000 | 1,730 | 53 | Varies | 1.8526 | 15.4 mi |
Data source: UnlockMLS, closed single-family sales 4/23/2025 through 4/22/2026. The ratings next to the school names below are GreatSchools.org ratings as of October 2026.
What Does $500k Buy You in Austin?
Same $500,000. In Mountain Creek in Pflugerville, the typical home runs 3,114 square feet. In Tuscan Village in Lakeway, it runs 1,507. That is more than twice the house for the same money, 35 minutes apart.
At this price point you are not choosing a better home or a worse one. You are choosing between space and location, and the exchange rate is steep.
Most answers to âwhat does $500,000 buy in Austinâ rely on a handful of example listings, or three or four neighborhoods held up as representative. To answer it with real numbers instead, we pulled closed single-family sales across the entire metro area from September 2025 through August 2026 and kept every neighborhood where the median closed price landed between $470,000 and $530,000, with at least 10 closed sales so the number means something. That is 47 neighborhoods, spanning 13 areas from Jarrell and Kyle to Lakeway and East Austin, and 1,736 closed transactions behind the table below. Every figure comes from closed sales, not asking prices, so it reflects what these homes actually sold for. We will refresh this table every quarter as prices move.
The headline numbers: the smallest median home in the band is 1,507 square feet, the largest is 3,114, a 2.07x difference at the exact same price. Price per square foot ranges from $168 to $376, a 2.24x spread. Days on market ranges from 0 to 129, and as the section below on timing shows, that range has almost nothing to do with price.
That price-per-square-foot spread is wide enough to change what a fixed budget actually buys. At $168 a foot, $500,000 buys roughly 2,976 square feet. At $376 a foot, it buys roughly 1,330. That is the entire story of this price band in two numbers.
What $500,000 buys, neighborhood by neighborhood
| Neighborhood | Area | Median Price | Med. Sq Ft | $/Sq Ft | DOM |
|---|---|---|---|---|---|
| Mountain Creek | Pflugerville | $487,500 | 3,114 | $168 | 42 |
| Paloma Lake | Round Rock | $510,000 | 2,847 | $190 | 27 |
| Ranch at Cypress Creek | Cedar Park | $485,000 | 2,825 | $171 | 39 |
| Bryson | Leander | $525,500 | 2,804 | $201 | 59 |
| Park at Blackhawk | Pflugerville | $500,000 | 2,729 | $180 | 49 |
| Oaks at San Gabriel | Georgetown | $499,495 | 2,726 | $186 | 71 |
| River Ridge | Georgetown | $505,275 | 2,719 | $189 | 32 |
| Teravista | Round Rock | $474,500 | 2,708 | $186 | 30 |
| Crescent Bluff | Georgetown | $489,055 | 2,693 | $175 | 129 |
| Hidden Oaks at Berry Creek | Georgetown | $527,500 | 2,673 | $214 | 0 |
| Cypress Creek | Cedar Park | $495,000 | 2,672 | $175 | 26 |
| 6 Creeks | Kyle | $498,500 | 2,625 | $201 | 122 |
| Water Oak | Georgetown | $485,000 | 2,609 | $195 | 45 |
| Parmer Ranch | Georgetown | $514,900 | 2,600 | $192 | 122 |
| Deerbrooke | Leander | $476,750 | 2,592 | $187 | 72 |
| Woods of Brushy Creek | Northwest Austin | $485,000 | 2,567 | $204 | 40 |
| Mayfield Ranch | Round Rock | $507,000 | 2,540 | $198 | 18 |
| Highlands at Mayfield Ranch | Round Rock | $530,000 | 2,521 | $219 | 45 |
| Oaklands | Round Rock | $522,500 | 2,467 | $211 | 27 |
| Buttercup Creek | Cedar Park | $501,000 | 2,412 | $214 | 35 |
| University Heights | Round Rock | $500,000 | 2,398 | $199 | 114 |
| Hunters Chase | Northwest Austin | $475,000 | 2,377 | $207 | 22 |
| Vista Oaks | Round Rock | $485,000 | 2,373 | $195 | 15 |
| Hills of Bear Creek | Southwest Austin | $504,000 | 2,240 | $214 | 47 |
| Round Rock West | Round Rock | $475,000 | 2,183 | $221 | 19 |
| Cypress Mill | Cedar Park | $504,500 | 2,183 | $236 | 14 |
| Point Venture | Lago Vista | $499,000 | 2,169 | $225 | 102 |
| Bauerle Ranch | Southwest Austin | $519,250 | 2,161 | $247 | 64 |
| Serenada | Georgetown | $485,750 | 2,160 | $224 | 19 |
| Founders Ridge | Dripping Springs | $530,000 | 2,152 | $245 | 19 |
| Scofield Farms | Northwest Austin | $475,000 | 2,126 | $231 | 34 |
| Vizcaya | Round Rock | $480,000 | 2,120 | $221 | 41 |
| Oakcrest Estates | Georgetown | $495,000 | 2,094 | $228 | 13 |
| Sendera | Southwest Austin | $519,263 | 1,945 | $275 | 13 |
| Forest North Estates | Northwest Austin | $475,900 | 1,928 | $249 | 13 |
| Apache Shores | Northwest Austin | $520,000 | 1,913 | $278 | 32 |
| University Hills | East Austin | $494,000 | 1,792 | $306 | 46 |
| Scenic Brook West | Southwest Austin | $510,000 | 1,788 | $275 | 17 |
| Maple Run | Southwest Austin | $500,000 | 1,705 | $296 | 21 |
| Northwood | Northwest Austin | $489,000 | 1,678 | $279 | 22 |
| Shiloh | Southwest Austin | $491,950 | 1,647 | $317 | 37 |
| Cherry Creek | Southwest Austin | $507,500 | 1,596 | $311 | 25 |
| Windsor Park | East Austin | $475,000 | 1,545 | $318 | 59 |
| Delwood | East Austin | $529,025 | 1,542 | $376 | 32 |
| Knollwood on the Colorado | East Austin | $499,000 | 1,537 | $325 | 21 |
| Tuscan Village | Lakeway | $515,000 | 1,507 | $300 | 112 |
If square footage matters more to you than commute time, start at the top of this table. If being close in matters more than square footage, start at the bottom. Either way, sort the full list by size and three groupings show up on their own.
Space at the edge. Neighborhoods on the growth edges of the metro, in Pflugerville, Round Rock, Cedar Park, Georgetown, Leander, and Kyle, put $500,000 into 2,400 to 3,100 square feet at $168 to $214 a square foot. Mountain Creek, at $168 a square foot, is the least expensive square footage in the entire dataset. Ranch at Cypress Creek and Paloma Lake sit close behind it, and Bryson adds a shorter commute for a bit more per foot. Most of this inventory is newer construction, and the trade for the extra square footage is a longer drive into Austin.
The middle. Northwest and Southwest Austin give up some of that space for location: roughly 1,900 to 2,400 square feet at $204 to $278 a square foot, in established neighborhoods with shorter commutes. This is also where homes move fastest in the entire price band. Vista Oaks, Oakcrest Estates, and Forest North Estates all sold in 15 days or less, faster than almost anything on either edge of the table.
Location at a price. East Austin and Lakeway put you closest to the center of the metro, or the lake, for 1,507 to 1,792 square feet at $275 to $376 a square foot. University Hills, Windsor Park, Delwood, Knollwood on the Colorado, and Tuscan Village all sit here. Delwood, at $376 a square foot, is the most expensive square footage in the entire band. You are buying the address and accepting roughly half the house that $500,000 buys 35 minutes away.
None of these is the wrong choice. It is the actual trade a $500,000 budget forces, and it holds whether the priority is proximity or square footage.
There is a second pattern in the data that a short list of examples would not surface: how long a home sits on the market at this price has almost nothing to do with its price, and it does not track neatly with location either. Hidden Oaks at Berry Creek, at $527,500, sold in 0 days. Crescent Bluff, a similar price in the same city, sat for 129. The difference is not the home. It is whether a builder is still actively selling new construction in that neighborhood. The five slowest-selling neighborhoods in the band, Crescent Bluff, 6 Creeks, Parmer Ranch, University Heights, and Tuscan Village, are the same neighborhoods where a builder still has inventory to move and, typically, room to negotiate on price.
That negotiating room is worth its own look, and it is the subject of a companion piece on which Austin-area builders are actively cutting prices right now.
For a closer look at any of these areas, the Pflugerville, Round Rock, Cedar Park, Georgetown, and Leander neighborhood guides go deeper on schools, commute times, and what day-to-day life looks like in each one, beyond what a single table can show.
Once the trade-off is clear, more house farther out or less house closer in, the eleven neighborhood profiles below cover exactly that decision in more depth: tax rates, school zoning, and what day-to-day life actually looks like in each one.
Anderson Mill | Northwest Austin
- Zip Code: 78729, 78750
- Distance to Downtown: 16.8 miles
- Distance to Airport: 24.8 miles
- School District: Round Rock ISD
- Schools: Anderson Mill (4/10), Forest North (8/10), or Purple Sage Elementary (9/10); Deerpark (5/10) or Grisham Middle (9/10); McNeil (7/10) or Westwood High School (9/10)
- HOA: No
- Tax Rate: 2.0856 (2025)
- Year Built: 1975-1998
- Closed Sales (9/1/25-8/31/26): 79
- Median Sale Price: $417,900
- Average Sale Price: $441,064
- Price Range: $275,000 - $795,000
- Median Price Per Sq Ft: $248.55
- Average Home Size: 1,856 sq ft
- Typical Configuration: 3 bedrooms, 2 bathrooms
- Average Days on Market: 55
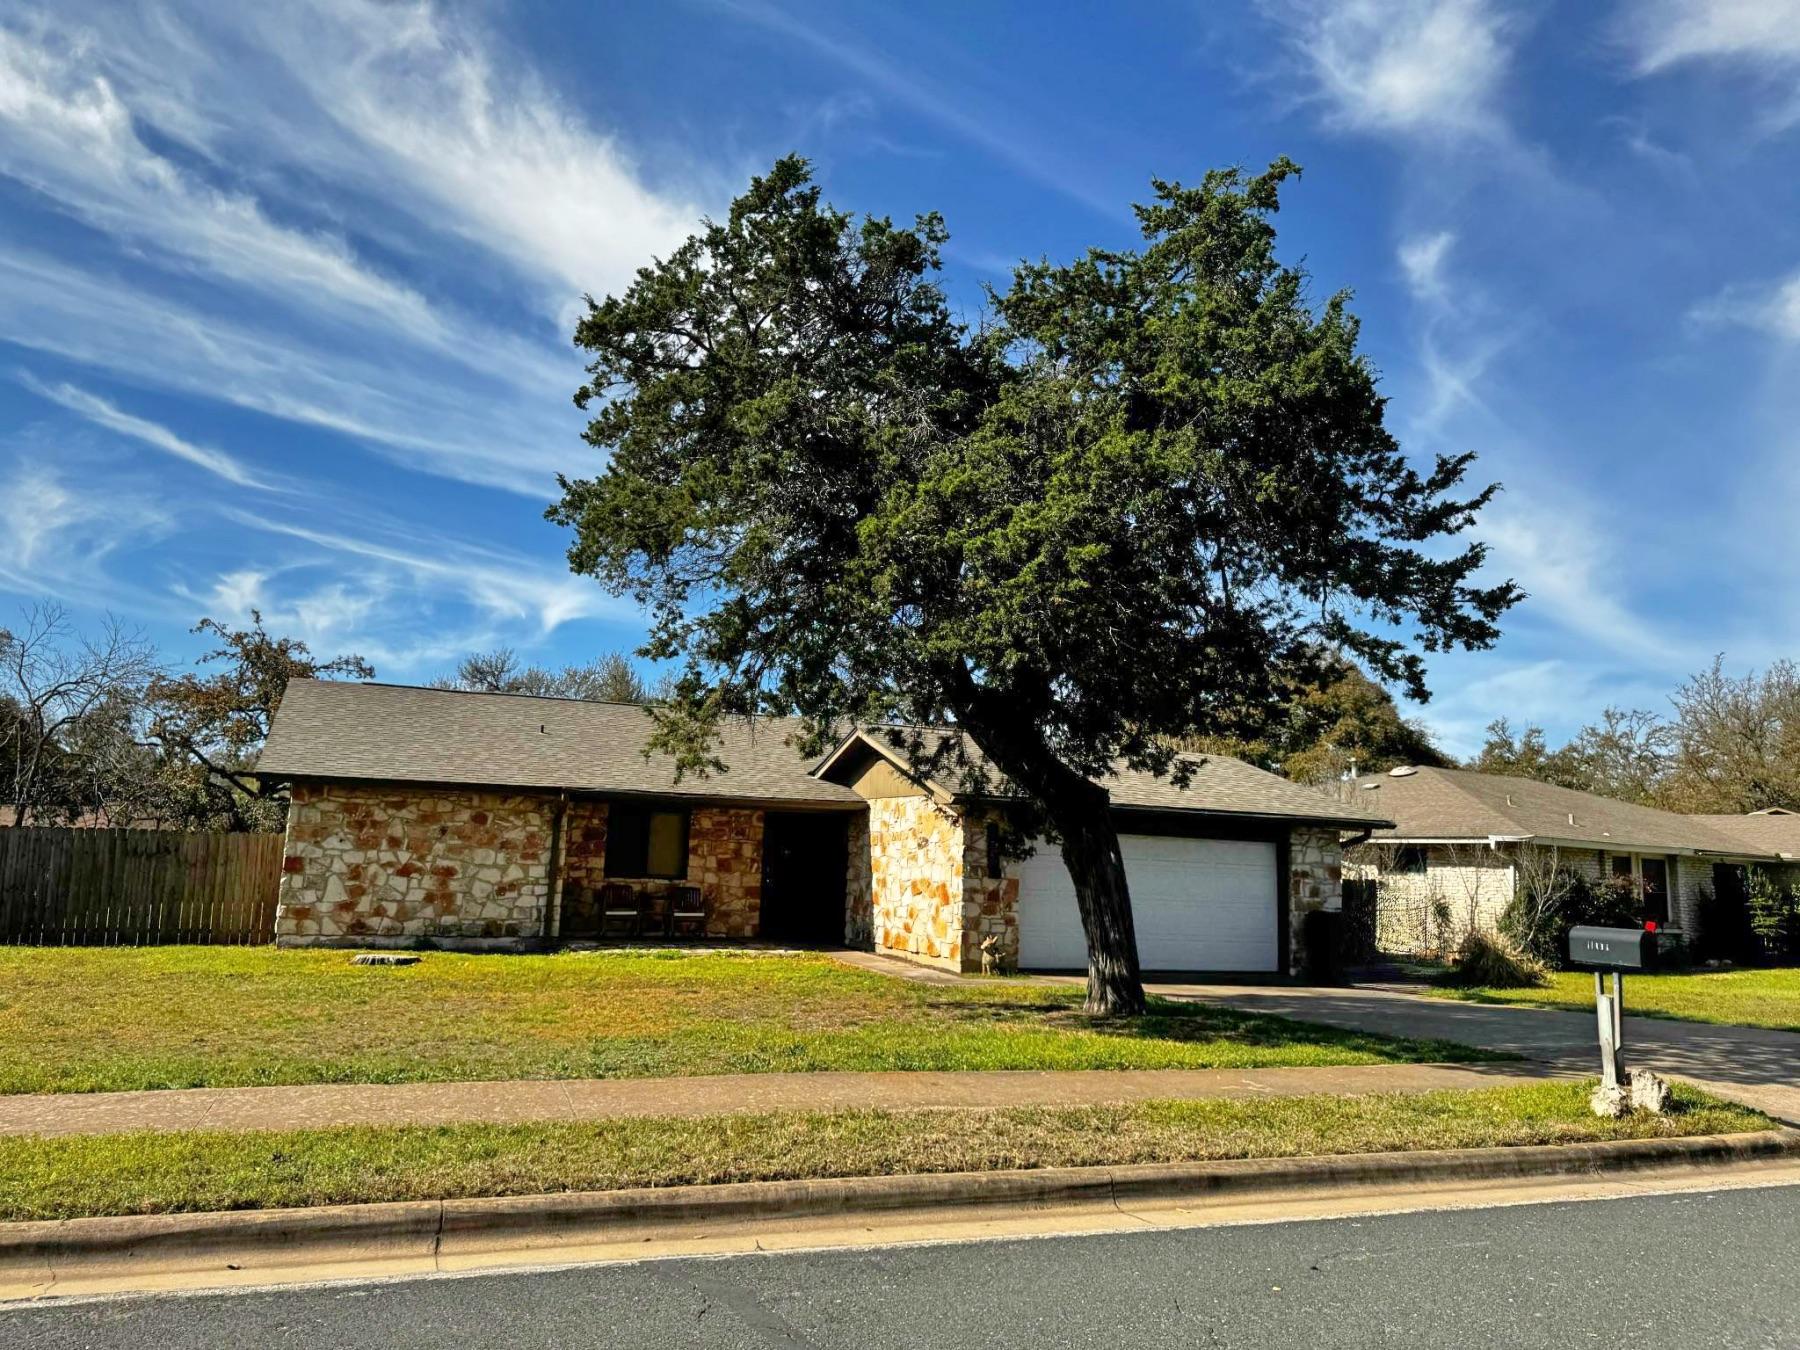
Anderson Mill is one of the larger established neighborhoods in Northwest Austin, with 79 closed sales over the past year giving you a reliable read on market conditions. At a median of $417,900 and a 55-day average on market, there is room to search without being rushed, though that pace reflects the broader market rather than a lack of interest in the area.
The neighborhood spans a wide price range from $275,000 to $795,000, which tells you the housing stock varies considerably in size, age, condition, and updates. Buyers who know what they want and do their homework can find genuine value at the lower end of that range. The upper end reflects larger, more updated homes that have been well maintained or renovated.
Round Rock ISD serves Anderson Mill, with multiple elementary options depending on your specific address including Anderson Mill Elementary, Forest North, and Purple Sage. High school zoning splits between McNeil and Westwood, both of which carry strong reputations within the district. Verify your specific zoning at the Round Rock ISD website before making any school-based decisions.
For more information and to search homes for sale, visit our Anderson Mill Neighborhood Guide.
Anderson Mill Neighborhood Map
Anderson Mill Homes for Sale
Planning your move to Austin? Moving to Austin TX: The Complete Guide covers everything from neighborhoods, cost of living, and schools to jobs, utilities, and step-by-step moving logistics.
 SEARCH ALL ANDERSON MILL HOMES FOR SALENo Email Required!
Cascades at Onion Creek | Southeast Austin
- Zip Code: 78747
- Distance to Downtown: 14.6 miles
- Distance to Airport: 16.4 miles
- School District: Austin ISD
- Schools: Blazier Elementary (6/10), Paredes Middle (2/10), Akins High School (4/10)
- HOA: Yes, $65/month
- Tax Rate: 2.2465 (2025)
- Year Built: 2022-2025
- Closed Sales (9/1/25-8/31/26): 64
- Median Sale Price: $388,000
- Average Sale Price: $387,702
- Price Range: $279,000 - $470,000
- Median Price Per Sq Ft: $185.15
- Average Home Size: 2,097 sq ft
- Typical Configuration: 3 bedrooms, 2 bathrooms
- Average Days on Market: 82
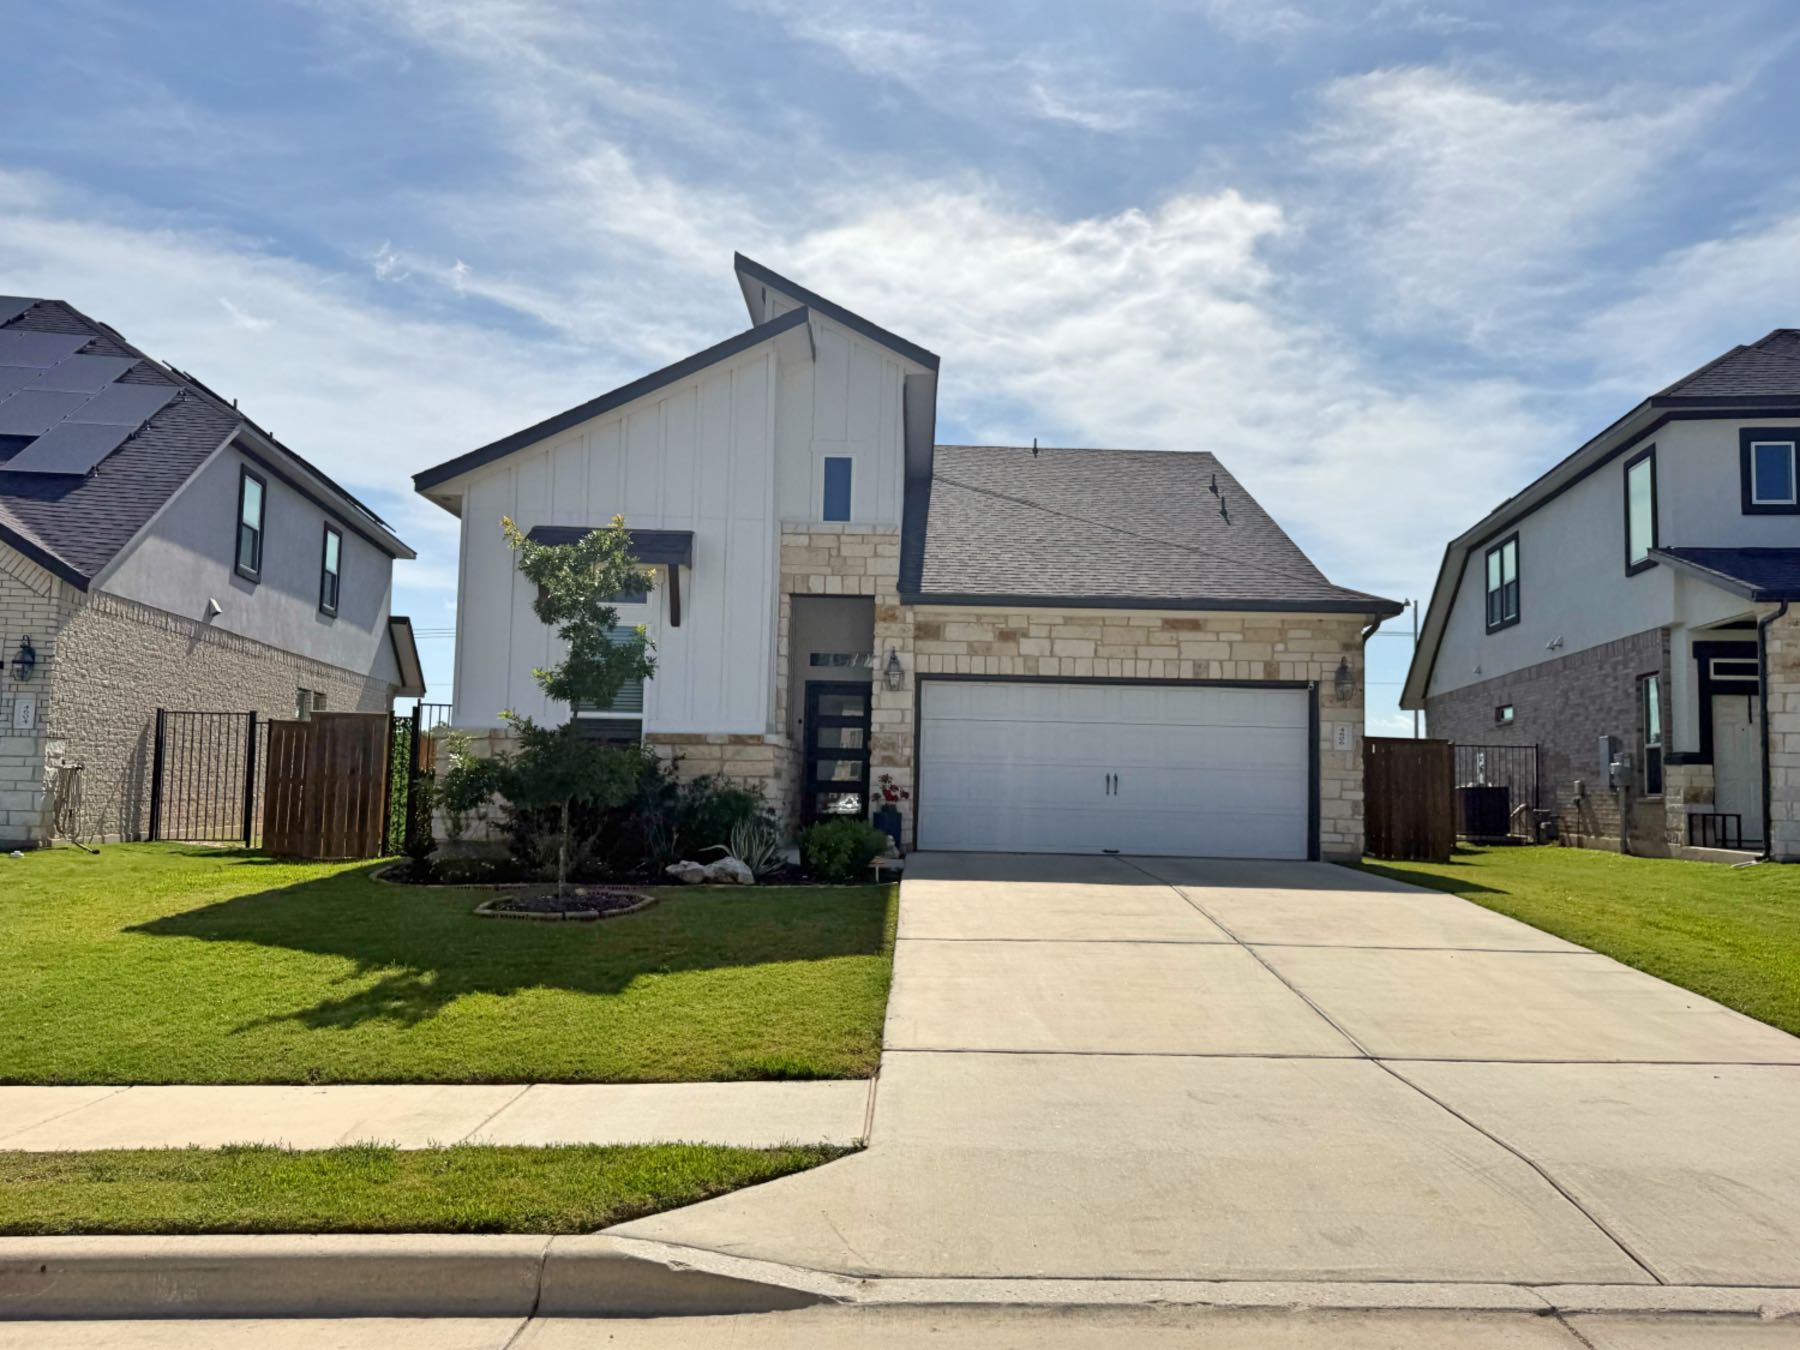
Cascades at Onion Creek is one of the newest communities on this list, with homes built from 2022 through the present. At a median of $388,000 and an average of 2,097 square feet, it offers more space per dollar than almost any other neighborhood here. The three-bedroom, two-bathroom typical configuration is now the most common in the community, though four- and five-bedroom floor plans remain part of the newer construction mix.
The 82-day average days on market reflects new construction pace rather than a slow resale market. Builder homes count days from the original list date through the full construction and closing process, which stretches the number considerably. Resale homes in the community tend to move faster.
The tax rate at 2.2465 is on the higher end of this list. On a $388,000 home that is approximately $8,700 per year in property taxes. Factor that into your monthly payment calculation before comparing this neighborhood to lower-rate options like Forest North Estates or Estancia. Austin ISD serves Cascades with Blazier Elementary, Paredes Middle School, and Akins High School.
Cascades at Onion Creek Neighborhood Map
Cascades at Onion Creek Homes for Sale
Estancia | Southwest Austin
- Zip Code: 78748, 78652
- Distance to Downtown: 13.8 miles
- Distance to Airport: 16.1 miles
- School District: Austin ISD
- Schools: Menchaca Elementary (4/10), Paredes Middle (2/10), Akins High School (4/10)
- HOA: Yes, $140/month
- Tax Rate: 1.6225 (2025)
- Year Built: 2014-2025
- Closed Sales (9/1/25-8/31/26): 56
- Median Sale Price: $417,450
- Average Sale Price: $413,183
- Price Range: $220,000 - $474,200
- Median Price Per Sq Ft: $182.14
- Average Home Size: 2,230 sq ft
- Typical Configuration: 4 bedrooms, 3 bathrooms
- Average Days on Market: 103
Estancia carries the lowest tax rate on this entire list at 1.6225, which is a material advantage worth understanding. On a $417,000 home, the difference between Estancia's 1.6225 rate and Goodnight Ranch's 2.3465 rate is approximately $3,020 per year, or $252 per month. That is before accounting for HOA. The $140 monthly HOA at Estancia is the highest on this list, so buyers should run the full monthly cost of ownership including taxes, HOA, insurance, and mortgage before drawing conclusions from the purchase price alone.
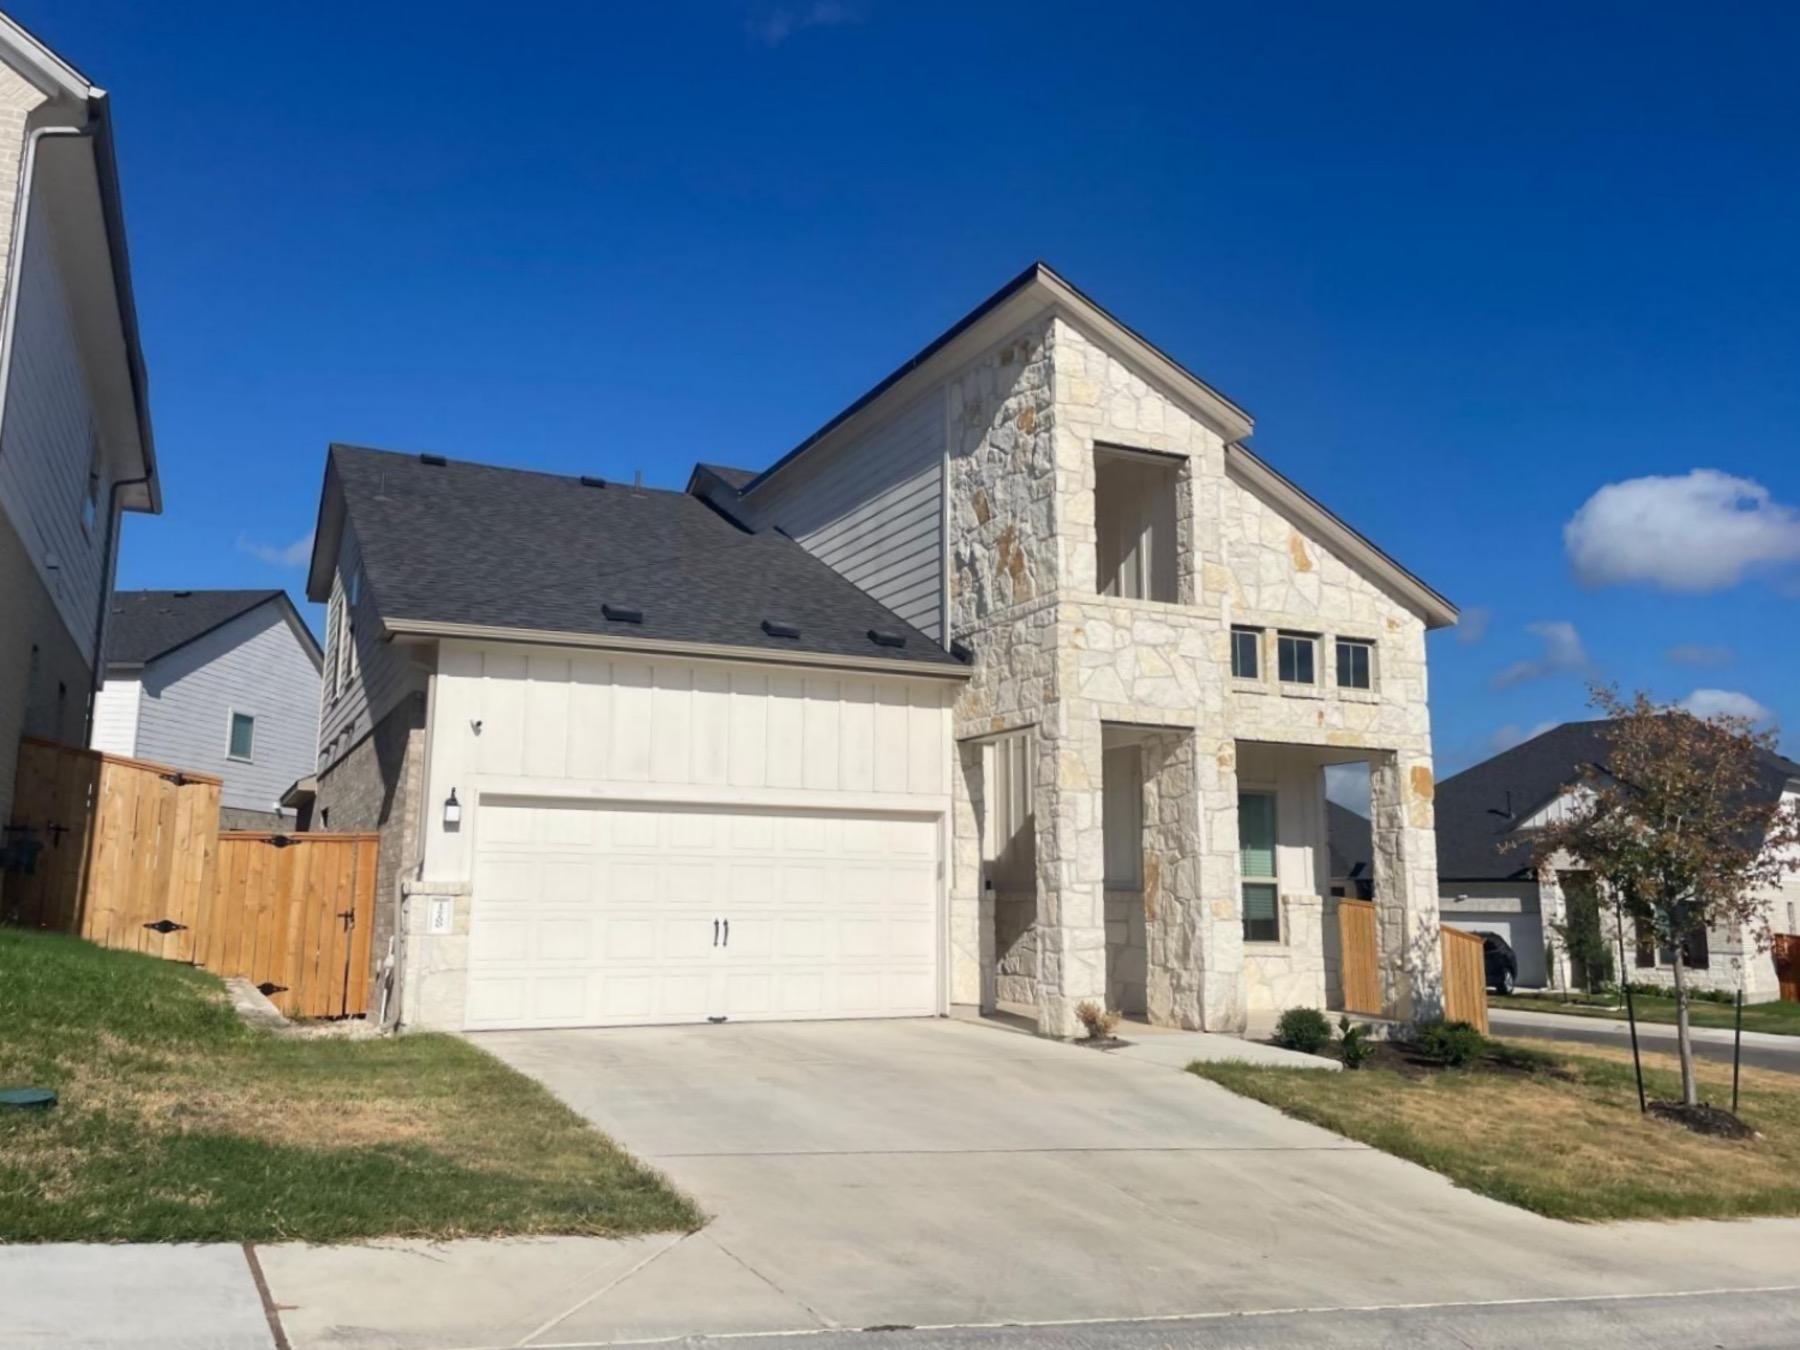
The average home size of 2,230 square feet trails only Hunters Chase for the largest on this list, and the price per square foot at $182.14 is the lowest, which makes Estancia one of the strongest value propositions on a cost-per-square-foot basis for buyers who need or want more space. The 103-day average days on market reflects a community still in active development with builder inventory moving through the new construction process.
Austin ISD serves Estancia with Menchaca Elementary, Paredes Middle School, and Akins High School.
For more information and to search homes for sale, visit our Estancia Neighborhood Guide.
Estancia Neighborhood Map
Estancia Homes for Sale
SEARCH ALL ESTANCIA HOMES FOR SALENo Email Required! Forest North Estates | Northwest Austin

- Zip Code: 78729
- Distance to Downtown: 16.7 miles
- Distance to Airport: 24.6 miles
- School District: Round Rock ISD
- Schools: Forest North (8/10) or Live Oak Elementary (8/10), Deerpark Middle (5/10), McNeil High School (7/10)
- HOA: No
- Tax Rate: 1.5273 (2025)
- Year Built: 1973-1985
- Closed Sales (9/1/25-8/31/26): 21
- Median Sale Price: $475,900
- Average Sale Price: $489,300
- Price Range: $372,000 - $680,000
- Median Price Per Sq Ft: $249.43
- Average Home Size: 1,998 sq ft
- Typical Configuration: 3 bedrooms, 2 bathrooms
- Average Days on Market: 48
Forest North Estates has the lowest tax rate on this list at 1.5273, and its 48-day average days on market sits mid-pack for this group of neighborhoods. The tax advantage alone is worth factoring in before comparing this neighborhood on price alone.
On a $476,000 home, a 1.5273 tax rate means approximately $7,270 per year in property taxes. Compared to Goodnight Ranch at the same price, you would save almost $3,900 annually just in taxes. No HOA on top of that. For buyers who understand the full cost of ownership, Forest North Estates makes a strong case.
The homes were built primarily between 1973 and 1985, so buyers should budget for inspections and be clear-eyed about what they are taking on from a maintenance standpoint. What the housing stock offers in return is established lots, mature trees, and a neighborhood that feels genuinely settled rather than still under construction. At a 48-day average on market with only 21 sales over the past year, inventory is limited. When a home comes up here, buyers should stay pre-approved and ready to act.
Round Rock ISD serves the neighborhood with Forest North or Live Oak Elementary, Deerpark Middle School, and McNeil High School.
For more information and to search homes for sale, visit our Forest North Estates Neighborhood Guide.
Forest North Estates Neighborhood Map
Forest North Estates Homes for Sale
SEARCH ALL FOREST NORTH ESTATES HOMES FOR SALENo Email Required! Goodnight Ranch | Southeast Austin

- Zip Code: 78747
- Distance to Downtown: 11.1 miles
- Distance to Airport: 13.4 miles
- School District: Austin ISD
- Schools: Blazier Elementary (6/10), Paredes Middle (2/10), Akins High School (4/10)
- HOA: Yes, $120-$360/quarter depending on section (~$40-$120/month)
- Tax Rate: 2.3465 (2025)
- Year Built: 2016-2025
- Closed Sales (9/1/25-8/31/26): 40
- Median Sale Price: $393,846
- Average Sale Price: $420,273
- Price Range: $329,000 - $600,000
- Median Price Per Sq Ft: $189.90
- Average Home Size: 2,175 sq ft
- Typical Configuration: 3 bedrooms, 4 bathrooms
- Average Days on Market: 109
We want to lead with the number that matters most for Goodnight Ranch: the tax rate is 2.3465, which is the highest of any neighborhood on this list by a meaningful margin. On a $394,000 home, that is approximately $9,250 per year in property taxes, or $770 per month in taxes alone. The HOA adds another $40 to $120 per month depending on which section of the community you are in. Buyers who compare Goodnight Ranch's purchase price to other neighborhoods without running the full payment may underestimate the actual monthly cost.
With that said, Goodnight Ranch has clear strengths. At 11.1 miles from downtown and 13.4 miles from the airport, it offers one of the shorter commutes on this list in either direction. The community is still in active development with homes built from 2016 through the present, meaning new construction options exist alongside resales. At a median of $393,846 and an average size of 2,175 square feet, the price per square foot is among the lowest on the list.
The wide gap between the median ($393,846) and average ($420,273) sale price reflects a range of home sizes and price points within the community. Buyers at the lower end of the budget will find entry-level options; larger and more upgraded homes push into the upper range. Austin ISD serves Goodnight Ranch with Blazier Elementary, Paredes Middle School, and Akins High School.
For more information and to search homes for sale, visit our Goodnight Ranch Neighborhood Guide.
Goodnight Ranch Neighborhood Map
Goodnight Ranch Homes for Sale
SEARCH ALL GOODNIGHT RANCH HOMES FOR SALENo Email Required! Hunters Chase | Northwest Austin
- Zip Code: 78729
- Distance to Downtown: 13.9 miles
- Distance to Airport: 21.9 miles
- School District: Round Rock ISD
- Schools: Live Oak Elementary (8/10), Deerpark Middle (5/10), McNeil High School (7/10)
- HOA: Yes, approximately $100/quarter (~$33/month)
- Tax Rate: 1.9513 (2025)
- Year Built: 1983-2001
- Closed Sales (9/1/25-8/31/26): 29
- Median Sale Price: $475,000
- Average Sale Price: $502,231
- Price Range: $390,000 - $760,000
- Median Price Per Sq Ft: $206.55
- Average Home Size: 2,297 sq ft
- Typical Configuration: 4 bedrooms, 3 bathrooms
- Average Days on Market: 43
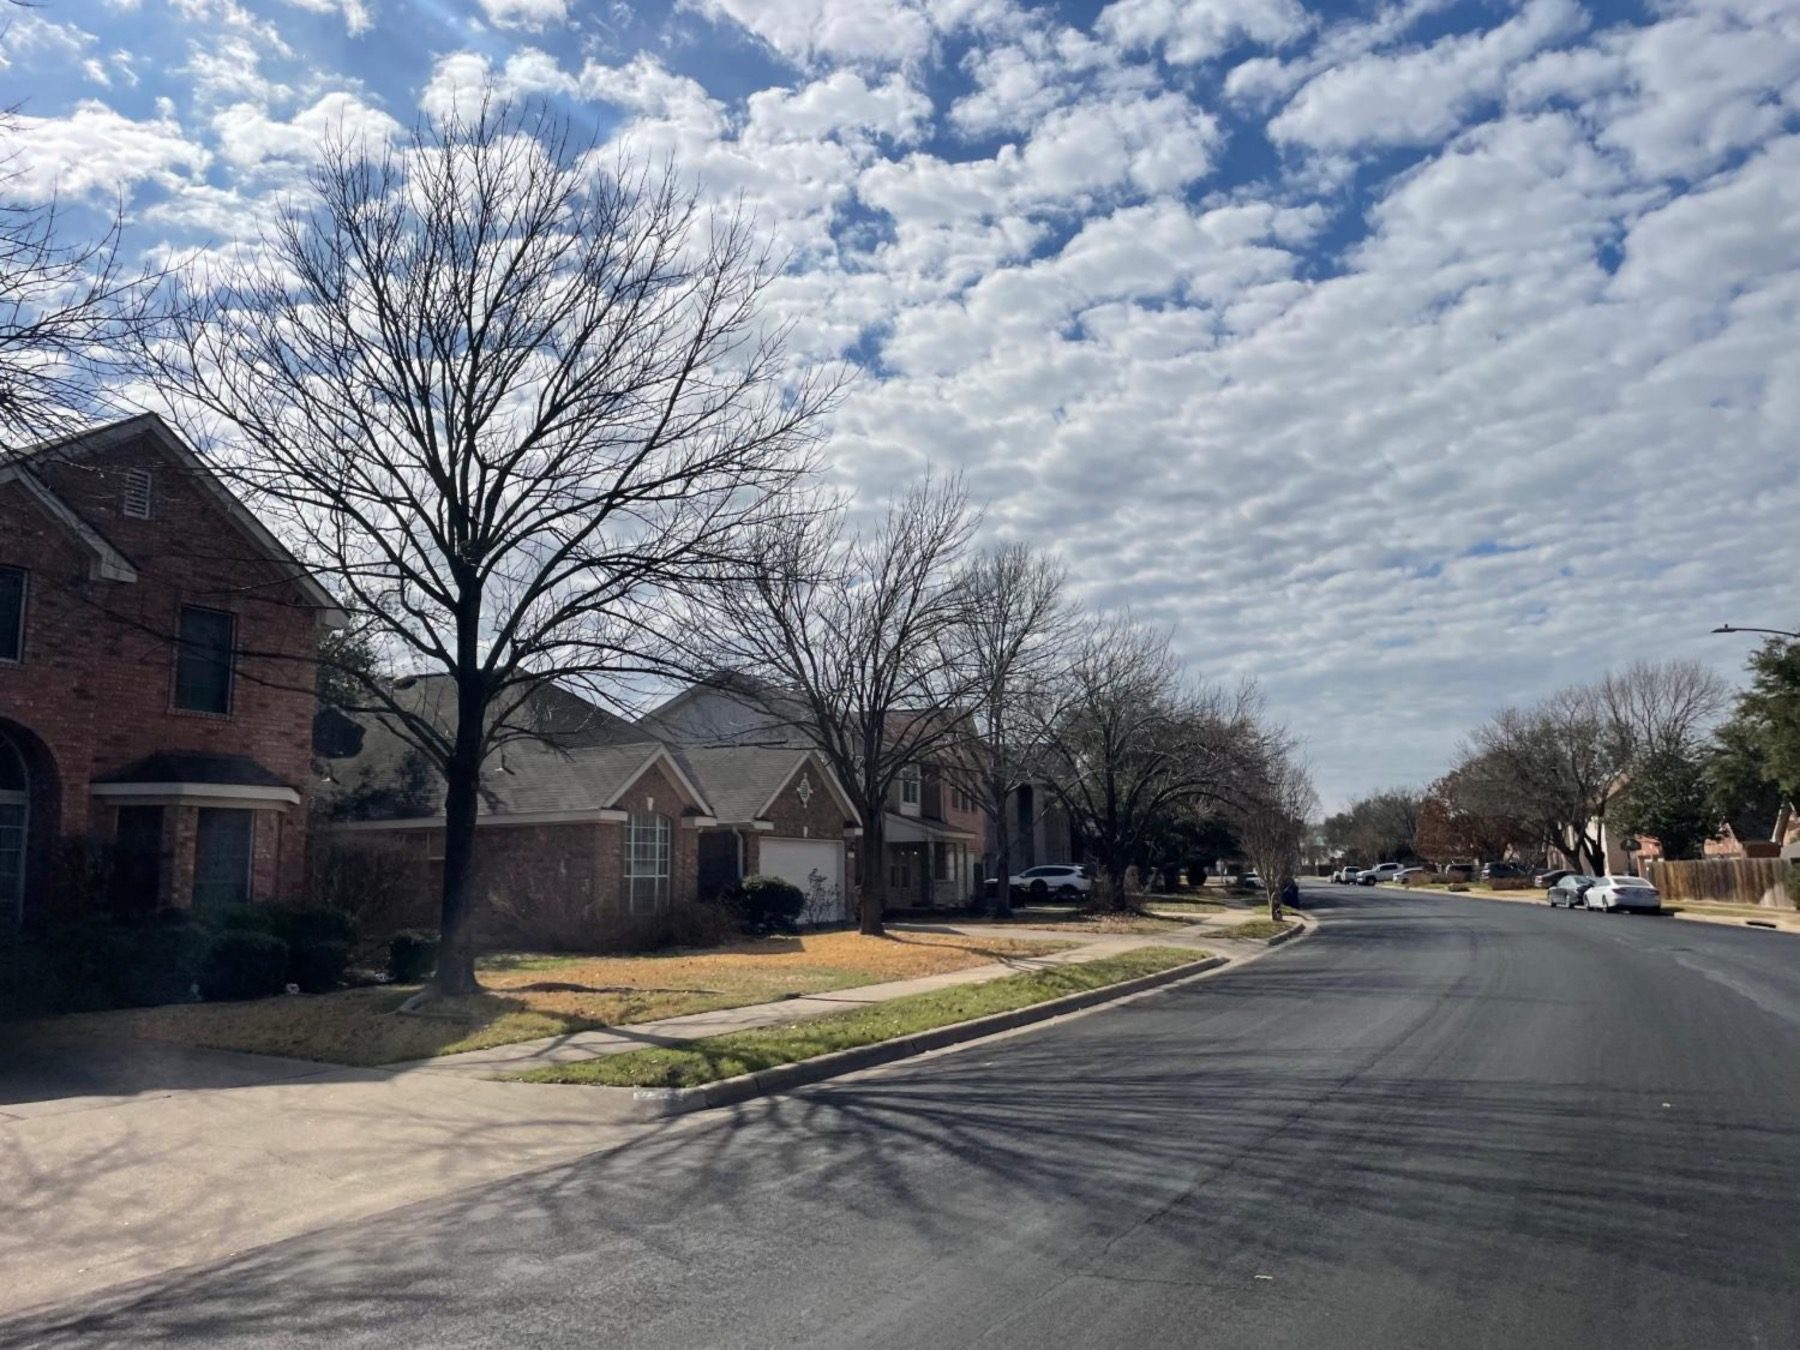
Hunters Chase sits near the top of the price range on this list with a median of $475,000, and it justifies that premium with the largest average home size here at 2,297 square feet, a reasonable tax rate at 1.9513, and a 43-day average days on market, the fastest pace of any neighborhood on this list.
The fact that the average sale price of $502,231 runs above the median of $475,000 tells you the distribution skews toward higher prices, meaning more homes in this community are selling above the midpoint than below it. Buyers with a firm $500,000 ceiling will want to focus their search carefully, as a portion of the available inventory will push beyond that.
The housing stock runs from 1983 to 2001, covering roughly two decades of construction. Homes in this range vary considerably in layout and condition. Larger, more updated homes at the top of the price range sit alongside original-condition homes that offer more room to negotiate. Round Rock ISD serves Hunters Chase with Live Oak Elementary, Deerpark Middle School, and McNeil High School.
For more information and to search homes for sale, visit our Hunters Chase Neighborhood Guide.
Hunters Chase Neighborhood Map
Hunters Chase Homes for Sale
SEARCH ALL HUNTERS CHASE HOMES FOR SALENo Email Required! Milwood | Northwest Austin

- Zip Code: 78727, 78729
- Distance to Downtown: 15.1 miles
- Distance to Airport: 23 miles
- School District: Round Rock ISD
- Schools: Jollyville (8/10), Live Oak (8/10), or Pond Springs Elementary (8/10); Canyon Vista (10/10) or Deerpark Middle (5/10); McNeil (7/10) or Westwood High School (9/10)
- HOA: Yes and No (section dependent; ranges from no HOA to approximately $54/quarter)
- Tax Rate: 2.0465 (2025)
- Year Built: 1978-1999
- Closed Sales (9/1/25-8/31/26): 160
- Median Sale Price: $466,500
- Average Sale Price: $474,453
- Price Range: $205,000 - $879,300
- Median Price Per Sq Ft: $263.87
- Average Home Size: 1,851 sq ft
- Typical Configuration: 3 bedrooms, 2 bathrooms
- Average Days on Market: 46
Milwood has the highest transaction volume on this list by a wide margin, with 160 closed sales over the past year. That kind of activity gives you a much more reliable read on market conditions than a neighborhood with 15 or 21 sales. At a median of $466,500 and a 46-day average on market, Milwood moves at a steady pace without the urgency of the fastest neighborhoods on the list.
The price range is wide, from $205,000 to $879,300, which reflects the diversity of housing across a large neighborhood built over more than two decades. Buyers should not read either the floor or the ceiling as typical. The median and the 46-day DOM give a more accurate picture of what the middle of the market looks like here.
HOA status varies by section within Milwood. Some sections have no HOA, some pay as little as $25 per year, and the Bluffs at Milwood and Gardens at Milwood sections carry separate HOA structures. Confirm which section a specific home sits in before drawing conclusions about HOA obligations.
Round Rock ISD serves Milwood, with multiple elementary and middle school options depending on your address. High school zoning splits between McNeil and Westwood. Verify your specific zoning with Round Rock ISD for any home you are seriously considering.
For more information and to search homes for sale, visit our Milwood Neighborhood Guide.
Milwood Neighborhood Map
Milwood Homes for Sale
SEARCH ALL MILWOOD HOMES FOR SALENo Email Required! Parkwood | Southwest Austin
- Zip Code: 78748
- Distance to Downtown: 7.9 miles
- Distance to Airport: 12.6 miles
- School District: Austin ISD
- Schools: Casey Elementary (7/10), Paredes Middle (2/10), Akins High School (4/10)
- HOA: No
- Tax Rate: 2.0465 (2025)
- Year Built: 1994-1996
- Closed Sales (9/1/25-8/31/26): 15
- Median Sale Price: $380,000
- Average Sale Price: $409,567
- Price Range: $312,000 - $525,000
- Median Price Per Sq Ft: $240.79
- Average Home Size: 1,644 sq ft
- Typical Configuration: 3 bedrooms, 2 bathrooms
- Average Days on Market: 53
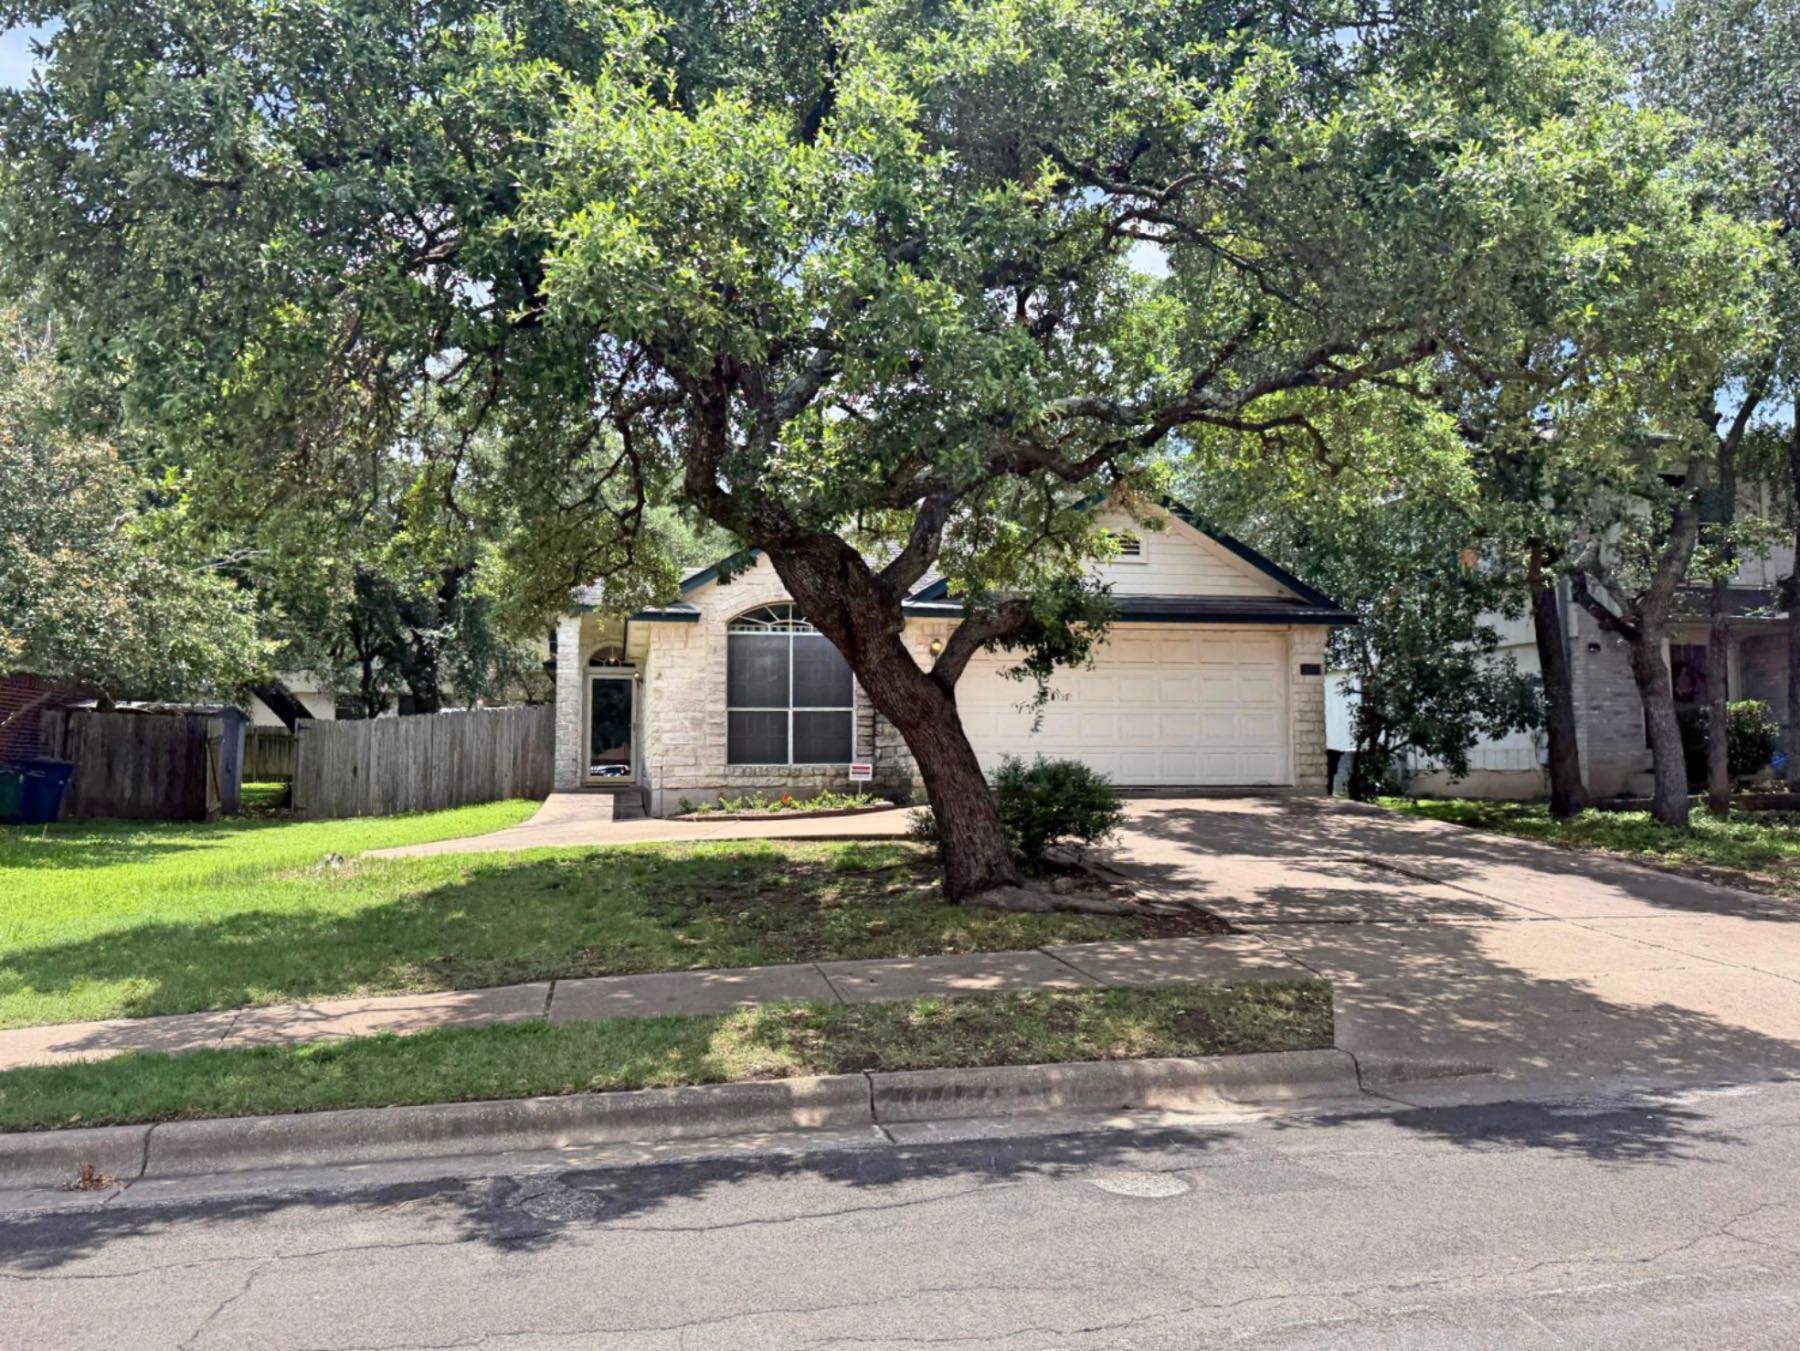
Parkwood offers the shortest commute to downtown on this list at just 7.9 miles, which is a genuine differentiator for buyers who prioritize proximity to Central Austin. At a median of $380,000 with no HOA and a 53-day average on market, it sits in a comfortable range for buyers who want Southwest Austin location without the complexity of a multi-section community.
With only 15 closed sales over the past year, Parkwood is a small neighborhood and the data set is thin compared to higher-volume communities like Milwood. That means individual sales can move the average meaningfully, and the statistics here should be read as directional rather than as precise benchmarks. The price per square foot at $240.79 sits above Estancia's but below Tanglewood Forest's, the other two Southwest Austin neighborhoods on this list, still reflecting a location premium for being closer to downtown.
Homes built between 1994 and 1996 represent a fairly narrow window of construction, which means the housing stock is relatively consistent in age and style. Austin ISD serves Parkwood with Casey Elementary, Paredes Middle School, and Akins High School.
For more information and to search homes for sale, visit our Parkwood Neighborhood Guide.
Parkwood Neighborhood Map
Parkwood Homes for Sale
SEARCH ALL PARKWOOD HOMES FOR SALENo Email Required! Tanglewood Forest | Southwest Austin
- Zip Code: 78748
- Distance to Downtown: 13.3 miles
- Distance to Airport: 14.2 miles
- School District: Austin ISD
- Schools: Cowan (8/10) or Kocurek Elementary (5/10), Bailey Middle (6/10), Akins High School (4/10)
- HOA: No
- Tax Rate: 2.2845 (2025)
- Year Built: 1982-1994
- Closed Sales (9/1/25-8/31/26): 24
- Median Sale Price: $417,500
- Average Sale Price: $426,075
- Price Range: $242,000 - $625,000
- Median Price Per Sq Ft: $288.05
- Average Home Size: 1,464 sq ft
- Typical Configuration: 3 bedrooms, 2 bathrooms
- Average Days on Market: 49
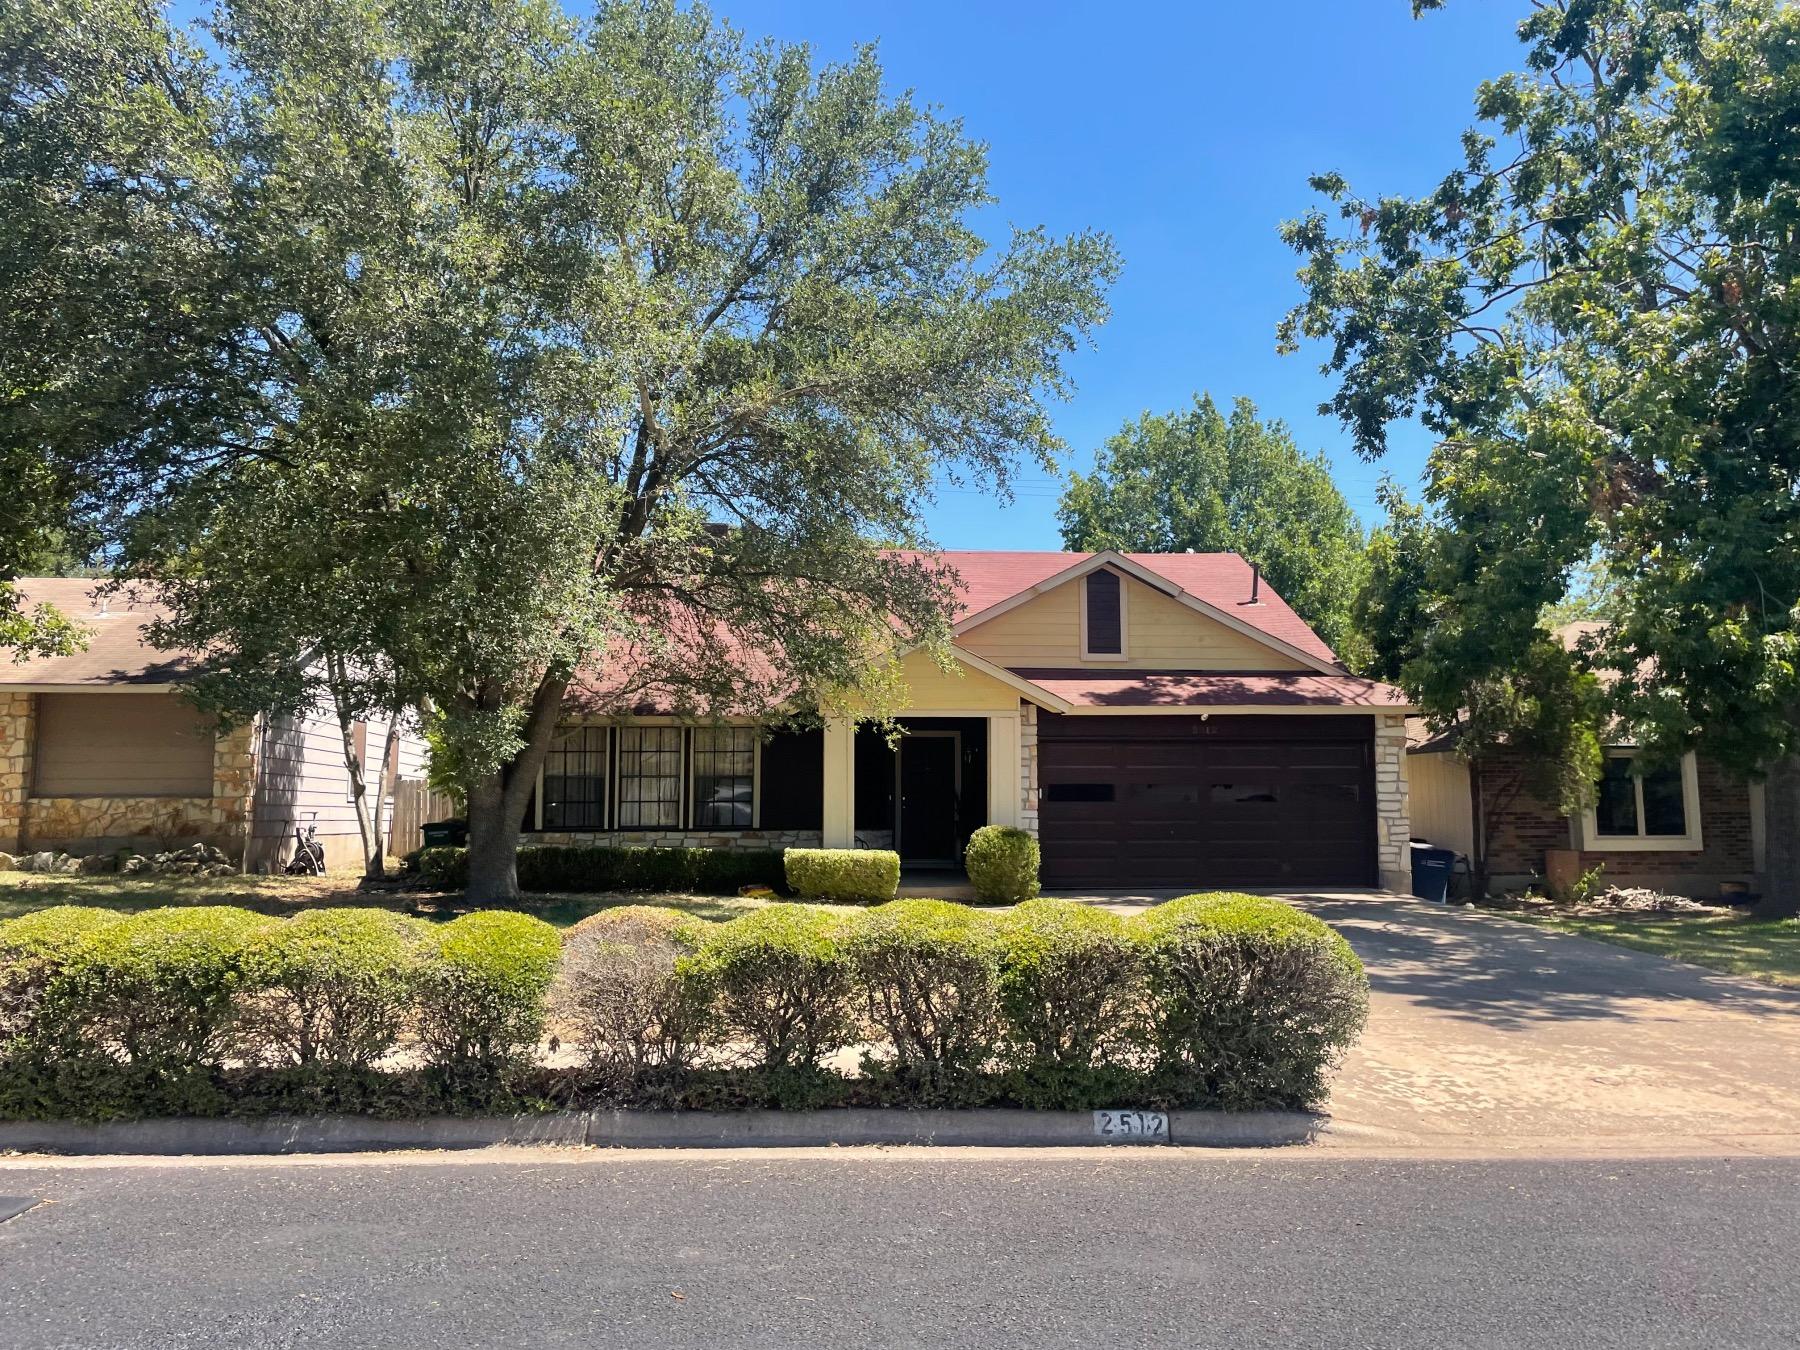
Tanglewood Forest combines a 49-day average days on market with no HOA and an established housing stock built between 1982 and 1994. Buyers who want Southwest Austin, prefer not to pay HOA dues, and need a home in the $420,000 range will find Tanglewood Forest consistently appears in their search results.
The price per square foot at $288.05 is the second highest on this list, just behind Walnut Crossing, which reflects both the Southwest Austin location premium and the demand for homes in this corridor. The wide price range from $242,000 to $625,000 signals significant variation in condition and updates across the neighborhood. Homes at the lower end of that range are almost certainly in original or lightly updated condition. Homes at the upper end have been substantially renovated or represent larger lots and floor plans.
The tax rate at 2.2845 is the second highest on this list. On a $440,000 home, that is approximately $10,050 per year. Worth knowing before comparing the purchase price to lower-rate Northwest Austin options.
Austin ISD serves Tanglewood Forest with either Cowan or Kocurek Elementary depending on your specific address, Bailey Middle School, and Akins High School. Verify your exact school zoning with Austin ISD before finalizing any decision based on school assignment.
For more information and to search homes for sale, visit our Tanglewood Forest Neighborhood Guide.
Tanglewood Forest Neighborhood Map
Tanglewood Forest Homes for Sale
SEARCH ALL TANGLEWOOD FOREST HOMES FOR SALENo Email Required! Walnut Crossing | Northwest Austin
- Zip Code: 78759
- Distance to Downtown: 12.2 miles
- Distance to Airport: 20.1 miles
- School District: Austin ISD
- Schools: Summit Elementary (9/10), Murchison Middle (8/10), Anderson High School (8/10)
- HOA: No
- Tax Rate: 2.0465 (2025)
- Year Built: 1978-1981
- Closed Sales (9/1/25-8/31/26): 23
- Median Sale Price: $455,000
- Average Sale Price: $462,609
- Price Range: $347,000 - $570,000
- Median Price Per Sq Ft: $312.50
- Average Home Size: 1,538 sq ft
- Typical Configuration: 3 bedrooms, 2 bathrooms
- Average Days on Market: 58
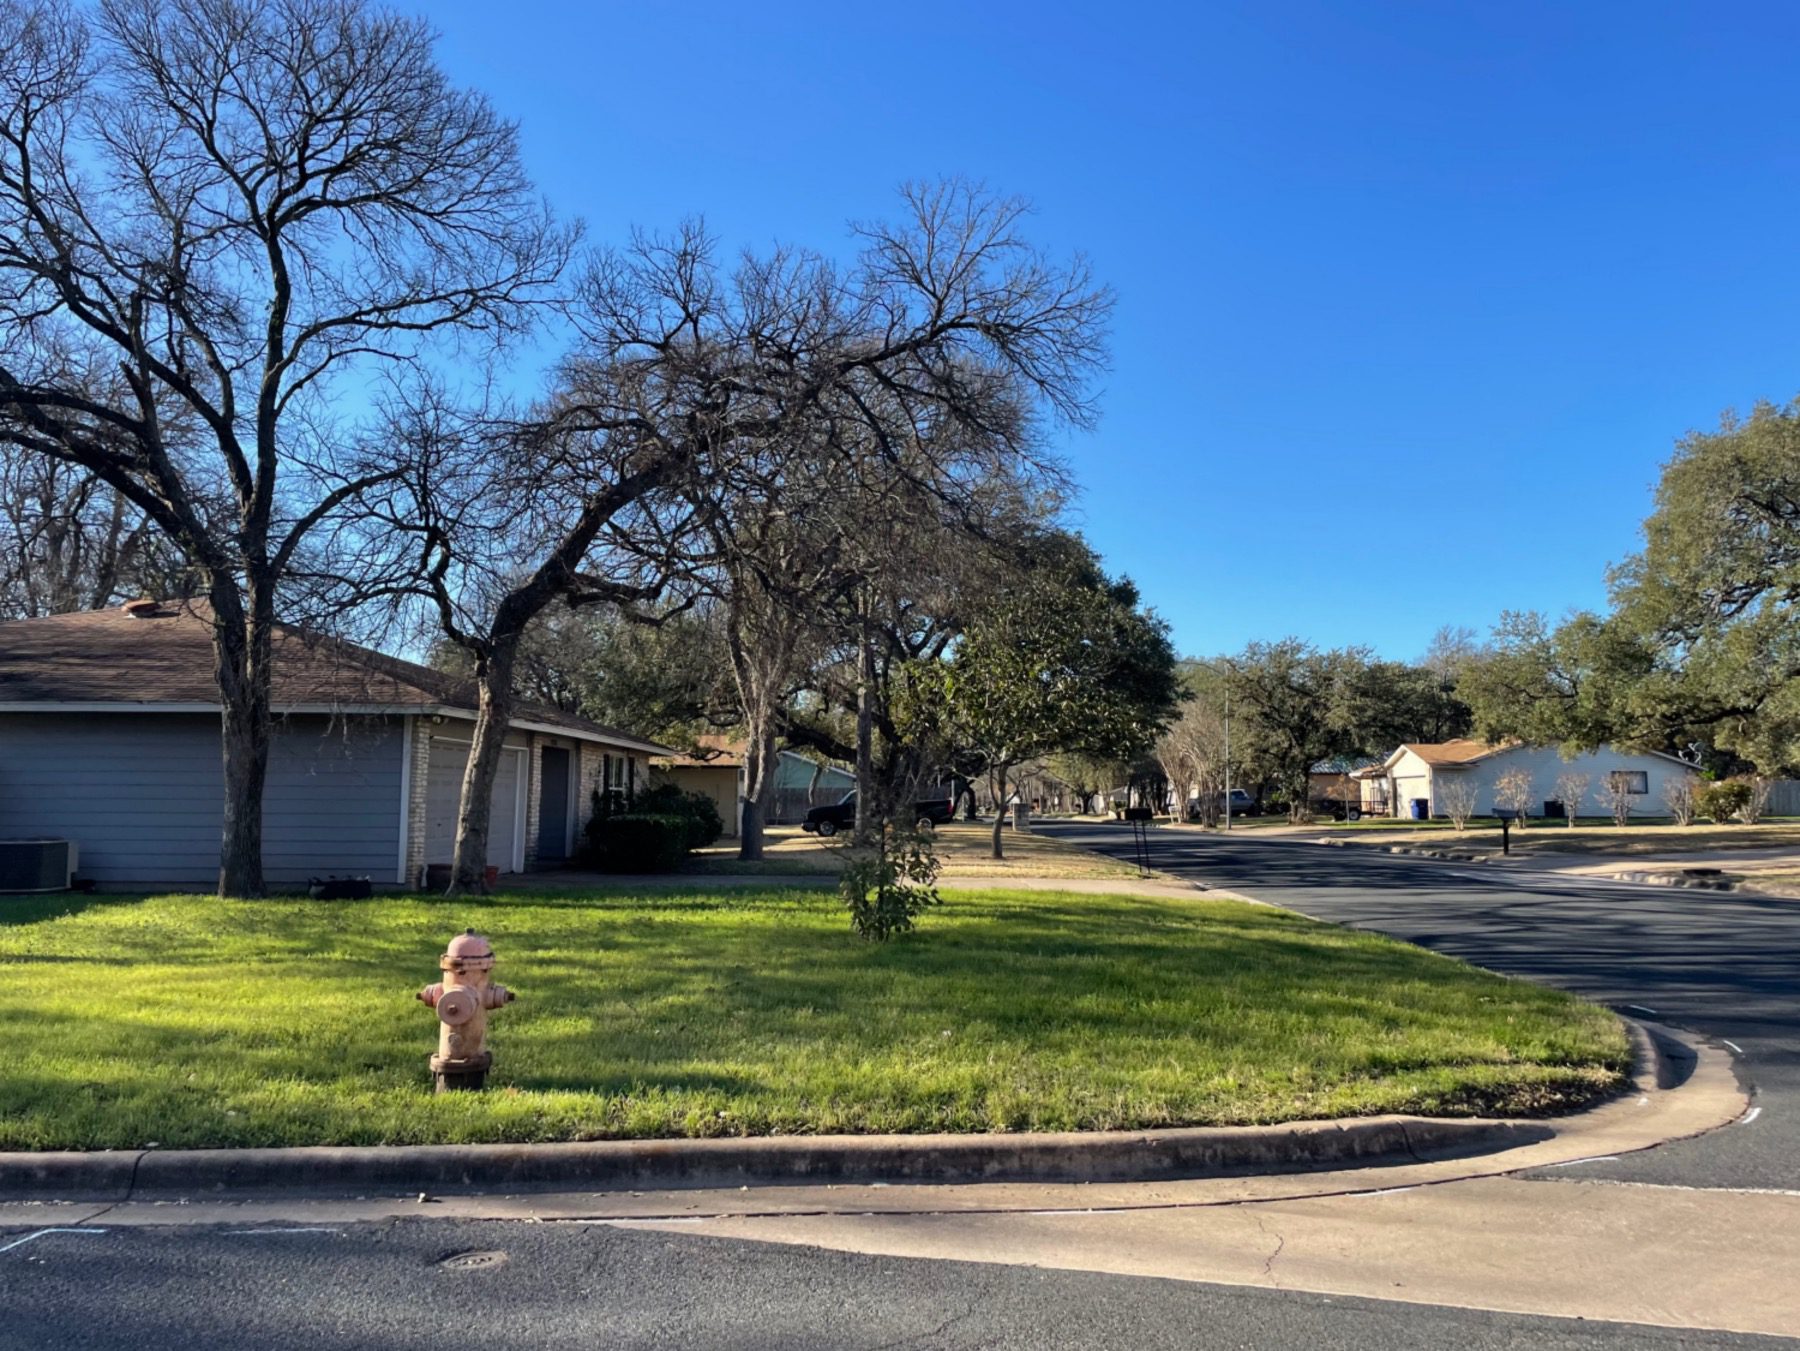
Walnut Crossing sits at the top end of this price list at a $455,000 median, and it carries the highest price per square foot on the list at $312.50. What it offers in return is Northwest Austin location with Austin ISD schools, which is a combination that does not come up often and drives consistent interest.
The school zoning here differs from the rest of the Northwest Austin neighborhoods on this list, which are primarily served by Round Rock ISD. Walnut Crossing feeds into Austin ISD with Summit Elementary, Murchison Middle School, and Anderson High School, making it one of the only Northwest Austin options in this price range with Austin ISD zoning.
At only 23 closed sales over the past year and a price range from $347,000 to $570,000, the market here is thin and the statistics should be treated as directional. The homes were built from 1978 to 1981, making them among the oldest on this list, and buyers should plan for a thorough inspection and a realistic view of what older construction requires in ongoing maintenance. No HOA.
For more information and to search homes for sale, visit our Walnut Crossing Neighborhood Guide.
Walnut Crossing Neighborhood Map
Walnut Crossing Homes for Sale
SEARCH ALL WALNUT CROSSING HOMES FOR SALENo Email Required! Wells Branch | Northwest Austin

- Zip Code: 78728
- Distance to Downtown: 15.4 miles
- Distance to Airport: 21.4 miles
- School District: Round Rock ISD or Pflugerville ISD (varies by address)
- Elementary School: Joe Lee Johnson (3/10) or Wells Branch Elementary (6/10) (RRISD); Northwest Elementary (2/10) (PISD)
- Middle School: Deerpark (5/10) (RRISD); Westview (2/10) (PISD)
- High School: McNeil (7/10) (RRISD); Connally (2/10) (PISD)
- HOA: Yes and No (section dependent; ranges from no HOA to approximately $60/quarter)
- Tax Rate: 1.8526 (2025)
- Year Built: 1982-2018
- Closed Sales (9/1/25-8/31/26): 55
- Median Sale Price: $399,000
- Average Sale Price: $397,738
- Price Range: $220,760 - $550,000
- Median Price Per Sq Ft: $232.17
- Average Home Size: 1,730 sq ft
- Typical Configuration: 3 bedrooms, 2 bathrooms
- Average Days on Market: 53
Wells Branch stands out on this list for two reasons: the tax rate at 1.8526 is among the lower options outside of Forest North Estates, and the neighborhood spans a 36-year window of construction from 1982 to 2018, giving buyers more variety in housing style and condition than most communities at this price point.
One thing buyers must verify before going under contract in Wells Branch: school district zoning is not uniform across the neighborhood. Some sections fall in Round Rock ISD and others in Pflugerville ISD, and the schools are different in each district. This is not a minor detail. Confirm which district and which specific schools serve the exact address you are considering before making any school-based decisions.
HOA status also varies by section, from no HOA in some parts to approximately $60 per quarter in others. The wide price range from $220,760 to $550,000 reflects the breadth of housing across a large neighborhood. At 55 closed sales and a 53-day average on market, there is enough transaction volume to trust the statistics and enough activity to suggest consistent buyer interest throughout the year.
For more info and to search homes for sale, visit our Wells Branch Neighborhood Guide.
Wells Branch Neighborhood Map
Wells Branch Homes for Sale
SEARCH ALL WELLS BRANCH HOMES FOR SALENo Email Required! Where These Neighborhoods Are Located
The map below shows where each of these eleven neighborhoods sits within Austin. Use it to get a sense of location relative to downtown, the airport, and each other before you start touring.
Northwest Austin or South Austin: How to Choose Your Quadrant
Before diving into the individual neighborhoods, it helps to understand that this list splits fairly evenly between two distinct parts of the city. The neighborhood you choose will depend heavily on where you work, which school district matters most to you, and what kind of housing stock you prefer.
Northwest Austin covers Anderson Mill, Forest North Estates, Hunters Chase, Milwood, Walnut Crossing, and Wells Branch. These neighborhoods are served primarily by Round Rock ISD, which is one of the draws for buyers who prioritize schools without wanting to pay Austin ISD tax rates. Round Rock ISD tax rates on this list run from 1.5273 to 2.0856, generally lower than the Austin ISD neighborhoods. The housing stock in Northwest Austin is mostly established, built between the mid-1970s and the late 1990s, with mature trees, larger lots, and a range of original and updated finishes. Buyers who work in the Domain, the Apple campus corridor, or along 183 will find commutes from Northwest Austin very manageable.
Southwest and Southeast Austin covers Cascades at Onion Creek, Estancia, Goodnight Ranch, Parkwood, and Tanglewood Forest. These neighborhoods are served primarily by Austin ISD with the exception of Estancia, which feeds into Austin ISD as well. The housing stock here is more varied: Cascades at Onion Creek and Goodnight Ranch are newer communities with homes built in the 2010s and 2020s, while Parkwood and Tanglewood Forest are established 1980s and 1990s neighborhoods. Tax rates in this group run higher on average, with Goodnight Ranch at 2.3465 being the highest on the entire list. Buyers who work downtown, on South Congress, or near the airport will find South Austin commutes more convenient.
Neither quadrant is better than the other. They serve different priorities, and knowing which fits yours before you start touring will save time.
Tips for Buying Under $500k in Austin
Buying in this price range inside Austin and the immediate surrounding areas requires preparation and a clear sense of priorities. Here is what we tell our clients before they start searching.
Understand the real cost of ownership before you set your price target. Tax rate variation on this list is significant. The spread between Forest North Estates at 1.5273 and Goodnight Ranch at 2.3465 on a $450,000 home is approximately $3,690 per year. Add HOA where applicable, insurance, and maintenance reserves, and two homes at the same purchase price can have very different monthly costs. Build a full payment estimate for every neighborhood before you decide where to focus.
Match your strategy to the neighborhood's pace. Forest North Estates at 13 days and Hunters Chase and Tanglewood Forest at 22 days require a fundamentally different approach than Estancia at 100 days or Cascades at Onion Creek at 66 days. In fast-moving neighborhoods, hesitation is the same as stepping aside. In new construction communities, you have time to think through your options carefully. Know which environment you are in before you start touring.
Get fully pre-approved before you tour. A pre-approval letter is table stakes in any Austin market regardless of price point. Sellers in neighborhoods like Forest North Estates will not wait for you to catch up on financing. Have your documentation submitted, reviewed, and a letter in hand before you see your first home.
In new construction neighborhoods, use a buyer's agent. Cascades at Onion Creek, Goodnight Ranch, and Estancia all have active builder sales offices. The builder's agent works for the builder. Builder-covered buyer's agent commission is negotiated case by case now, not automatic. Your representation agreement spells out exactly how your agent is compensated, and the difference in contract terms, lot selection, and upgrade negotiation can still be meaningful.
Verify school zoning by specific address. Multiple neighborhoods on this list have split school district zoning, including Wells Branch, Anderson Mill, and Milwood. Do not rely on general neighborhood descriptions for school information. Look up the specific address on the relevant school district's website. Zoning can change at the street level, and the wrong assumption here is a significant problem to discover after you are under contract.
In older neighborhoods, budget for the inspection and what comes after. Forest North Estates, Walnut Crossing, Anderson Mill, and Tanglewood Forest all have homes that are 30 to 50 years old. Roofs, HVAC systems, plumbing, and electrical panels all have service lives. A thorough inspection is not optional. More importantly, have a realistic sense of what a post-inspection repair ask looks like and what you are willing to take on, because original-condition homes in these neighborhoods will have items that need attention.

Frequently Asked Questions
Based on closed sales data from the past twelve months, eleven neighborhoods within or near Austin city limits had median sale prices at or below $500,000: Anderson Mill, Cascades at Onion Creek, Estancia, Forest North Estates, Goodnight Ranch, Hunters Chase, Milwood, Parkwood, Tanglewood Forest, Walnut Crossing, and Wells Branch. Several of those neighborhoods are in Southeast or Southwest Austin, and several are in Northwest Austin. If your budget is closer to $400,000, we have a separate post covering neighborhoods in that range.
It depends on the neighborhood and the part of the city. In Northwest Austin established neighborhoods, $500,000 typically buys a three-bedroom home in the 1,600 to 1,900 square foot range on a lot with mature trees, often with original or selectively updated finishes. In South and Southeast Austin newer construction communities, $500,000 can buy a four-bedroom home over 2,000 square feet with modern finishes. The key variables beyond price are tax rate, HOA, school district, and commute, all of which vary significantly across this list.
School quality is subjective and individual school performance changes year to year. We recommend researching current ratings directly on the Texas Education Agency website and the relevant district sites rather than relying on any static list. Round Rock ISD, which serves Anderson Mill, Forest North Estates, Hunters Chase, Milwood, and portions of Wells Branch, is broadly considered one of the stronger districts in the Austin metro area. Austin ISD serves the South and Southeast Austin neighborhoods on this list.
It varies considerably by neighborhood. Forest North Estates averaged just 13 days on market over the past year, meaning buyers need to be pre-approved and ready to write an offer quickly. Hunters Chase and Tanglewood Forest averaged 22 days. Anderson Mill, Milwood, and Wells Branch averaged 28 to 38 days. Estancia and Cascades at Onion Creek averaged 66 to 100 days, reflecting new construction builder timelines rather than slow resale demand.
There is no universal right answer. If you work in the Domain, along the 183 corridor, or at the Apple campus, Northwest Austin will likely offer a more manageable commute. If you work downtown, near the airport, or on the South Congress corridor, South or Southeast Austin is probably more convenient. Beyond commute, the major decision factors are school district, tax rate, and housing type. Northwest Austin generally offers lower tax rates and established older homes. South Austin offers newer construction, some lower-tax options like Estancia, and in some neighborhoods a shorter drive to downtown.
Significantly more. Across 47 Austin-metro neighborhoods with a median sale price near $500,000, home size ranges from 1,507 to 3,114 square feet at the same price, a difference of more than two to one. Neighborhoods farther from the city center, in places like Pflugerville and Round Rock, generally offer the most square footage for the money; neighborhoods closer in, like East Austin, offer less space at a higher price per square foot.
Mountain Creek in Pflugerville has the largest median home size in this price band at 3,114 square feet, followed by Paloma Lake in Round Rock and Ranch at Cypress Creek in Cedar Park. All three are newer-construction communities on the edges of the metro.
In this price band, how fast a home sells tracks more closely with whether a builder is still actively selling new construction nearby than with the home's price or location. Neighborhoods with an active builder often see the slowest sales, since new inventory keeps arriving; neighborhoods that are fully built out tend to sell faster.
Ready to Start Your Search?
If you want help narrowing down which of these neighborhoods fits your priorities, or if you want to see current active listings in any of them, reach out to us. We know these neighborhoods well and can help you move quickly when the right home comes up.
Call or text us at (512) 827-8323 or email info@11OaksRealty.com. Eleven Oaks Realty has been helping buyers and sellers since 1978 and are glad to put that experience to work for you.




Leave a Reply