
Over the past 12 months, the typical Georgetown home spent about 46 days on the market and closed at about 98% of its list price. Those numbers come from 2,760 closed single-family sales, and they hide a wide gap between neighborhoods.
Among Georgetown resale neighborhoods with at least 15 sales, the median home sold in as few as 13 days in one neighborhood and took as long as 89 days in another. Builder-driven communities ran on a very different clock, at about 106 days. Where you buy or sell inside Georgetown matters more than the citywide average, so we broke the data down neighborhood by neighborhood.
How We Split Georgetown
We sorted Georgetown into three groups, because they do not compete the same way. Builder-driven communities set their own prices and timelines, and Sun City is age-restricted, so not every buyer can purchase there. Mixing all three into one ranking would make the resale neighborhoods look slower or faster than they are.
| Group | Sales | Share of Georgetown sales | Typical days on market |
|---|---|---|---|
| Resale neighborhoods (108 neighborhoods) | 1,235 | 45% | 43 |
| Builder-driven communities (11 communities) | 945 | 34% | 106 |
| Sun City (age-restricted) | 580 | 21% | 45 |
The builder-driven communities are Parkside on the River, Wolf Ranch, Nolina, Parmer Ranch, Woodfield Preserve, Berry Creek Highlands, Patterson Ranch, Highland Village, Parkside Peninsula, Retreat at San Gabriel and Heights at San Gabriel. Every other neighborhood in this post is at or near build-out, so its sales are mostly resales.
Georgetown Neighborhoods Where Homes Sell Fastest
Thirteen resale neighborhoods had a median of 40 days or fewer on the market. Most of them are mid-priced, and most closed at 97% to 100% of list.
| Neighborhood | Sales | Median days on market | Median sale-to-list | Median sale price |
|---|---|---|---|---|
| Oakcrest Estates | 15 | 13 | 99% | $495,000 |
| Georgetown Village | 45 | 20 | 99% | $420,000 |
| Serenada | 33 | 20 | 97% | $500,000 |
| Pinnacle | 15 | 23 | 100% | $300,000 |
| River Ridge | 19 | 23 | 100% | $505,000 |
| San Gabriel Heights | 20 | 25 | 97% | $367,000 |
| Berry Creek | 60 | 26 | 98% | $580,000 |
| Parkside at Mayfield Ranch | 43 | 30 | 98% | $580,000 |
| Lively Ranch | 82 | 31 | 99% | $385,000 |
| Water Oak | 22 | 32 | 99.5% | $517,000 |
| Cimarron Hills | 35 | 36 | 97% | $1,200,000 |
| River Bend | 16 | 37 | 98% | $412,000 |
| La Conterra | 28 | 38 | 99% | $401,000 |
Lively Ranch and Georgetown Village are the most dependable names here. Lively Ranch had 82 sales and a median of 31 days, and Georgetown Village had 45 sales and a median of 20 days. Oakcrest Estates is the fastest at 13 days, but it rests on only 15 sales, so treat it as a signal rather than a promise.
Cimarron Hills is the one to notice at the top of the market. The median home sold for about $1.2 million in 36 days, at 97% of list.
Lively Ranch sold 82 homes in a median of 31 days, and Georgetown Village sold 45 in 20.
Georgetown Neighborhoods Where Homes Take Longer
At the other end, 11 resale neighborhoods had a median above 40 days. The eight slowest are below, and none went past 89 days. Even the slowest resale neighborhood sold faster than the typical builder-driven community, which took about 106 days.
| Neighborhood | Sales | Median days on market | Median sale-to-list | Median sale price |
|---|---|---|---|---|
| Crescent Bluff | 22 | 89 | 99% | $471,000 |
| Morningstar | 74 | 81 | 99% | $355,000 |
| Broken Oak | 39 | 72 | 100% | $595,000 |
| Oaks at San Gabriel | 46 | 68 | 98% | $482,000 |
| Downtown | 55 | 63 | 97% | $475,000 |
| Carlson Place | 16 | 59 | 99% | $325,000 |
| Riverview | 32 | 58 | 99% | $420,000 |
| Rancho Sienna | 59 | 54 | 98.4% | $450,000 |
Sale-to-list stayed between 97% and 100% in all eight, so a longer wait did not come with a deep discount. Downtown is the one to notice. It had 55 sales, a median of 63 days, a sale-to-list ratio of 97% and about $290 per square foot, the second highest among resale neighborhoods with 15 or more sales, behind Cimarron Hills.
Morningstar is the largest of the slower neighborhoods, with 74 sales, a median of 81 days and a median price of about $355,000. Its median home closed at 99% of list and 93.5% of the original list price.
Builder-Driven Communities Run on a Different Clock
These 11 communities account for 945 sales, or 34% of Georgetown’s total, and their typical home took about 106 days to sell. They are listed separately because builders set their own prices and change them on their own schedule, not for one buyer at a time.
| Community | Sales | Median days on market | Median sale-to-list | Median sale-to-original-list | Median sale price |
|---|---|---|---|---|---|
| Woodfield Preserve | 84 | 45 | 100% | 94% | $334,000 |
| Berry Creek Highlands | 50 | 46 | 100% | 95% | $415,000 |
| Patterson Ranch | 55 | 81 | 98% | 93% | $415,000 |
| Highland Village | 78 | 96 | 100% | 93% | $435,000 |
| Nolina | 101 | 103 | 100% | 92% | $483,000 |
| Wolf Ranch | 226 | 106 | 98% | 91% | $610,000 |
| Parkside on the River | 201 | 109 | 97.6% | 88% | $625,000 |
| Retreat at San Gabriel | 23 | 109 | 99% | 86% | $540,000 |
| Parmer Ranch | 75 | 118 | 100% | 90% | $519,000 |
| Parkside Peninsula | 24 | 120 | 98.5% | 84% | $560,000 |
| Heights at San Gabriel | 28 | 169 | 94.5% | 88% | $400,000 |
Sale-to-list tells you little here, since ten of the eleven sit at 97.6% to 100%. The better signals are days on market and the gap to the original list price. Woodfield Preserve and Berry Creek Highlands moved in about 45 days, in line with Georgetown’s resale neighborhoods. The other nine took 81 to 169 days, and their median homes closed at 84% to 93% of the original list price.
The typical Georgetown resale neighborhood sold in 43 days. The typical builder-driven community took 106.
Heights at San Gabriel is the extreme case, with a median of 169 days and the lowest sale-to-list ratio of the 11 at 94.5%. If you are selling a resale home near one of these communities, builder inventory is part of your competition.
Sun City: Georgetown’s Largest Community Is Age-Restricted
Sun City had 580 closed sales, more than any other Georgetown community. Its median home sold in about 45 days at 98% of list and 96% of the original list price, for a median of about $380,000.
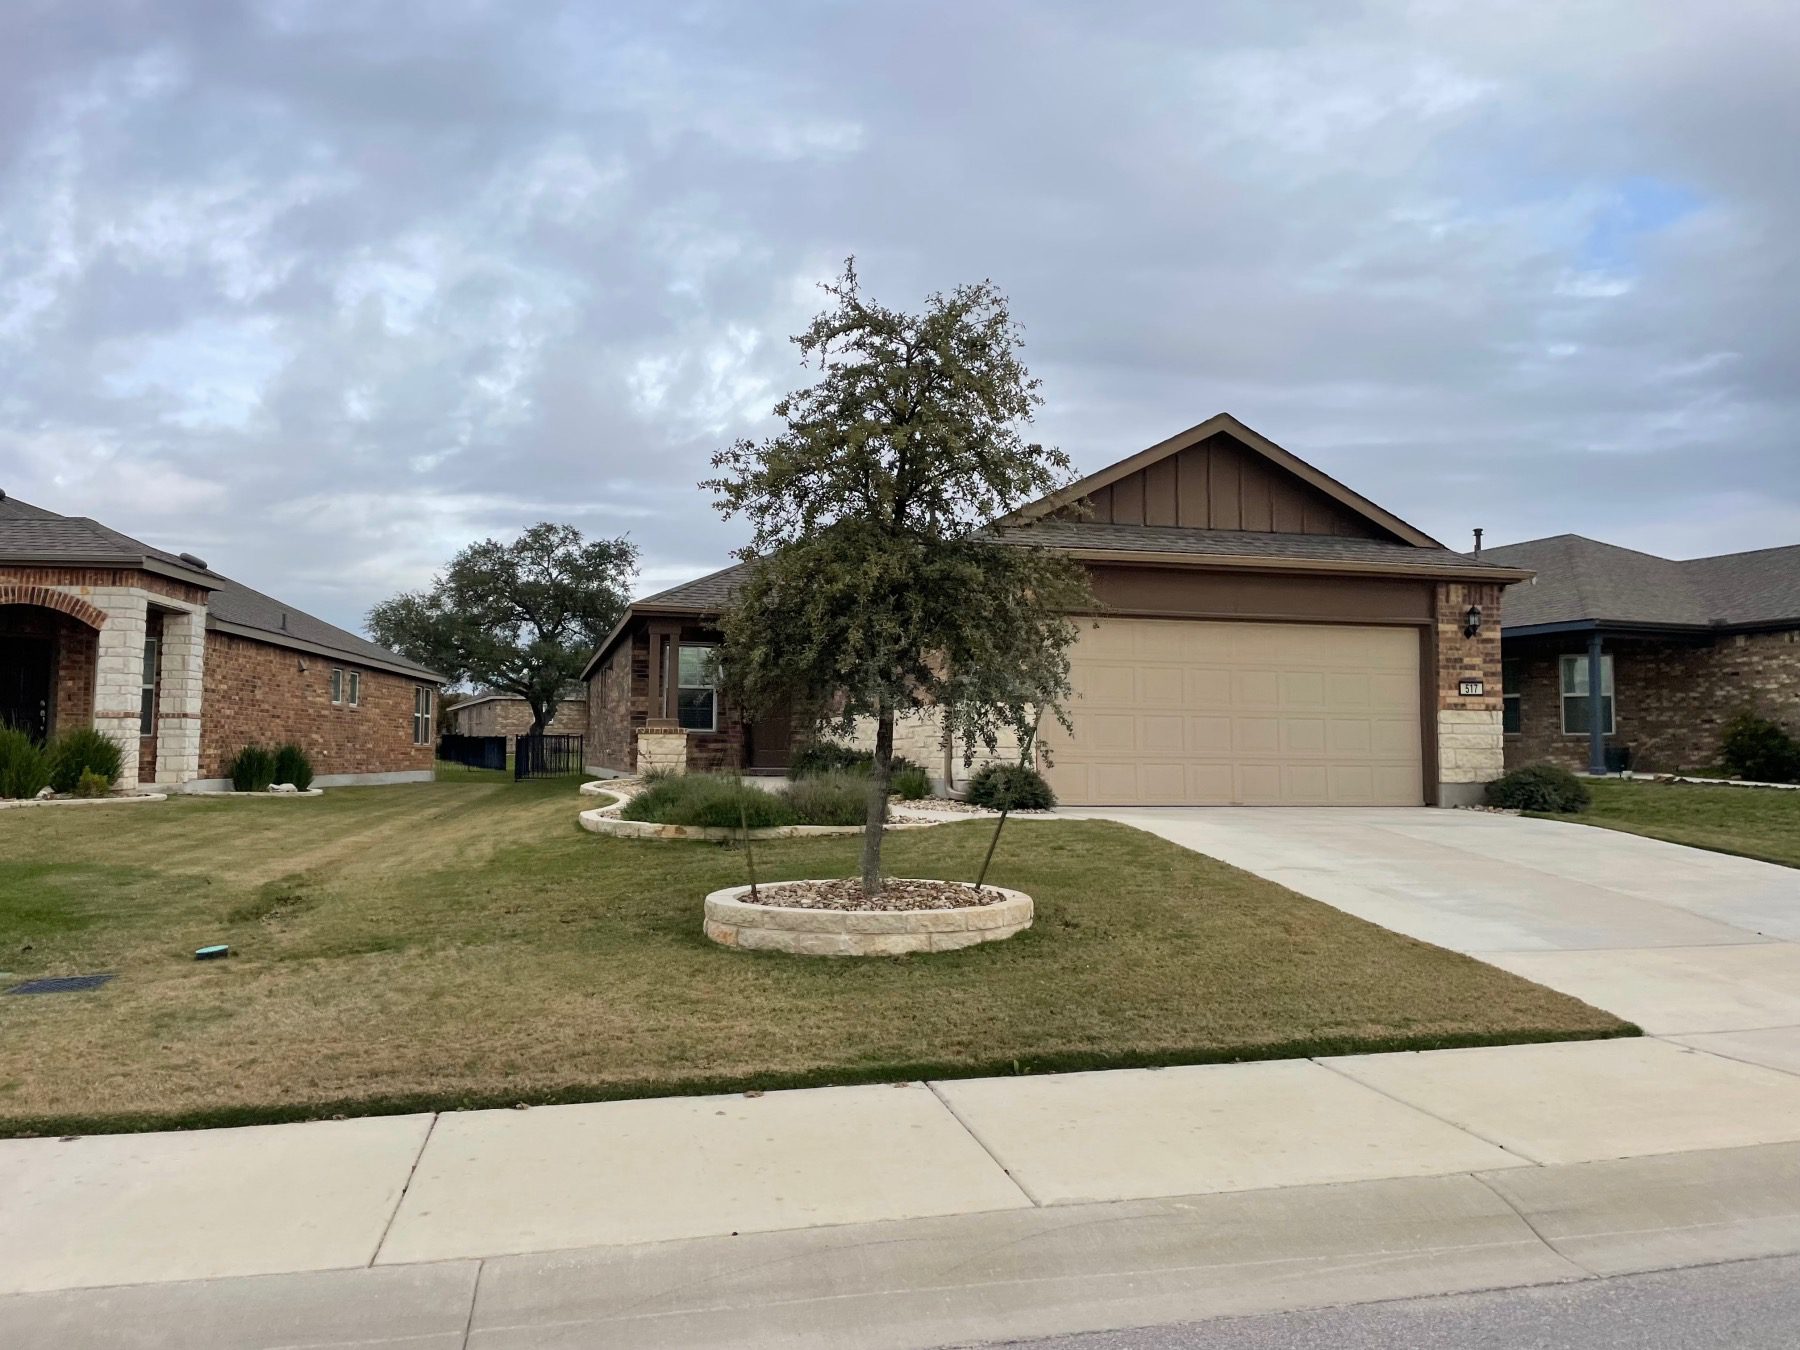
Sun City is an age-restricted community, so buyers must meet its age requirements. That means its numbers do not describe the broader Georgetown buyer pool, and we left it out of the neighborhood rankings above. Our Sun City neighborhood guide covers the community’s homes, amenities and requirements.
What This Means If You Are Selling or Buying in Georgetown
Days on market is a starting point, not a prediction. A neighborhood’s median shows how long the typical home took, not how long yours will.
If you are selling:
- Look at your own neighborhood first: The citywide 46 days is an average of very different places. Neighborhoods like Georgetown Village and Lively Ranch moved in about 20 to 31 days, while Morningstar and Crescent Bluff took 81 to 89.
- Price cuts are part of the story in builder communities: In nine of the 11 builder-driven communities, the median home closed 7 to 16 points below its original list price.
- Know your competition: If you live near a builder-driven community, new-home inventory and builder pricing are part of what buyers compare you to.
If you are buying:
- Fast neighborhoods leave less time to decide: Where the median is 20 to 30 days, plan to have your financing and your questions ready before you tour.
- Slower neighborhoods can leave more room to negotiate: A longer median, plus a bigger gap to the original list price, is a useful sign, but check recent sales on the specific street.
- Ask what a neighborhood’s number includes: A builder-driven community and a resale neighborhood can sit side by side and behave very differently.
A ranking cannot replace a look at your own street. Rebecca can pull the recent sold data for the neighborhoods you are comparing.
How We Measured This
- Data: Closed single-family sales in Georgetown from October 1, 2025 to September 30, 2026, pulled from the MLS.
- Medians, not averages: Each neighborhood figure is a median, so a few unusual sales do not skew it. Group figures are sales-weighted medians of the neighborhood medians, so treat them as close approximations.
- Minimum sample: The fastest and slowest tables include resale neighborhoods with at least 15 sales. Smaller neighborhoods are too thin to rank.
- Days on market: The median adjusted days on market (ADOM) reported in the MLS.
- Sale-to-list: The sale price as a percentage of the final list price. Sale-to-original-list uses the first list price. Our sale-to-list price post explains why the two differ.
- Builder-driven communities: Parkside on the River, Wolf Ranch, Nolina, Parmer Ranch, Woodfield Preserve, Berry Creek Highlands, Patterson Ranch, Highland Village, Parkside Peninsula, Retreat at San Gabriel and Heights at San Gabriel.
- Not a prediction: These are past sales. Your home’s timeline depends on its price, condition and location.
Frequently Asked Questions
Over the past 12 months, the typical Georgetown home spent about 46 days on the market. Resale neighborhoods ran about 43 days, and builder-driven communities ran about 106 days.
Among resale neighborhoods with at least 15 sales, Oakcrest Estates had the shortest median at 13 days, followed by Georgetown Village and Serenada at 20 days each. Lively Ranch is the largest of the fast group, with 82 sales and a median of 31 days.
Builders set their own prices and change them on their own schedule, so a resale home near one competes with builder inventory. In nine of the 11 builder-driven communities, the median home closed 7 to 16 points below its original list price.
Usually close to it. The typical Georgetown home closed at about 98% of its list price. The fastest resale neighborhoods closed at 97% to 100%.
Sun City is age-restricted, so not every buyer can purchase there. It had 580 sales and a median of about 45 days, but those numbers do not describe the broader Georgetown buyer pool.
Start with recent sales in your own neighborhood, not the citywide average. Rebecca can pull the sold data for your neighborhood and show you where your price should land.
Find Out Where Your Georgetown Home Price Should Land
Thinking about selling and want to know where your neighborhood falls? Rebecca Jacks, Broker Associate with Eleven Oaks Realty, will pull the sold data for your street and neighborhood and walk you through what it means for your price. Eleven Oaks Realty has been helping buyers and sellers since 1978.
Want to know what your Georgetown home would sell for?
Call, text or email Eleven Oaks Realty. Rebecca will review the sold data for your neighborhood and tell you honestly where your price should land.
Request Your Free Home Value Analysis
Fill out the short form below and Rebecca will send your analysis within one business day. There is no obligation.




Leave a Reply