
Eleven Oaks Realty is proud to present their January 2026 Austin Luxury Real Estate Price Report measuring market activity in the Austin area single family home market priced at $1 million or over. Our January 2026 Austin Luxury Real Estate Price Report covers the luxury market in the following Austin metro area counties: Travis, Williamson and Hays.
Austin Luxury Real Estate Market Highlights
Let's dive straight into what the numbers are telling us to start the new year. January 2026 showed a luxury market that continues to find its footing, with pricing holding steady and absorption rates improving meaningfully compared to a year ago. The tone of the market right now is stabilization with selective demand.
- Looking at January's performance, we saw a median sale price of $1,420,000, which is a modest +0.25% year-over-year increase from January 2025's $1,416,500.
- Activity ticked up as well with 124 sales (+4.2% YoY) and a total of approximately $211.5M in volume across the $1M+ single-family segment. That's solid volume for what is traditionally one of the slowest months of the year.
- Here is where it gets interesting for anyone looking to make a move: Buyers are still closing below asking, but the gap is narrowing compared to last year. January closings came in at a median 5% below list price and 7% below original list price, with a close-to-original-list ratio of 93%. That is a 2 percentage point improvement from January 2025's 91%, which tells me that pricing is becoming more realistic across the board and sellers aren't having to give back as much.
- Homes are also selling faster. The median days on market dropped to 53 days, down from 71 days a year ago. That's an 18-day improvement and a 25.4% decrease in time to sell.
- The average price per square foot jumped to $439/sqft from $402/sqft a year ago, a 9.2% increase, which reflects a shift toward higher-quality or more central inventory trading hands.
- Inventory has loosened compared to December. We currently have about 8.09 months of supply with 1,003 active luxury listings on the market. That's up from December's 3.85 months of supply, largely because January's lower sales volume (124 vs December's 228) magnifies the inventory ratio.
- The inventory picture is not evenly distributed, though. The $1.2M to $1.39M range is the tightest segment at 5.56 months of supply. The $1M to $1.19M range comes in at 7.11 months, and the $1.4M+ tier is the loosest at 9.74 months of supply. If you're shopping above $1.4M, you have real leverage right now.
Austin Luxury Real Estate Market Overview
At a high level, the story in January is a market that is stable and gradually shifting toward better equilibrium. Prices are essentially flat year-over-year at the median level, which after the price corrections of 2023 and 2024 is actually a positive sign. We are selling slightly more homes than a year ago, and the time to sell is improving. However, the inventory overhang, particularly in the $1.4M+ segment, means that the leverage in most price negotiations still tilts toward the buyer. This is exactly what you would expect from a recovering luxury market. The serious buyers are active and they are increasingly willing to close quickly on well-priced homes. Sellers who position their listings correctly on day one are getting rewarded with faster sales and better net proceeds. But the market is still punishing overpricing, and the data makes that clear. From a supply-demand perspective, the 8.09 months of total supply technically classifies this as a buyer's market. But that headline number doesn't tell the whole story. The $1.2M to $1.39M band at 5.56 months is much closer to balanced, and well-positioned homes in that range are moving. The $1.4M+ tier at 9.74 months tells a different story entirely, one where buyers have abundant options and sellers need to compete on pricing and presentation.
Price and Negotiation Trends
1) Under-asking remains the norm, but the discount is narrowing January closings came in at a median 5% below list price (CP/LP of 95%) and 7% below original list price (CP/OLP of 93%). Compared to January 2025, where the original list-to-close ratio was 91%, this represents meaningful improvement. Sellers are either getting smarter about initial pricing, or buyer competition is gradually firming. Most likely, it's a combination of both. The average close-to-original-list ratio was 91.08%, which tells us that while the typical sale is only giving back 7% from original list at the median, there are some outlier transactions pulling the average down. Those tend to be properties that sat on the market for extended periods and needed more significant reductions to trade.
2) Time-to-contract improved sharply year-over-year The median days on market of 53 is a 25.4% improvement from January 2025's 71 days. The average dropped from 99 to 89 days, a more modest 10.1% decline. The gap between median and average (53 vs 89 days) tells us that the majority of homes are selling within about two months, but there is a meaningful tail of listings that are lingering much longer, pulling that average up. Those are typically the overpriced or poorly positioned listings that the market is simply passing over.
3) Price per square foot signals a shift in what's selling One of the most notable data points this month is the 9.2% increase in median price per square foot, from $402/sqft in January 2025 to $439/sqft in January 2026. This is significant because it tells us the composition of sales is shifting toward higher-value-per-foot locations and product types. Central Austin and established neighborhoods are commanding a premium, while the more suburban luxury sales (larger lots, lower per-foot pricing) are making up a smaller share of the mix.
4) Micro-markets diverge: county and zip performance varies sharply The market is not moving as one single unit. By county (January 2026): Travis County: 93 sales, median $1,500,000, DOM 53, -5.29% over/under asking, $534/sqft. Travis is the anchor of the luxury market and remains essentially flat in pricing year-over-year with slightly fewer sales (-2.1%). The price per square foot increased 2.8%, and homes sold 17 days faster than January 2025.
- Williamson County: 20 sales, median $1,150,000, DOM 41, -6.87% over/under asking, $297/sqft. Williamson was the big story this month with a 53.8% surge in sales volume. This is being driven by Leander and Georgetown where buyers are finding relative value in the luxury space. Homes here sold at the fastest pace of any county at 41 days median, down 38 days from a year ago.
- Hays County: 11 sales, median $1,500,000, DOM 96, -4.38% over/under asking, $385/sqft. Hays County had a tougher month with only 11 sales, down 26.7% from a year ago. The 96-day median days on market is notably higher than the other two counties. However, the median price jumped 25% year-over-year, which with such a small sample size likely reflects a few higher-end transactions rather than a broad price increase. The lower negotiation discount of 4.38% under asking does suggest that the homes trading here are better priced to begin with. By zip code (January 2026 highlights):
- 78704 (South Austin/Zilker/Travis Heights): 14 sales, median $1,540,000, $714/sqft. This was the most active luxury zip code in January with a 55.6% increase in sales and a 27.7% jump in median price. The $714/sqft is the highest of any top-volume zip. South Austin luxury demand is clearly strong heading into 2026.
- 78641 (Leander): 12 sales, median $1,278,917. Sales doubled year-over-year in Leander's luxury segment, which signals growing buyer interest in the northern suburbs. However, the 166-day median DOM and -9.68% under asking suggest these sales are largely negotiation-heavy transactions on listings that took time to find the right buyer.
- 78703 (Central Austin/Tarrytown/Clarksville): 9 sales, median $1,950,000, $795/sqft. This prestige zip code saw a 28.6% increase in sales, though the median price dipped 11% year-over-year. At $795/sqft, it commands the highest per-foot pricing of any top zip, reflecting the premium Central Austin locations carry.
- 78738 (Bee Cave/Lakeway area): 9 sales, median $1,256,167, $354/sqft. Pricing was essentially flat (+0.5%), but days on market improved dramatically with a 100-day decrease in median DOM compared to January 2025. That is one of the biggest absorption improvements in the metro.
- 78746 (West Lake Hills/Westlake): 8 sales, median $1,895,000, $540/sqft. Westlake saw fewer sales (-20%) and a 9.8% price decline at the median level. Days on market improved by 57 days though, and closings came in at -8.29% under asking, the highest discount of any top zip. This is an area where buyers are being very strategic and patient.
0.25% Increase in Median Sold Price
In January 2026, the median home price of a luxury home in Austin was $1,420,000 compared to $1,416,500 in January 2025, showing a 0.25% increase in year over year numbers. Last month the median home price of a luxury home in Austin was $1,399,000, showing a 1.5% increase in month over month comparisons.
4.2% Increase in the Number of Austin Luxury Home Sales
In January 2026, there were 124 luxury homes that sold in Austin compared to 119 in January 2025, showing a 4.2% increase in year over year numbers. Last month there were 228 luxury homes that sold, showing a 45.6% decrease in month over month comparisons. This seasonal decline is completely expected; January is historically one of the quietest months in the luxury market as buyers and sellers reset after the holiday season and year-end closing rush.
25.4% Decrease in Median Time to Sell
In January 2026 the median time to sell a luxury home in Austin was 53 days compared to 71 days in January 2025, showing a 25.4% decrease in year over year numbers. Last month the median time to sell a luxury home in Austin was 50 days, showing a 6.0% increase in month over month comparisons. While the month-over-month increase of 3 days is slight, the year-over-year improvement of 18 days is the headline here. Luxury homes are finding buyers meaningfully faster than they were at this time last year.
January 2026 Austin Luxury Market Sales Breakdown
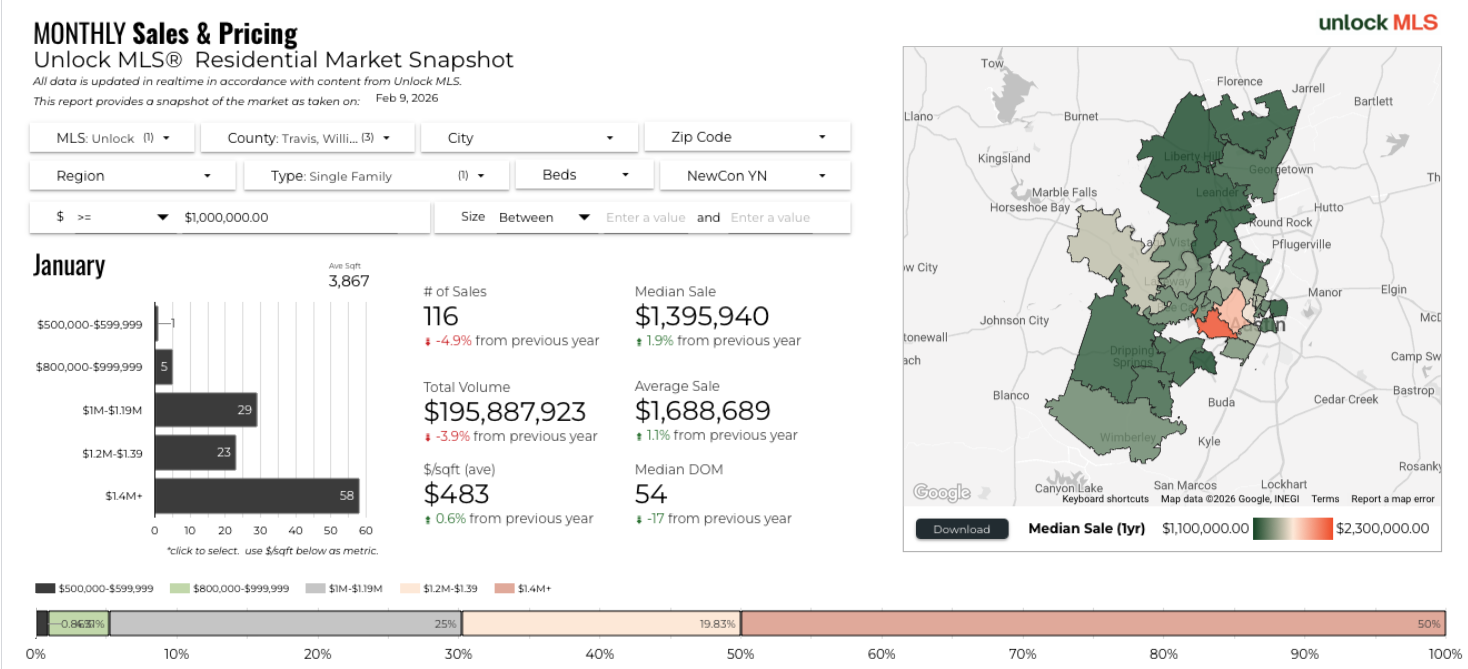
In January 2026, 5 (4.3%) of the luxury homes that were priced at $1,000,000 or higher at the time of contract sold for less than $1MM. 29 (25%) sold for between $1MM-$1.19MM. 23 (19.83%) sold for $1.2MM-$1.39MM. 58 (50%) sold for $1.4MM or more. Half of all luxury sales in January were in the $1.4M+ range, which underscores that the upper end of the market is where the most activity is concentrated. The $1M to $1.19M segment accounted for a quarter of sales, while the $1.2M to $1.39M range was the thinnest, which makes sense given that this segment also has the tightest supply. You'll see a heat map of median sale pricing where you see the most expensive luxury homes sold in Central and West Austin, a trend we see every month.
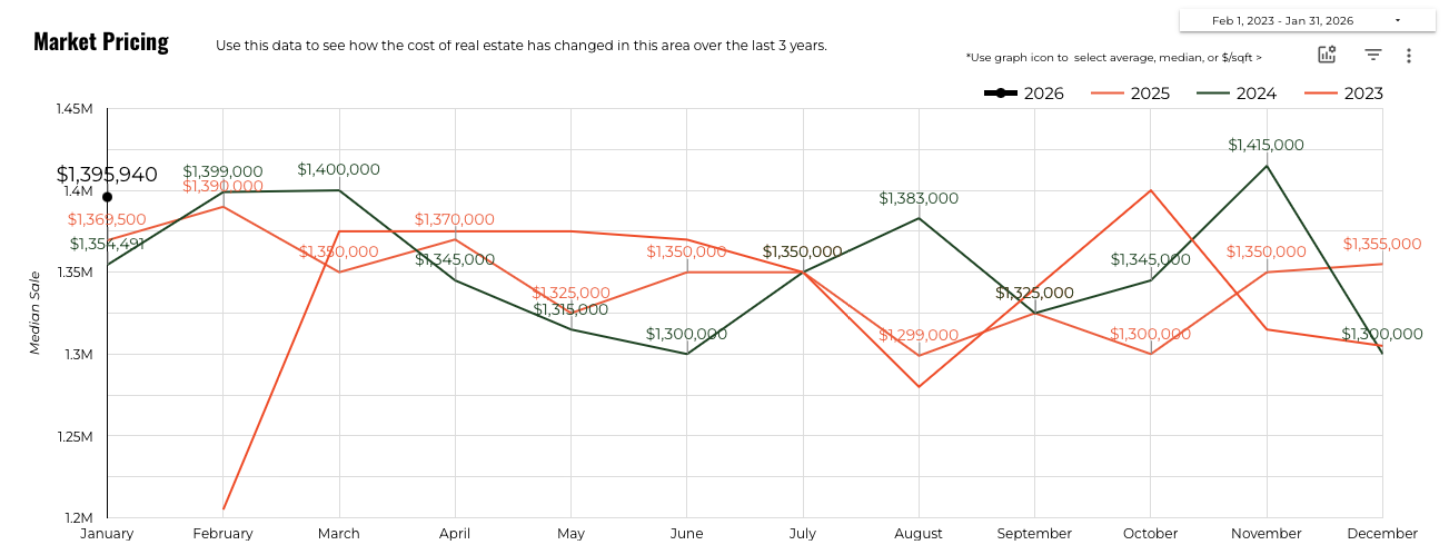
Luxury Market Pricing - Median Sold Price Over 3 Years
This chart shows the median sales price for Austin luxury homes over the last three years.
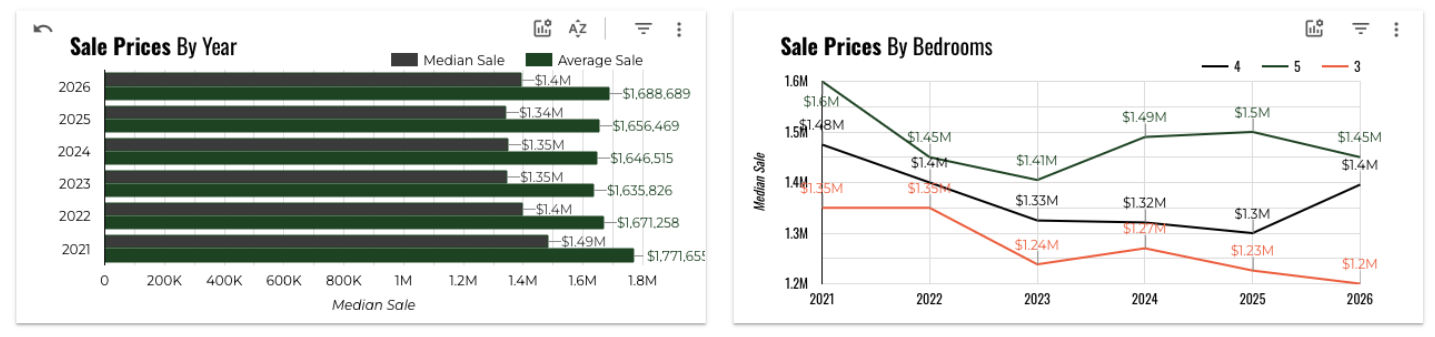
Austin Luxury Median and Average Sale Price and Sales Prices by Bedrooms By Year
Here is a five year look back on the Austin luxury market with median and average sale price on the left graph and sales prices by bedrooms by year on the right graph both broken down by year.
Austin Luxury Market Activity
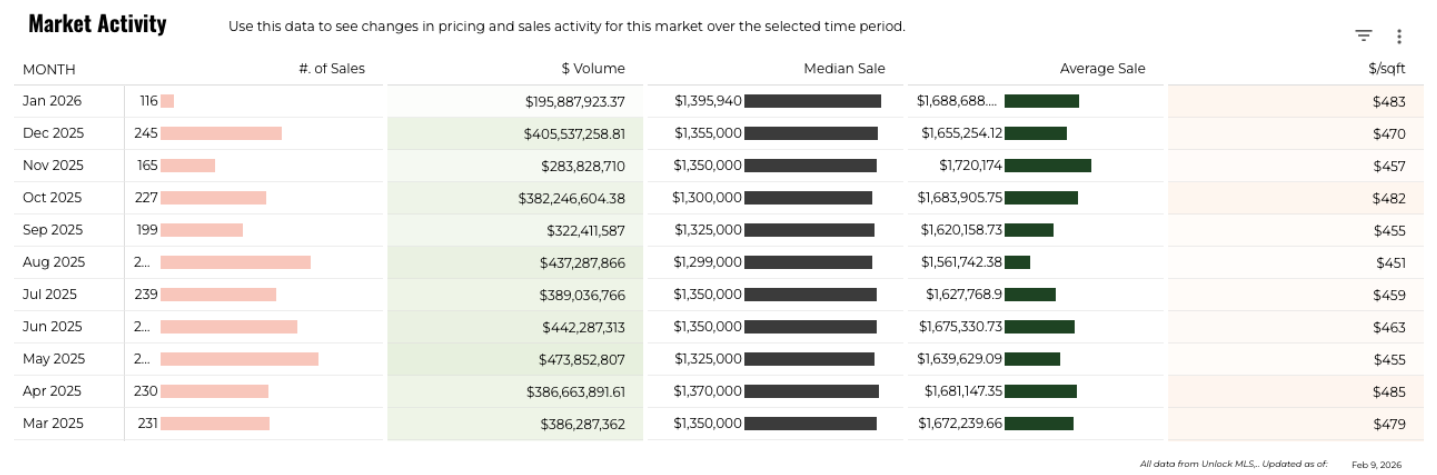
Here is an 11 month look at the number of sales, total sales volume, median price, average price and average price per square foot in the Austin luxury market.
Austin Luxury Buyer Demand
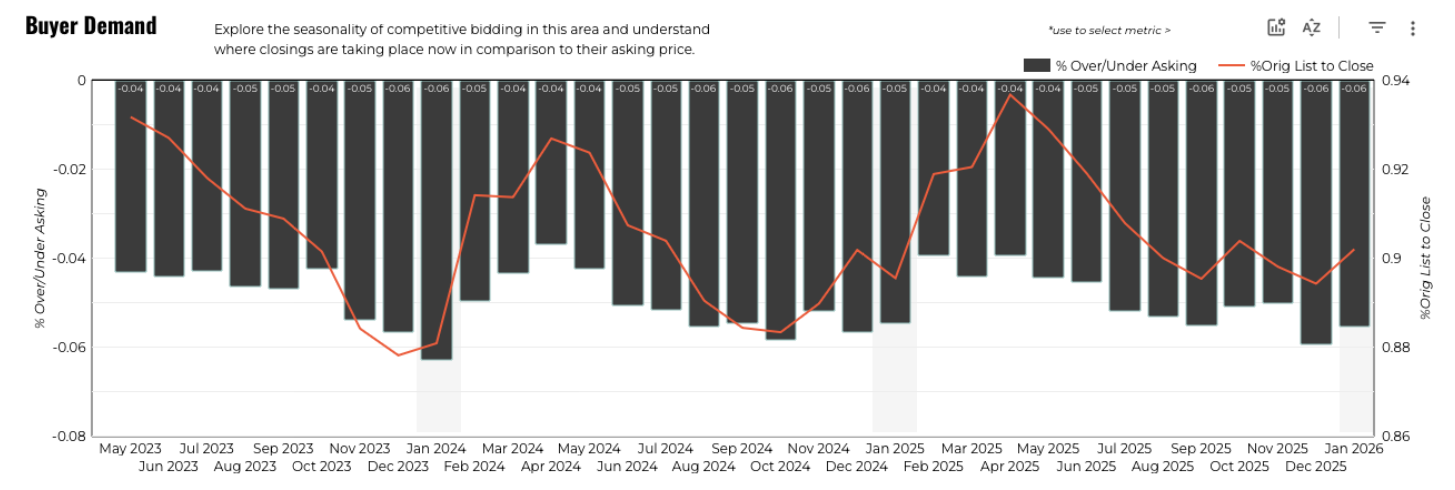
This chart compares a three year look back on % list to close rates and % over/under asking price for Austin luxury homes. As the close rate increases, the % under asking decreases, which is what we would expect. In January 2026, the list-to-close rate held steady at 95% while the original list-to-close improved to 93% from 91% a year ago. That tells us sellers are pricing more realistically out of the gate, and the negotiation gap between original list and close is shrinking.
Austin Luxury Days on Market - Median vs Average
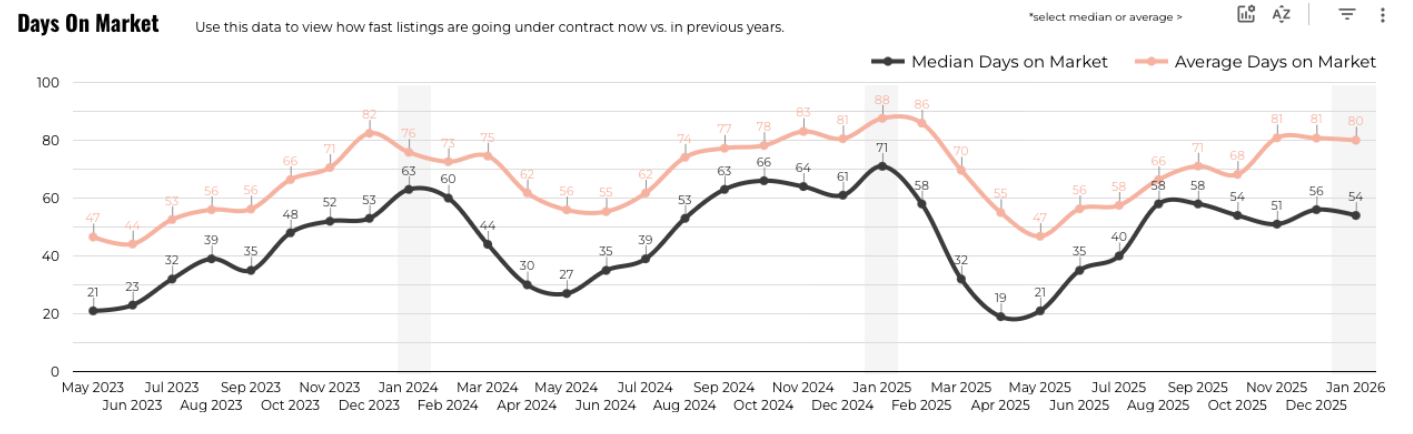
This chart shows how fast listings go under contract compared to previous years. January 2026 shows the median days on market at 54 and the average at 80. The 26-day gap between median and average tells an important story: the bulk of well-priced listings are selling within about 7 to 8 weeks, but there is a long tail of overpriced or less desirable listings pulling the average up significantly. If your home is priced correctly and shows well, you can expect to be closer to that 54-day median. If it sits past 60-90 days without serious offers, that is a strong signal that a pricing adjustment is needed. Last year the average days on market was 88 compared to 80 days this year and the median was 71 compared to 54 this year, so a definite decrease in year over year numbers across the board.
Luxury Buyer Demand by Price Range
This chart looks at buyer demand by price range. The $800k-$999k sector is only included because those homes were listed at $1MM or more when they sold. This is not the full picture of that segment of the market. Those had the second largest segment under asking, but those numbers are a little skewed as they only factored in homes that were listed at $1MM or above. This month the $1.4MM+ segment had 58 sales, making it the most active price band by volume. The $1MM-$1.19MM segment had 29 sales, and the $1.2MM-$1.39MM segment had 23 sales. From a buyer demand standpoint, looking at the scatter plot of median DOM vs % over/under asking, the $1.4M+ had the highest median days on market at 65 days. The $1M-$1.19M segments showed a median days on market of 49 days. Both the $1.4MM and $1-1$1.19MM showed an average 6.1% negotiated off list price. The $1.2M-$1.39M segment showed a median 37 days on market, which is interesting given it has the tightest inventory. Buyers in this price range were only able to negotiate 2.4% off list price, on average. This suggests that buyers in this band are needing to make a decision quicker and sellers are holding firmer on price, leading to shorter negotiation periods as supply favors the seller.

Austin Luxury Monthly Inventory
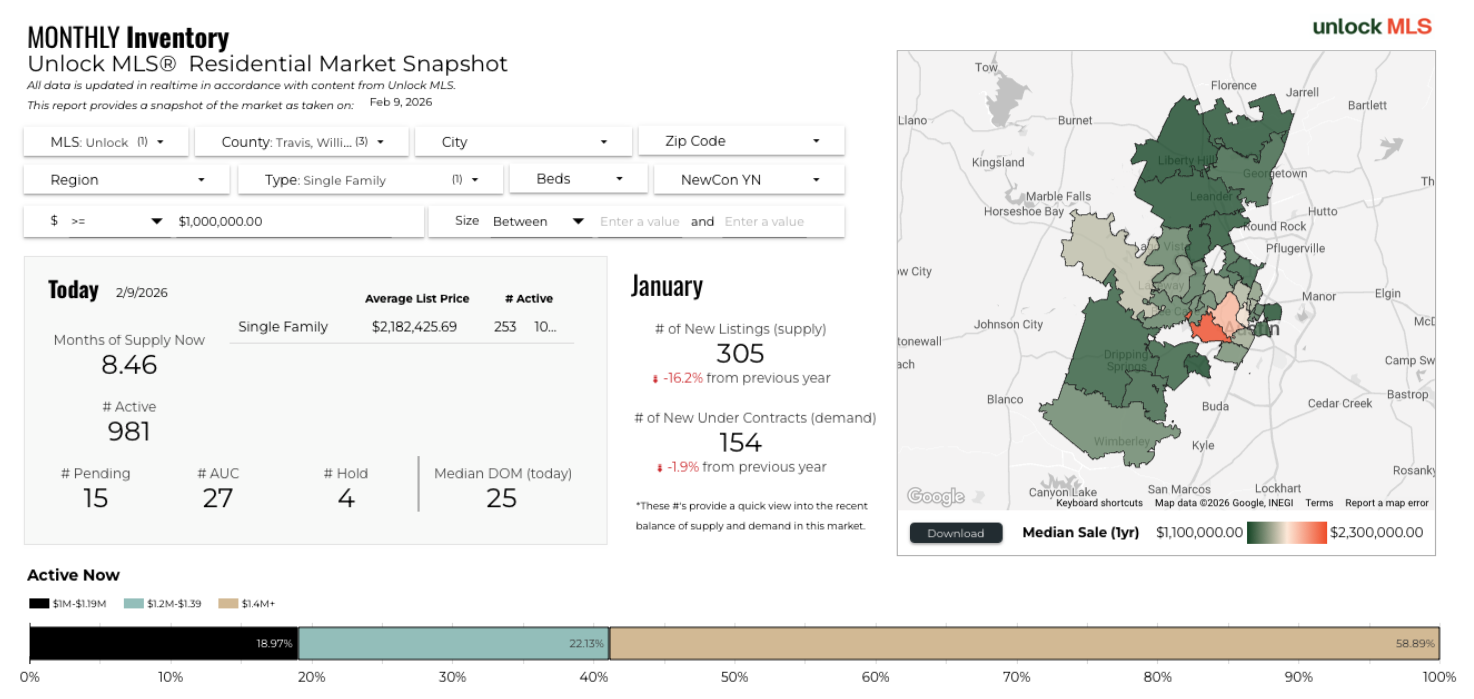
In January 2026, there are currently 8.46 months supply of inventory on the luxury market with 981 active luxury homes. 18.97% are priced from $1MM-$1.19MM, 22.137% are priced between $1.2MM-$1.39MM and 58.87% are priced at $1.4MM or more. The concentration of active inventory in the $1.4M+ range (577 of 981 listings, or 58.87%) compared to its share of actual sales (58 of 116, or 50%) is one of the most telling metrics in this report. There is an 8.87% percentage point gap between inventory share and sales share at the top end, which means the highest-priced tier of the market has proportionally more listings sitting than selling. Buyers have options here, and pricing precision is critical.
Months Supply of Luxury Inventory by Price and Asking Price
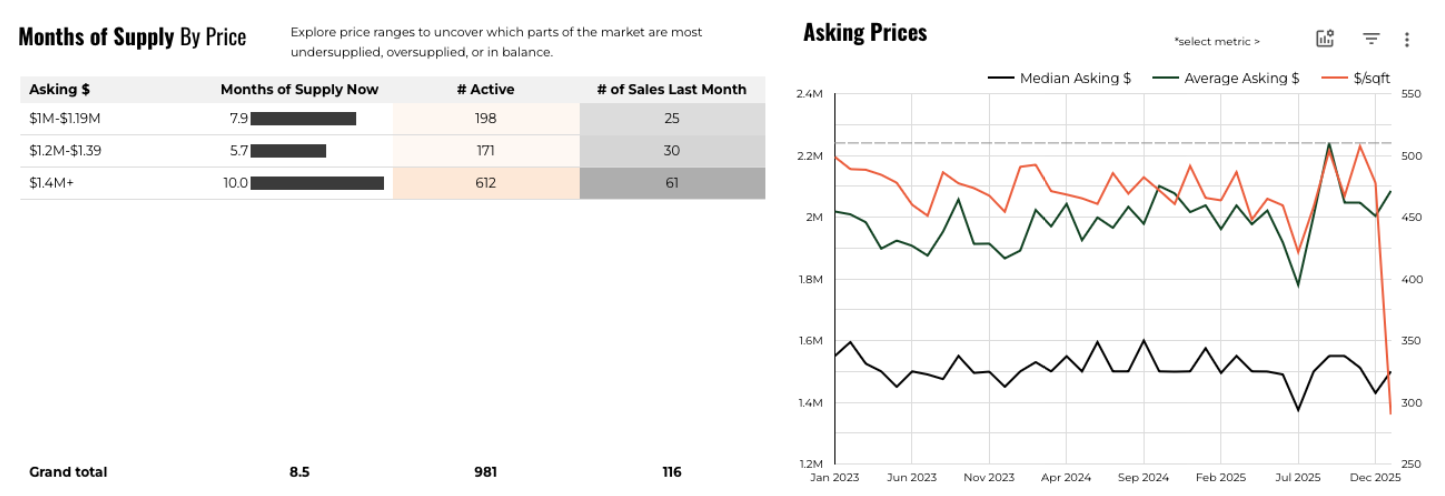
This chart breaks down the months supply of inventory by segment. This month we saw the leanest segment of the market in the $1.2MM-$1.39MM segment with 5.7 months of inventory, which is classified as a balanced market that leans slightly toward buyers. Next, came the $1MM-$1.19MM segment with 7.9 months of inventory, which is firmly in buyer's market territory. Finally the $1.4MM and above segment had 10 months of inventory, which is decidedly a buyer's market. Compared to December's inventory levels (where total supply was 3.85 months), January's 8.46 months reflects the seasonal slowdown in closings more than a real change in inventory conditions. The number of active listings (981 vs December's 921) has grown by about 6.1%, but the bigger driver is the drop from 239 to 116 monthly sales. The chart on the right plots median asking price, average asking price and asking $/sqft.
New Austin Luxury Listings
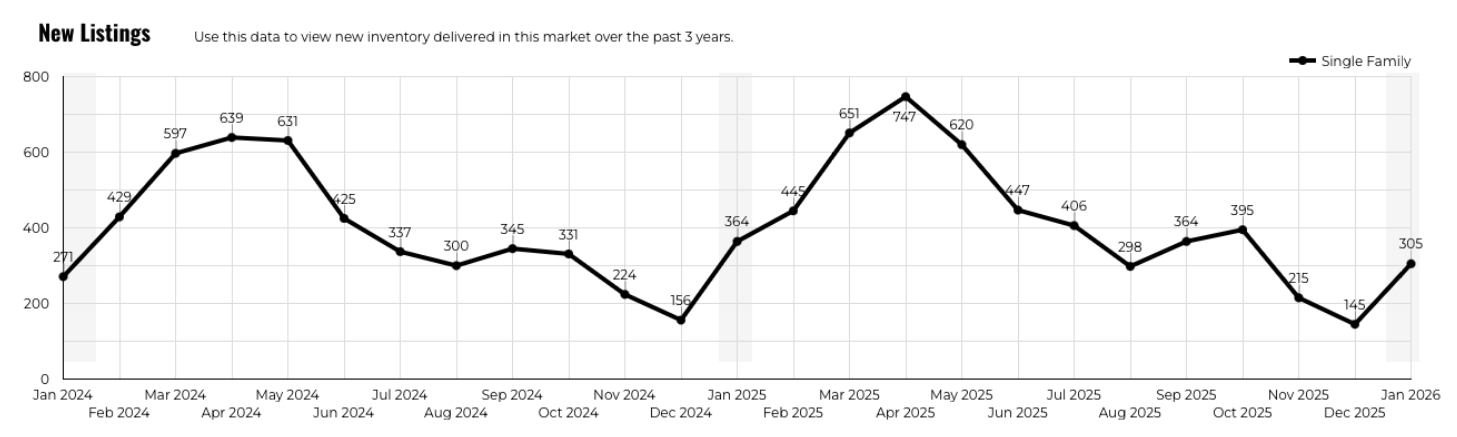
This chart maps the new listings by month over the past 3 years. This month we had 305 luxury homes introduced to the market compared to 364 in January 2025 and 271 in January 2024.
Number of Luxury Listings that Accepted a Contract
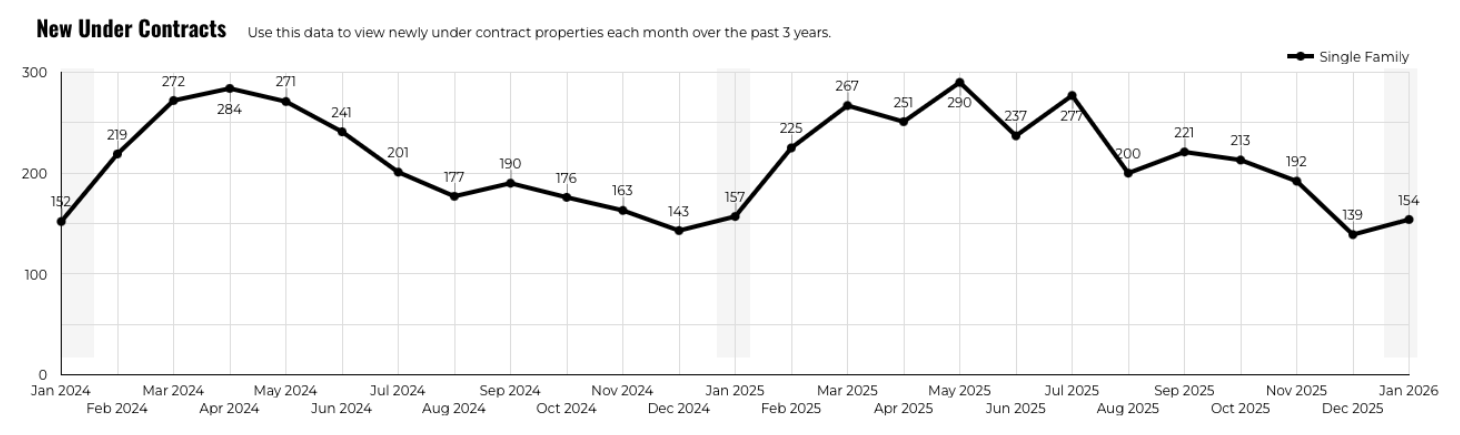
This chart tracks the number of luxury homes that accepted a contract over time. This month we had 154 luxury listings that accepted a contract compared to 157 in January 2025 and 152 in January 2024.
January 2026 Active Price Drop Info
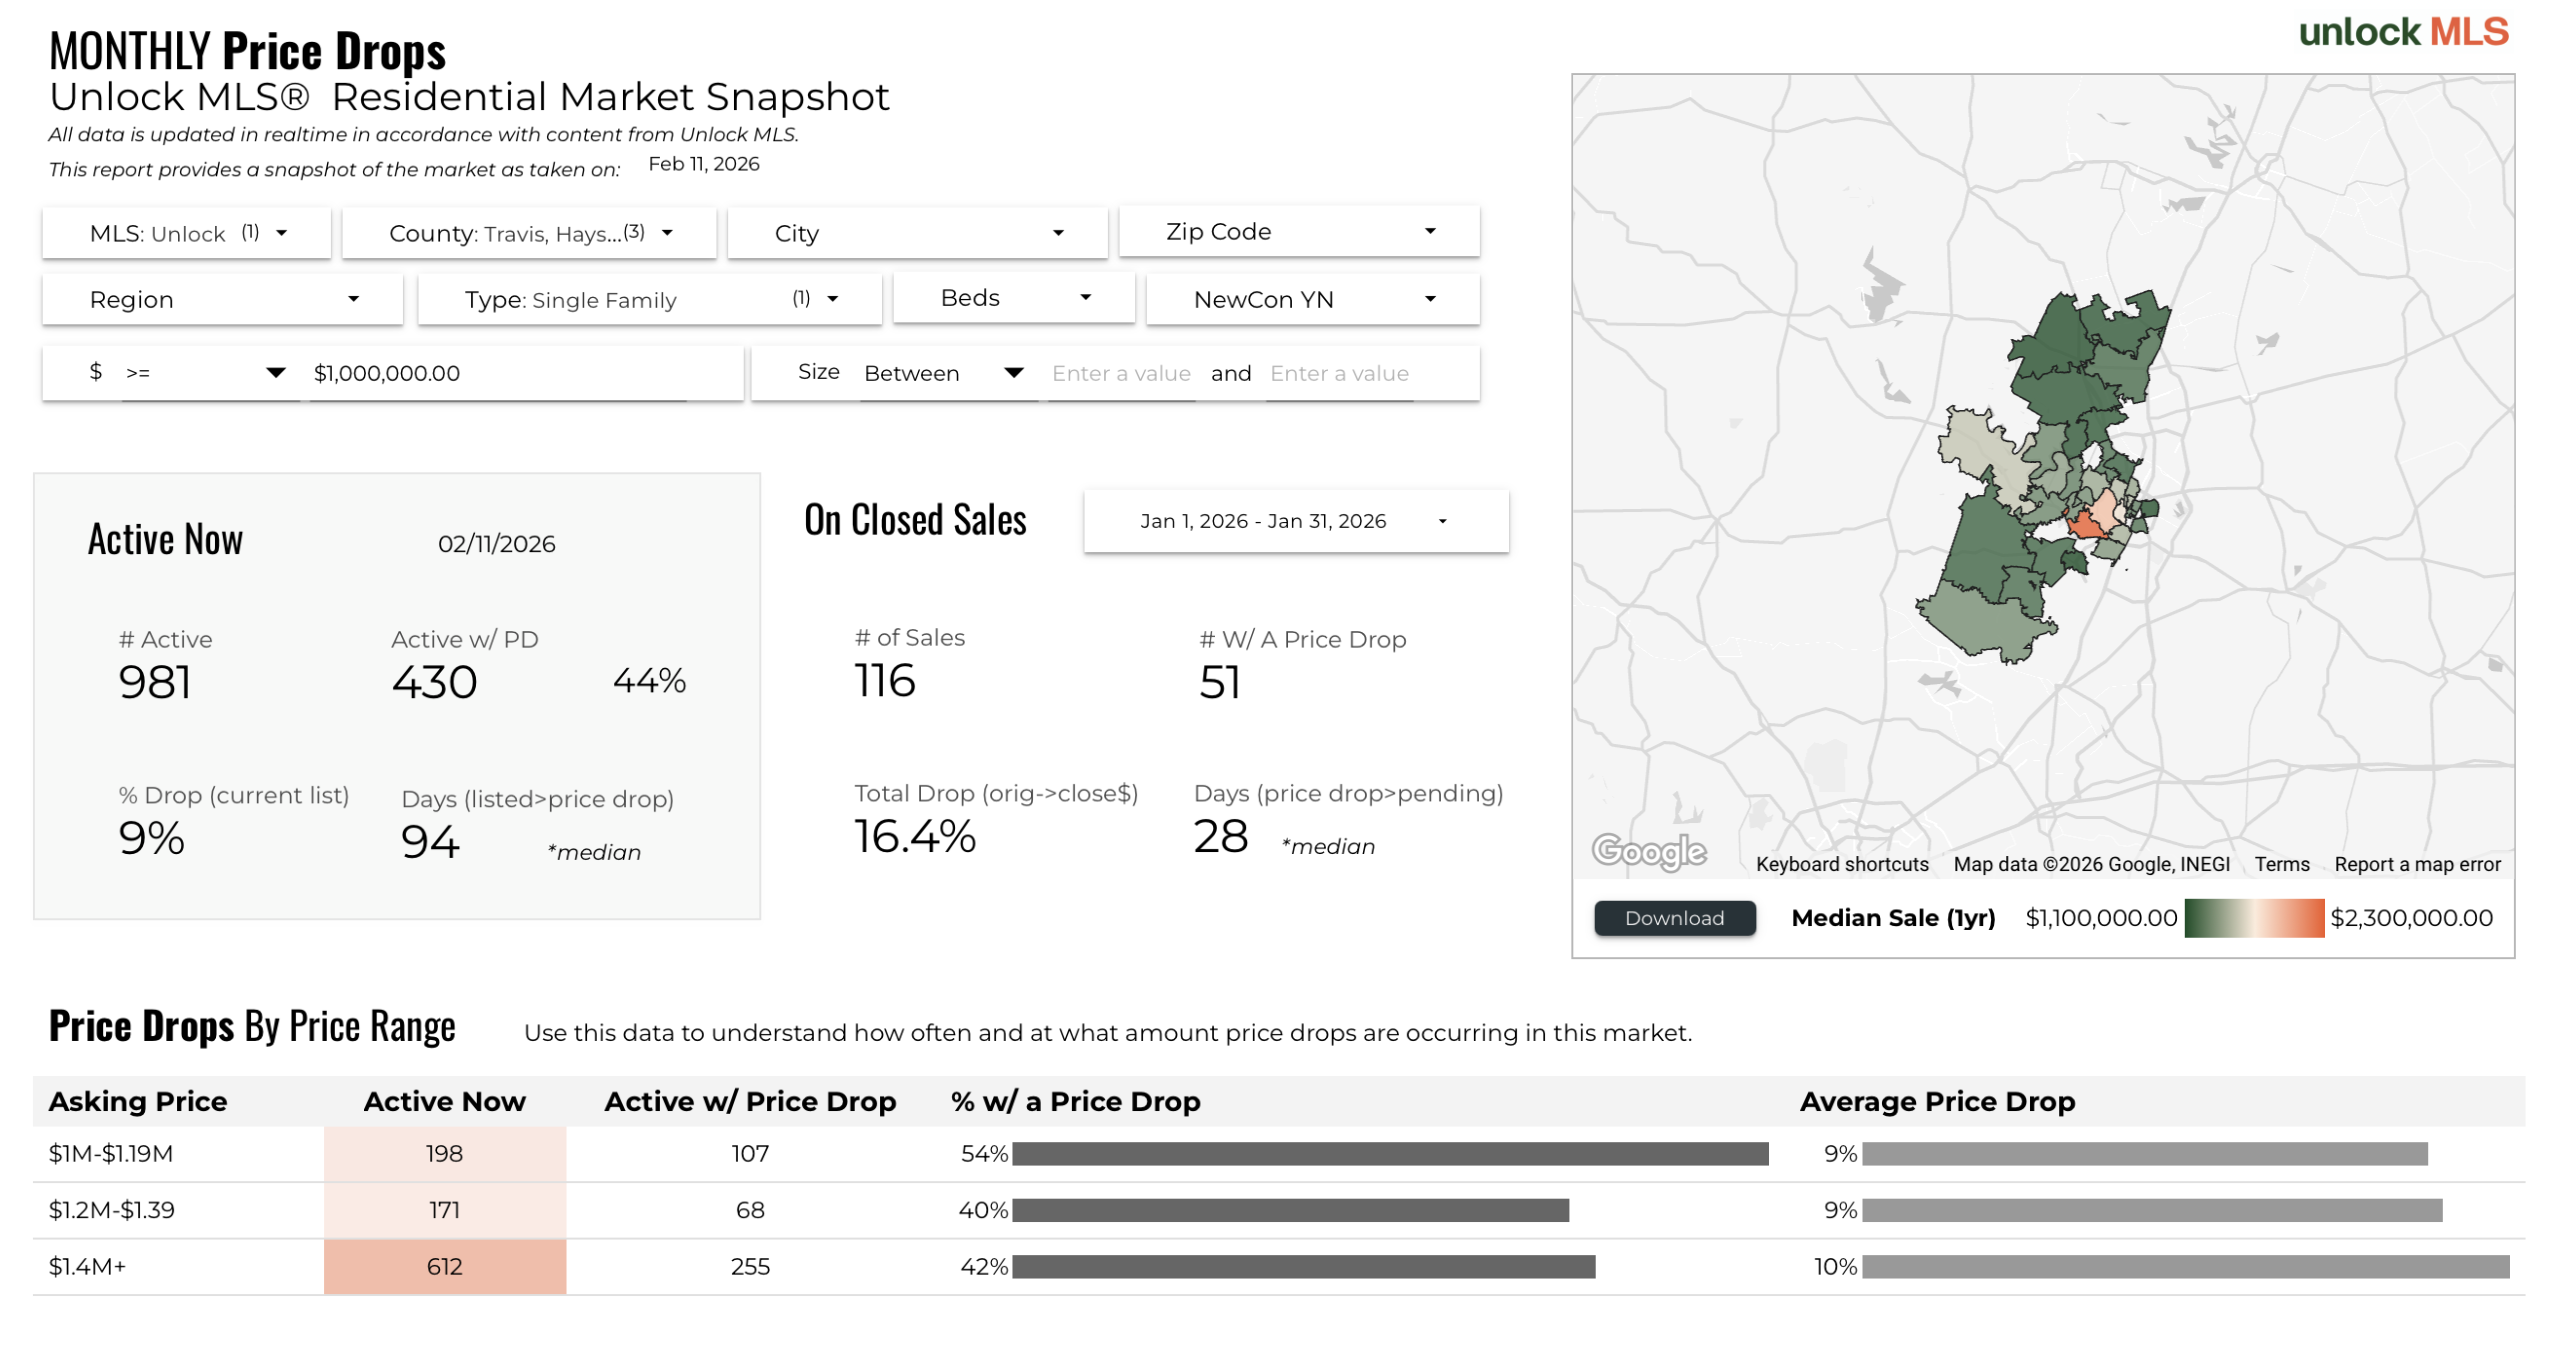
As of February 11, 2026, there were 981 luxury homes actively listed for sale. Of those 430 (44%) of them had a price drop. The average price drop was 9% and it took a median of 94 days for sellers to drop the price. Of the 116 January 2026 sales, 51 of them had a price drop with an average 16.4% drop. If you break it down by price tier, homes priced from $1MM-$1.19MM had 198 luxury homes actively listed, 107 (54%) of which had a price drop. The average price drop for homes in this luxury segment was 9%. In the $1.2MM-$1.39MM category, there were 171 homes actively listed for sale and 68 (40%) of them had a 9%, on average, price drop. In the $1.4MM+ segment, there were 612 actively listed luxury homes. Of those, 255 (42%) had a 10%, on average, price drop.
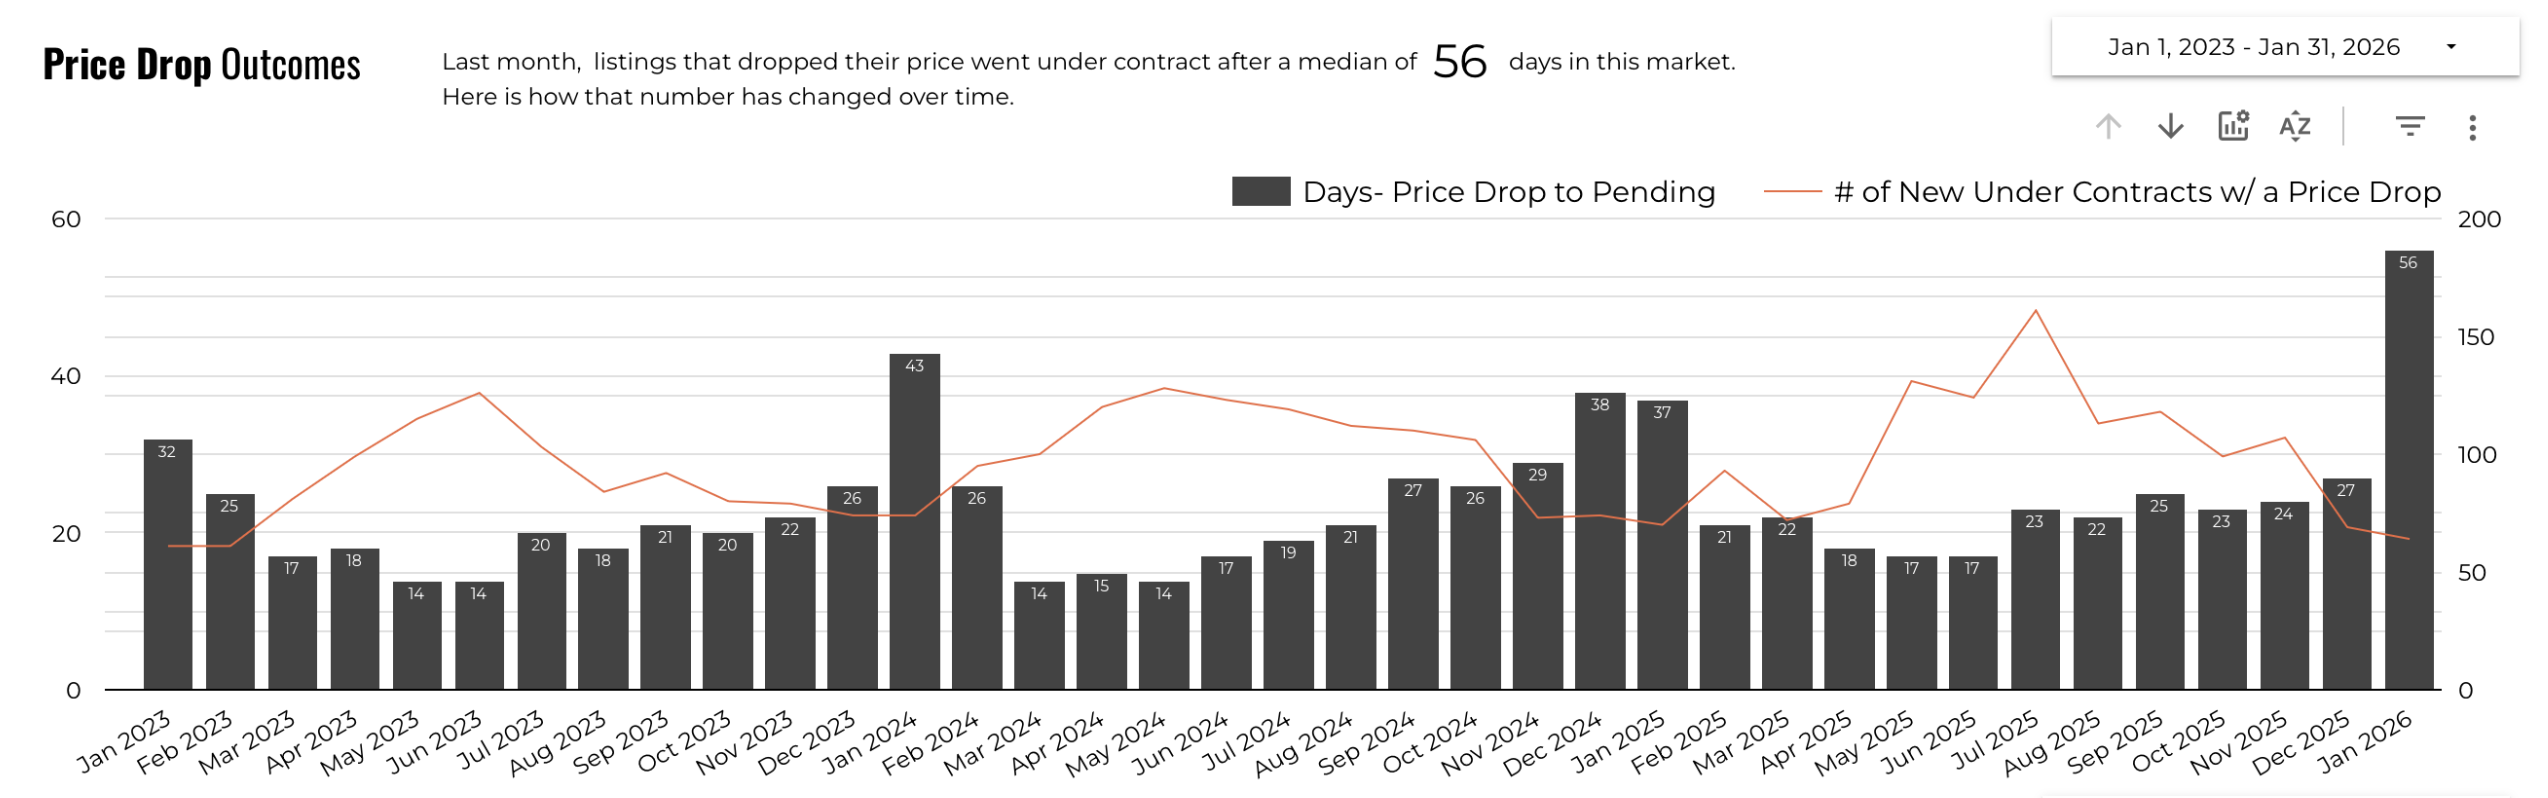
January 2026 Price Drop Outcomes
In January 2026 there were 64 luxury homes that accepted a contract after having a price reduction. Homes that went under contract after a price reduction, took a median of 56 days after the price drop to find a buyer.
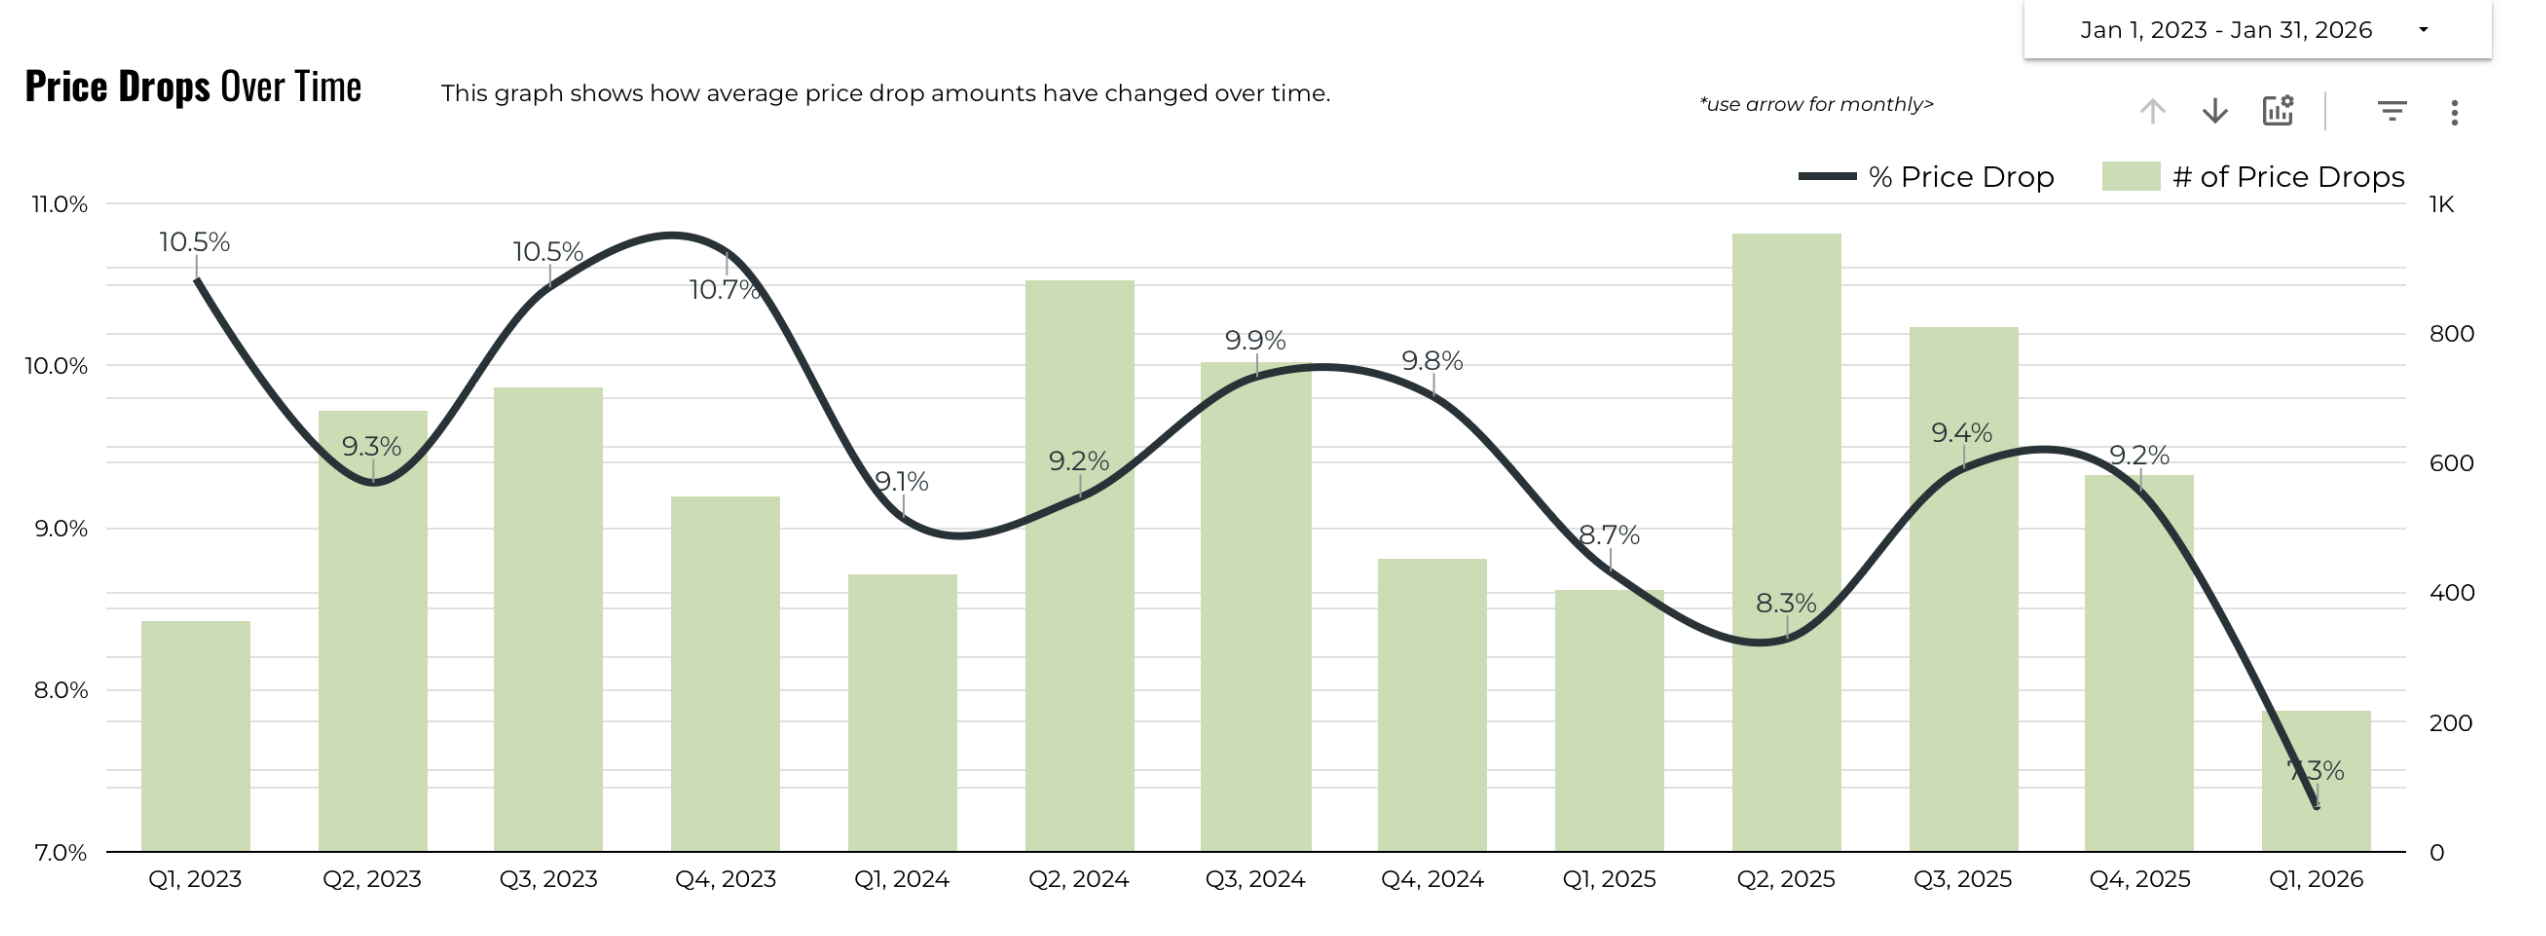
Austin Luxury Home Price Drops Over Time
So far this quarter (Q1 2026) we saw 220 price drops with an average price drop of 7.3%. In Q1 of 2025, we saw 406 price drops with an average price drop of 8.7%. In Q1 of 2024, we saw 430 price drops with an average price drop of 9.1%. In Q1 of 2023, we saw 357 price drops with an average price drop of 10.5%. But remember, we are comparing a whole quarter in 2023-2025 versus one month of a quarter in 2026. These numbers are more significant at the end of a quarter, but we like to include them here to give you an idea how we're tracking.
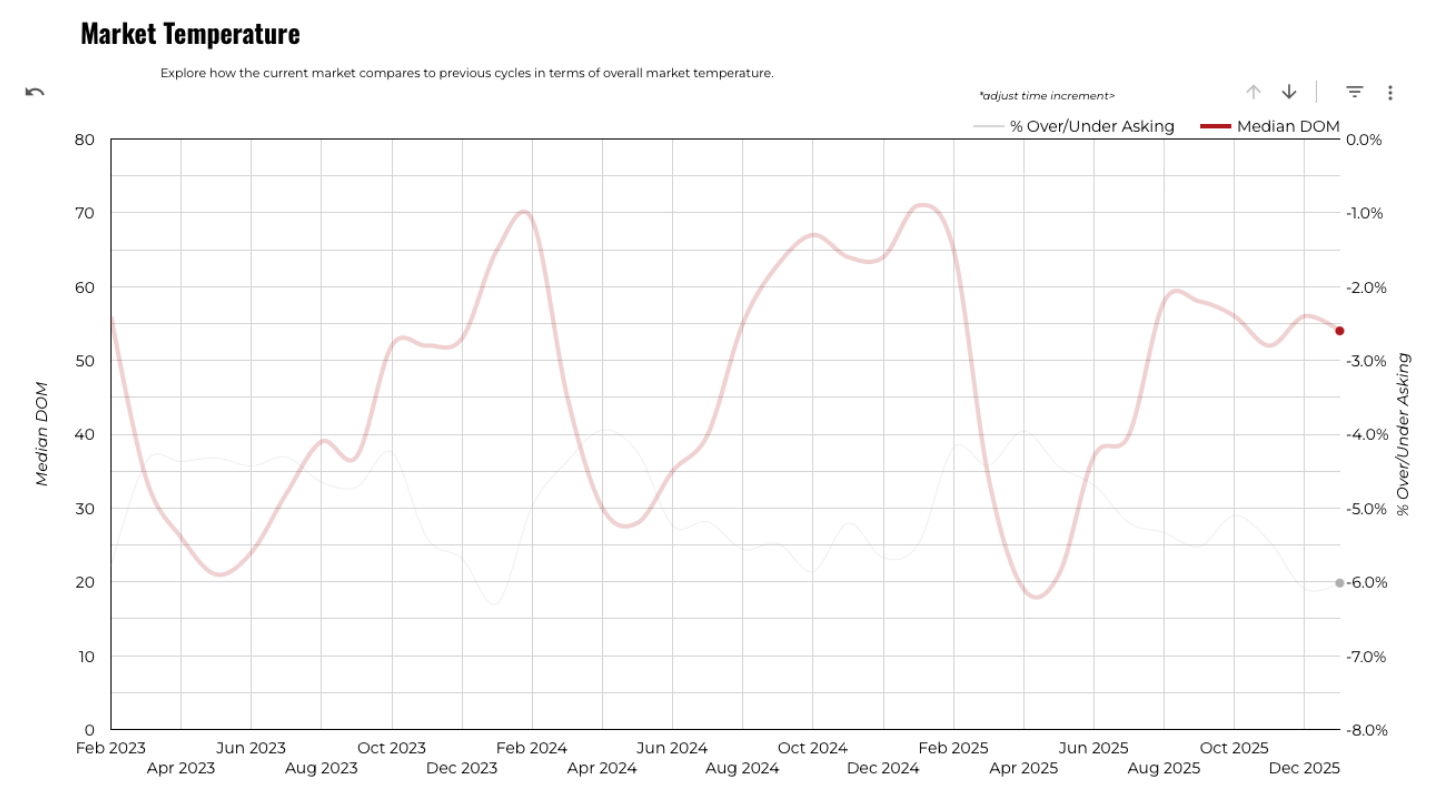
January 2026 Austin Luxury Market Temperature
In January 2026, the median days on market of 54 days places us in the upper range of balanced market territory. Sellers received, on average, about 6% less than their list prices and 9% less than their original list prices. This continues the trend of a market where well-priced homes sell within a reasonable timeframe, but overpriced homes face extended market time and deeper discounts.
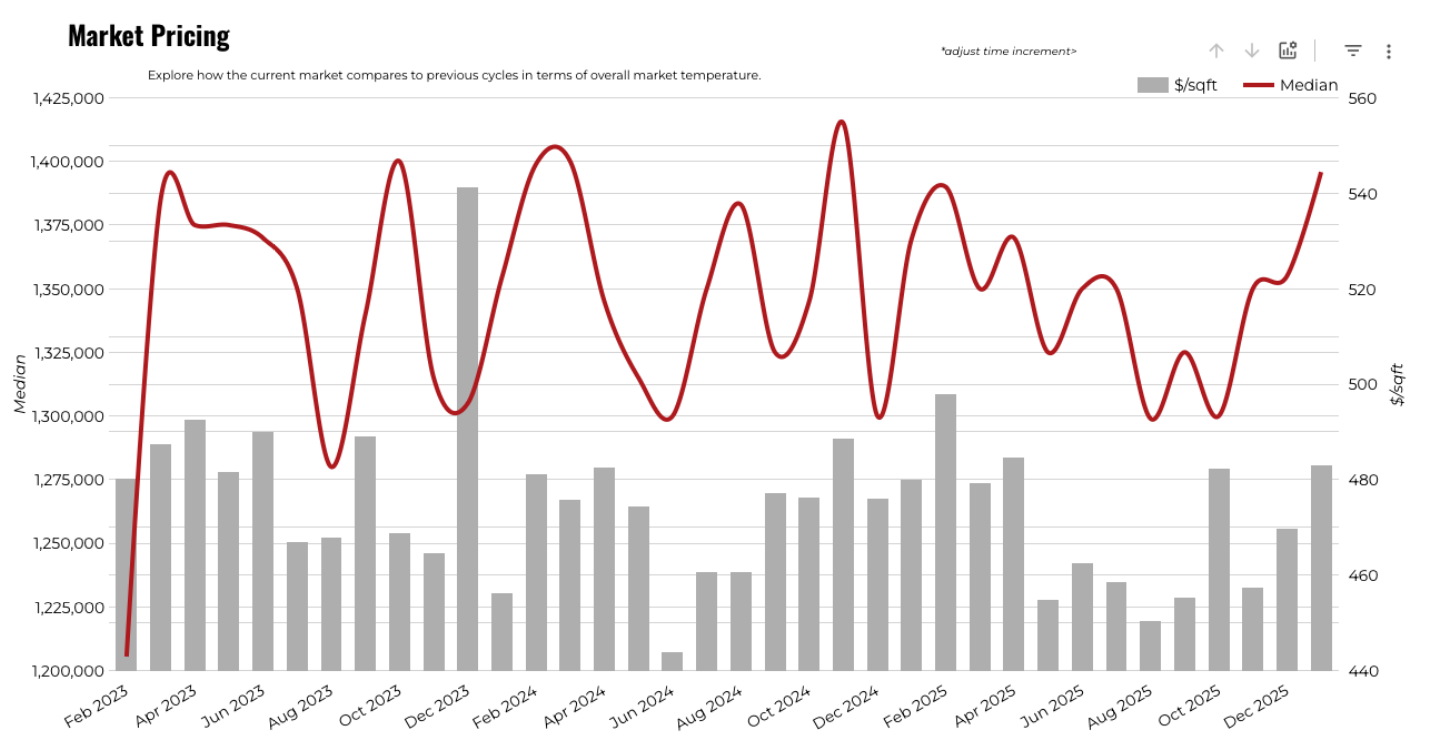
Austin Luxury Market Pricing
In January 2026 luxury home pricing held essentially flat year-over-year with a median of $1,420,000. This stability, after the corrections seen in 2023 and 2024, is a healthy sign for the market. The average sale price of $1,705,595 and the median price per square foot of $439.10 both suggest that the composition of sales is trending toward higher-quality, higher-value-per-foot inventory.
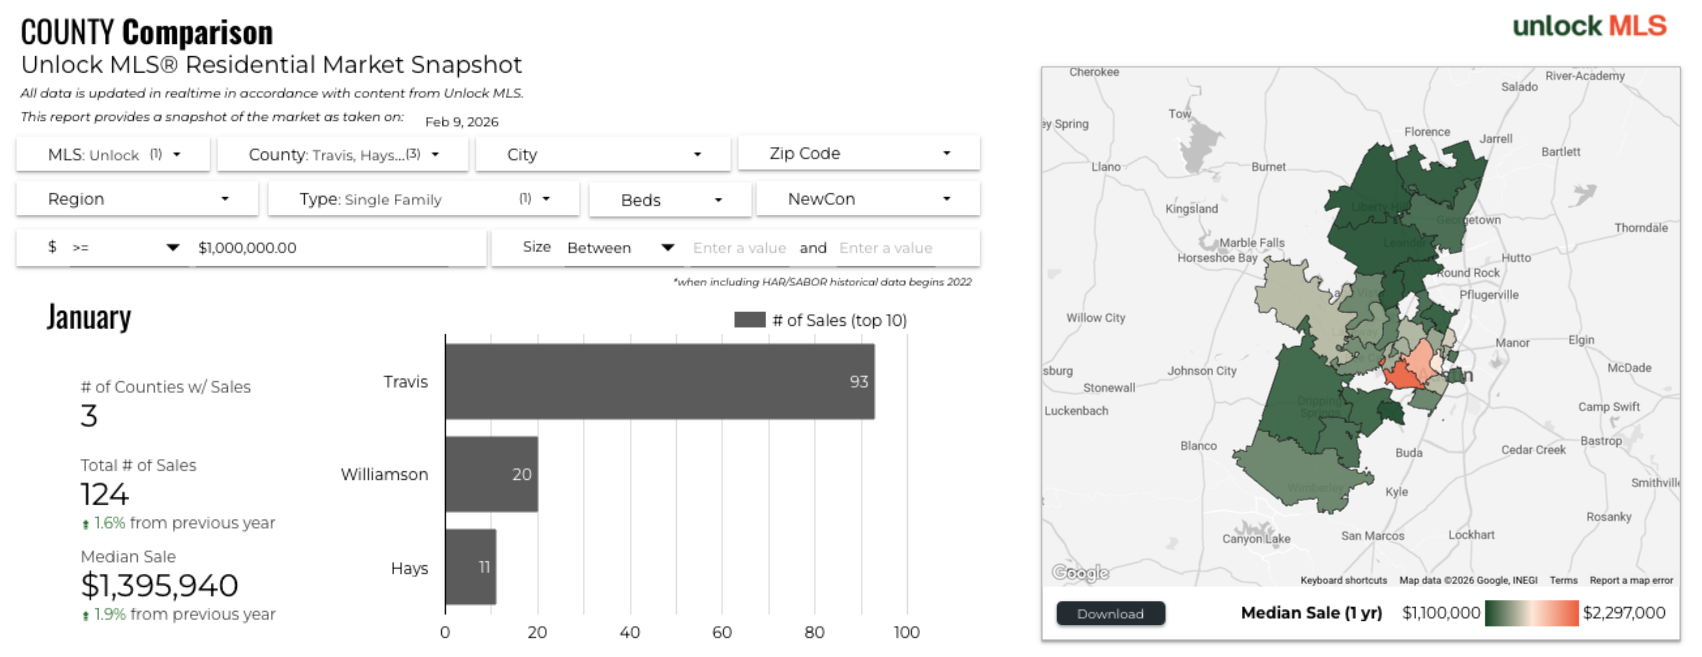
January 2026 Austin Luxury Market County Comparison
In January 2026, there were 93 homes in Travis County that sold, 20 in Williamson County and 11 in Hays County. The map to the right shows the heat map of median sold prices. The darker the color the closer to $1MM the median sold price and the lighter orange is closer to $2MM. Travis County continues to dominate the luxury market, accounting for 75% of all sales. But the Williamson County surge of 53.8% year-over-year is worth watching. As areas like Leander, Cedar Park and Georgetown continue to develop their luxury housing stock, we are seeing more buyers look north for value, particularly in the $1M to $1.3M range. Williamson County's fastest days on market (41 days median) and relatively favorable months of supply (7.2) make it an attractive proposition for buyers looking for newer construction and larger lots at a lower price per square foot. Hays County, with only 11 sales and a 96-day median days on market, remains the most challenging county for sellers in the luxury segment. The 11.82 months of supply puts it firmly in buyer's market territory, and while the median price looks strong at $1,500,000, the small sample size means a few high-end transactions can skew that number.
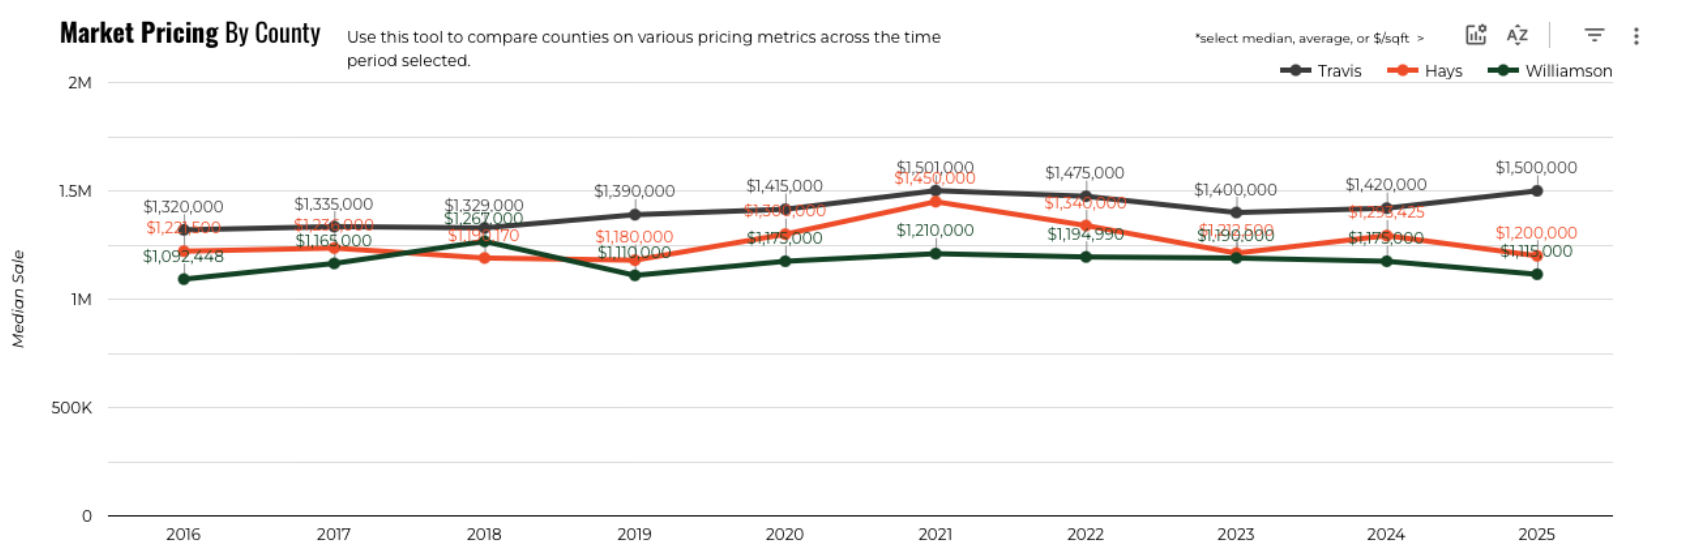
Median Pricing by County
Here is a 10 year history of the median price of luxury homes separated by County. Travis County is the dark grey line, which is on top. Hays is the orange line and Williamson County is the dark green line (bottom of the chart). In January 2026, Travis County posted a median of $1,500,000, Hays County came in at $1,200,000 and Williamson County at $1,115,000. Over the last decade, Travis County has consistently commanded the highest median pricing for luxury homes, though Hays County has shown notable price appreciation in recent years.
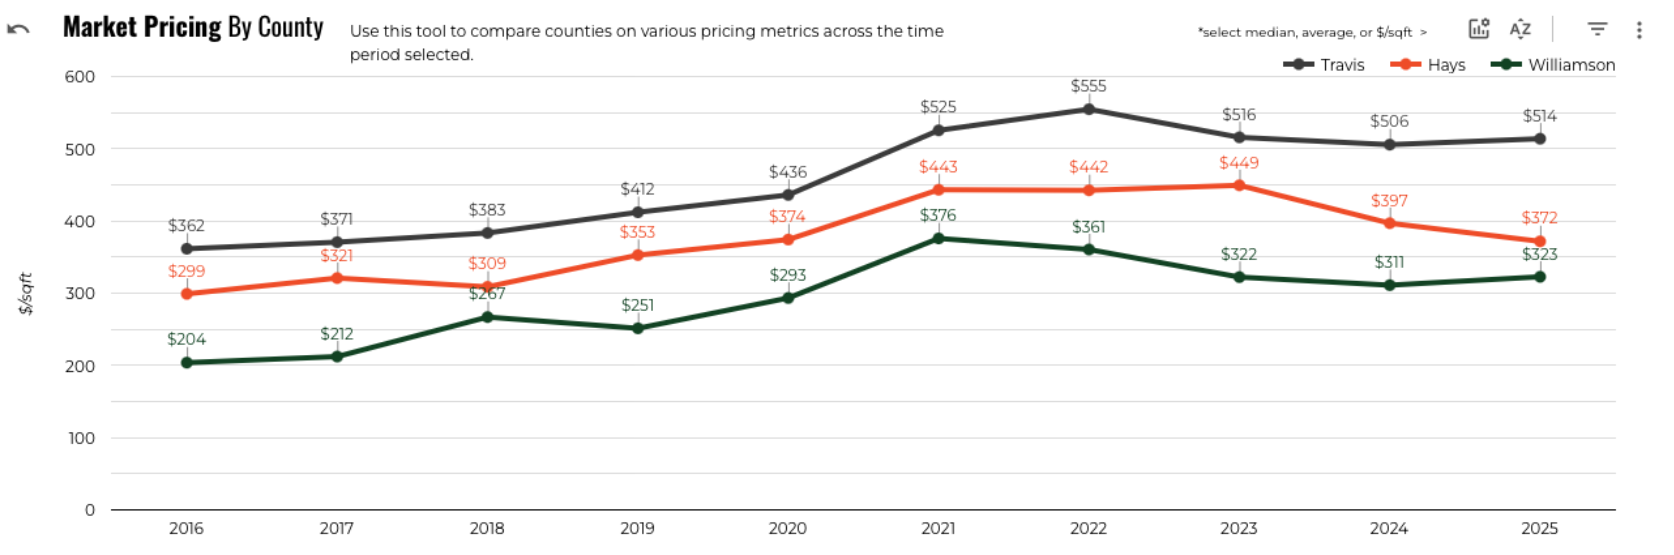
Luxury Average Price Per Square Foot
This chart compared the average price per square foot of a luxury home separated by county from 2016 to 2026. Travis County continues to lead pricing, followed by Hays County and then Williamson County.
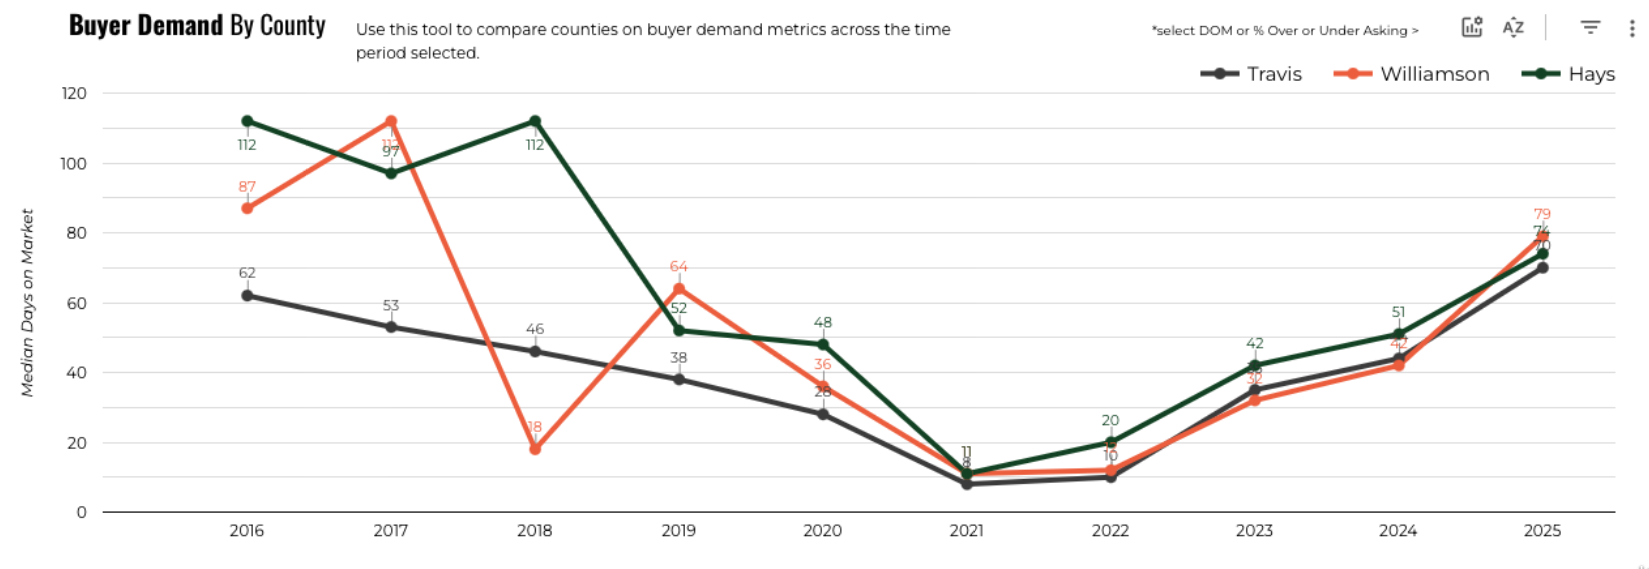
Austin Luxury Median Days on Market by County
Here is a chart of the median days on market by county from 2015 to 2026. In January 2026, Travis County sat at 70 days, Hays at 74 days and Williamson at 79 days. We are seeing a notable divergence in absorption rates across counties, with Williamson County improving the most dramatically.
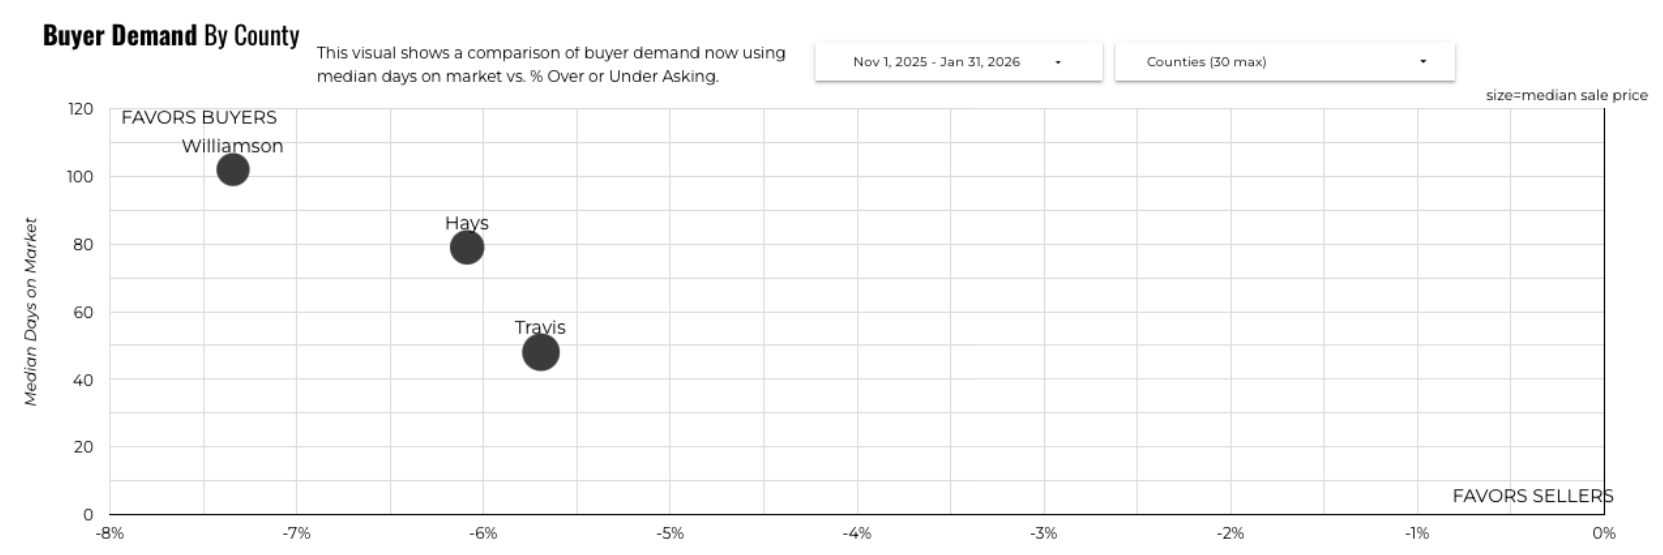
Buyer Demand by County - 3 Month History
In Travis County we see market conditions that are more balanced while Williamson County is the most favorable for buyers on a DOM basis, and Hays County remains the most challenging for sellers. In Travis County, the median time to sell was 48 days with a median price of $1,470,000. Buyers were able to negotiate 5.69% off list prices. In Williamson County, the median time to sell was 102 days with a median price of $1,135,000. Buyers were able to negotiate 7.34% off list prices. In Hays County, the median time to sell was 79 days with a median price of $1,233,274. Buyers were able to negotiate 6.09% off list prices.
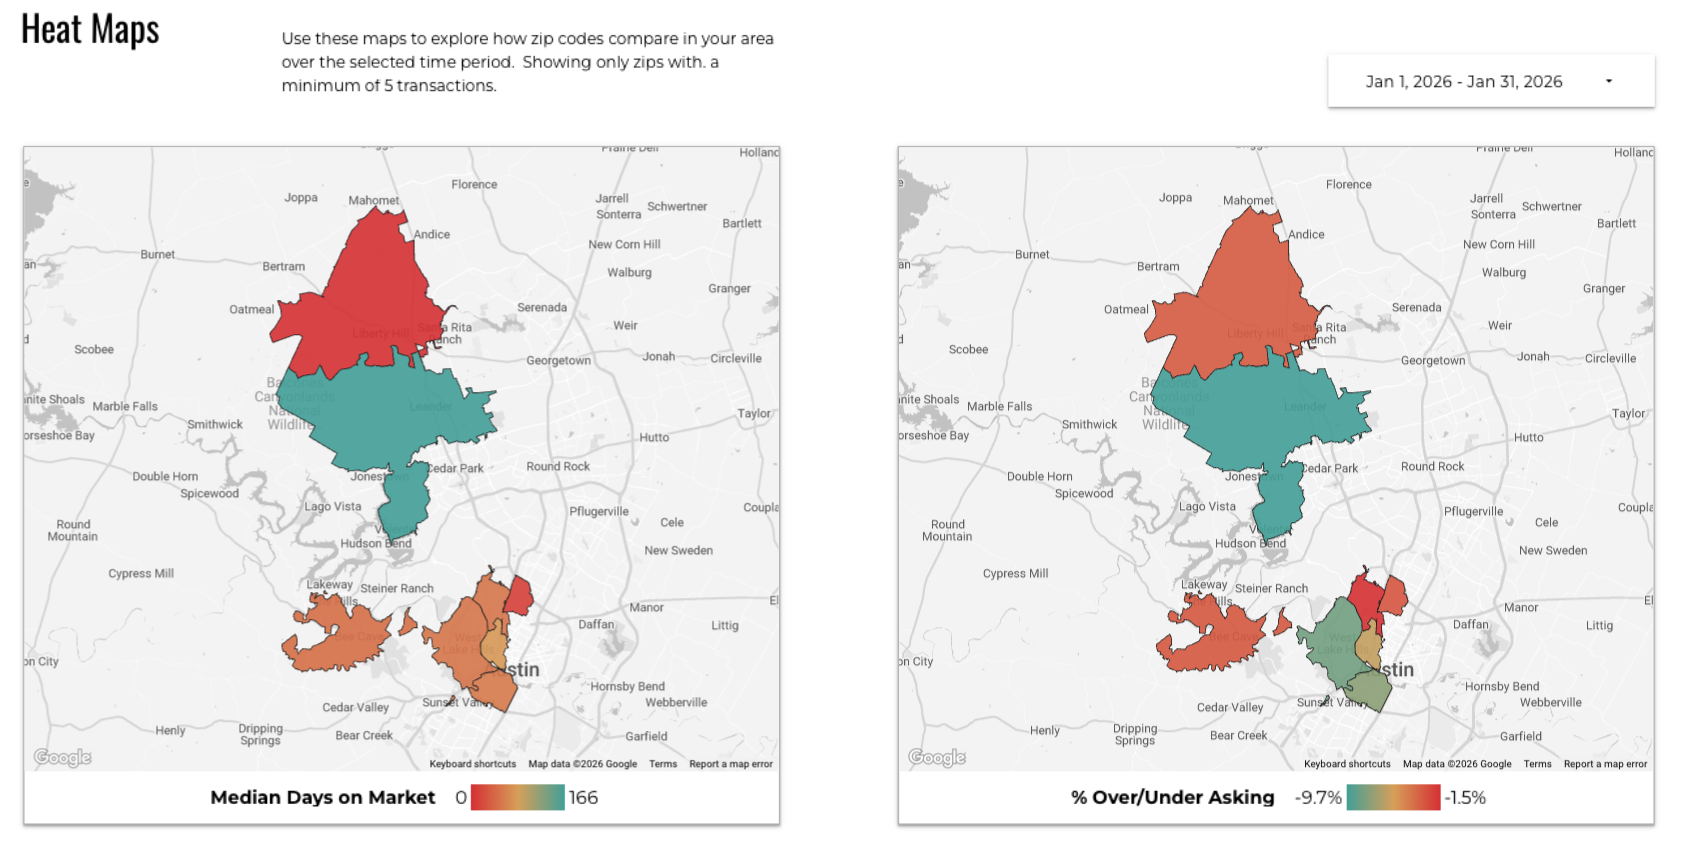
Heat Maps - Luxury Median Days on Market and % Over/Under Asking
This first set of maps shows the median days on market by area. The blue is the longest days on market and the red is the shortest median days on market. The chart to the right shows the % under asking. The blue shows a higher discount negotiated by buyers and red shows the least discount negotiated by buyers.
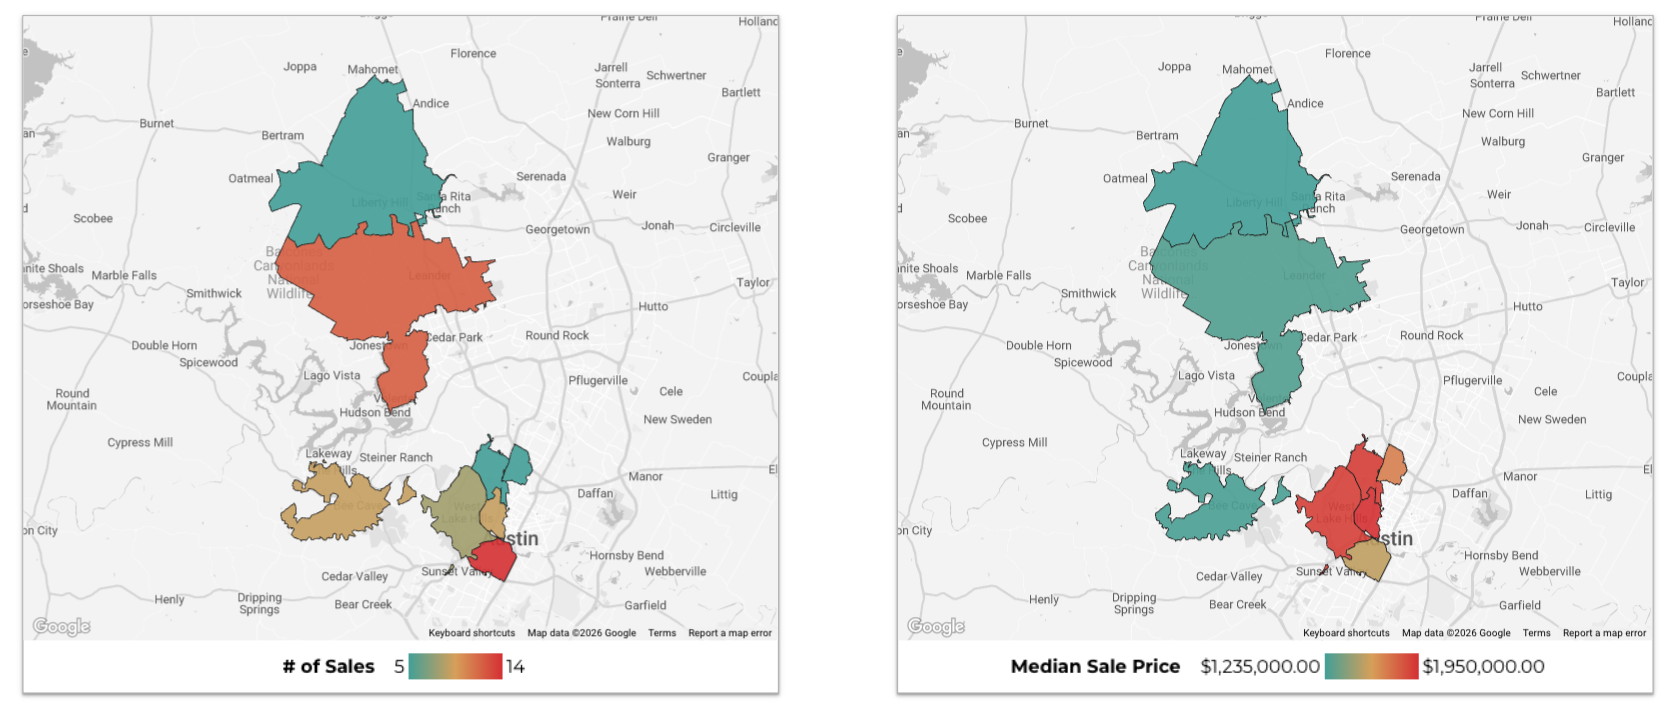
Number of Sales and Median Sale Price
These charts show the concentration of luxury home sales (the greatest number of luxury sales is located in Central and West Austin) and the median sales price. The highest median sales prices for luxury homes are again found in Central and West Austin. In January, the top zips by volume were 78704 (14 sales), 78641 (12 sales), 78703 and 78738 (9 sales each) and 78746 (8 sales).
Austin Luxury Home Sales January 2026
Here is some additional data on the 124 luxury homes that sold in Travis, Williamson and Hays Counties in January 2026. These 124 homes sold for $1 million or more.
- 2 luxury homes that sold were Foreclosures (Bank Owned)
- 1 luxury home was Waterfront
- 58 luxury homes were in the Austin ISD
- 8 luxury homes were in the Dripping Springs ISD
- 9 luxury homes were in the Eanes ISD
- 2 luxury homes were in the Georgetown ISD
- 0 luxury homes were in the Hays ISD
- 12 luxury homes were in the Lake Travis ISD
- 16 luxury homes were in the Leander ISD
- 0 luxury homes were in the Round Rock ISD
- 1 luxury home was in the San Marcos ISD
- 3 luxury home was in the Wimberley ISD
- 14 luxury homes were in Gated Communities
- 67 luxury homes were in HOA’s
- 56 luxury homes had Pools
- 32 luxury homes were on Septic Systems
- 93 luxury homes that sold were located in Travis County
- 18 luxury homes that sold were located in Williamson County
- 13 luxury home that sold were located in Hays County
Source: ACTRIS, Home Sales in Travis, Williamson and Hays County Over $1 Million in January 2026
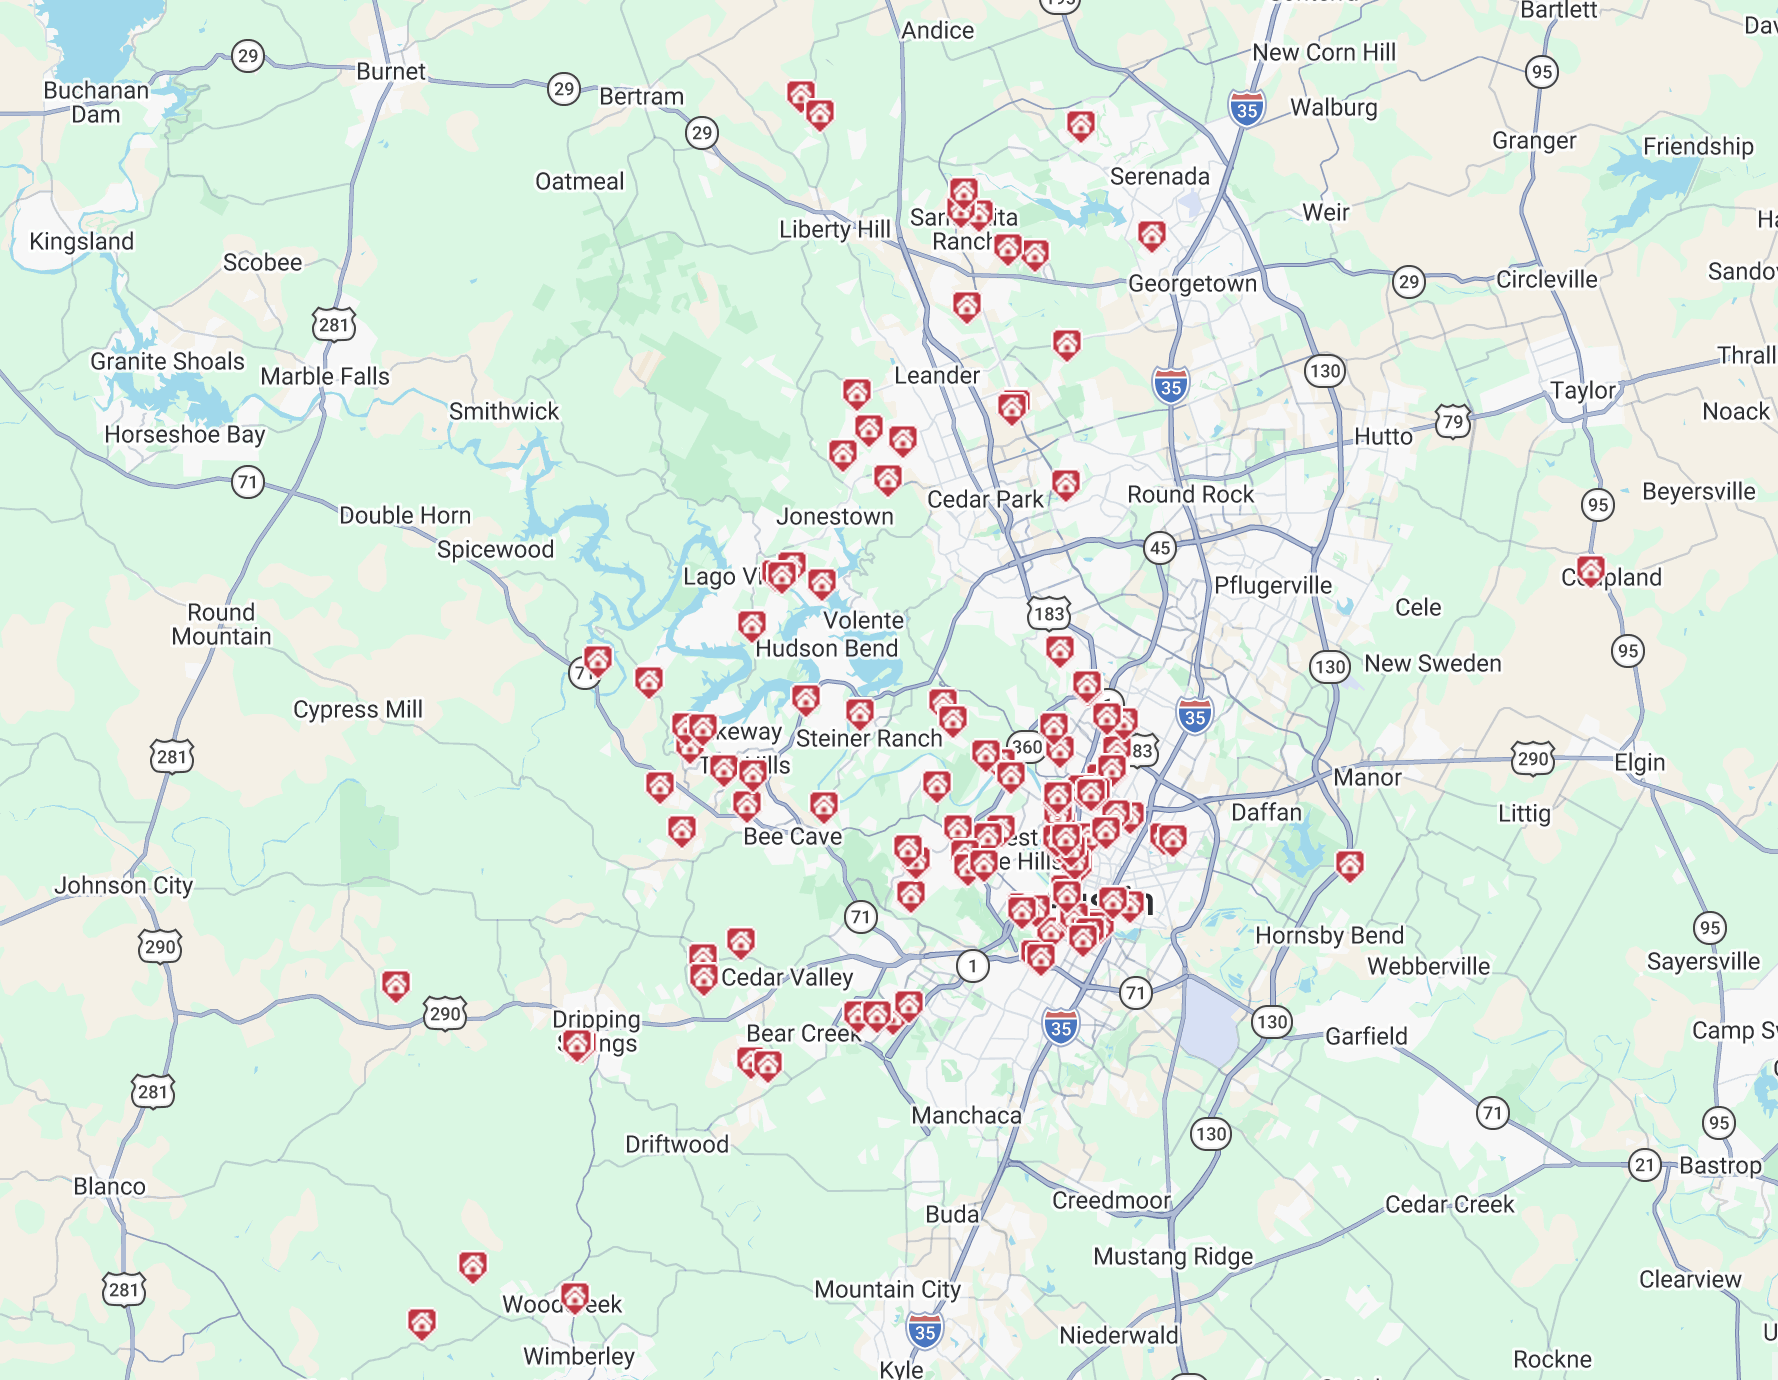
January 2026 Austin Luxury Home Sales Map
All of the Austin luxury single family homes that sold in January 2026 were west of 130 (with the exception of 2), south of 138 and north of 150 (with the exception of 4). Here is a map of the 124 luxury homes that sold in Austin in January 2026.
January 2026 Luxury Real Estate Price Report - Strictly Numbers
For those of you who prefer to see the actual numbers, we've listed the figures for January 2026 Austin area luxury home sales below. The most expensive luxury home that sold in January 2026 sold for $5,225,000 and the least expensive luxury home sold for $1,005,000. Austin luxury homes ranged in size from 1,032 sqft to 8,521 sqft with an average size of 3,779 sqft. The average price per square foot for a luxury home that sold in Austin in January 2026 was $475.19 with the lowest being $175.76/sqft and the highest being $1,188.27/sqft. It took, on average, 89 days to sell a luxury home in Austin and sellers received, on average, 91.08% of their original list prices.
| Min | Max | Average | Median | |
| Beds | 1 | 9 | 4 | 4 |
| Baths | 1 | 9 | 4 | 4 |
| SqFt | 1,032 | 8,521 | 3,799 | 3,664 |
| List Price | $946,861 | $5,750,000 | $1,810,433 | $1,499,000 |
| LP/SqFt | $185.84 | $1,286.35 | $503.36 | $463.85 |
| Sold Price | $1,005,000 | $5,225,000 | $1,705,595 | $1,420,000 |
| SP/SqFt | $175.76 | $1,188.27 | $475.19 | $439.10 |
| SP/LP | 73% | 108% | 94.88% | 95% |
| SP/OLP | 56% | 108% | 91.08% | 93% |
| ADOM | 1 | 497 | 89 | 53 |
| Search Criteria | |
|---|---|
| Status | Sold |
| Sold Date | January 2026 |
| Property Type | Single Family Homes $1MM+ |
| Number Sold | 124 |
| Source | ABoR Sales Data |
| Area | Travis, Hays, Williamson Counties |
Luxury Homes for Sale Around Austin
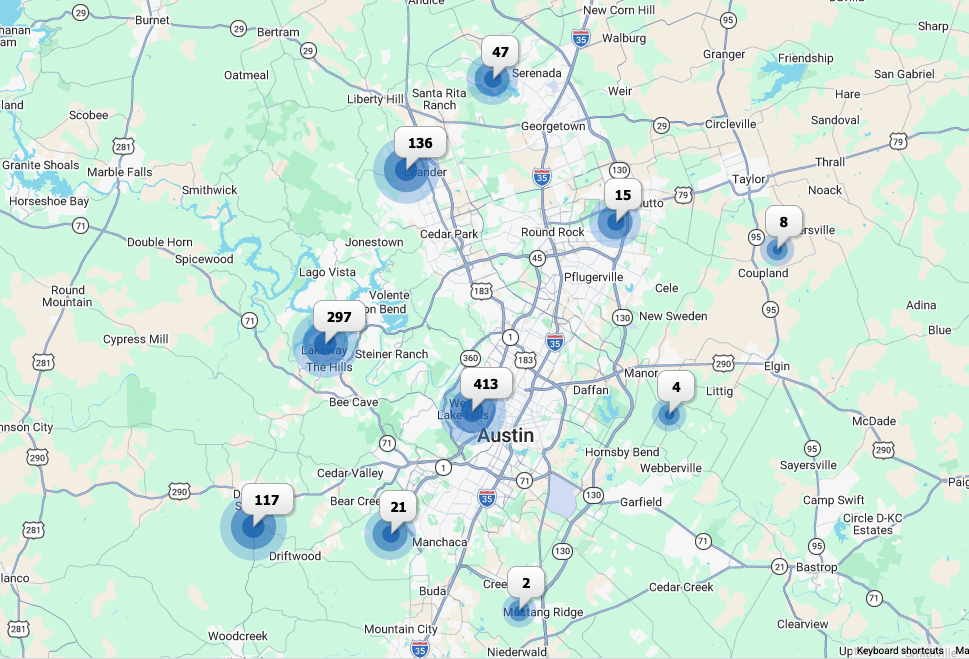
Here is a map of the 1,093 luxury homes for sale in the Austin area as of February 9, 2026. 790 are located in Travis County, 152 in Williamson County and 151 in Hays County. Here is a map.
Tips for Buyers
Negotiate from the data, not the vibe. With closings averaging about 5% under list and 7-9% under original list market-wide, assume there is room to move. Then, calibrate that assumption to the specific neighborhood or zip code and the home's days on market. A home that has been on the market for 90+ days has a very different negotiation profile than one that just listed. Target the 'softer' tiers strategically. If you want real leverage, shop where supply is highest. The $1.4M+ tier at 10 months of supply is where you have the most options and the most room to negotiate. Use that inventory data as justification for your price and terms. Look north for value. Williamson County's 53.8% increase in luxury sales and 41-day median DOM is not a fluke. Leander, Georgetown and Cedar Park are offering newer construction with larger lots at significantly lower price-per-foot compared to Travis County ($297/sqft vs $534/sqft). If location flexibility is on the table, the northern suburbs represent real value in the luxury space right now. Use price per square foot as your compass. The 9.2% increase in median price per square foot tells us that buyers are placing a premium on quality and location. Rather than focusing solely on the sticker price, evaluate what you're getting per square foot relative to comparable properties in that zip code. This metric will help you identify true value versus overpriced listings. Ask for terms, not just price. In a market where sellers are commonly accepting offers below list, you can often improve the deal via repairs, rate buydowns, closing costs, or specific performance timelines, especially on listings that have already had a price reduction.
Tips for Sellers
Price to win the first 7-8 weeks. With the median time to sell at 53 days, you have roughly two months to capture a buyer at your initial list price. Overpricing and expecting to "negotiate down" is a losing strategy when buyers have 1,003 active listings to choose from. Avoid the slow-bleed reduction pattern. When reductions are needed, one decisive correction beats multiple small cuts. A home that drops its price three times sends a signal to the market that the seller is unsure of the value, which invites even lower offers. Stage and condition matter more in luxury right now. When buyers have options (and the market is clearing below list), they will pay up for "turnkey" properties and discount anything that feels like a project, even if the comps look similar. Know your micro-market and message it. For example, 78704 (South Austin) posted 14 sales at $714/sqft with a 27.7% median price increase, while 78746 (West Lake Hills) saw buyers negotiating 8.29% off list. Those are two very different market dynamics within the same luxury tier. Build your marketing narrative around what makes your property scarce in your specific micro-market, whether that's views, walkability, school zone, remodel quality, or lot characteristics. Understand the inventory math in your price tier. If you're listed at $1.4M+, you're competing against 633 active listings for a pool of buyers that purchased 60 homes last month. That's 10.6 listings per sale. In the $1.2M-$1.39M range, it's 178 listings for 17 sales, or about 10.5 per sale. At $1M-$1.19M, it's 192 listings for 29 sales, or 6.6 per sale. The lower luxury band has meaningfully less competition per buyer.
The Bottom Line
For buyers: This is a market where patience and precision pay off. You don't need to overpay broadly when the averages show 5-7% under asking and the months of supply clearly favor you in most price ranges. The best strategy is to get hyper-local on comps, pursue leverage in the $1.4M+ tier (highest supply), and negotiate on both price and terms, especially when DOM starts to climb. If you're open to looking north into Williamson County, you'll find some of the best value-to-quality ratios in the luxury market right now. For sellers: You can absolutely sell right now. Activity is up 4.2% year-over-year and homes are selling 25% faster than a year ago. But you must respect buyer expectations. The winning play is correct pricing early, premium presentation, and a proactive plan if you don't see traction in the first few weeks. The market has 981 active luxury listings and buyers know it. Differentiation through pricing, condition and marketing is how you stand out.
Considering Buying or Selling a Luxury Home in Austin?
Our team of Austin luxury real estate market specialists know the market well and can help you get the best deal possible. For more info about our team and how we work, check out our Austin Home Buyers and our Austin Home Sellers sections. Then, call us at (512) 872-8323 or email us at info@11OaksRealty.com to schedule a consultation.
Questions About the January 2026 Austin Luxury Real Estate Price Report?
Do you have questions about the January 2026 Austin Luxury Real Estate Price Report? Call us at (512) 827-8323 or email us at info@11OaksRealty.com and we'll help you in any way we can.




Leave a Reply