
Eleven Oaks Realty is proud to present their January 2026 Austin Multi Family Real Estate Price Report measuring activity in the Austin multi family market. This report includes all multi family properties (duplex, triplex and quadplex) that sold in January 2026.
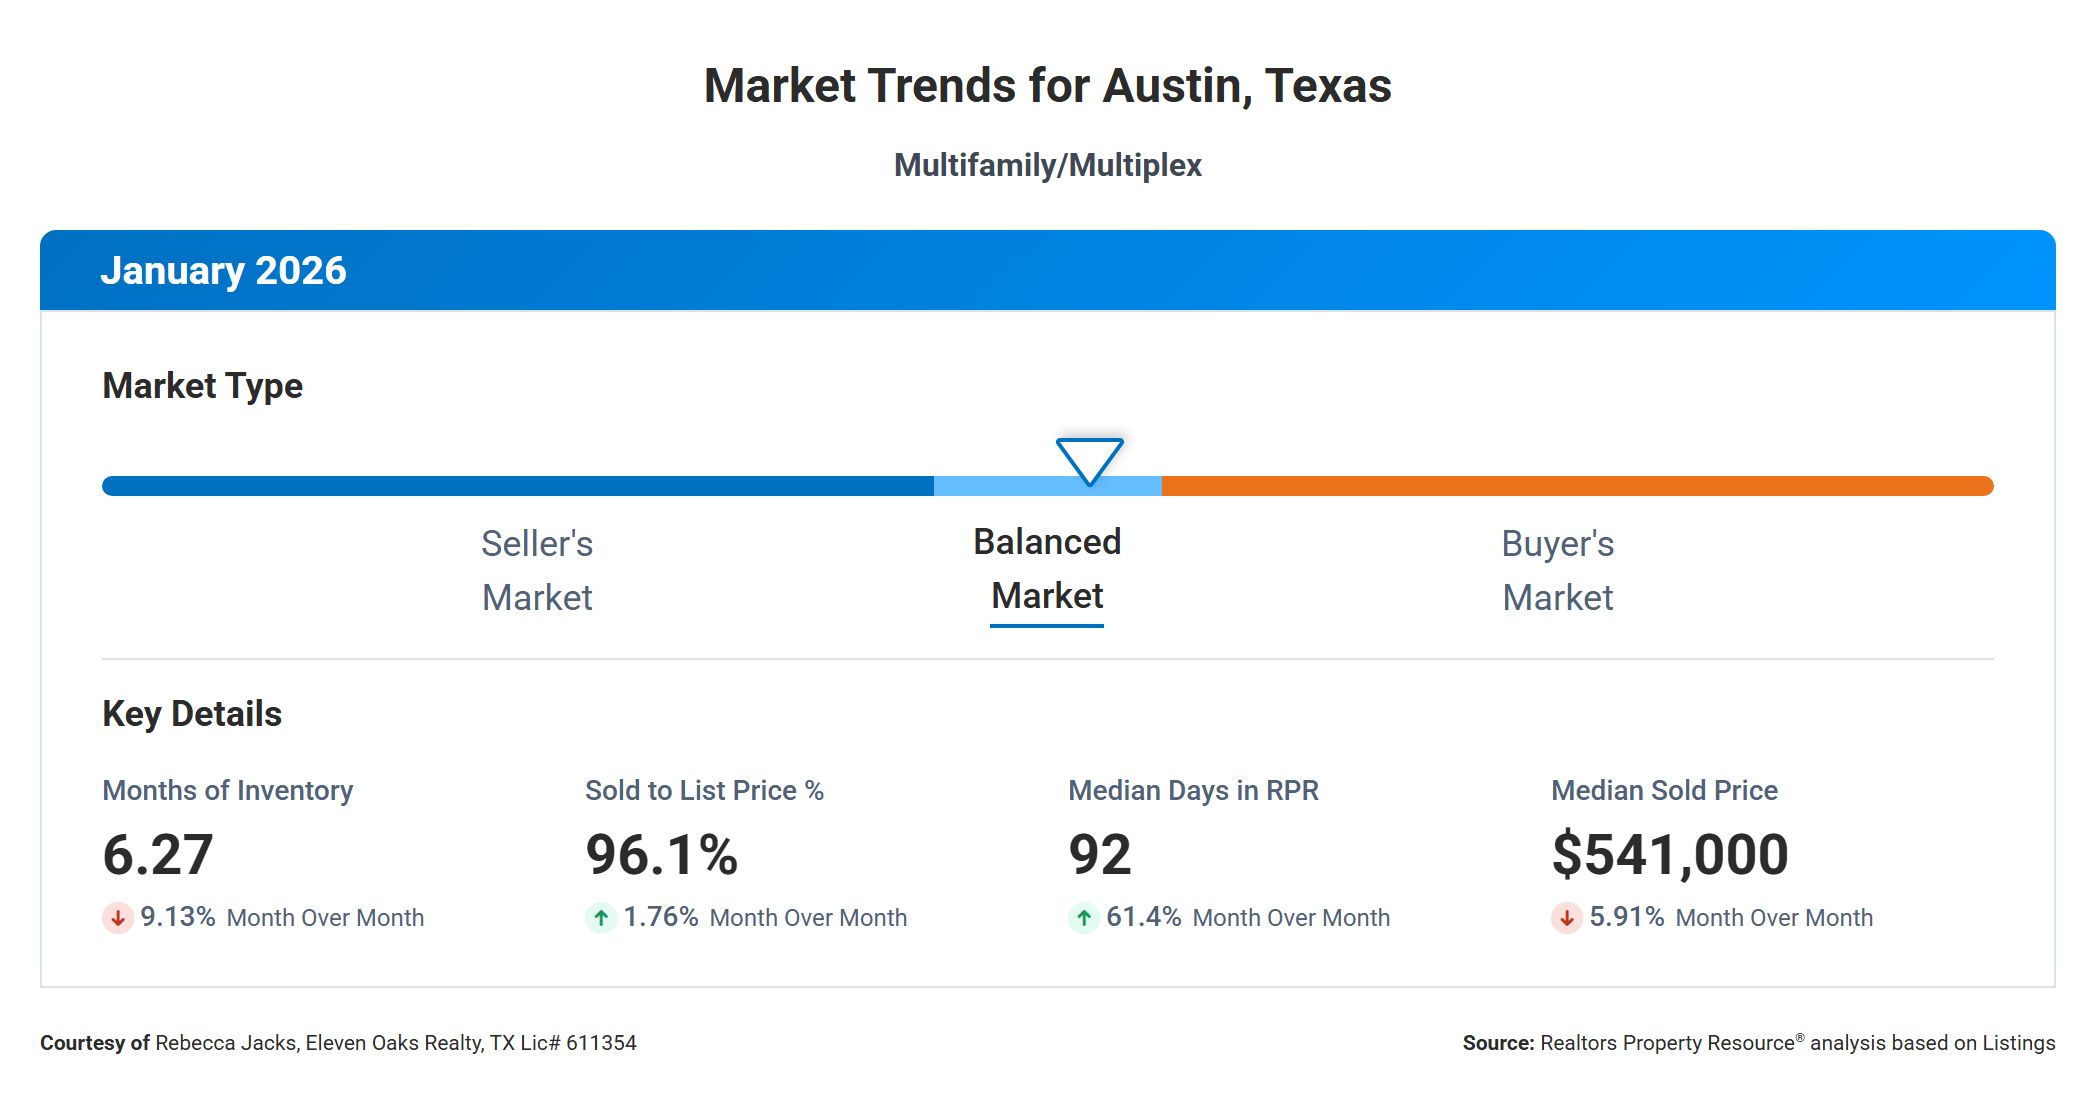
The Multi Family Market is a Balanced Market
In January 2026, there were 6.27 months of inventory on the multi family market, showing a 9.1% decrease in month over month comparisons. The average sold to list price was 96.1%, up 1.8% in month over month comparisons. The median time to sell a multi family home was 92 days, up 61.4% in month over month comparisons. The median sold price was $541,000, down 5.9% in month over month comparisons.
What These Numbers Mean for Buyers
You have meaningful leverage. The median sold price fell 13.4% year over year to $541,000, and total sales volume was flat despite fewer closings. Sellers are adjusting expectations, and that shift creates room for buyers to negotiate from a position of strength. Time is on your side. The median time to sell doubled to 92 days (up 100% YoY), and the average days on market in the sales table was 114 days. Properties are sitting longer, which means less competition and more opportunity to conduct thorough due diligence before making a move. Inventory levels still favor deliberate buying. At 6.27 months of inventory, the market sits in balanced territory but closer to a buyer’s market threshold. Active listings are down slightly year over year (139 vs 150), but the pace of sales means there’s no shortage of options. Price per square foot remains stable. The median price per square foot rose slightly to $235 (+4.9% YoY), which signals that unit-level values have held up even as headline prices declined. Buyers focused on long-term investment metrics should find that encouraging. Fewer contracts are being written. New pending listings dropped 30.4% year over year (16 vs 23), which means less buyer competition for properties that do come to market.
What These Numbers Mean for Sellers
Headline prices have pulled back, but deals are happening. The median sold price declined 13.4% year over year to $541,000, but the sold-to-list ratio actually improved to 96.1% (up from 94.69% a year ago). Properties that are priced correctly are selling closer to their asking price than they were last January. Marketing timelines are significantly longer. The median time to sell jumped to 92 days (up from 46 days a year ago). If you need to sell within a specific window, build in substantially more lead time than you might expect. Volume and activity are down. Only 13 properties closed in January (down 23.5% YoY), and total dollar volume was flat at $6.95 million despite a year of price adjustments. The pool of active buyers is smaller, which means presentation, pricing, and condition all carry more weight. Competition for buyers is real. With 139 active listings and only 16 new contracts written in January, buyers have plenty to choose from. Your listing needs to stand out on price, condition, and terms to attract one of those contracts. The good news: well-priced properties are clearing closer to ask. The 96.1% sold-to-list ratio is the best in recent months, suggesting that sellers who price to the current market (rather than the 2024 market) are being rewarded with tighter negotiations.
Median Price Down 13.4%
In January 2026, the median price for a multi family property in Austin was $541,000 compared to $625,000 in January 2025 showing a 13.4% decrease in year over year numbers. Last month the median sold price for a multi family home was $575,000, showing a 5.9% decrease in month over month comparisons.

23.5% Decrease in Number of Sold Properties
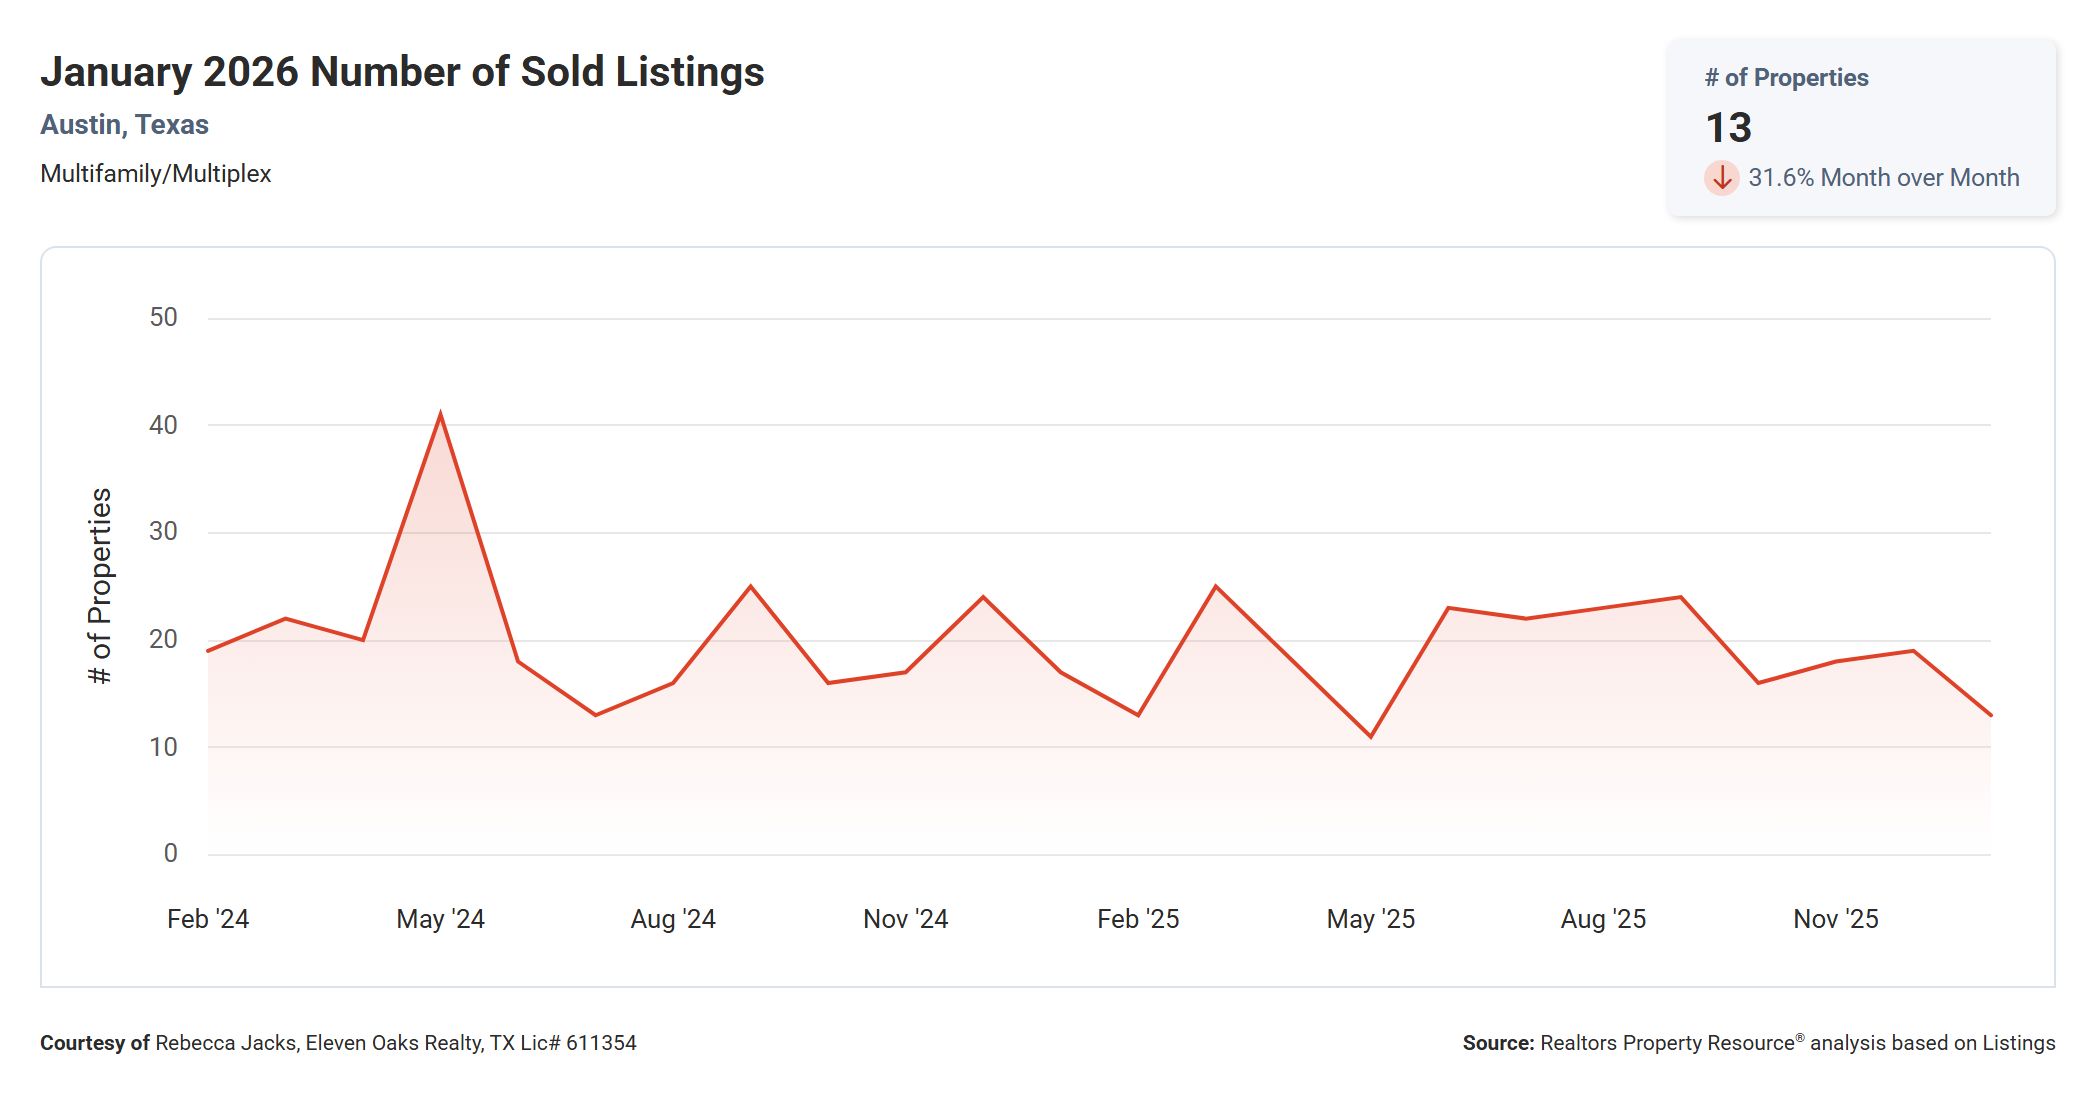
In January 2026, there were 13 multi family properties that sold compared to 17 in January 2025, showing a 23.5% decrease in year over year numbers. Last month there were 19 multi family properties that sold, showing a 31.6% decrease in month over month comparisons.
1.5% Increase in Average Sold to List Price
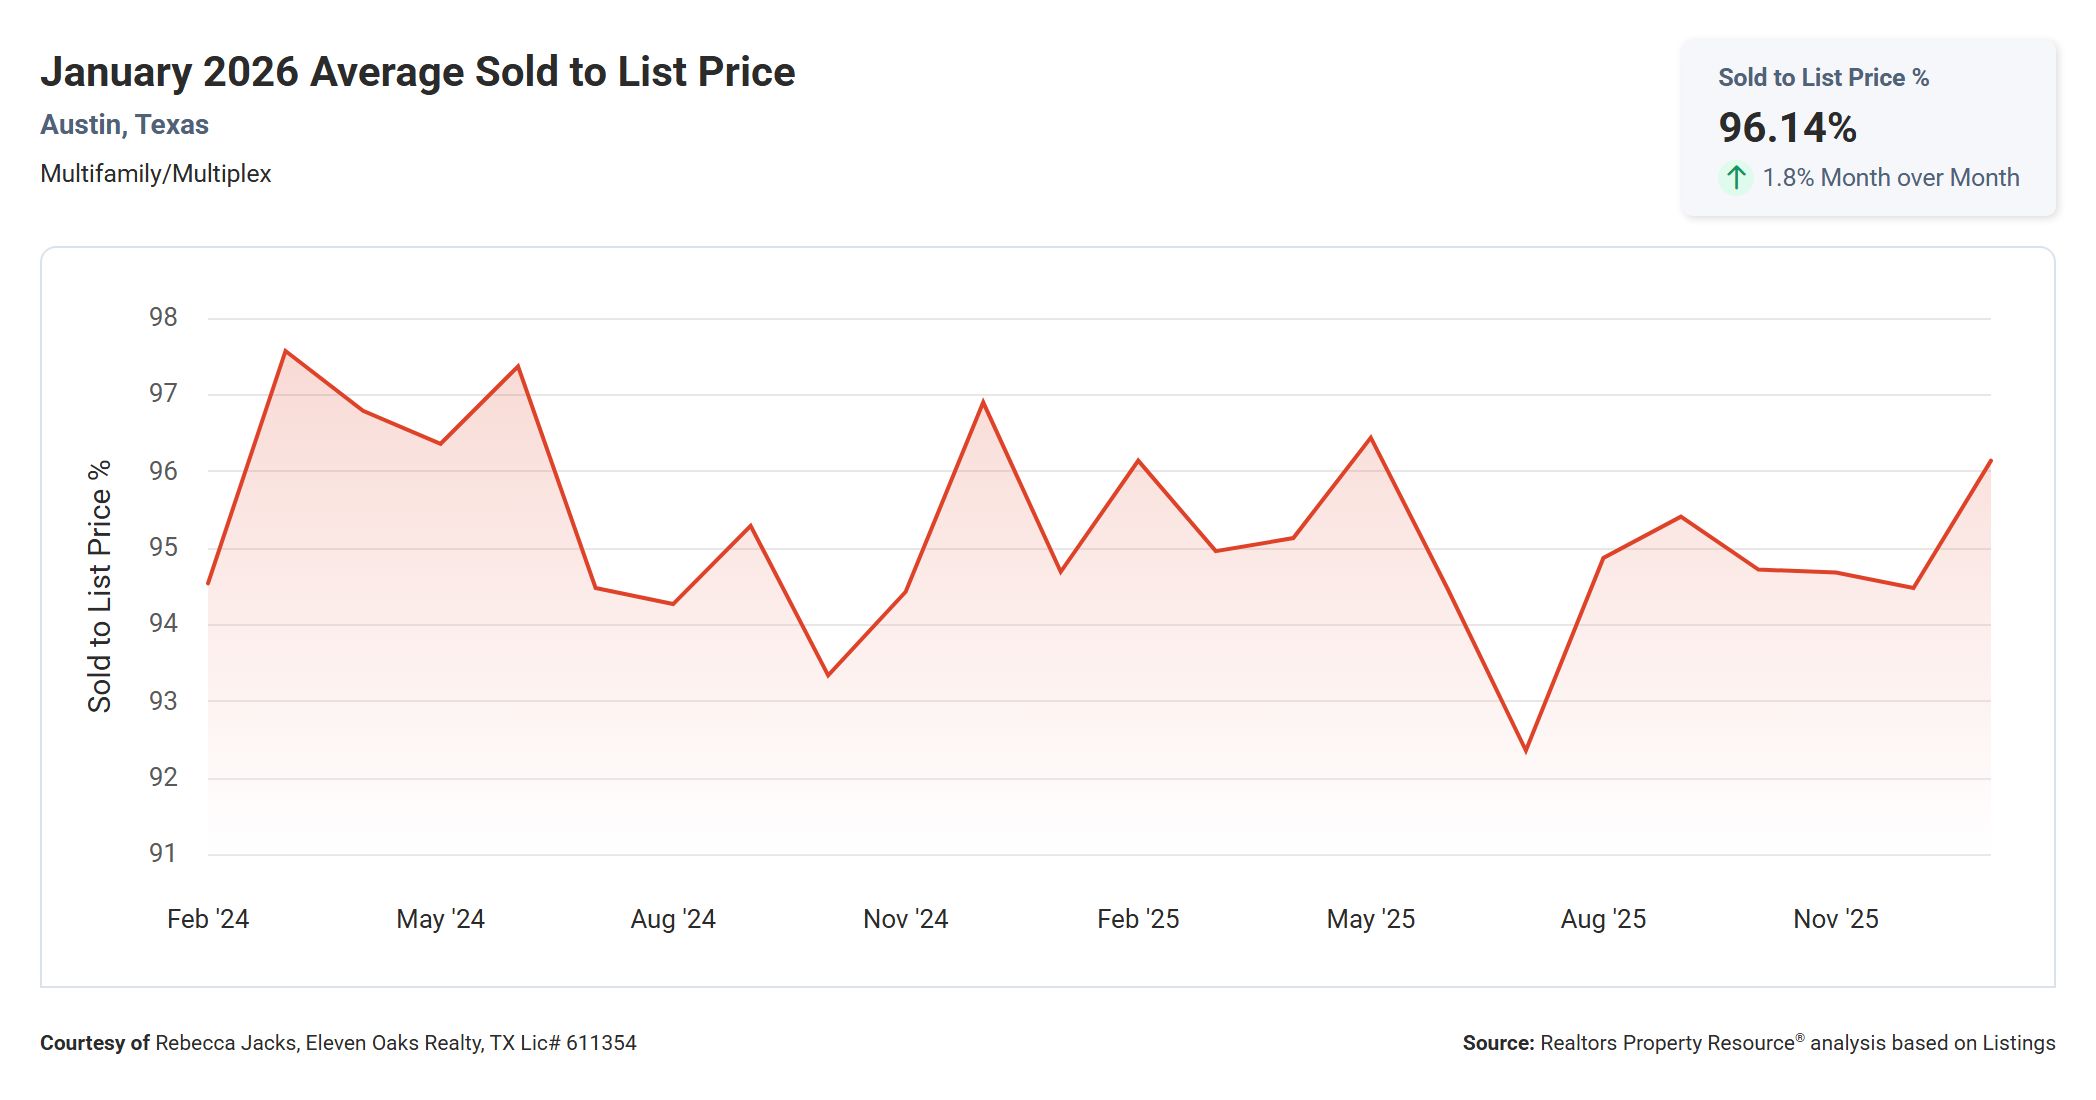
In January 2026, the average sold to list price for a multi family property in Austin was 96.14% compared to 94.69% in January 2025 showing a 1.5% increase in year over year numbers. Last month the average sold to list price was 94.48%, showing a 1.8% increase in month over month comparisons.
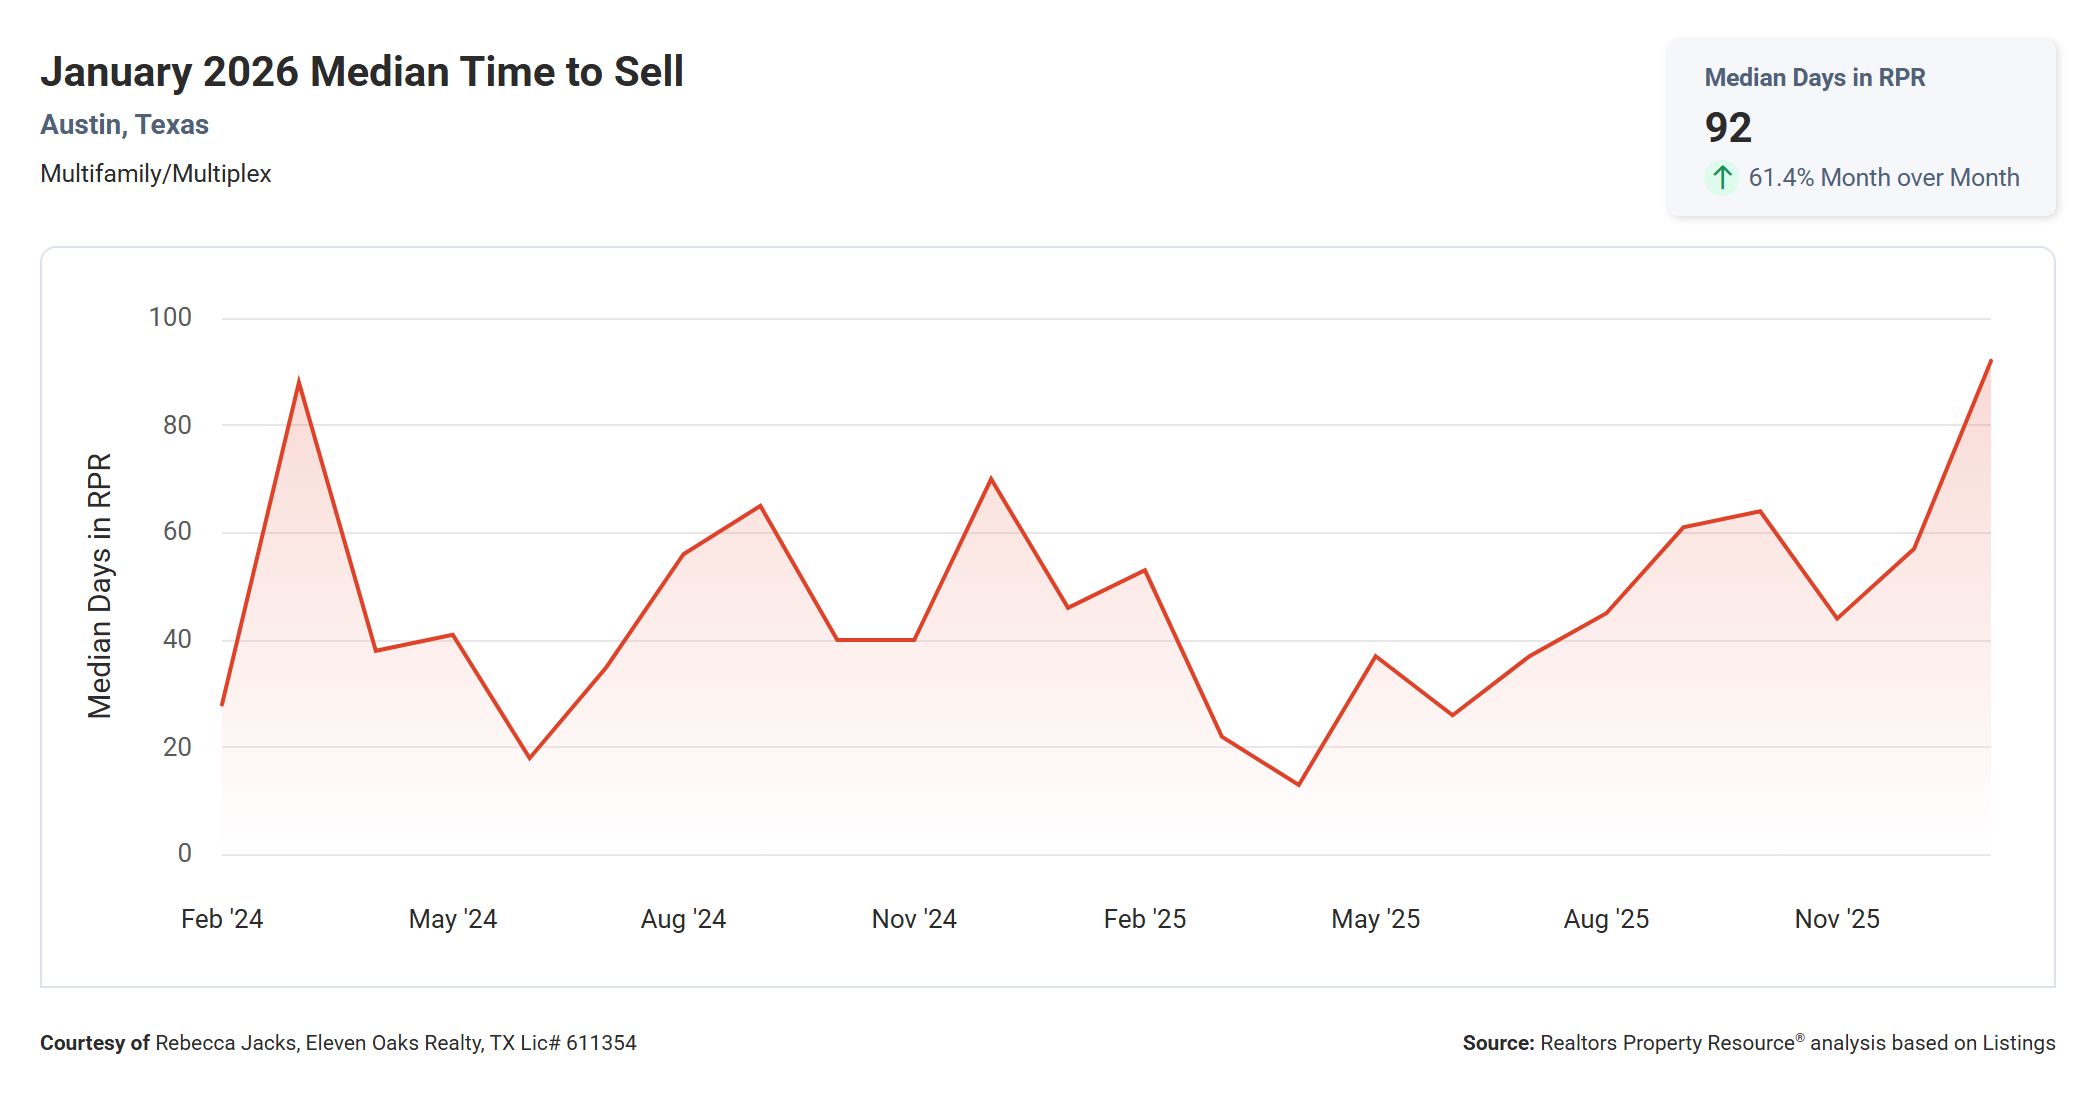
100% Increase in Median Time to Sell
In January 2026, the median time to sell a multi family property in Austin was 92 days compared to 46 days in January 2025, showing a 100% increase in year over year numbers. Last month the median time to sell a multi family property was 57 days, showing a 61.4% increase in month over month comparisons.
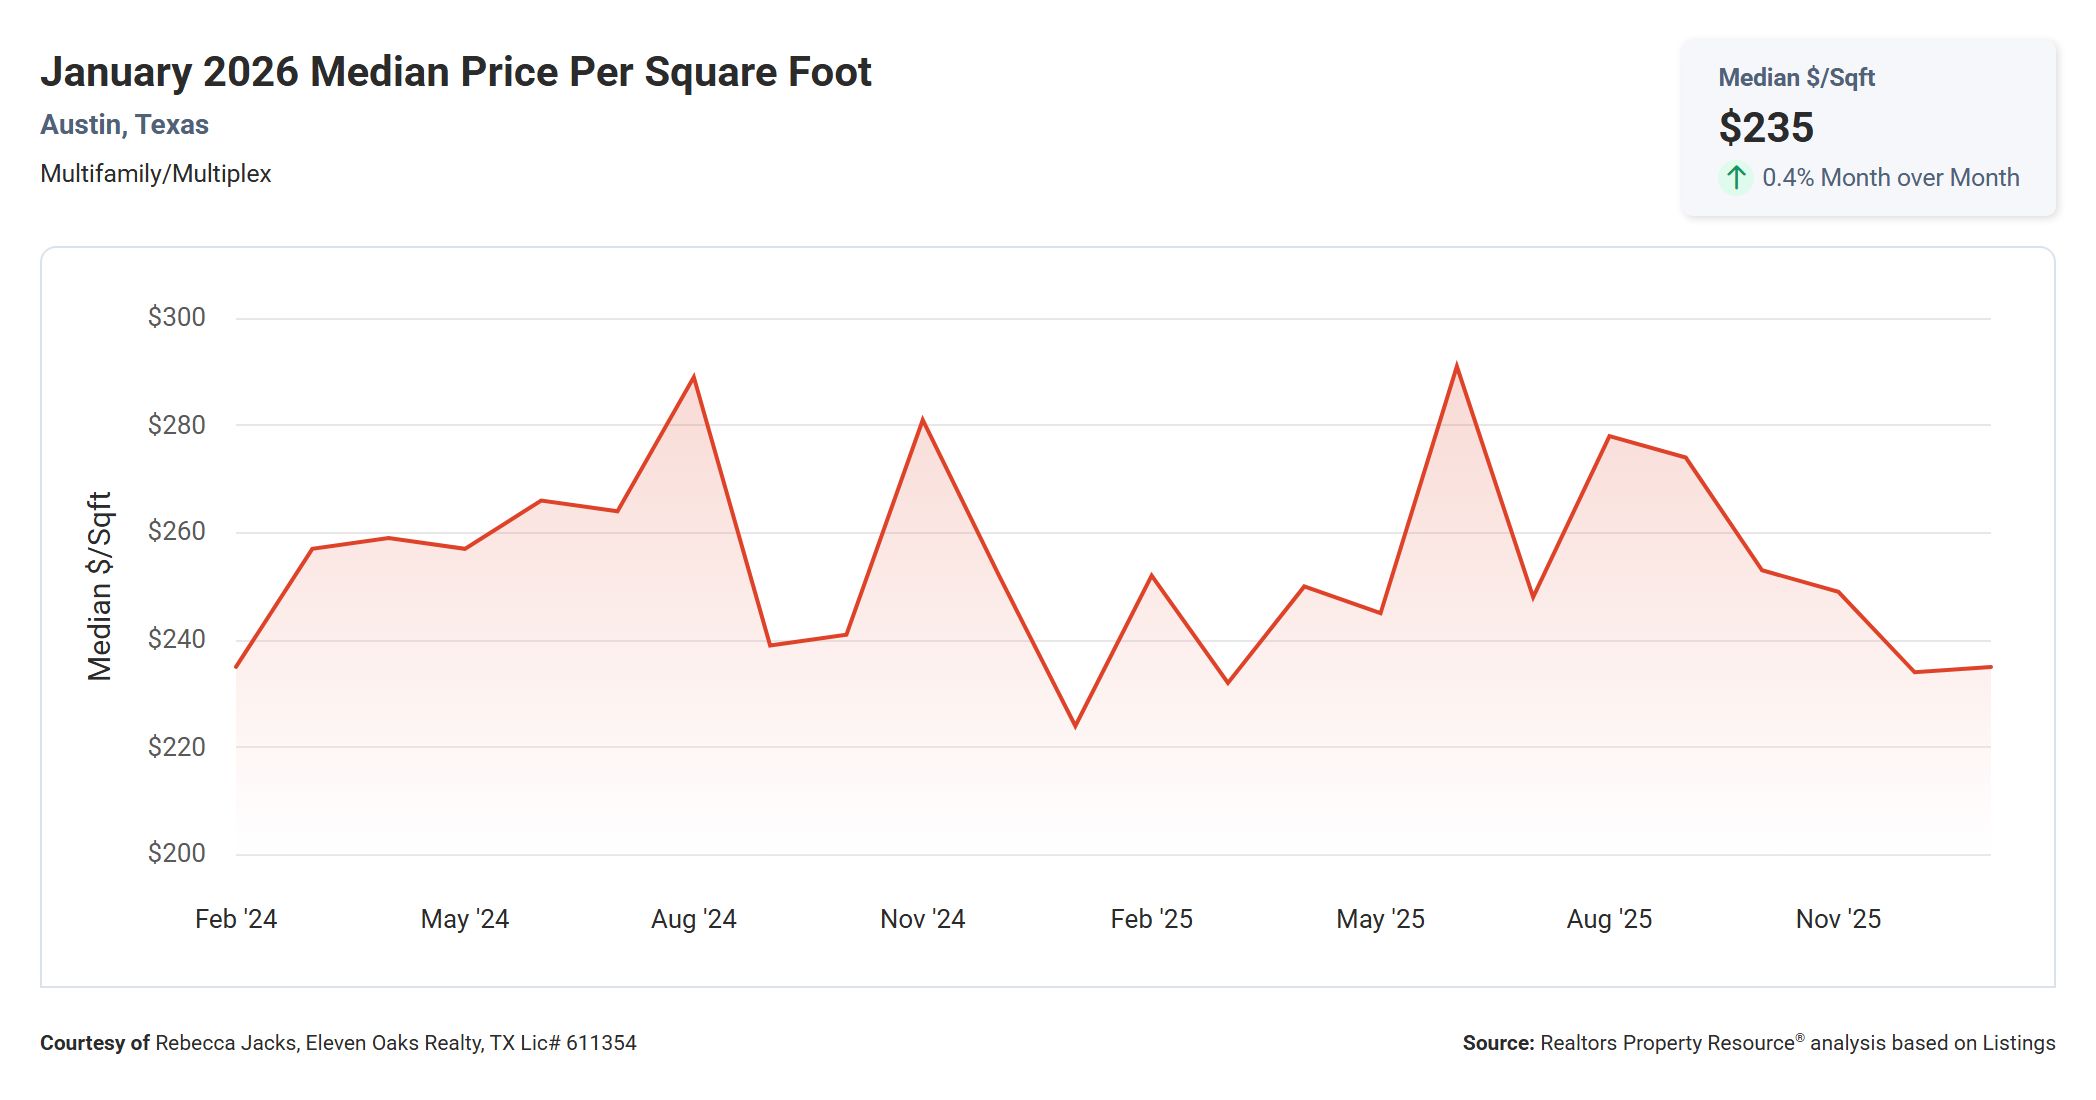
4.9% Increase in Median Price Per Square Foot
In January 2026, the median price per square foot for a multi family property in Austin was $235 compared to $224 in January 2025, showing a 4.9% increase in year over year numbers. Last month the median price per square foot was $234, showing a 0.4% increase in month over month comparisons.
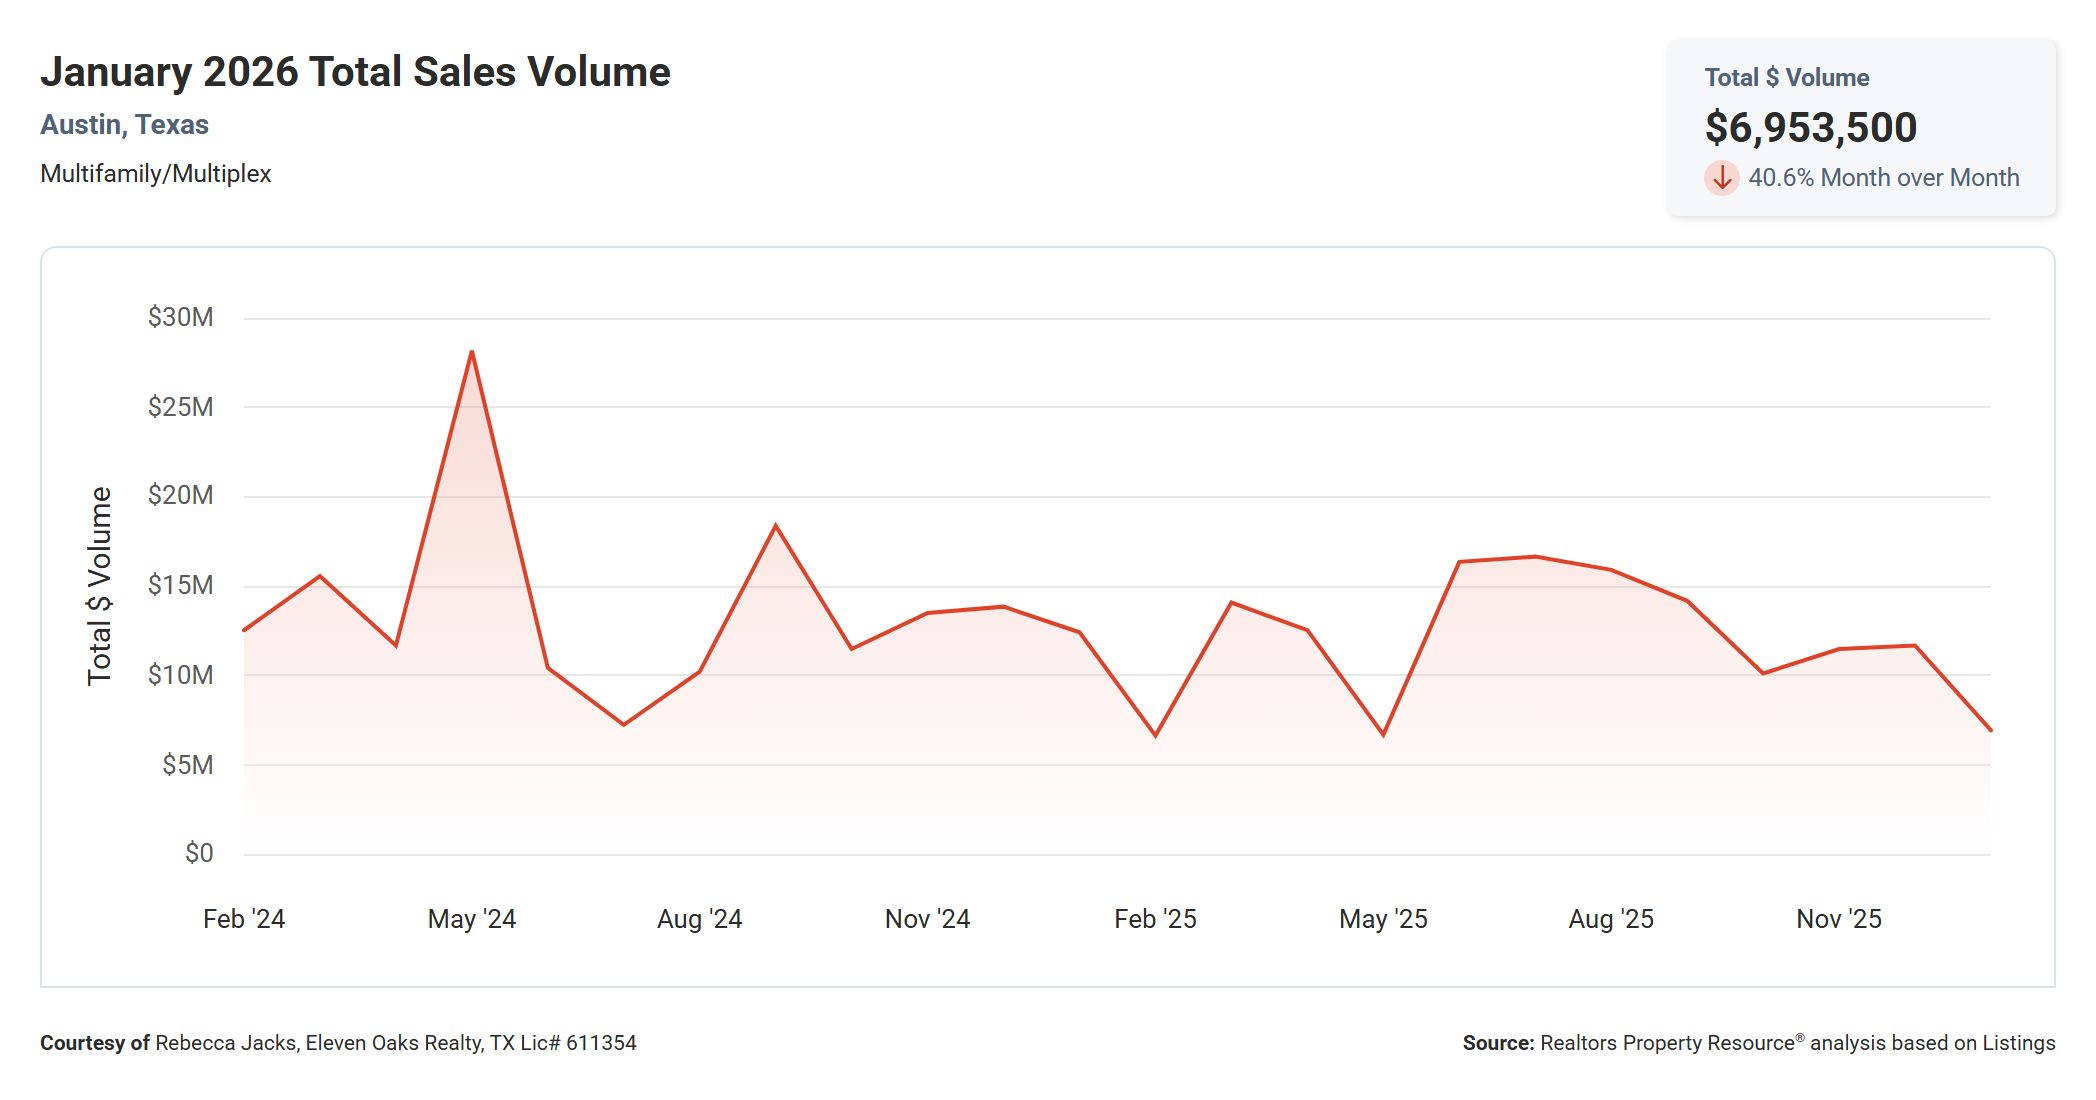
78.9% Decrease in Total Sales Volume Year Over Year
In January 2026, the total sales volume for multi family properties in Austin was $6,953,500 compared to $12.44MM in January 2025, showing a 78.9% decrease in year over year numbers. Last month the total sales volume was $11.7MM, showing a 40.6% decrease in month over month comparisons.
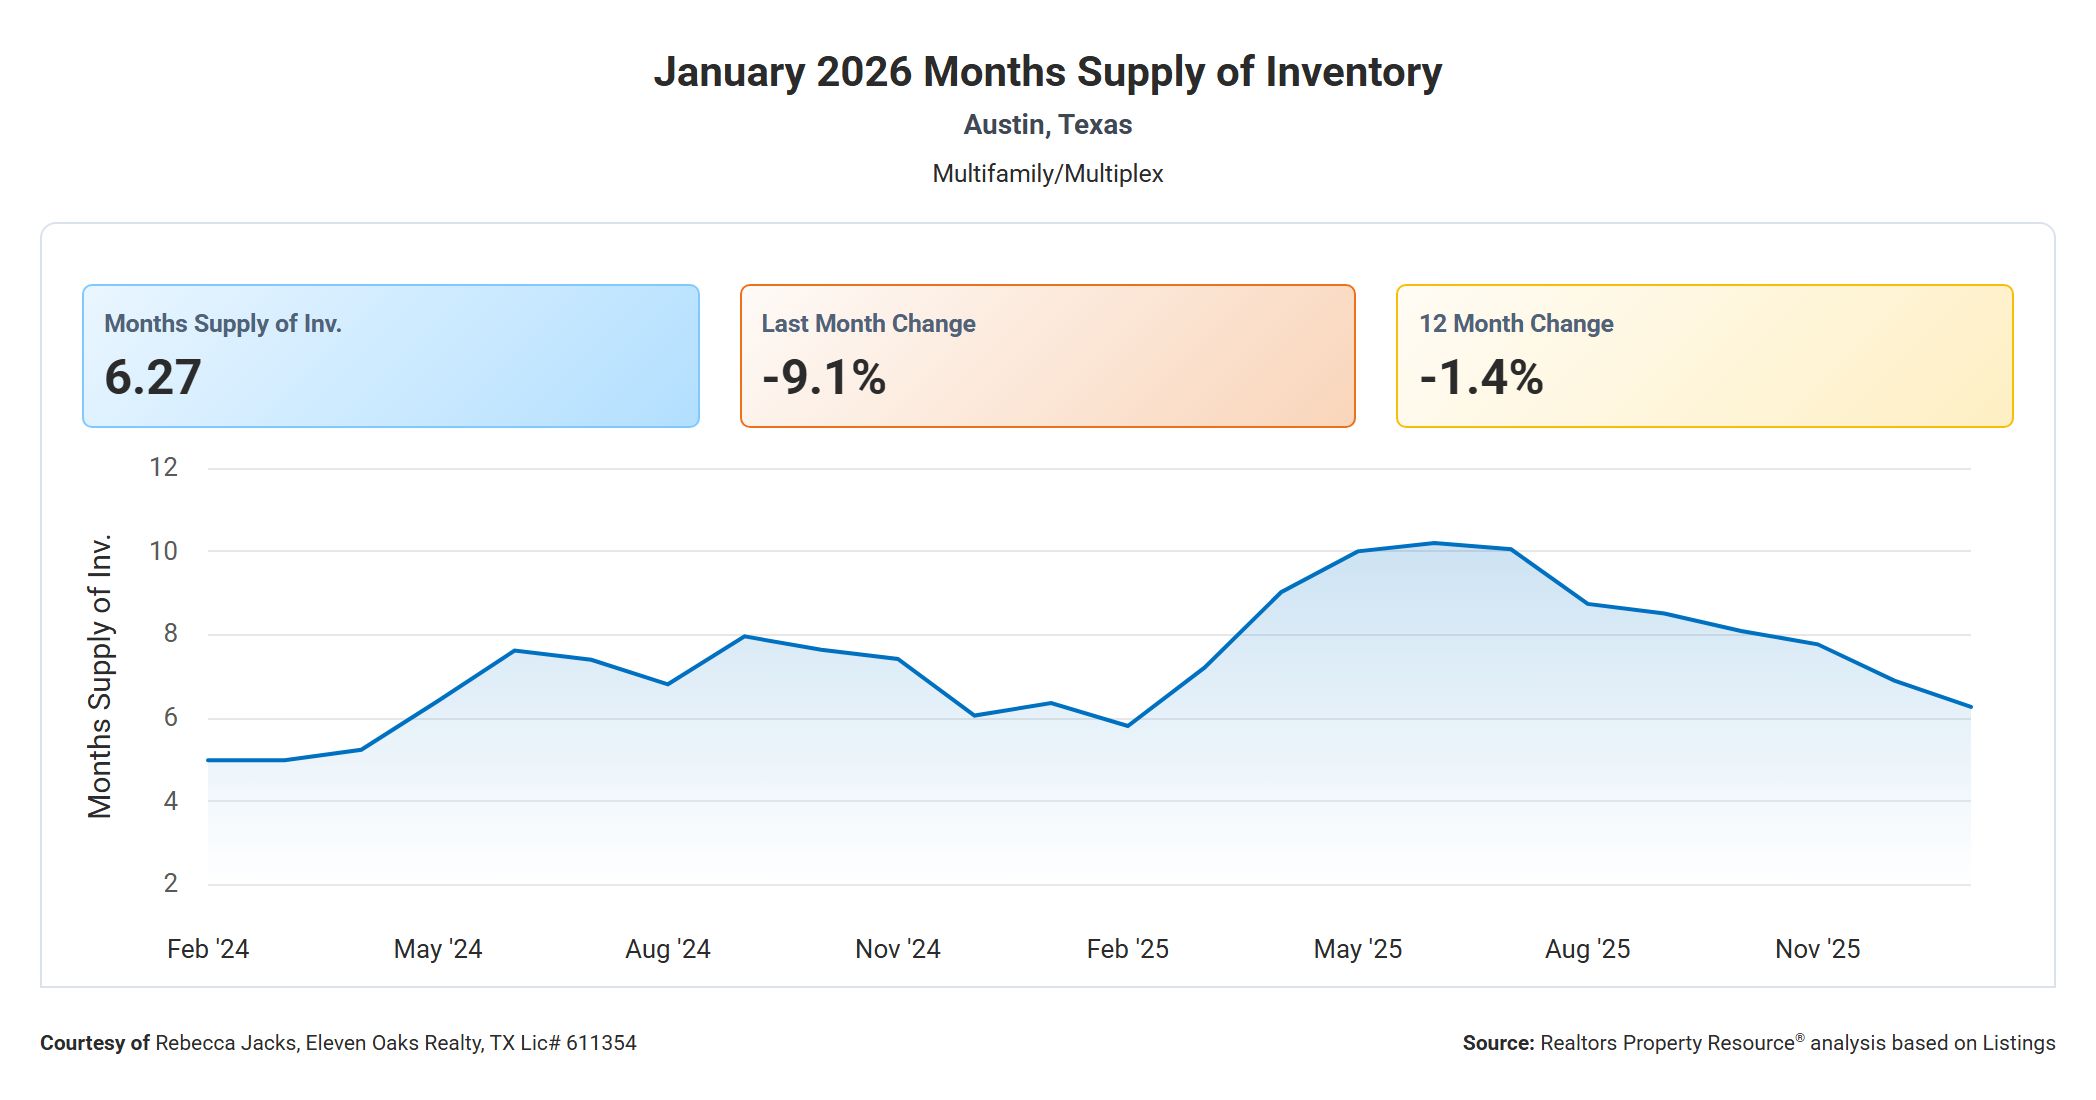
1.4% Decrease in Months Supply of Inventory
In January 2026, there were 6.27 months of inventory on the Austin multi family market compared to 6.36 months in January 2025, showing a 1.4% decrease in year over year numbers. Last month there were 6.90 months of inventory on the market, showing a 9.1% decrease in month over month comparisons.
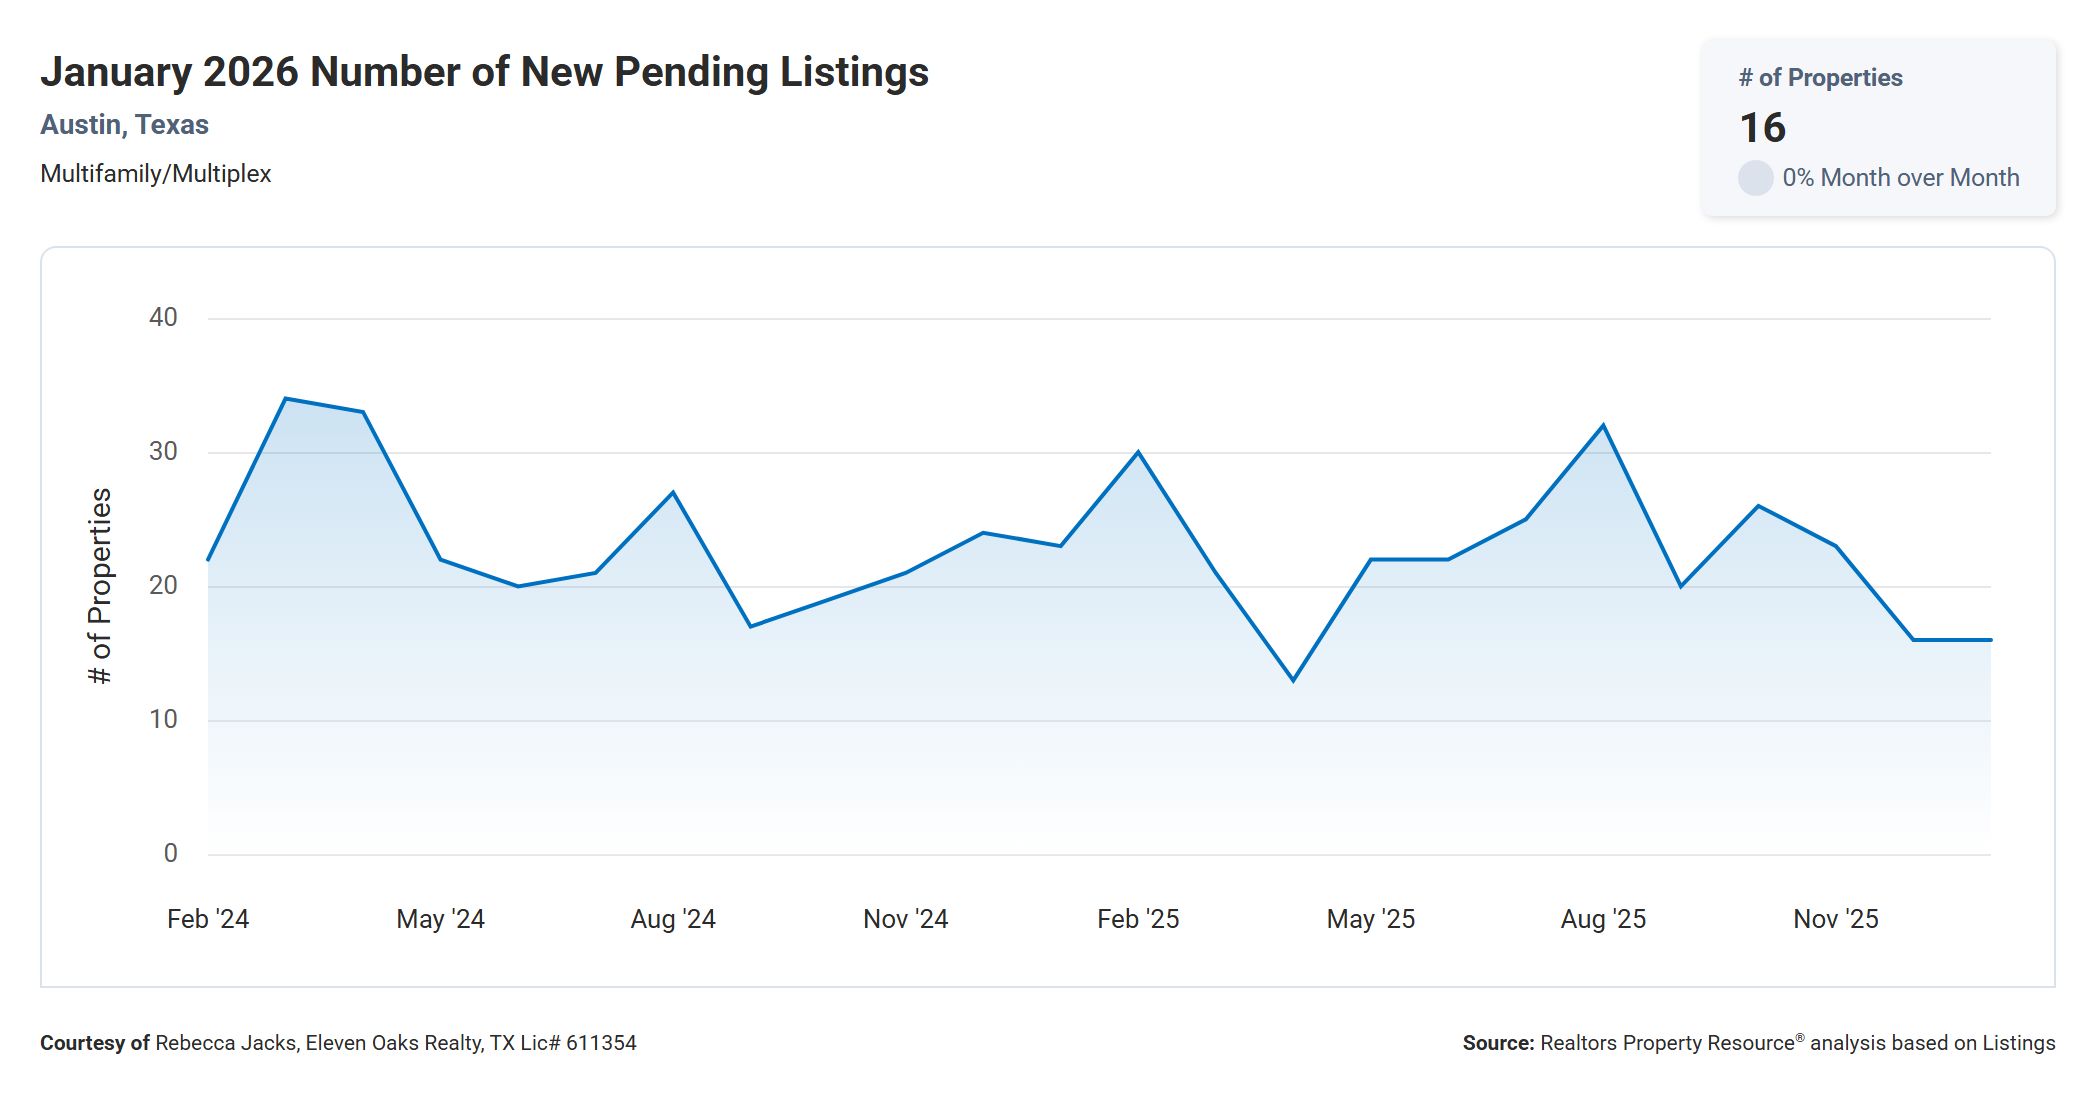
30.4% Decrease in Number of New Pending Listings
In January 2026, there were 16 multi family properties that accepted a contract compared to 23 in January 2025, showing a 30.4% decrease in year over year numbers. Last month there were 16 multi family properties that accepted a contract, showing no change in month over month comparisons.
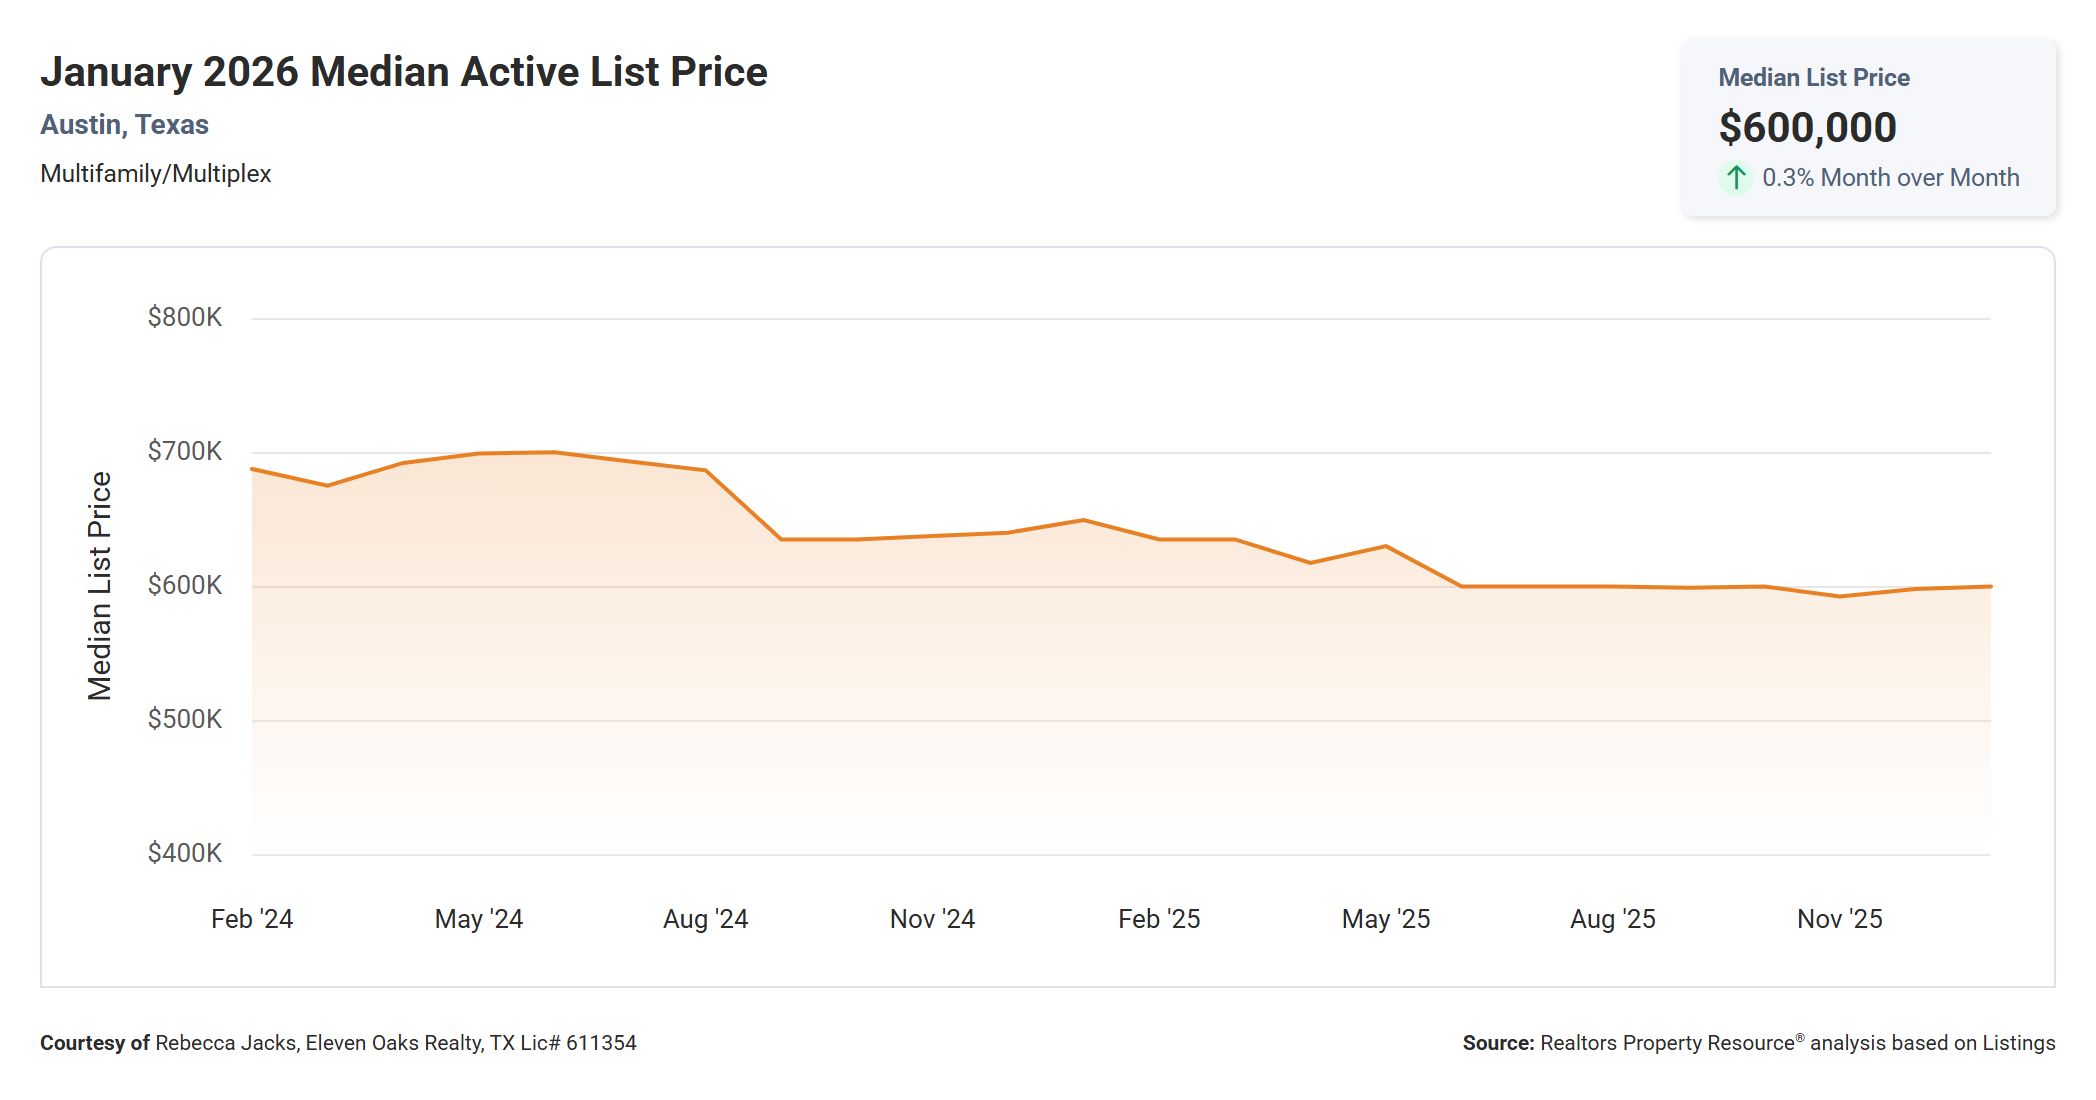
7.6% Decrease in Median Active List Price
In January 2026, the median active list price for a multi family property in Austin was $600,000 compared to $649,500 in January 2025, showing a 7.6% decrease in year over year numbers. Last month the median active list price was $598,000 showing a 0.3% increase in month over month comparisons.
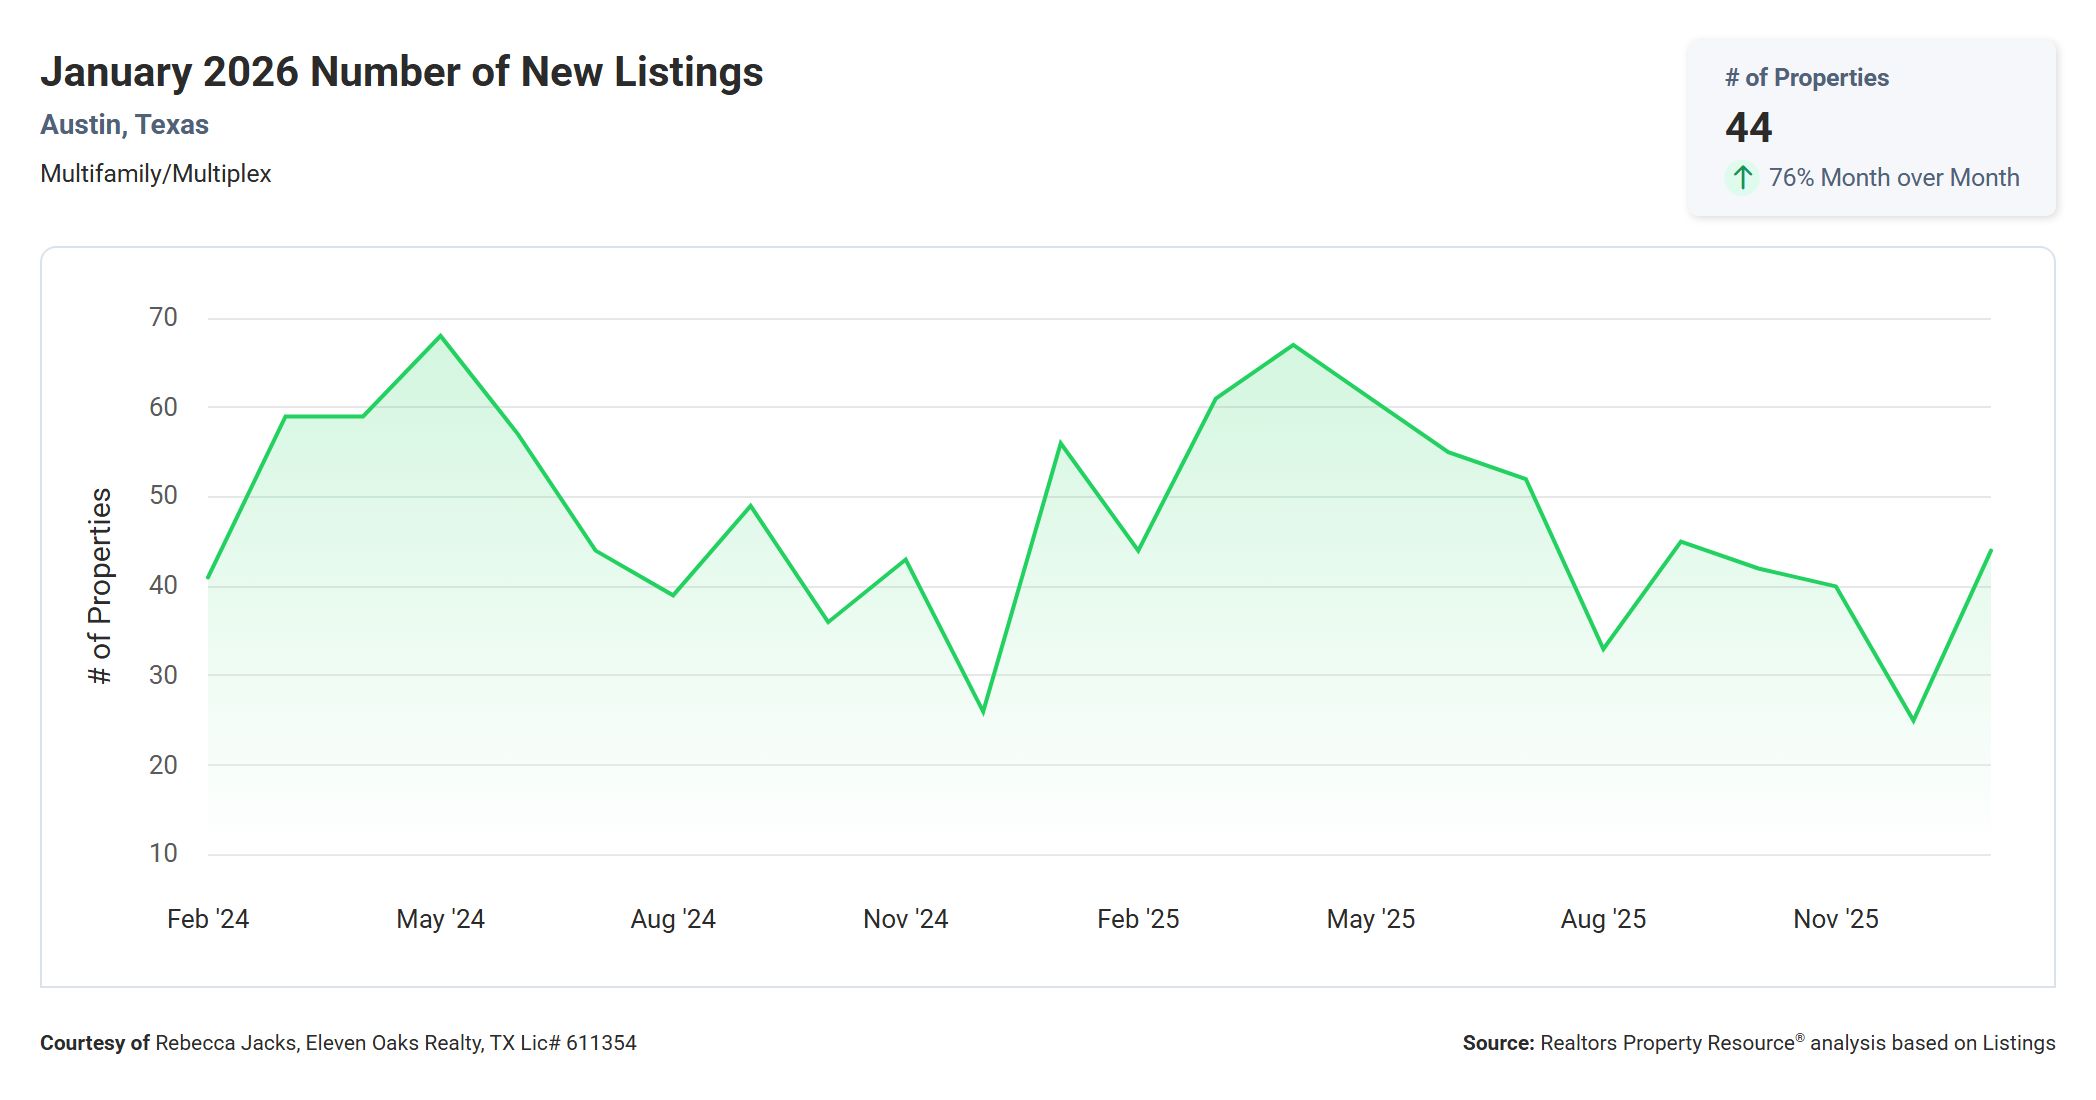
21.4% Decrease in Number of New Listings
In January 2026, there were 44 listings introduced to the market compared to 56 listings in January 2025, showing a 21.4% decrease in year over year numbers. Last month there were 25 listings introduced to the market, showing a 76% increase in month over month comparisons.
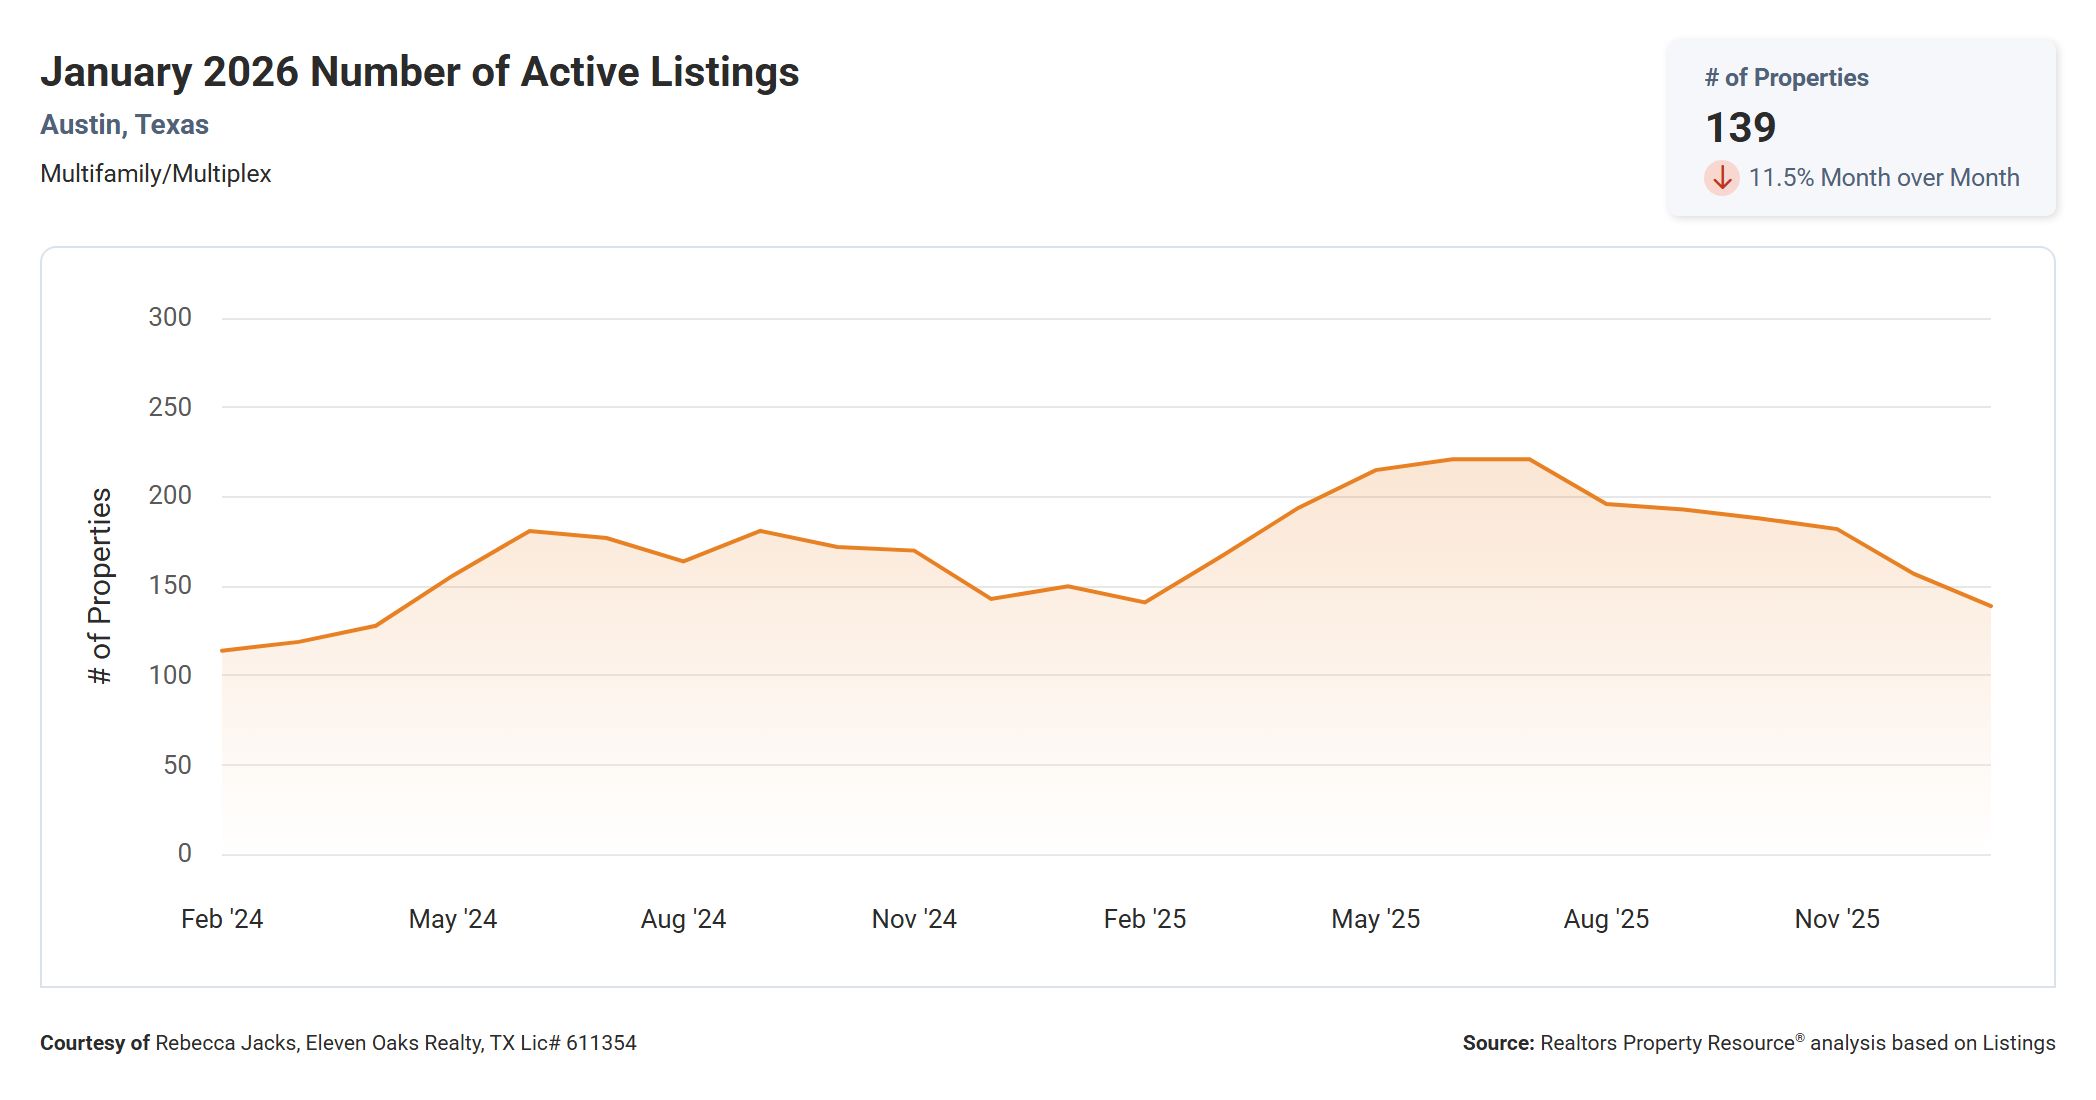
7.3% Decrease in Number of Active Listings
In January 2026, there were 139 multi family properties actively listed on the market in Austin compared to 150 in January 2025, showing a 7.3% decrease in year over year numbers. Last month there were 157 properties actively listed on the market, showing an 11.5% decrease in month over month comparisons.
January 2026 Austin Multi Family Real Estate Price Report – Strictly Numbers
For those of you who prefer to see the actual numbers, we’ve included the figures for January 2026 Austin multi family sales below. The most expensive property that sold in January 2026 sold for $880,000 and the least expensive multi family property sold for $305,000. Multi family properties ranged in size from 1,587 sqft – 3,564 sqft with an average size of 2,121 sqft. The average price per square foot for a multi family property that sold in Austin in January 2026 was $268.22 with the lowest being $160.10/sqft and the highest being $520.40/sqft. It took, on average, 114 days to sell a multi family property in Austin and sellers received, on average, 88.31% of their original list prices.
| Min | Max | Average | Median | |
| SqFt | 1,587 | 3,564 | 2,121 | 1,905 |
| List Price | $309,900 | $895,000 | $564,708 | $565,000 |
| LP/SqFt | $157.10 | $529.27 | $282.44 | $281.56 |
| Sold Price | $305,000 | $880,000 | $537,192 | $541,000 |
| SP/SqFt | $160.10 | $520.40 | $268.22 | $277.66 |
| SP/LP | 87% | 107% | 95.38% | 96% |
| SP/OLP | 77% | 107% | 88.31% | 89% |
| ADOM | 4 | 220 | 114 | 91 |
| Search Criteria | |
| Status | Sold |
| Sold Date | January 2026 |
| Property Type | Multi Family |
| Number Sold | 13 |
| Source: | ABoR Sales Data |
| Area | Austin |
Reading the Market Direction Strictly from the Numbers
1) Balanced inventory, but pace has slowed considerably The Austin multi family market sits at 6.27 months of inventory, technically balanced territory. But the sales pace tells a different story: only 13 properties closed in January, down 23.5% from a year ago. When inventory is balanced but closings are falling, it typically means the market is functioning more like a buyer’s market in practice, even if the headline inventory number hasn’t tipped past the 6-month threshold. 2) Headline prices fell, but unit economics held up The median sold price dropped 13.4% year over year to $541,000, which is the most significant price correction in recent months. However, the median price per square foot actually increased 4.9% to $235. The divergence suggests the composition of sales shifted toward smaller or lower-priced properties rather than a broad-based decline in what buyers are willing to pay per unit of space. Still, a 13.4% headline decline is a data point buyers and sellers both need to take seriously. 3) Sellers are getting closer to asking price, even as prices fall The sold-to-list ratio improved to 96.14% (up from 94.69% a year ago). That’s a meaningful shift that suggests sellers who have adjusted their pricing to reflect the current market are being rewarded with tighter negotiations. The average original list price recovery (88.31%) tells the rest of the story: many sellers still had to reduce their price before finding a buyer, but once they did, the final negotiation was closer to the adjusted ask. 4) Marketing times have doubled The median time to sell jumped to 92 days from 46 days a year ago. That’s the single most dramatic year-over-year change in this report and signals a fundamentally different pace than what sellers experienced in early 2025. Properties are sitting longer before going under contract, which shifts negotiating dynamics firmly in the buyer’s direction. 5) The pipeline is contracting New pending listings were down 30.4% year over year (16 vs 23), new listings were down 21.4% (44 vs 56), and active listings were down 7.3% (139 vs 150). Both sides of the equation are pulling back: fewer sellers are listing and fewer buyers are going under contract. In a market like this, the properties that do transact tend to be the ones priced most accurately to current conditions.
Is it time to buy or sell (based strictly on the numbers)?
If you’re a buyer: the numbers present a favorable environment. Inventory is balanced (6.27 months), properties are taking significantly longer to sell (92 days median), and the median sold price has declined 13.4% from a year ago. Fewer buyers are competing for contracts (new pending down 30.4% YoY), which means less pressure to rush decisions or stretch on price. The improved sold-to-list ratio (96.1%) suggests that current asking prices are more realistic than they were a year ago, so focus your negotiations on well-priced listings where you can close near ask rather than chasing overpriced inventory hoping for a steep discount. If you’re a seller: the numbers argue it’s a more challenging environment than a year ago, but not an unworkable one. The key positive is the sold-to-list ratio (96.14%), which is actually better than last January. That means if you price to the current market, buyers are willing to close near your asking price. The challenge is the pace: 92 median days to sell is significantly longer than the 46 days sellers experienced a year ago, and fewer contracts are being written (16 new pending vs 23 YoY). Price accurately from the start, invest in presentation, and plan for a longer timeline.
Buyer Action Items
Use extended marketing times as leverage. With 92 median days on market, sellers with aging listings are more motivated. Prioritize properties that have been listed 60+ days and use time-on-market data to support your offer price. Focus on price per square foot, not just the sticker price. The median $/sqft is $235 (+4.9% YoY), so unit economics have actually held steady. Use $/sqft comparables to validate your offers rather than relying on headline sold prices alone. Be selective with limited competition. Only 16 new contracts were written in January. With fewer active buyers, you have the luxury of patience. Wait for the right property rather than settling because of perceived urgency. Negotiate beyond price. In a market with 114 average days on market and sellers receiving 88.31% of original list on average, there’s room to negotiate repairs, closing cost credits, rate buydowns, and extended option periods.
Seller Action Items
Price to the current market from day one. Sellers who price correctly are getting 96.14% of their list price. But those who start too high end up at 88.31% of their original list. The difference between getting it right on pricing and having to chase the market is significant. Plan for a 90+ day marketing timeline. The median time to sell is 92 days, nearly double what it was a year ago. If you have a timeline-sensitive sale, list early and budget for carrying costs during an extended marketing period. Make your listing stand out. With 139 active listings competing for just 16 new contracts in January, your property needs a clear reason to rise to the top. Condition, professional photos, and competitive pricing are all essential. Watch the composition of your competition. Active listings are down 7.3% year over year and new listings jumped 76% month over month as seasonal inventory returns. Stay aware of what’s entering the market in your price range and adjust your strategy if new, more competitive listings appear.
Final Word on the January 2026 Austin Multi Family Price Report
January 2026 shows an Austin multifamily market that’s balanced by inventory but tilting toward buyers in negotiations: sales are closing below list, and days-on-market support a deliberate pace. At the same time, the improved sold-to-list ratio and rising median price per square foot suggest that sellers can still achieve solid outcomes, just not without pricing discipline and strong execution.
Questions About the January 2026 Austin Multi Family Real Estate Price Report?
Do you have questions about this January 2026 Austin Multi Family Real Estate Price Report? Call us at (512) 827-8323 or email us at info@11OaksRealty.com.




Leave a Reply