
Eleven Oaks Realty is proud to present their September 2026 Austin Multi Family Real Estate Price Report measuring activity in the Austin multi family market. This report includes all multi family properties (duplex, triplex and quadplex) that sold in September 2026.
September brought a modest rebound in pricing after a soft August. The median sold price climbed 7.6% month over month to $491,000, total sales volume rose 9.5% to $12.3 million, and buyers paid 96.41% of list price on average, the strongest ratio the Austin multi family market has posted since spring 2025. Activity was a different story: only 20 multi family properties closed, new pending contracts slipped to 19, and the median sold price is still 12.7% below where it stood in September 2025. With so few transactions each month, one or two unusually large or small sales can move these numbers more than you would see in the single family market.
All data below covers multi family residential properties (duplex, triplex, and quadplex) in the city of Austin. Data is sourced from Realtors Property Resource (RPR) and the Austin Board of REALTORS MLS. Some metrics may vary slightly between sources due to differing methodology; where differences exist, they are noted.
The Austin Multi Family Market is a Buyer’s Market
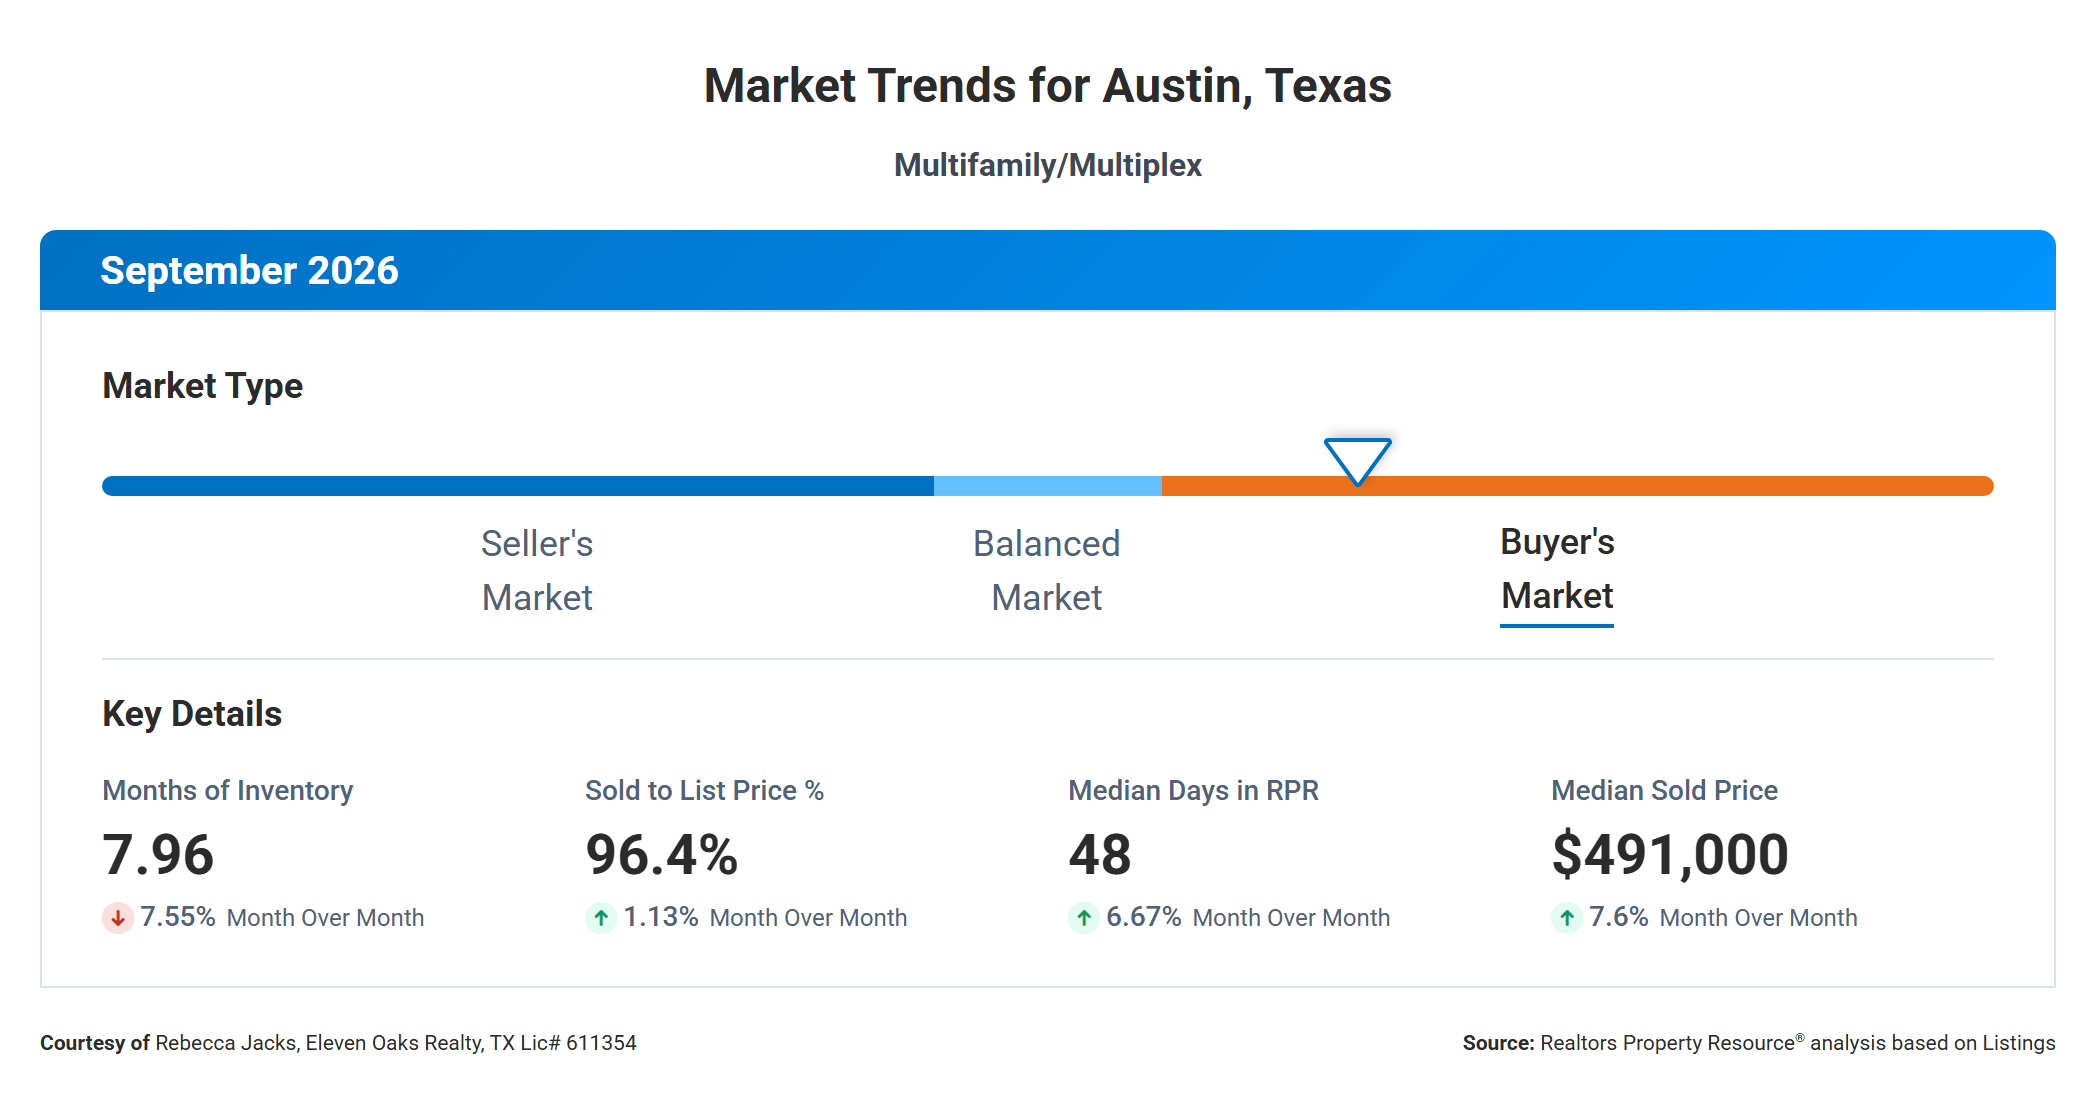
RPR classifies the Austin multi family market as a buyer’s market for September 2026, with 7.96 months of inventory. Anything above roughly six months of supply tilts the market toward buyers, and Austin multi family has now been above that line for most of the past two years. In practical terms, if no new listings came on the market, it would take nearly eight months to sell every duplex, triplex, and quadplex currently available. That gives you, as a buyer, time to compare properties, run your numbers carefully, and negotiate.
The four key metrics on the dashboard moved in a direction that slightly favors sellers compared with August. Months of inventory fell 7.55% from 8.61, the sold to list price ratio rose 1.13% to 96.4%, median days in RPR increased 6.67% to 48, and the median sold price gained 7.6% to $491,000. Three of those four signals point to a market that firmed up a bit in September, while the longer time on market shows that buyers are still taking their time.
Keep in mind that the multi family market is much smaller and thinner than the single family market. With only about 20 closings a month, these figures can shift sharply from one month to the next. Taken together, September’s signals say this is still a buyer’s market, but one where well-priced properties are closing closer to their asking price than they were earlier in the year.
Median Sold Price Down 12.7% Year Over Year
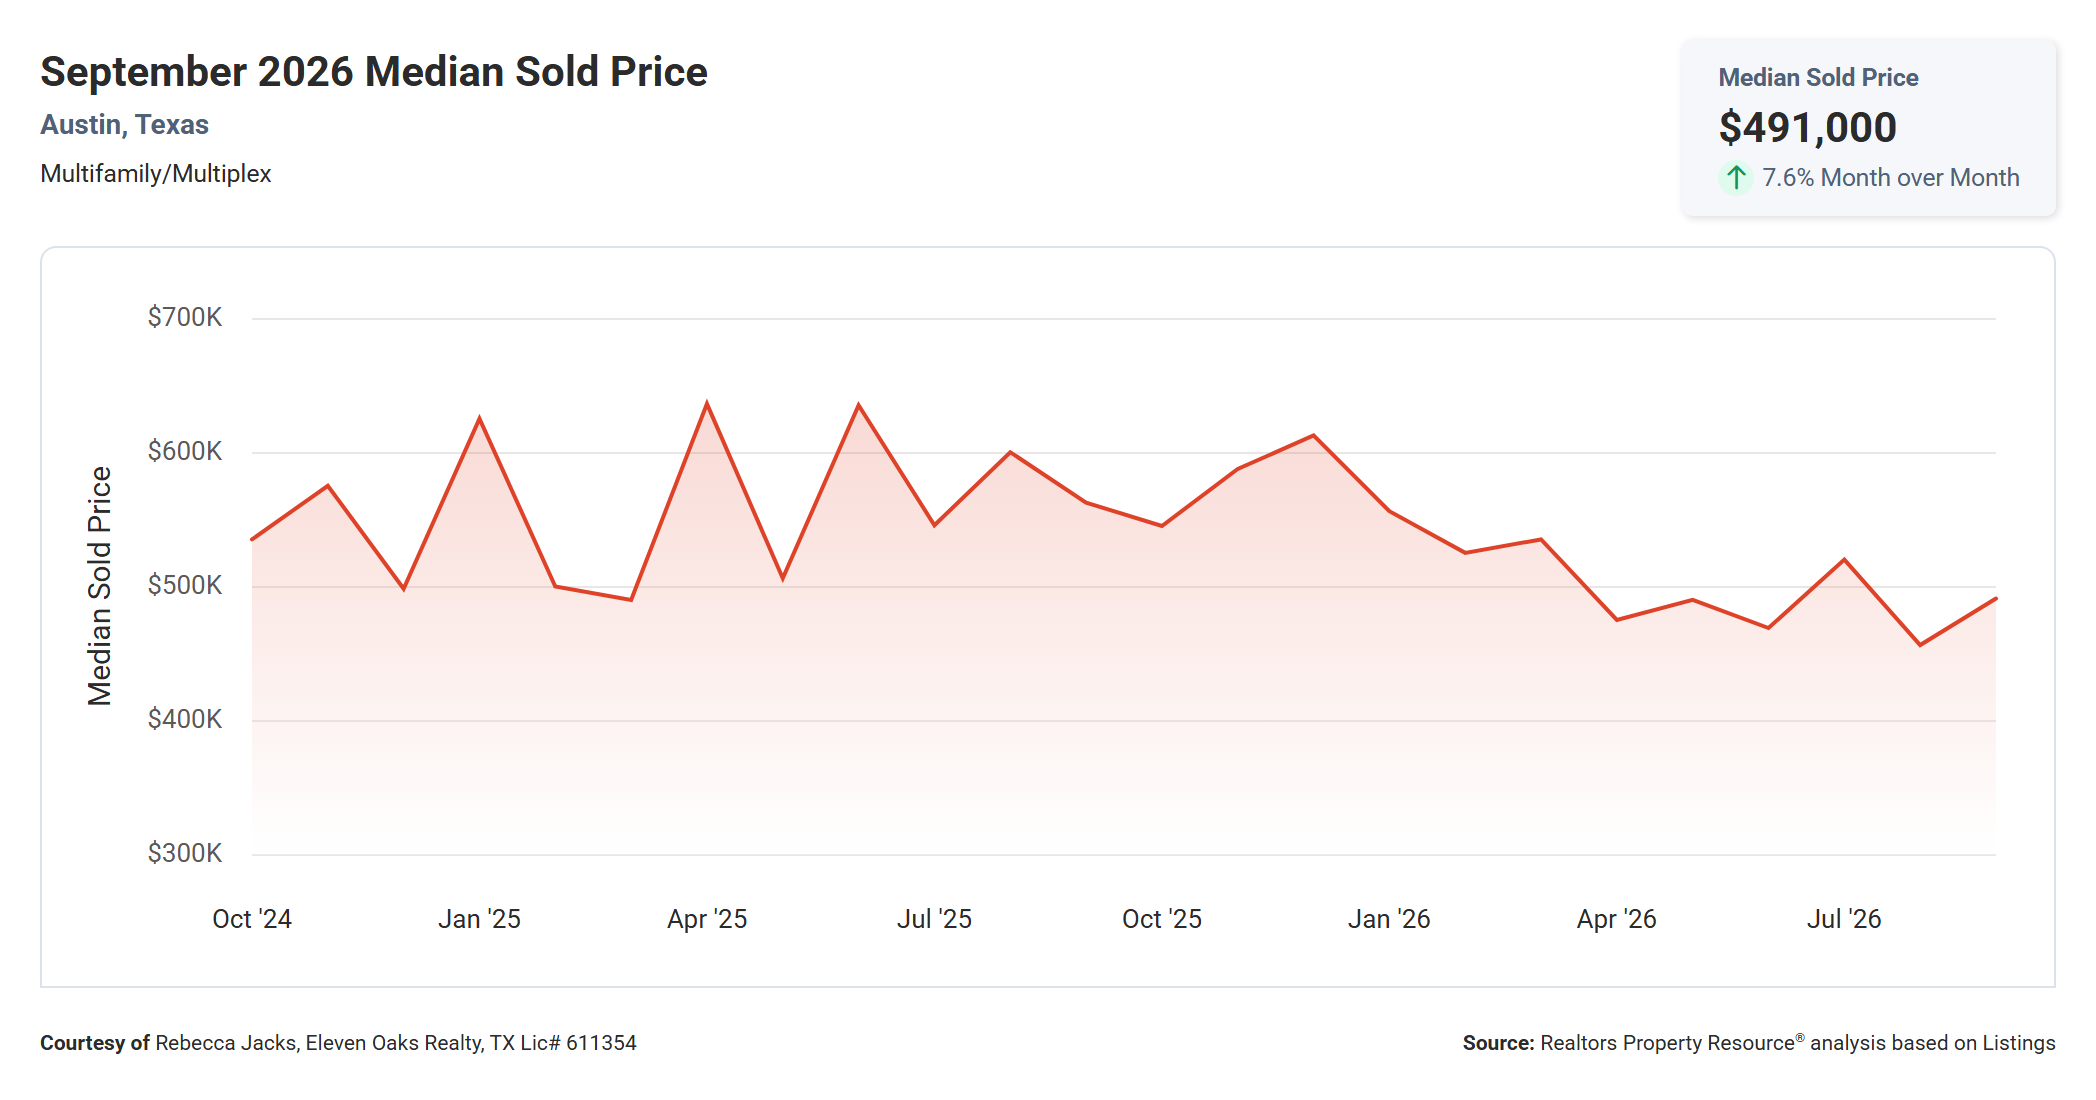
The median sold price for Austin multi family properties was $491,000 in September 2026, up 7.6% from $456,300 in August but down 12.7% from $562,450 in September 2025.
The two-year chart shows a clear shift in price level. Through most of 2025 the median bounced between roughly $490,000 and $640,000, with peaks near $635,000 in March and June 2025. Since January 2026, the median has stayed below $540,000 every month, and August 2026’s $456,300 was the lowest point on the entire two-year chart. September’s bounce is welcome for sellers, but it recovered only part of that ground.
For buyers and investors, a $71,450 drop in the median sold price over twelve months is meaningful. A lower purchase price improves the math on rental income, cash flow, and cap rate, especially when financing costs remain a major factor for investment property. For sellers, the takeaway is that pricing based on 2025 comparable sales will likely put a property above what today’s buyers are willing to pay.
Watch whether September’s gain holds in October. One strong month after a low month is a bounce; two or three consecutive gains would suggest a floor is forming.
Number of Sold Properties Down 20% Year Over Year
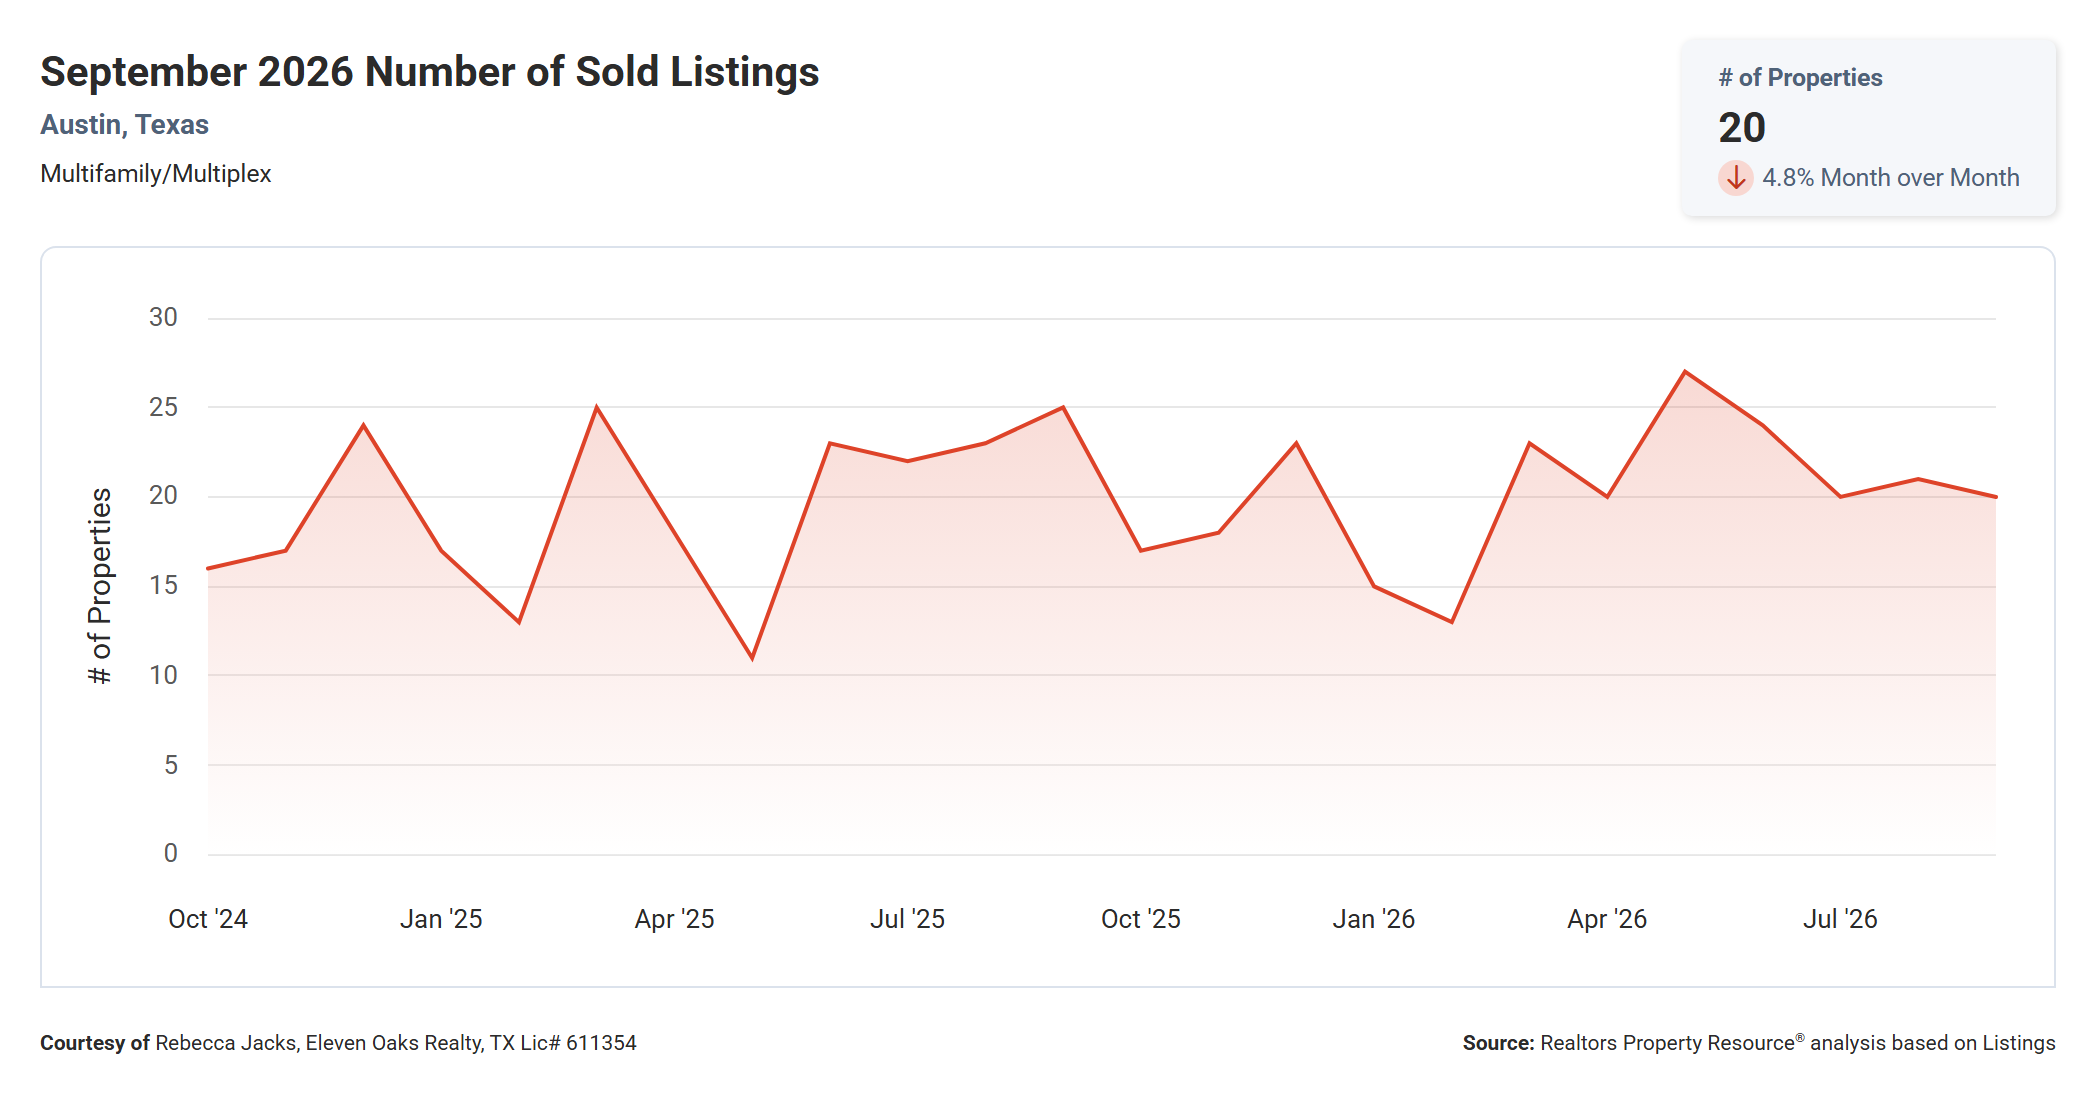
There were 20 multi family properties sold in Austin in September 2026, down 4.8% from 21 in August and down 20% from 25 in September 2025.
Sales activity has been fairly steady through 2026. After a slow start with 15 sales in December 2025 and 13 in February 2026, closings picked up to a two-year high of 27 in May 2026 and have settled in the 20 to 24 range since. September’s 20 sales sit right in the middle of the range the market has held over the past two years.
The year over year drop of five sales looks large as a percentage, but in a market this small a handful of transactions swings the figure dramatically. Buyers are still active, just not in large numbers. For sellers, that means a smaller pool of qualified buyers for any given property, which makes pricing and presentation more important.
Average Sold to List Price Up 1.5% Year Over Year
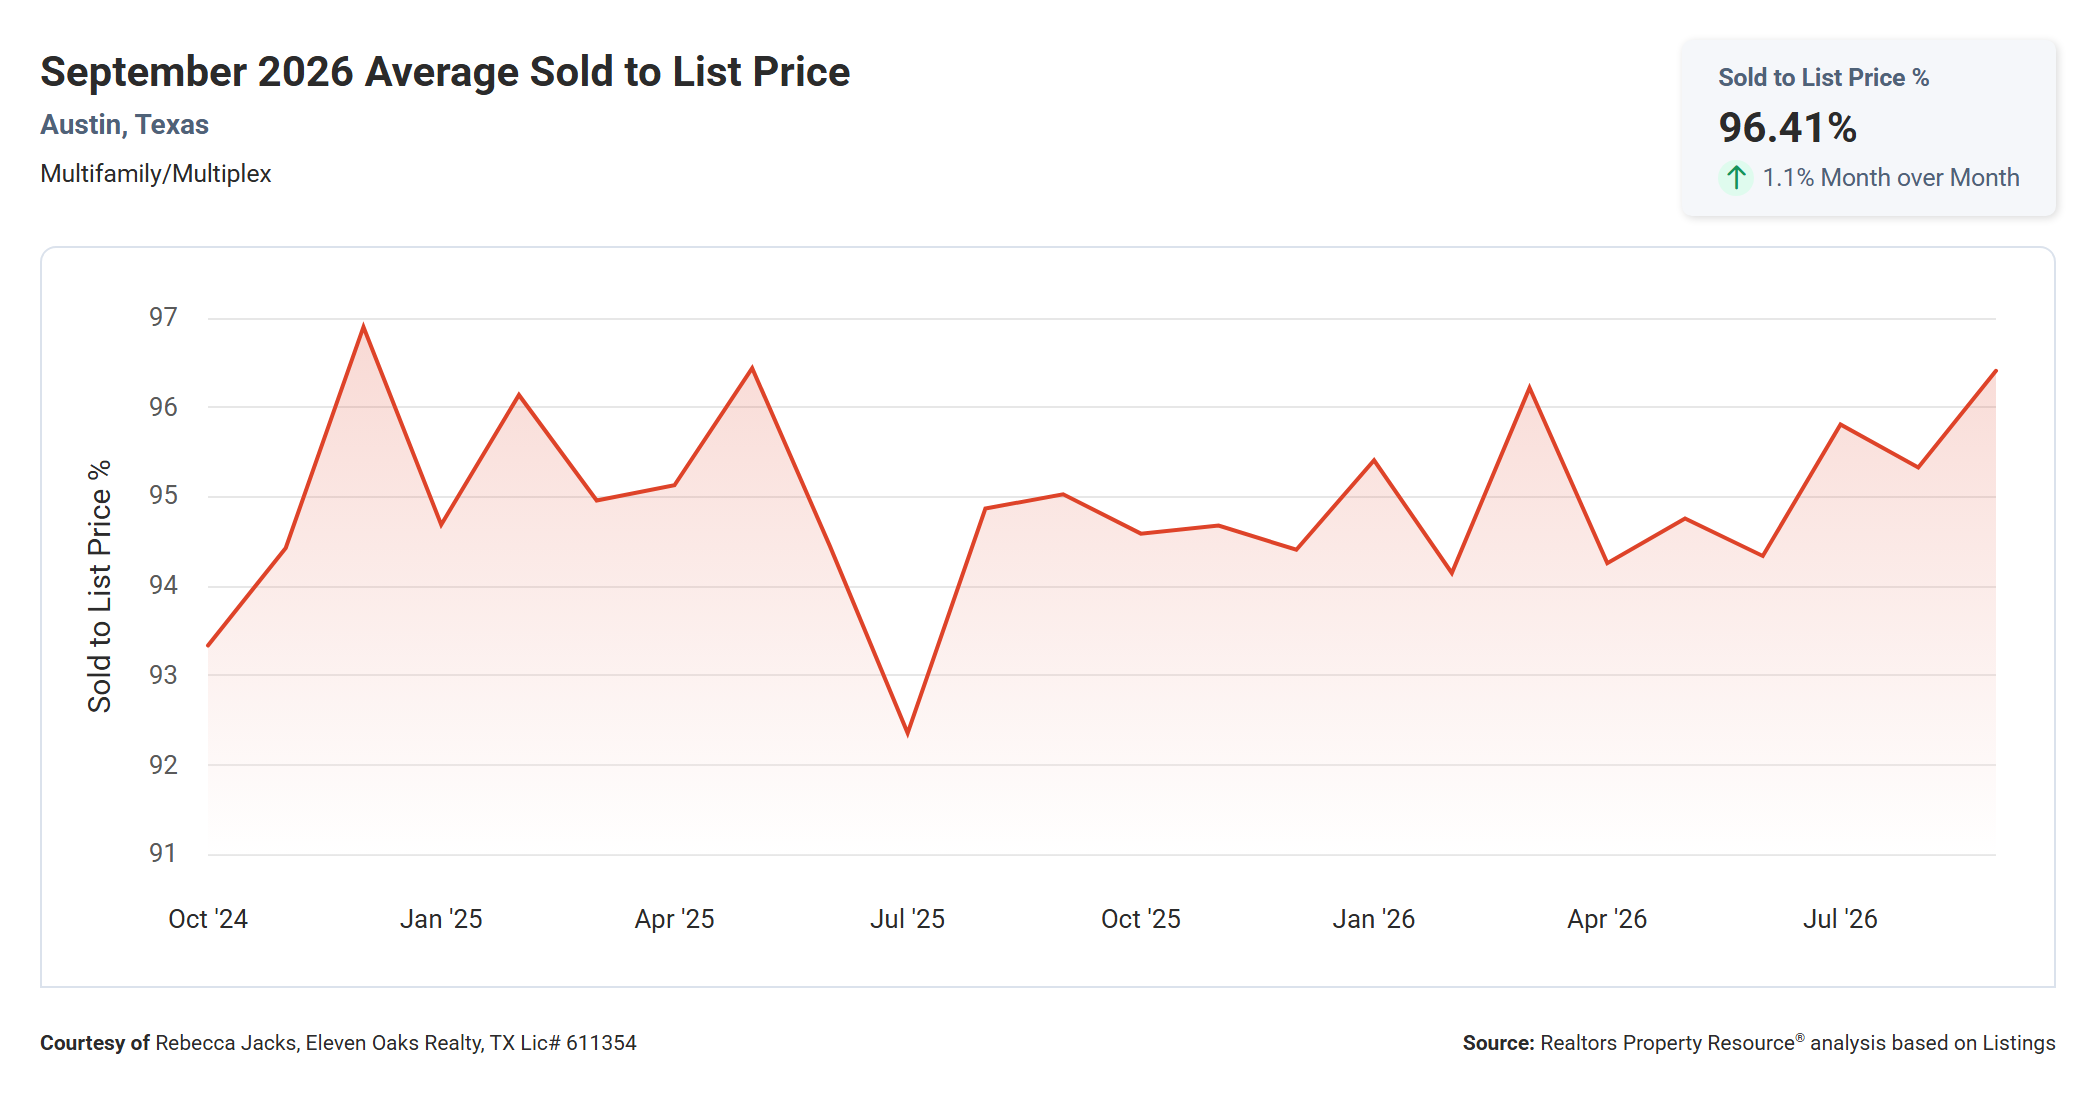
The average sold to list price ratio for Austin multi family properties was 96.41% in September 2026, up 1.1% from 95.33% in August and up 1.5% from 95.03% in September 2025.
This is the highest sold to list ratio the market has recorded since May 2025, and it continues an upward trend that began in June 2026, when the ratio sat near 94.3%. The lowest point on the two-year chart was July 2025, at roughly 92.3%. Buyers are still negotiating, but the gap between asking price and sale price has narrowed over the past three months.
For sellers, a 96.41% ratio means a property listed at $500,000 would typically sell for about $482,000. For buyers, it means there is still room to negotiate on most multi family properties, though less than there was earlier in the year. This ratio compares the sale price to the final list price, so it does not capture price reductions made before a property went under contract. The MLS data later in this report shows that gap.
Median Time to Sell Down 28.4% Year Over Year
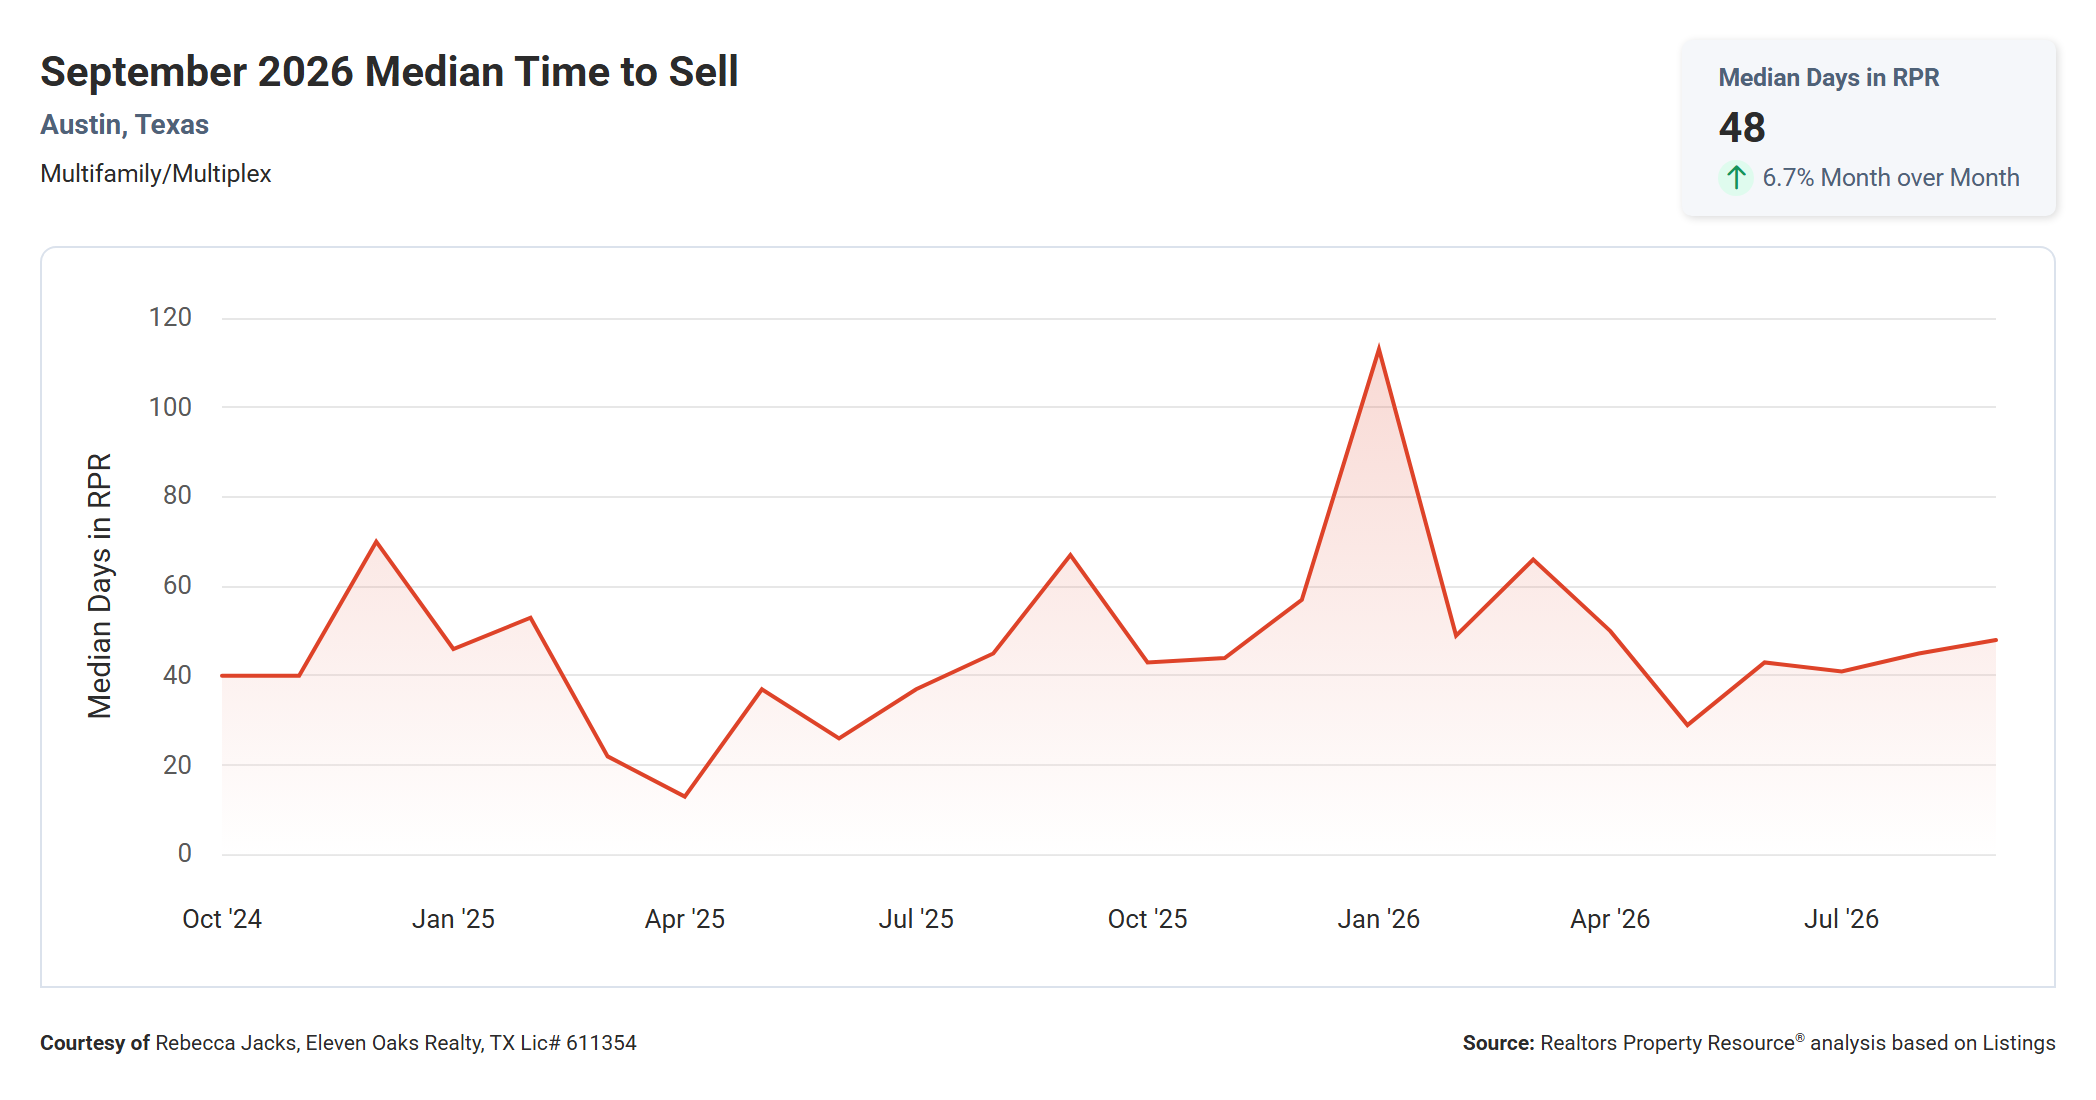
The median time to sell an Austin multi family property was 48 days in September 2026, up 6.7% from 45 days in August but down 28.4% from 67 days in September 2025.
Time on market has been unusually stable in recent months, holding between 41 and 48 days since June 2026. That is a big change from the volatility earlier in the cycle, when the median spiked to about 113 days in January 2026 and dropped as low as 13 days in April 2025. A properly priced property is currently taking about a month and a half to sell.
The 19-day improvement over last year is a positive sign for sellers, although the small number of monthly sales can make this figure swing quickly. Buyers should note that 48 days is a median; the MLS data below shows that some properties sat for more than 200 days, which usually points to pricing that did not match the market.
Median Price Per Square Foot Down 12% Year Over Year
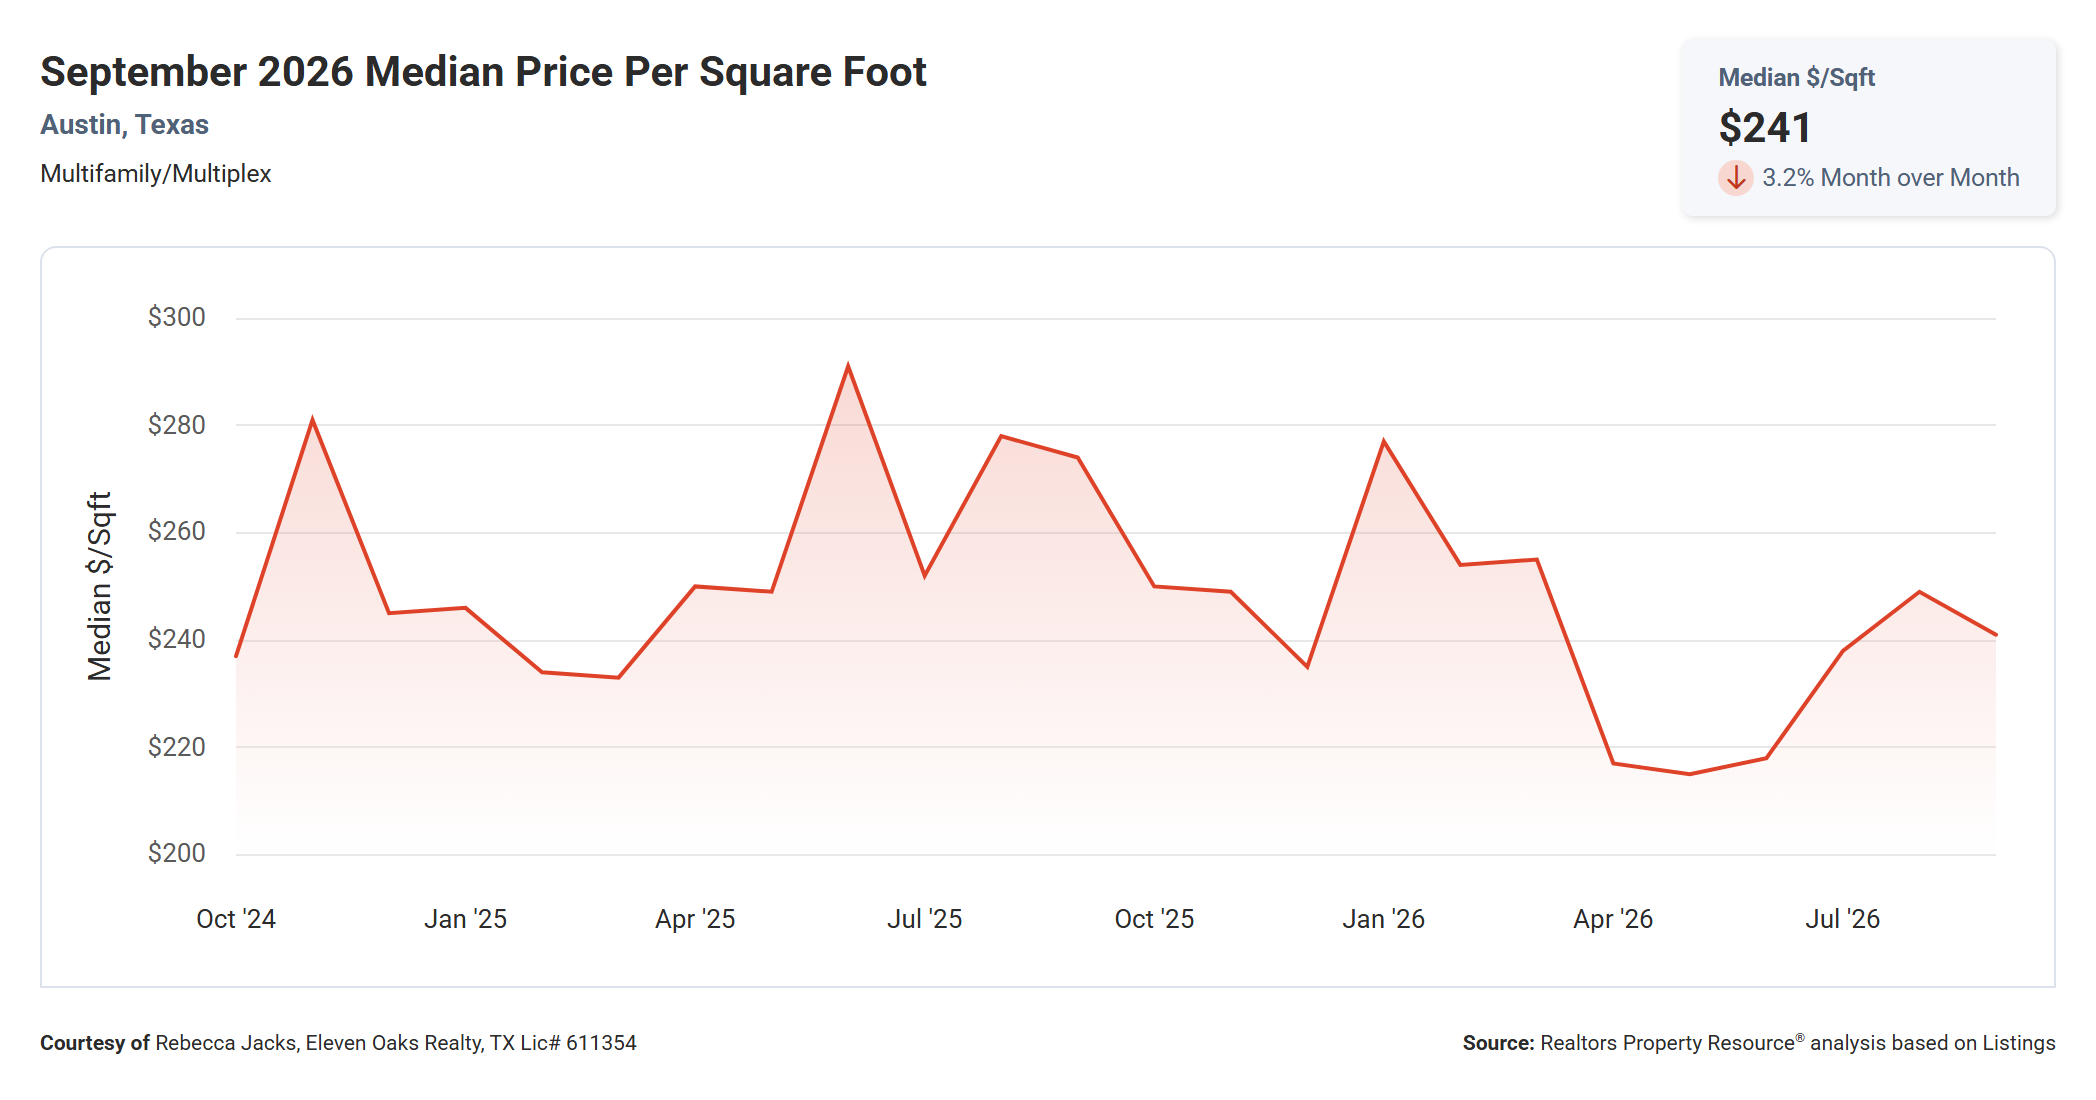
The median price per square foot for Austin multi family properties was $241 in September 2026, down 3.2% from $249 in August and down 12% from $274 in September 2025.
Price per square foot has followed a similar path to the median sold price. It peaked near $291 in June 2025, slid to a two-year low of about $215 in May 2026, and then recovered to $249 by August before easing back in September. The current $241 is roughly in line with where the market sat in late 2024.
For investors, price per square foot is often a more useful comparison than the overall sale price because multi family properties vary so much in size and unit count. A $33 per square foot decline over the past year means that for a 2,000 square foot duplex, buyers are paying about $66,000 less than they would have a year ago for the same amount of space.
Total Sales Volume Down 17.5% Year Over Year
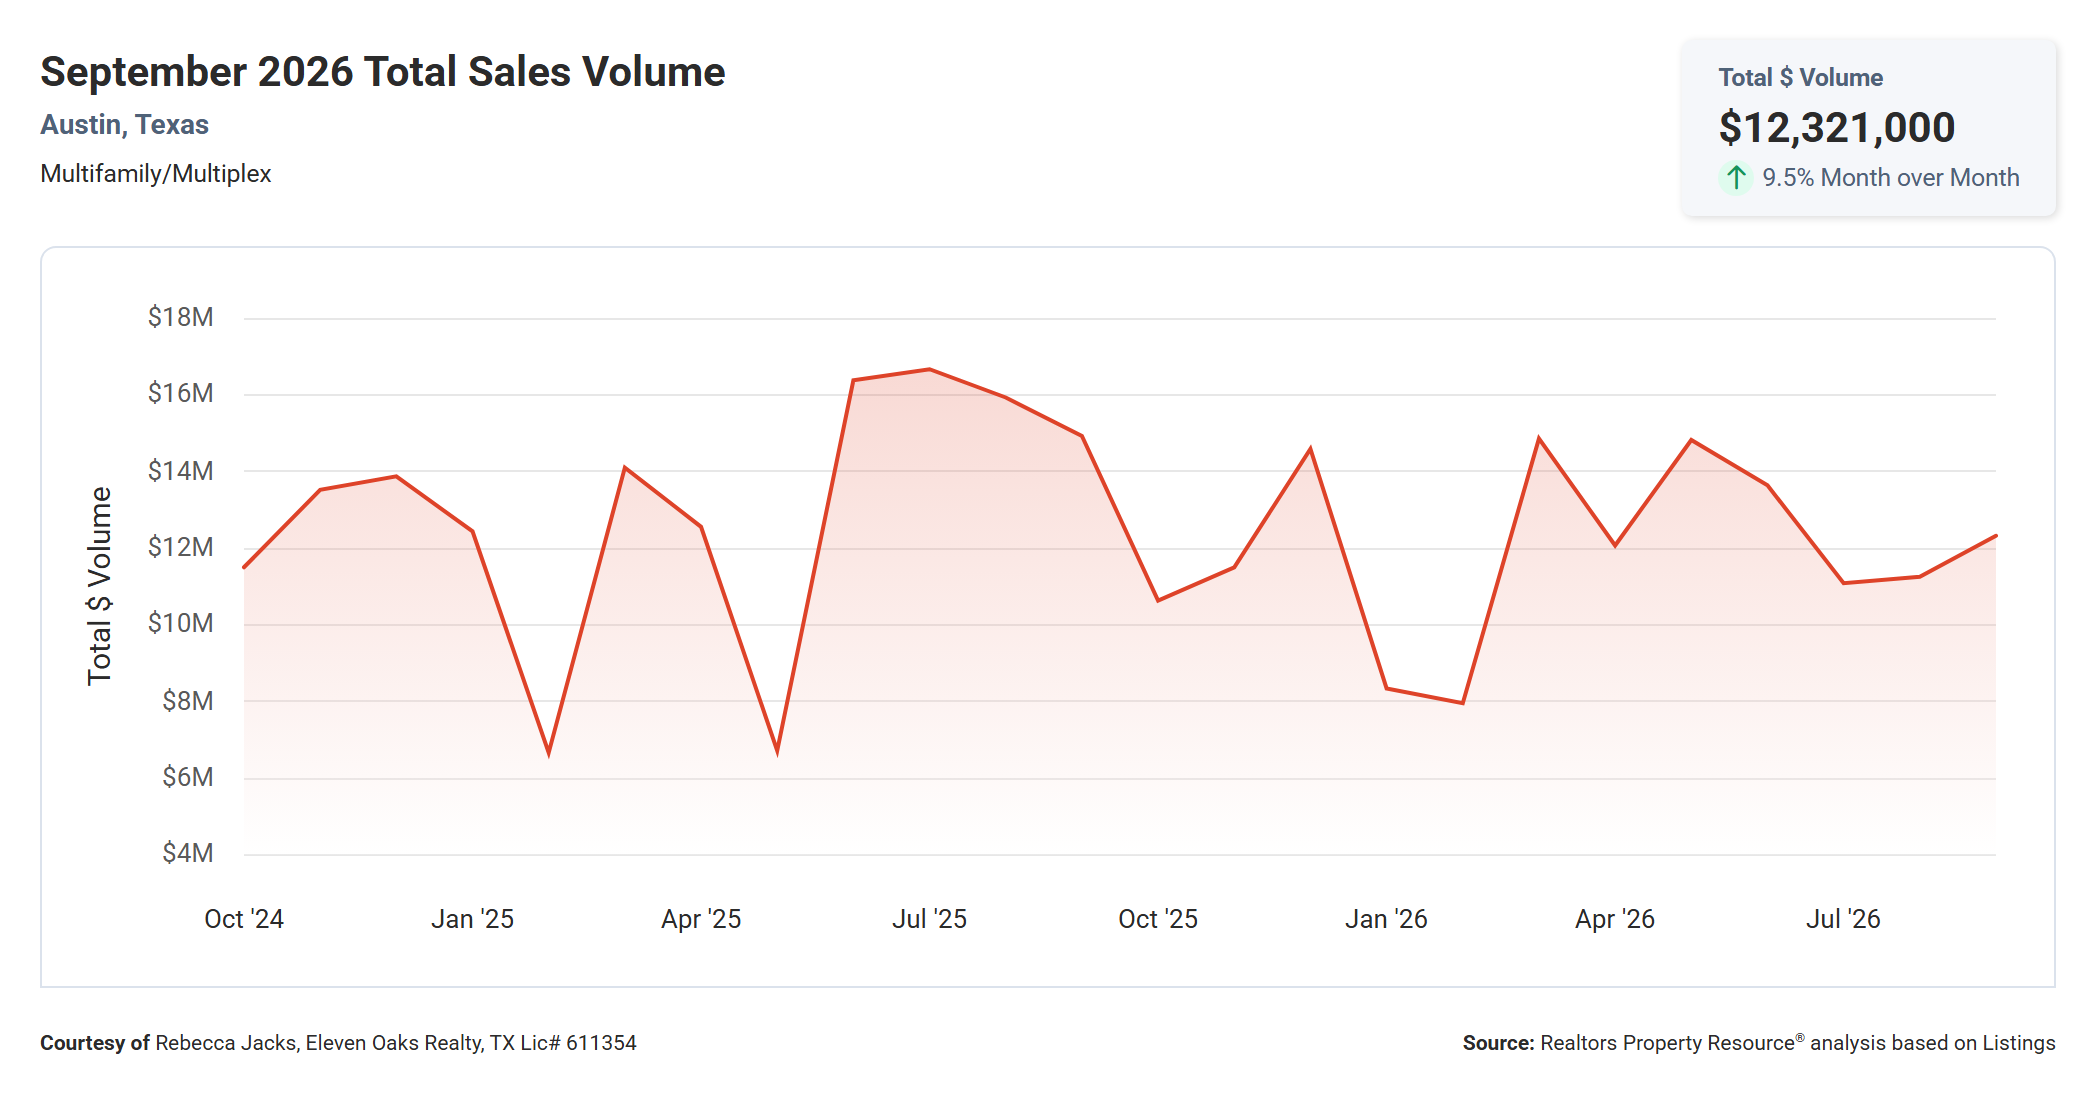
Total sales volume for Austin multi family properties was $12,321,000 in September 2026, up 9.5% from $11.25 million in August but down 17.5% from $14.93 million in September 2025.
The month over month gain came from higher prices rather than more sales, since the number of closings actually fell by one. Looking at the full chart, the summer of 2025 was the high-water mark, with volume near $16.7 million in July 2025. Volume in 2026 has ranged from about $8 million in February to nearly $15 million in March and May.
Lower total volume reflects both fewer sales and lower prices compared with a year ago. For the market overall, it signals that less money is moving through Austin multi family than in 2025, which is consistent with the buyer’s market conditions shown on the dashboard.
Months Supply of Inventory Down 5.6% Year Over Year
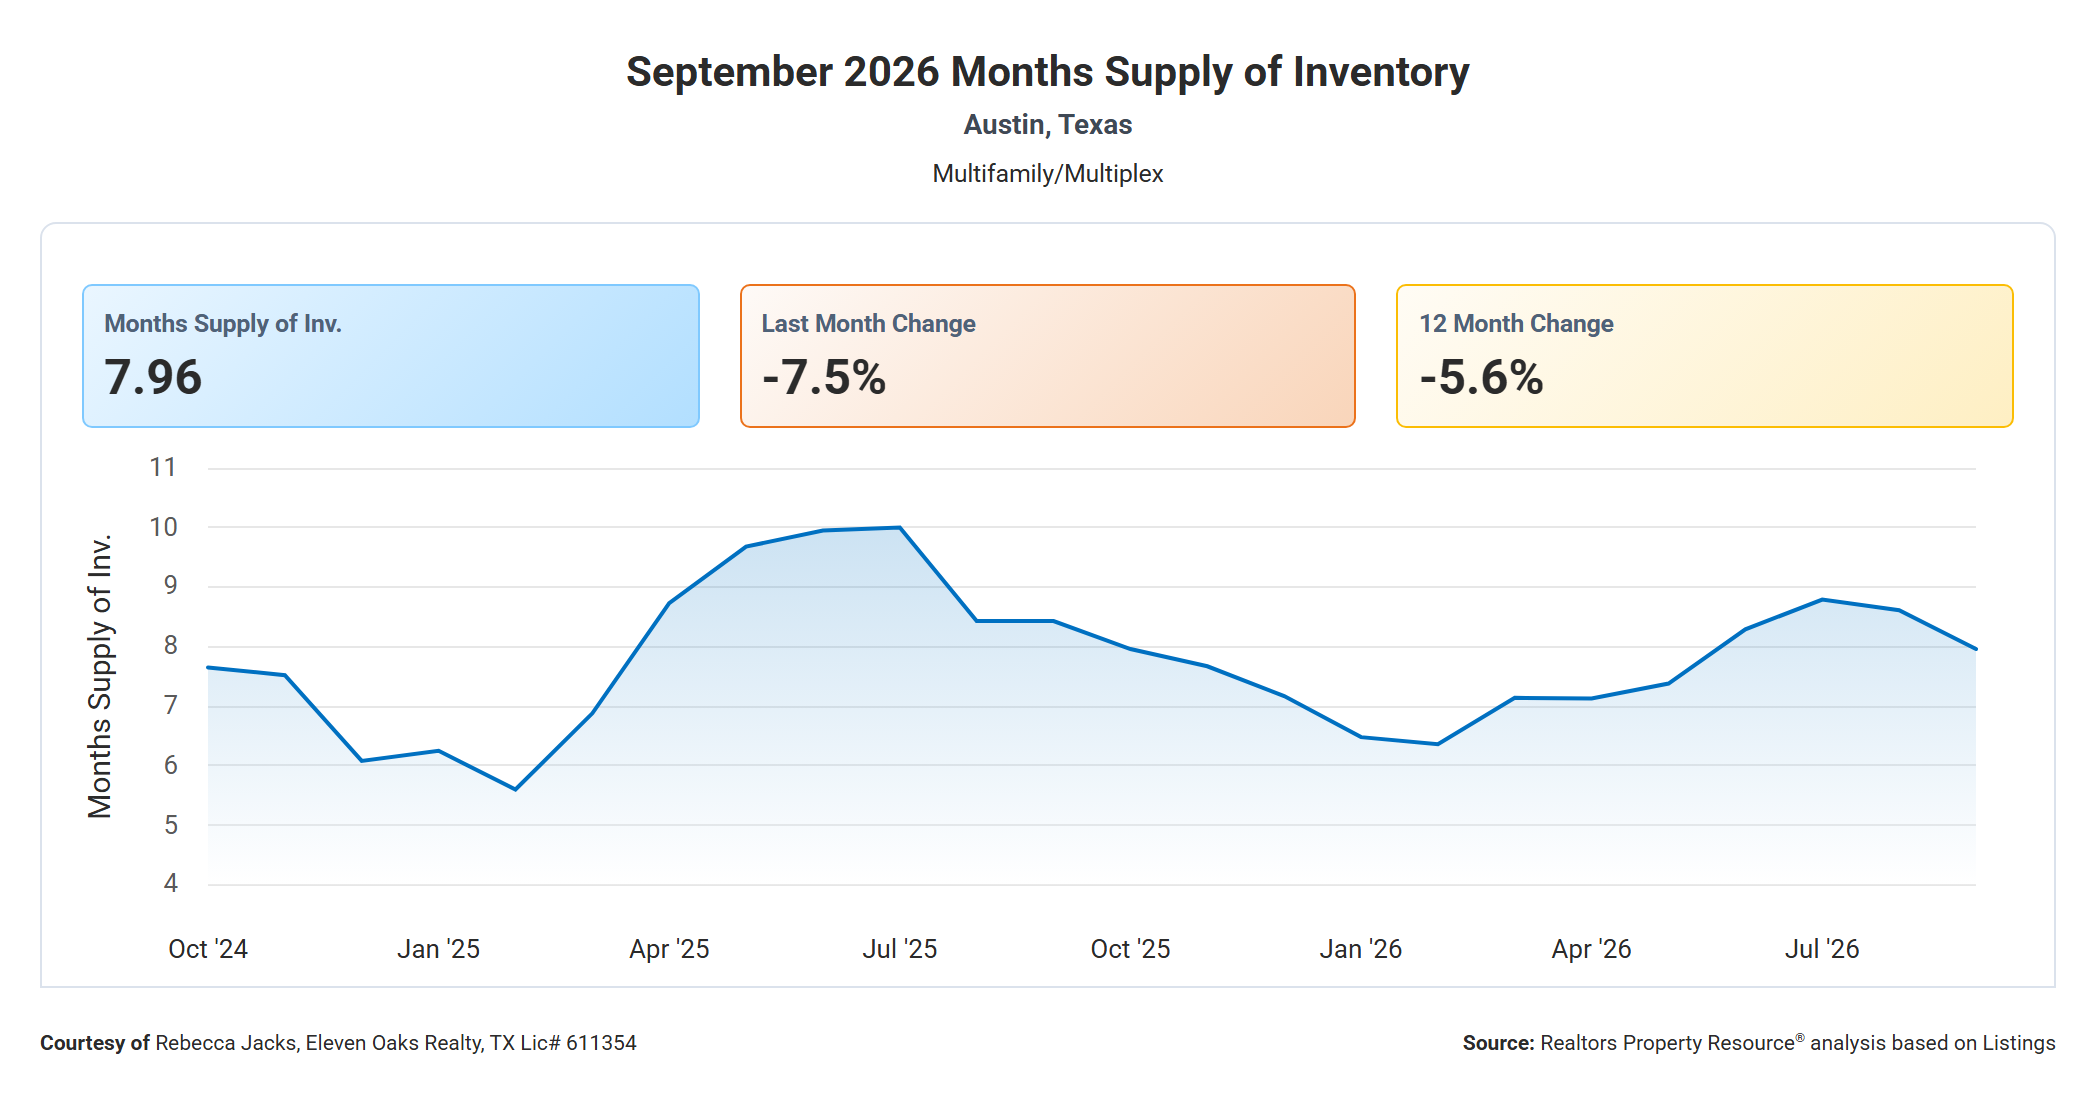
Months supply of inventory for Austin multi family properties was 7.96 in September 2026, down 7.5% from 8.61 in August and down 5.6% from 8.43 in September 2025.
The chart shows a seasonal pattern that repeated in both years. Inventory builds through spring and early summer, peaks in midsummer, then works its way down through fall and winter. In 2025 the peak was about 10 months in July; in 2026 it was about 8.8 months in July. A lower summer peak this year suggests that supply and demand are a little better matched than they were in 2025.
Even after September’s decline, 7.96 months is still well into buyer’s market territory. Sellers should expect the decline to continue into the fall as fewer new listings come on, which could gradually tighten conditions. Buyers have the most choice right now, before seasonal inventory thins out.
New Pending Listings Down 5% Year Over Year
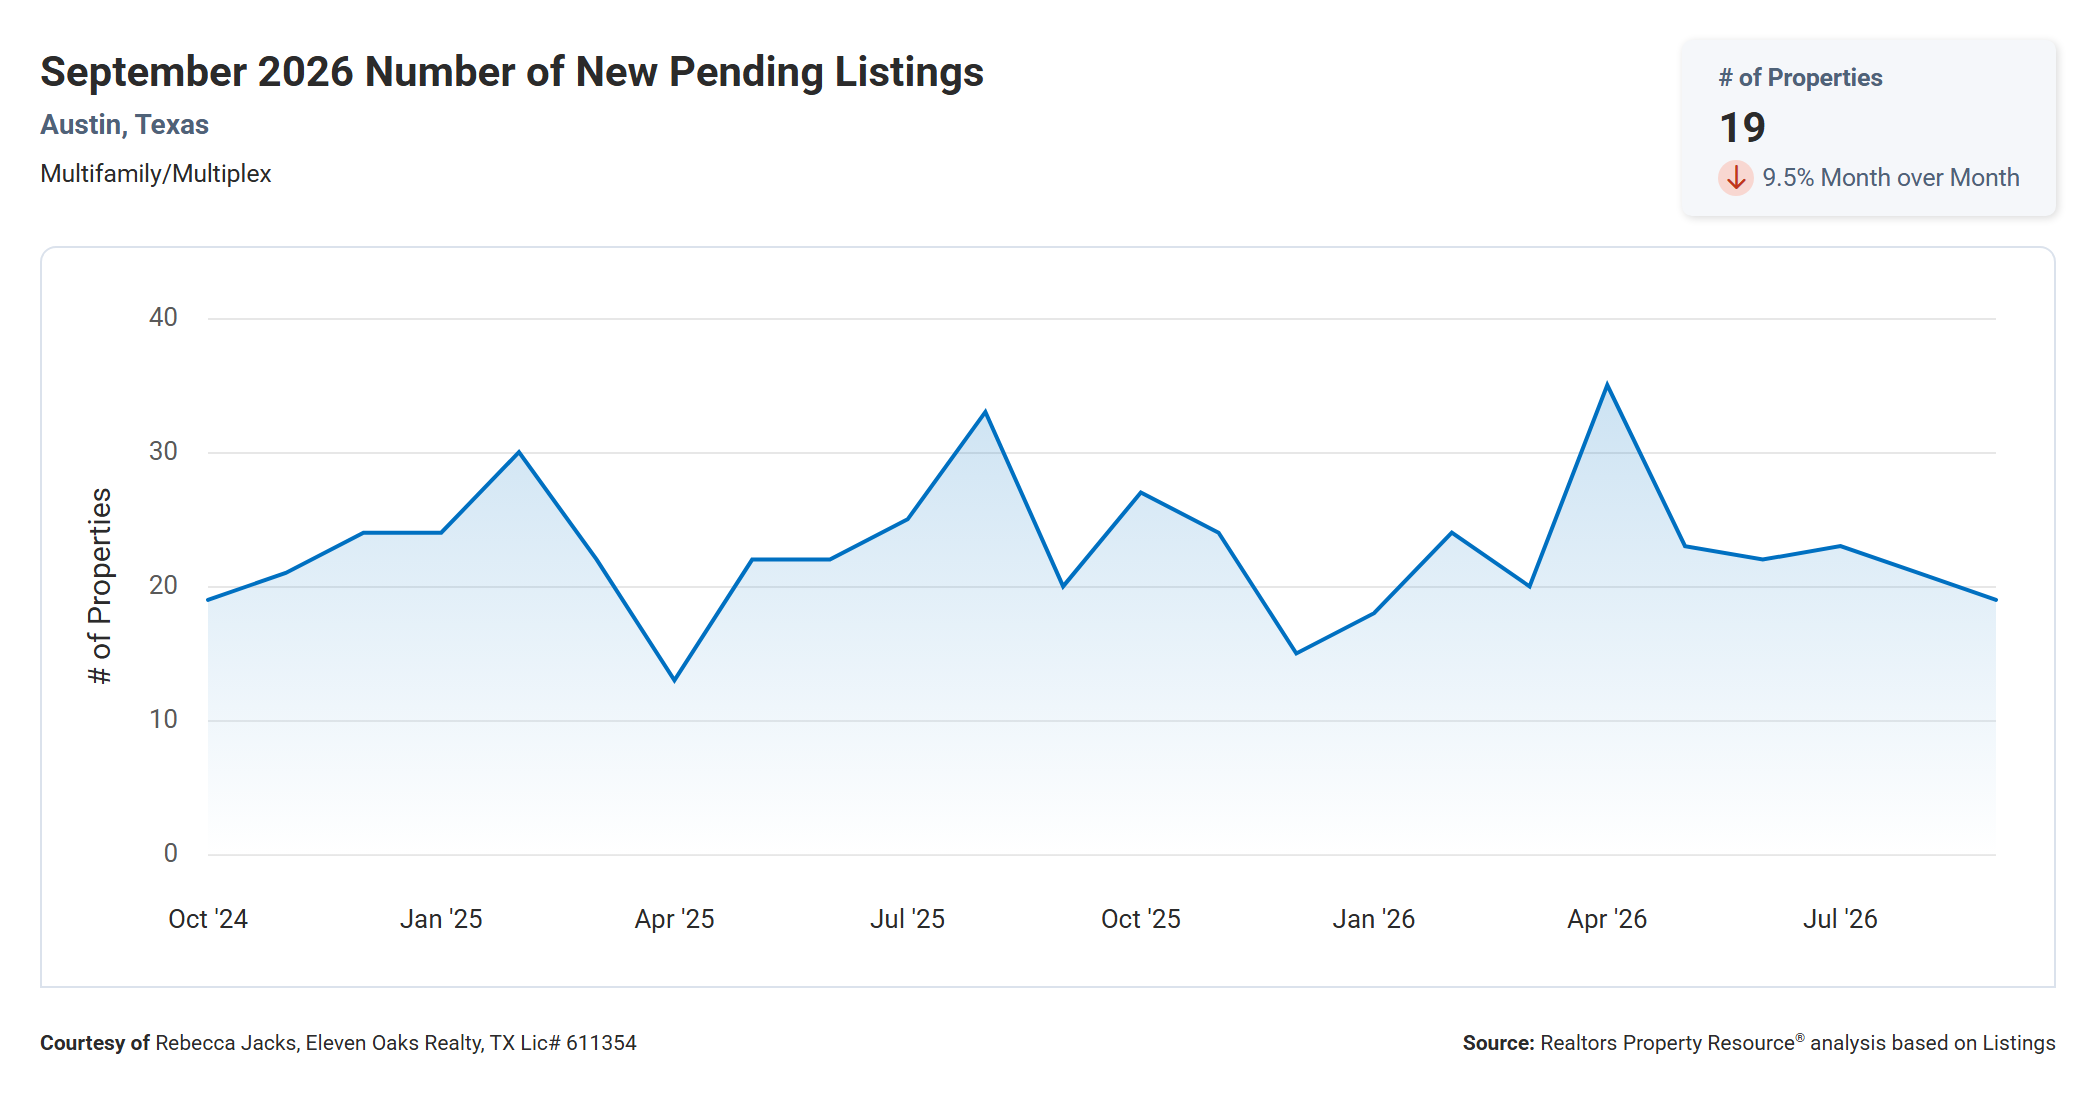
There were 19 new pending multi family listings in Austin in September 2026, down 9.5% from 21 in August and down 5% from 20 in September 2025.
New pending contracts are the best early indicator of where closed sales are headed, since most pendings close within 30 to 45 days. September’s 19 pendings were the lowest count since January 2026, when there were 18, and well below the two-year high of 35 in April 2026. Pendings have now declined gradually from 23 in July to 21 in August to 19 in September.
This points to a slower pace of closings in October and November. It does not signal a sharp downturn, since 19 is close to last September’s 20, but it does suggest that the current buyer pool is limited. Sellers who list this fall should be prepared to compete for a smaller group of active buyers.
Median Active List Price Essentially Flat Year Over Year
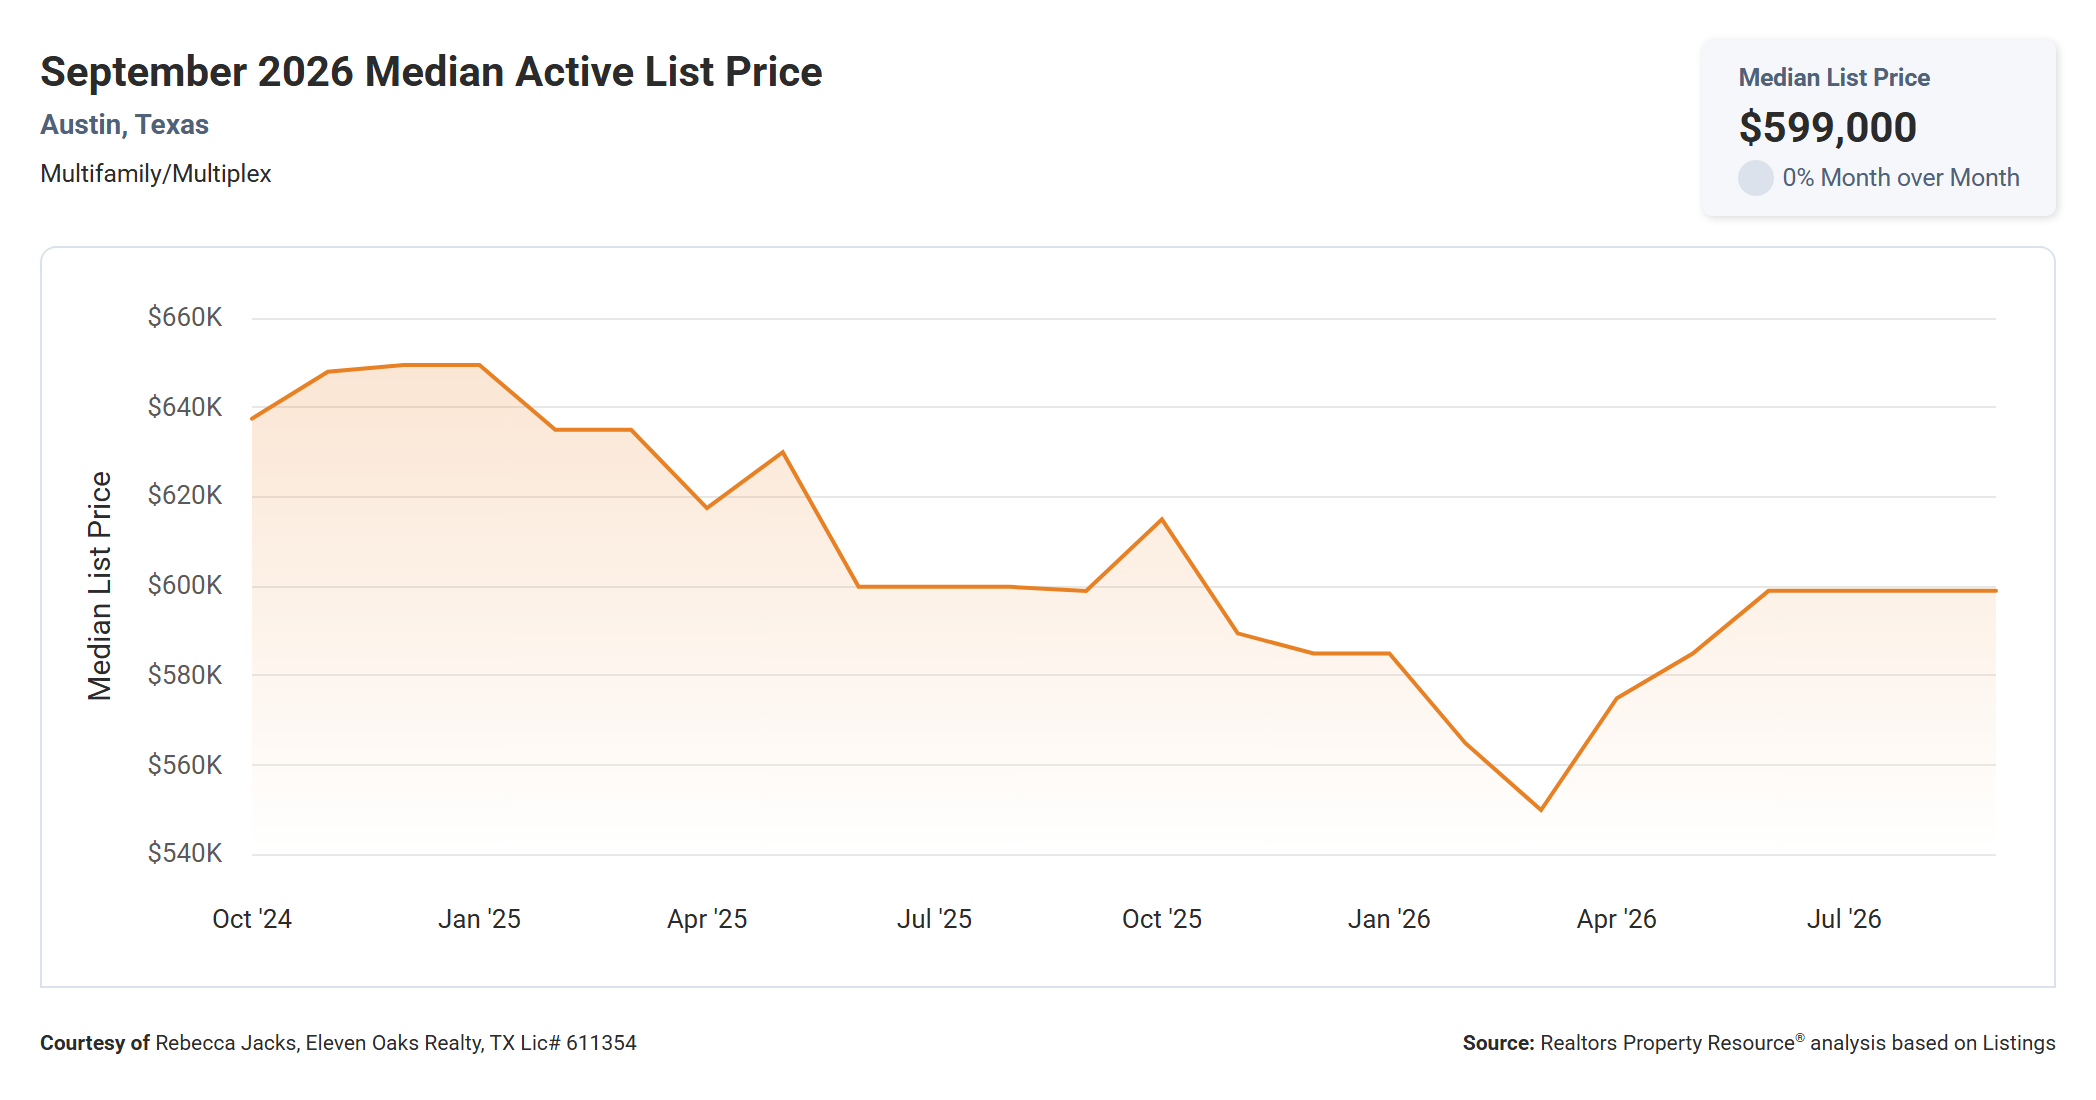
The median active list price for Austin multi family properties was $599,000 in September 2026, unchanged from August and essentially flat compared with $599,000 in September 2025.
Asking prices have held at $599,000 for four straight months, since June 2026. Earlier in the cycle, the median list price was as high as about $650,000 in December 2024 and January 2025, and it bottomed near $550,000 in March 2026 before climbing back.
The more telling number is the gap between asking and selling prices. The median active list price of $599,000 is $108,000 higher than the median sold price of $491,000. Some of that difference reflects larger or higher-end properties that tend to sit on the market longer, but it also suggests that many sellers are listing above what buyers are actually paying. Buyers should look closely at days on market and price history for any listing that has been sitting.
New Listings Down 14.9% Year Over Year
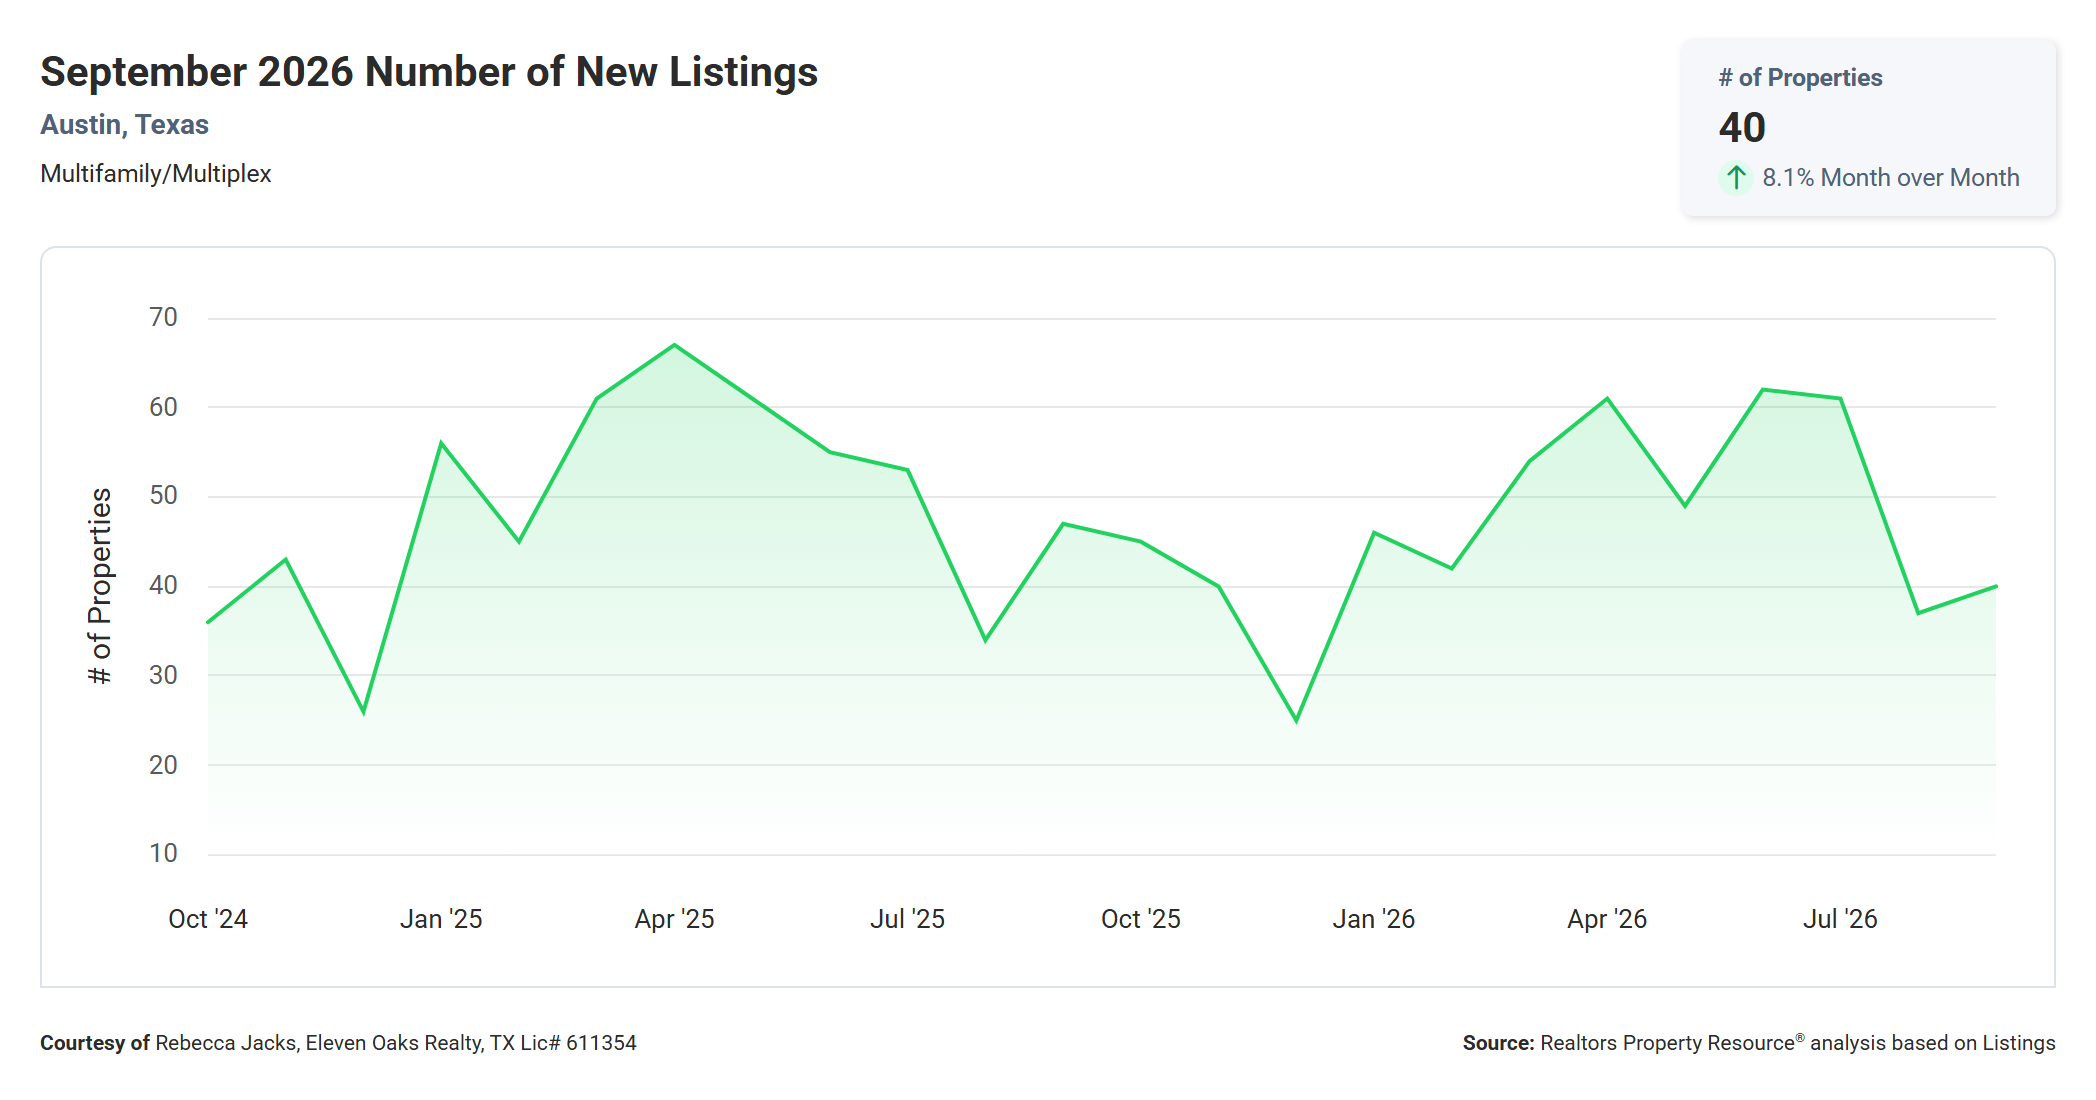
There were 40 new multi family listings in Austin in September 2026, up 8.1% from 37 in August but down 14.9% from 47 in September 2025.
New listings surged in early summer, with 62 in June and 61 in July 2026, then dropped sharply in August. September’s modest increase still leaves new supply well below the summer pace. The chart shows the same seasonal pattern in both years, with new listings typically falling to their lowest levels in November and December.
Fewer new listings help explain why months of inventory and active listings both declined in September. With 40 new listings against 19 new pending contracts, supply is still coming on faster than buyers are absorbing it, which keeps the market in buyer’s territory.
Active Listings Down 5.7% Year Over Year
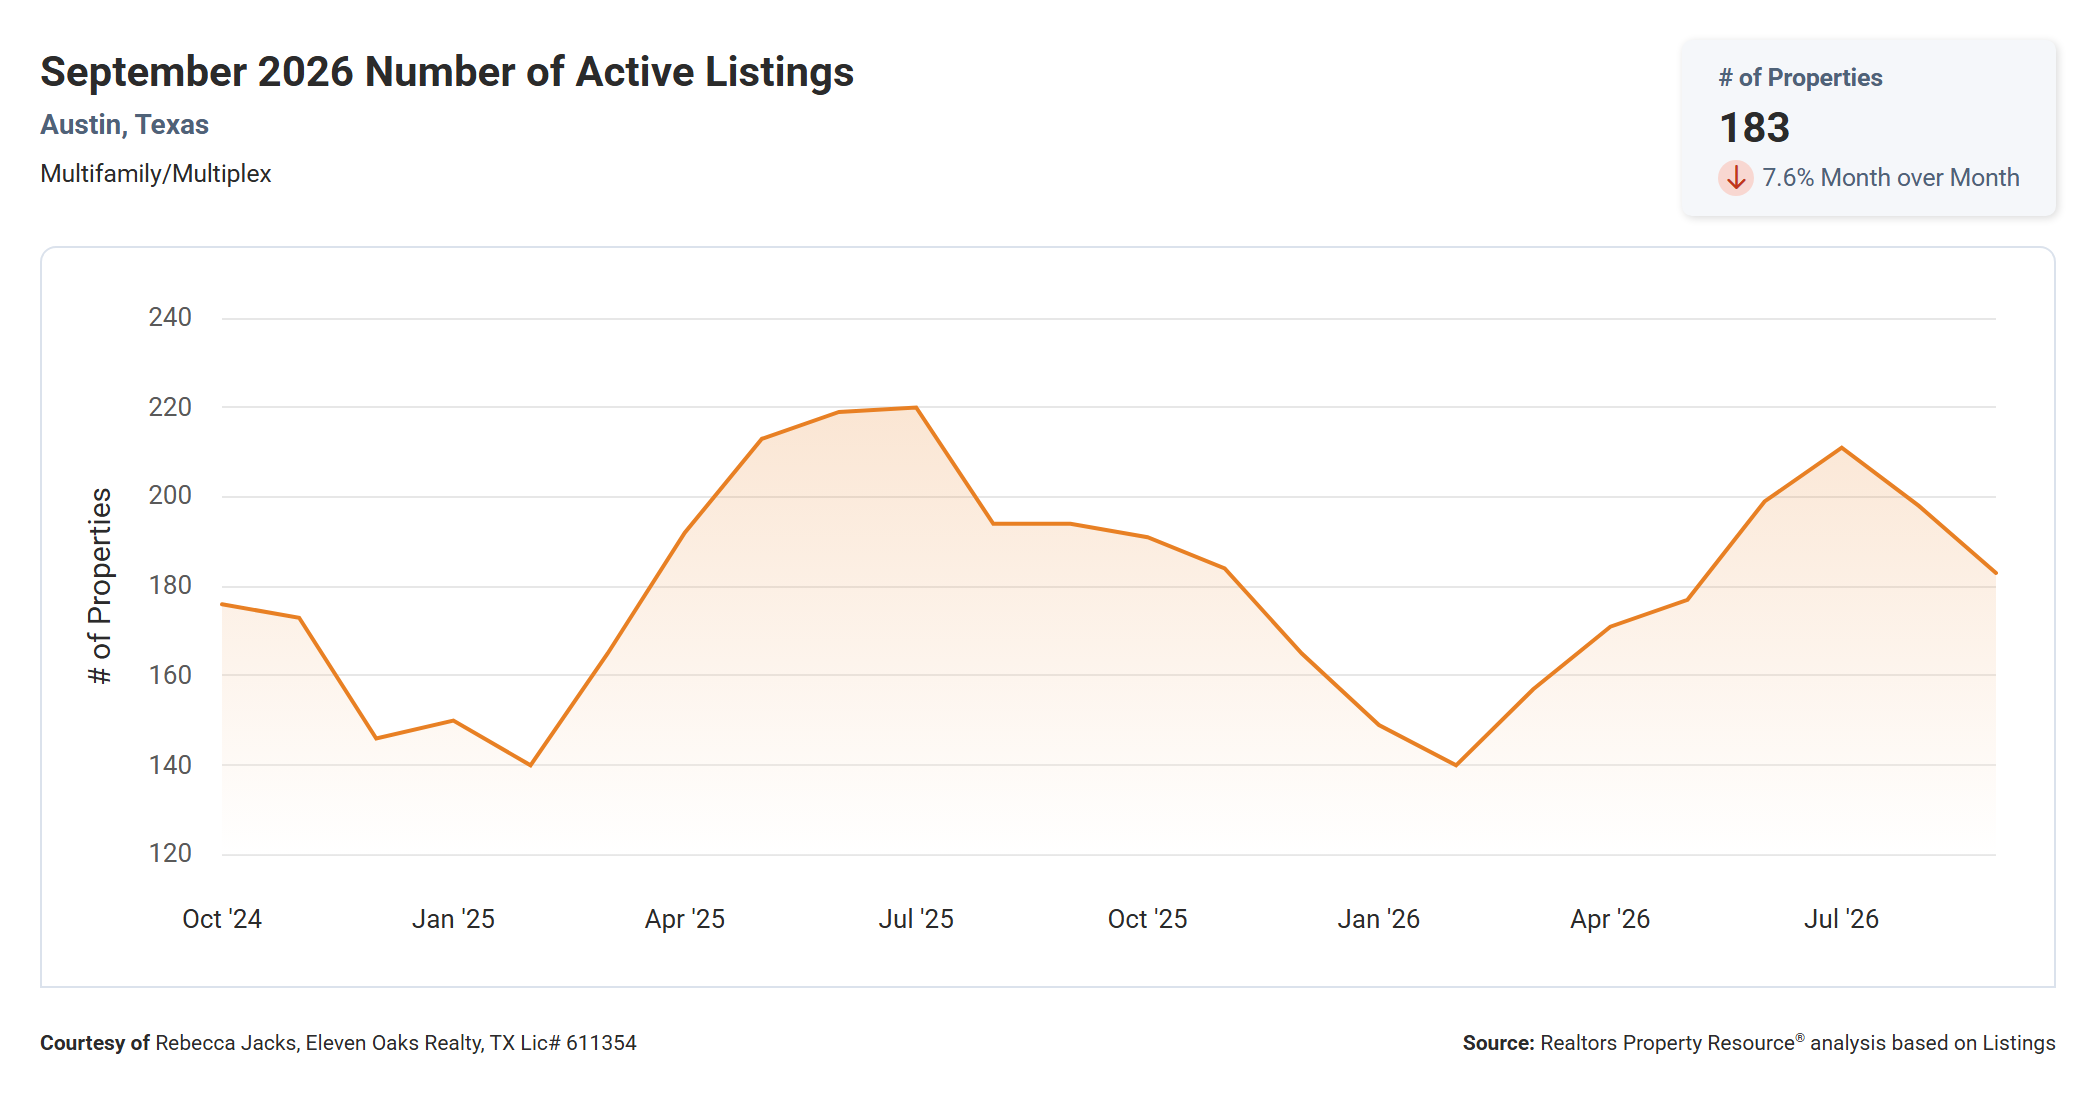
There were 183 active multi family listings in Austin in September 2026, down 7.6% from 198 in August and down 5.7% from 194 in September 2025.
Active inventory peaked at about 211 listings in July 2026, below last year’s summer peak of about 220 in July 2025. Since then, the count has fallen two months in a row. Based on last year’s pattern, when active listings fell to about 140 by February, inventory will likely keep declining through the winter.
For buyers, 183 active listings still offers a solid selection of duplexes, triplexes, and quadplexes to choose from. For sellers, it means real competition, since your property is one of nearly 200 on the market and buyers have time to compare.
September 2026 Austin Multi Family Real Estate by the Numbers
The table below is pulled directly from the Austin Board of REALTORS MLS statistics for September 2026 and covers 20 closed multi family transactions (duplex, triplex, and quadplex) in the city of Austin.
| Min | Max | Avg | Median | |
|---|---|---|---|---|
| Sq Ft | 1,485 | 5,604 | 2,437 | 2,017 |
| Lot Sq Ft | 6,534 | 49,510 | 11,503 | 8,644 |
| Acres | 0.150 | 1.137 | 0.264 | 0.198 |
| List Price | $260,000 | $1,450,000 | $643,702 | $511,900 |
| LP/Sq Ft | $133.18 | $596.16 | $266.98 | $238.37 |
| Close Price | $265,000 | $1,325,000 | $616,050 | $491,000 |
| CP/Sq Ft | $123.83 | $544.32 | $256.18 | $234.74 |
| CP/LP% | 86.00% | 108.00% | 96.30% | 96.50% |
| CP/OLP% | 82.00% | 100.00% | 92.40% | 93.00% |
| ADOM | 1 | 219 | 54 | 42 |
The most expensive multi family property that sold in September 2026 sold for $1,325,000 and the least expensive sold for $265,000. Properties ranged in size from 1,485 to 5,604 square feet with an average size of 2,437 square feet. The average price per square foot was $256.18 with the lowest being $123.83 per square foot and the highest being $544.32 per square foot. It took, on average, 54 days to sell a multi family property in Austin and sellers received, on average, 92.4% of their original list prices.
The difference between the CP/LP% and CP/OLP% figures is where the story is for sellers. On average, sellers received 96.3% of their final list price but only 92.4% of their original list price. That 3.9 point gap means many sellers had to reduce their asking price before finding a buyer. On a $500,000 property, the difference between those two ratios is roughly $19,500. At the low end, one seller accepted just 82% of the original list price, while the best result was a sale at 100% of the original asking price. One property even sold at 108% of its final list price, which shows that well-priced properties can still draw strong offers.
Days on market ranged from a single day to 219 days, with an average of 54 and a median of 42. The average is higher than the median because a few properties sat for a long time and pulled the average up. The MLS median close price of $491,000 matches RPR’s median exactly. The MLS median price per square foot of $234.74 is a bit lower than RPR’s $241, which reflects small differences in how each source calculates square footage and which sales are included. With only 20 transactions, a single large sale, such as the $1,325,000 property this month, can noticeably change the average figures.
The Average Sale Price Runs 25% Above the Median
The average close price in September was $616,050, or $125,050 higher than the median close price of $491,000. That is a 25.5% spread, and it tells you something important about how this market is structured.
Most Austin multi family sales are concentrated in a fairly narrow range around the median. A smaller number of larger or newer properties, including this month’s $1,325,000 sale and the 5,604 square foot property at the top of the size range, pull the average well above what a typical buyer pays. The median list price of $511,900 compared with an average list price of $643,702 shows the same pattern on the listing side.
If you are trying to understand what a typical multi family property is selling for, use the median. If you own one of the larger or higher-end properties, look at comparable sales in your own segment rather than the overall market figures, because the overall median will understate your value and the average can overstate it.
Austin Multi Family Prices Over the Past Two Years
The RPR charts in this report cover October 2024 through September 2026, and together they show a market that has reset to a lower price level. In 2025 the median sold price regularly reached $600,000 or more and median price per square foot topped $280 several times. In 2026 the median sold price has not reached $540,000 in any month, and price per square foot has stayed below $260.
At the same time, other indicators suggest the decline is slowing. Months of inventory and active listings both peaked lower this summer than last summer, time on market has stabilized in the 40s, and the sold to list ratio has risen three months in a row. The median active list price recovered from about $550,000 in March 2026 to $599,000 and has held there since June.
For long-term investors, this combination of lower prices and stabilizing activity deserves close attention. It does not guarantee that prices have bottomed, but it does mean today’s buyers are purchasing at levels well below the 2025 peaks.
What This Means for Multi Family Buyers
Prices are meaningfully lower than they were a year ago. The median sold price of $491,000 is $71,450 below September 2025, and median price per square foot is down $33. If you are buying an investment property, that lower entry price directly improves your projected cap rate and cash on cash return, assuming rents in your target area have held steady.
You still have negotiating room, though less than you did earlier this year. Buyers paid 96.41% of the final list price on average, and sellers received only 92.4% of their original list price. With 7.96 months of supply and 183 active listings, you can afford to be selective, ask for repairs or seller concessions, and walk away from a property that does not meet your numbers.
Multi family buyers are often investors, so the rental side of the equation matters as much as the purchase price. Before making an offer, verify current leases, rent rolls, and vacancy history, and compare rents to similar units nearby. A lower purchase price only helps if the income supports your financing and your goals.
Timing may be shifting slightly. New pending contracts have fallen for two straight months, which means competition from other buyers is light right now. At the same time, inventory usually shrinks through the fall and winter, so the widest selection is available now rather than in December or January.
What This Means for Multi Family Sellers
Buyer demand is steady but limited. With 20 closed sales and 19 new pending contracts in September, the number of buyers actively purchasing multi family property in Austin is small, and pendings are trending down. Your property needs to stand out to the buyers who are in the market.
Competition is real. There are 183 active multi family listings and nearly eight months of supply, so buyers have plenty of alternatives. Properties that are priced well, show well, and come with clear financial information (rent rolls, leases, expenses) are the ones closing in 30 to 45 days.
Pricing discipline matters more in multi family than in almost any other segment. The 3.9 point gap between CP/LP% and CP/OLP% shows that many sellers started too high and had to cut their price. In a market with fewer qualified buyers, an overpriced listing can sit for months, and the September data includes a property that took 219 days to sell. Pricing correctly from the start usually produces a better result than chasing the market down.
There are some encouraging signs. The sold to list ratio has risen three months in a row, time on market is down 28.4% from last year, and inventory is shrinking. If those trends continue, conditions for sellers could gradually improve, but the market is still firmly in buyer’s territory today.
Market Summary and Outlook
September 2026 showed a market that regained some footing after a weak August. The median sold price rose 7.6% to $491,000, total sales volume climbed 9.5%, and buyers paid a higher share of list price than at any point since spring 2025. Inventory also declined, with months of supply falling from 8.61 to 7.96. The number of sales and new pending contracts slipped, however, which shows that the improvement came from pricing rather than a surge in demand.
Compared with a year ago, the Austin multi family market is clearly softer on price and volume. The median sold price is down 12.7%, price per square foot is down 12%, total volume is down 17.5%, and sales are down 20%. The bright spots are a faster median time to sell, down 28.4%, and slightly lower inventory than in September 2025.
The key question for the coming months is whether buyer demand holds up as inventory declines seasonally. If pending contracts stabilize around 20 per month while new listings drop into the 20s and 30s as they did last winter, months of supply could fall noticeably and give sellers a bit more leverage heading into 2027. Financing costs for investment property will also continue to play a major role in how many buyers are active.
Austin’s long-term fundamentals for multi family remain grounded in population growth, a large renter population, and steady demand for housing near employment centers and universities. Those factors do not prevent price corrections like the one the market has seen since 2025, but they do support rental demand over time. Investors who buy at today’s lower prices with solid income numbers are positioned differently than those who bought at the 2025 peaks.
Action Items for Multi Family Buyers
- Use the median sold price of $491,000 and median price per square foot of $241 as your baseline when evaluating listings, rather than the $599,000 median asking price.
- Ask for the full price history on any property that has been on the market longer than 48 days, since sellers who have already reduced their price may be open to further negotiation.
- Request rent rolls, current leases, and at least 12 months of operating expenses before making an offer, and base your offer on verified income rather than projected rents.
- Take advantage of the current selection of 183 active listings now, since inventory has historically dropped significantly through the fall and winter.
- Plan your negotiation around the current sold to list ratio of 96.41%, and remember that the average seller accepted 92.4% of their original list price.
- Get preapproved with a lender who regularly finances investment property, so you understand your true borrowing costs and can move quickly when the right duplex, triplex, or quadplex comes up.
Action Items for Multi Family Sellers
- Price your property based on 2026 comparable sales, not 2025 sales, since the median sold price is 12.7% lower than it was a year ago.
- Aim to list at a price that will not need to be reduced, because the 3.9 point gap between CP/LP% and CP/OLP% shows how much sellers lose when they start too high.
- Prepare a complete financial package with rent rolls, leases, utility costs, and recent repairs, since multi family buyers are evaluating your property as an investment.
- Address deferred maintenance and needed repairs before listing, because with 183 competing listings buyers will choose the property that needs the least work at a given price.
- Expect a typical marketing period of about 45 to 55 days, and plan your timeline and any tenant notices accordingly.
- Watch new pending contracts and months of supply over the next 60 days, since a continued decline in inventory could improve your negotiating position heading into early 2027.
Final Word on the Market
The Austin multi family market in September 2026 rewards preparation on both sides. Buyers who know their numbers can negotiate from a position of strength in a market with nearly eight months of supply. Sellers who price realistically and present their property well are still selling at 96% or more of their list price in about a month and a half.
The numbers point to a market that is lower than last year but showing early signs of stabilizing. For buyers, especially long-term investors, this is a reasonable time to buy if the income supports the purchase, because prices are well below 2025 levels and competition is limited. For sellers, it is a workable time to sell if you price to the current market, though waiting for 2025 prices to return is not a strategy the data supports right now.
Let the data guide your decision. Every investment and every property is different, so make the choice that fits your financial situation and your long-term goals.
Questions About the September 2026 Austin Multi Family Real Estate Price Report?
Have questions about what the September 2026 Austin Multi Family Real Estate Price Report means for your specific situation? We are happy to help. If you are thinking about buying a multi family property in Austin, our Buyers page has resources to help you understand the process and get started. If you are thinking about selling, our Sellers page walks through what to expect in today’s market.
Reach out to Rebecca Jacks and the team at Eleven Oaks Realty. Call or text (512) 827-8323 or email info@11OaksRealty.com. We have been helping buyers and sellers since 1978 and we are here to help you make the best decision for your situation, whatever that looks like.
Data sources: Realtors Property Resource (RPR), Austin Board of REALTORS MLS. All figures are for multi family residential properties (duplex, triplex, and quadplex) in the city of Austin. Reported figures reflect September 1, 2026 through September 30, 2026. Some variation between data sources may exist due to differing methodology and timing of data pulls.




Leave a Reply