
Eleven Oaks Realty is proud to present their February 2026 Austin Real Estate Price Report measuring activity in the single family home market.

February 2026 brought a clear message to the Austin real estate market: buyers are back. After a slow January, closed sales jumped 27.3% month over month, new listings surged 22.5%, and pending contracts rose 16.7%. The spring market is not just arriving, it arrived early. For anyone on the fence about buying or selling, this report breaks down exactly what happened in February and what it likely means for the months ahead.
All data below covers single-family residential homes in the city of Austin. Data is sourced from Realtors Property Resource (RPR) and the Austin Board of REALTORS MLS. Some metrics may vary slightly between sources due to differing methodology; where differences exist, they are noted.
The Austin Real Estate Market is a Seller’s Market
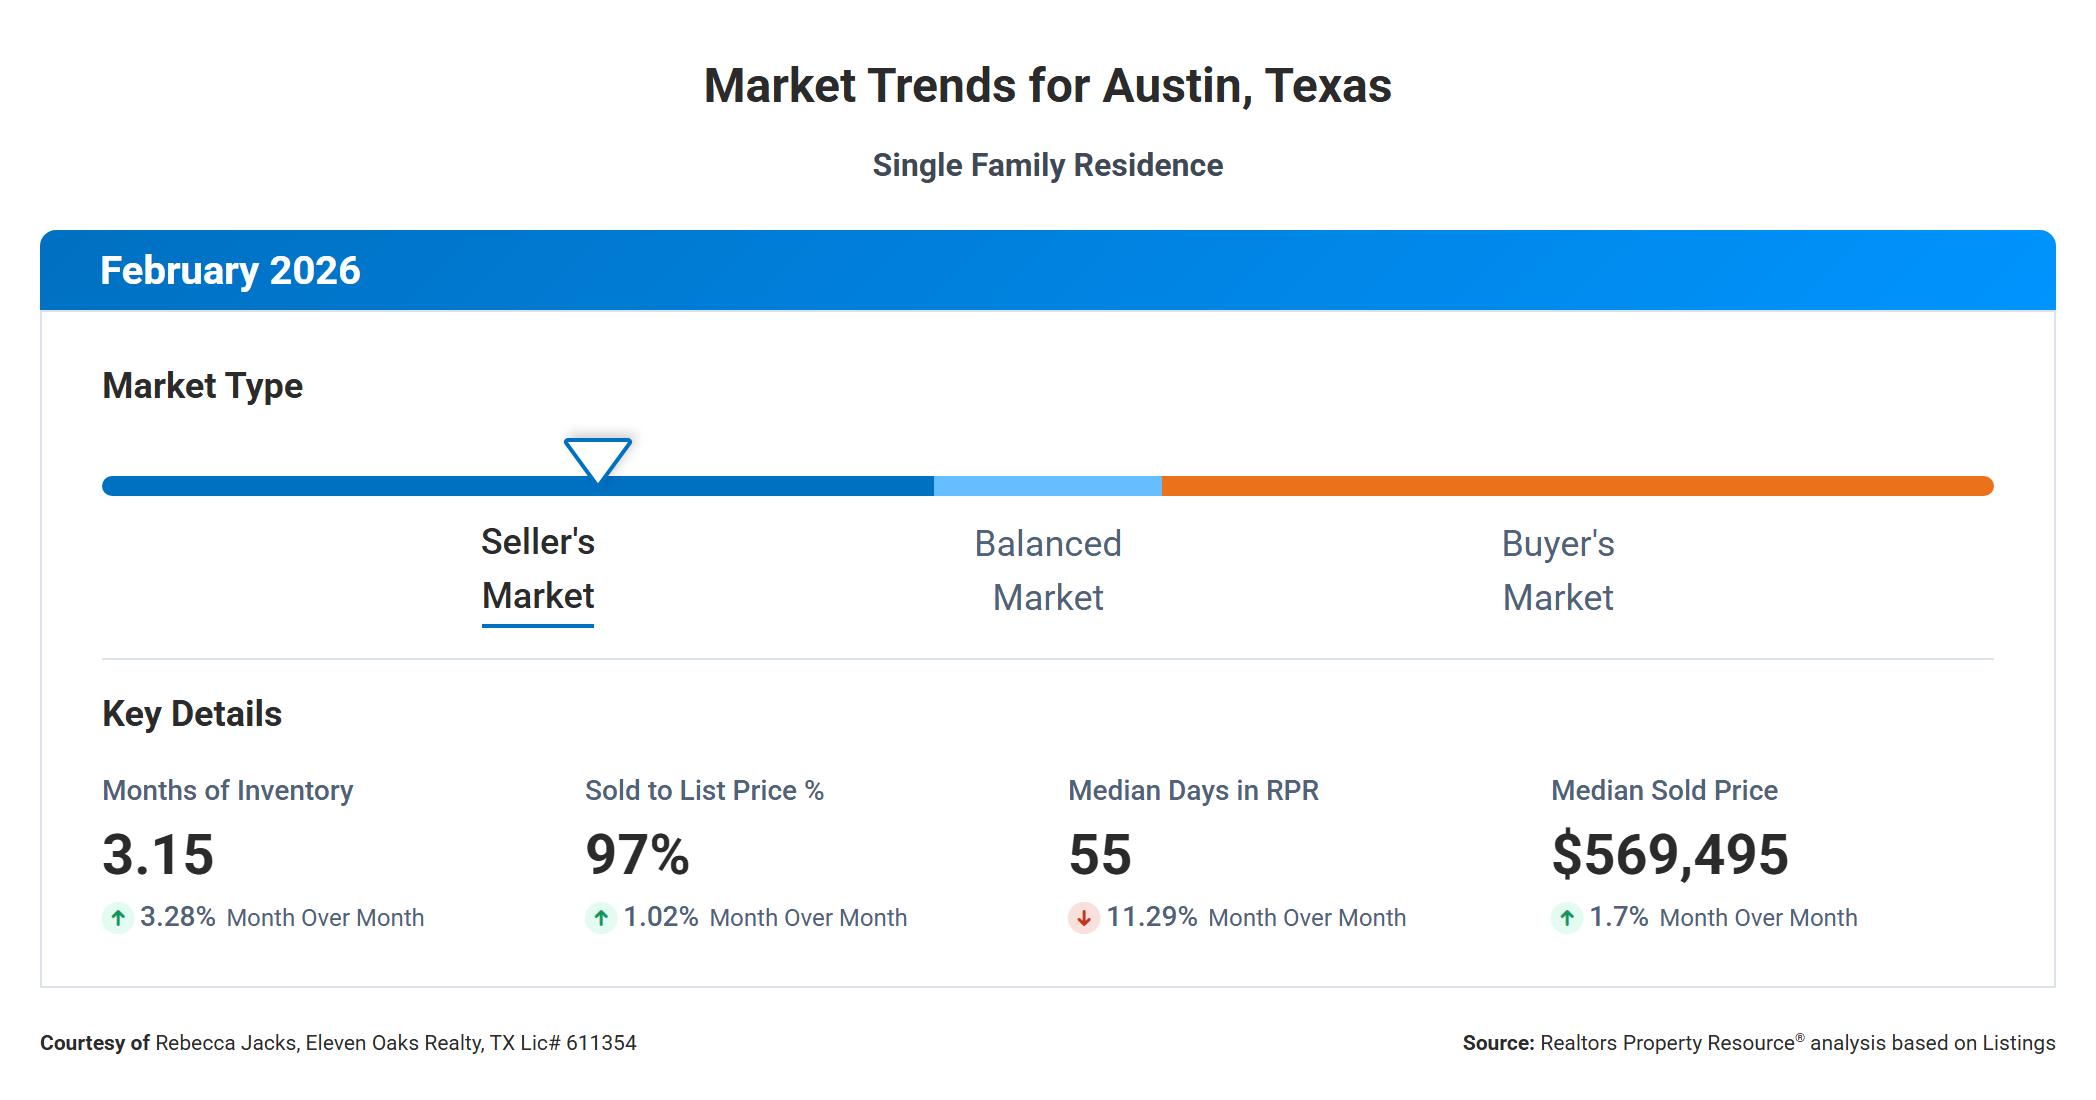
The RPR Market Trends report classified Austin as a Seller's Market in February 2026, with a months supply of inventory sitting at 3.15. That figure is technically below the 4-month threshold that separates seller-favorable conditions from a balanced market, though it is considerably more restrained than the ultra-tight 1-to-2-month environment Austin experienced in 2021 and early 2022.
The four key metrics from the Market Trends dashboard tell a consistent story of gradual recovery:
Months of inventory came in at 3.15, up 3.28% from January, reflecting the typical seasonal uptick as more sellers list in the spring. The sold-to-list price percentage held at 97%, up about 1% from January, meaning sellers are getting closer to their asking price as buyer activity picks up. The median days in RPR dropped to 55, an 11.29% improvement from January's 62 days, which tells us homes that are priced correctly are moving faster. And the median sold price landed at $569,495, a 1.7% increase from January's $560,000.
Taken together, these signals point to a market that steadied through the winter and is gaining momentum heading into spring.
Median Sold Price Down 4.3% Year Over Year
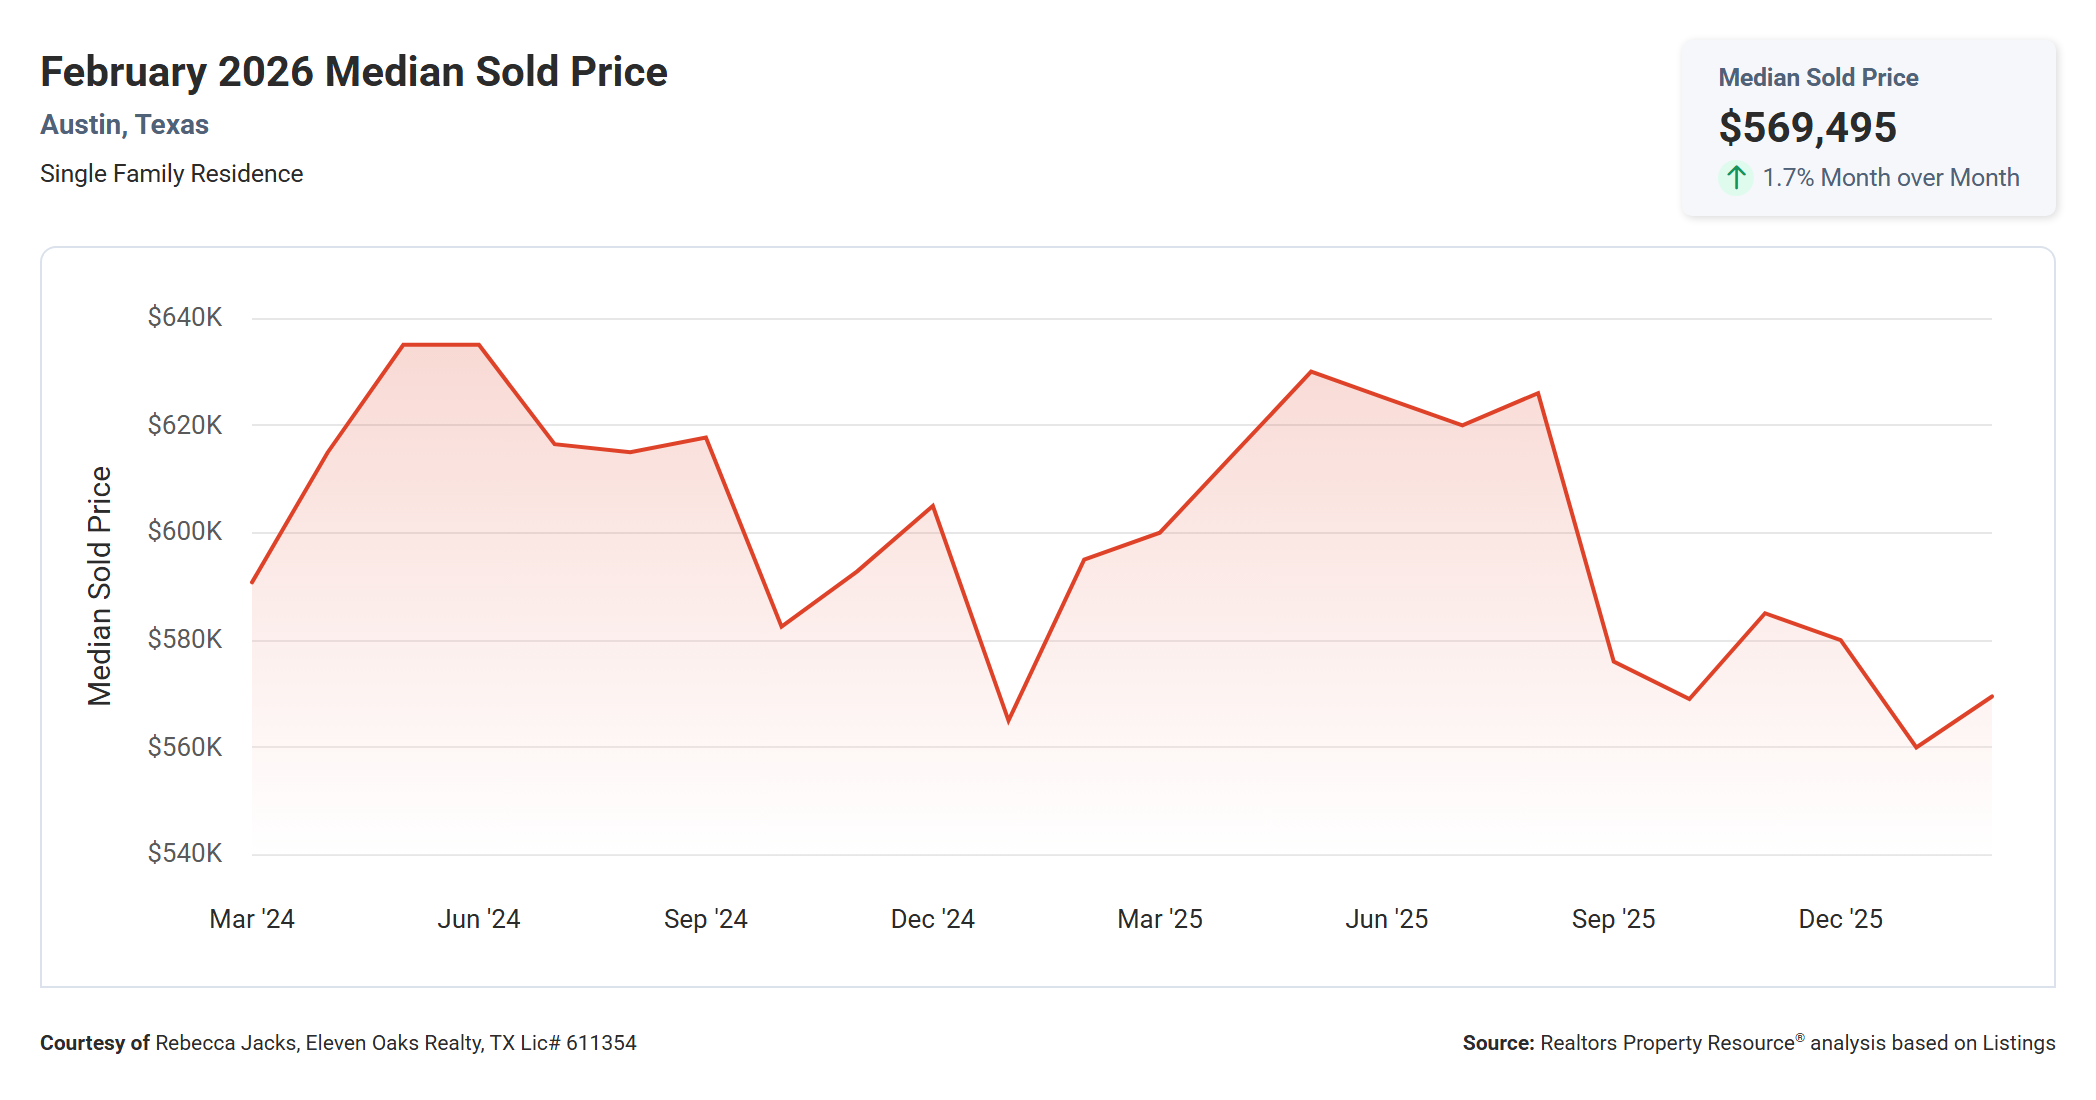
The median sold price for a single-family home in Austin in February 2026 was $569,495, up 1.7% from January's $560,000 and down 4.3% from February 2025's $595,000.
The two-year chart on this graph tells the full story of Austin's price cycle. Prices ran hot through spring and early summer 2024, peaking around $630,000, before softening through fall and hitting a low near $565,000 in December 2024. They bounced modestly in early 2025, climbed again to the $620,000 to $630,000 range by late spring 2025, and have since trended back down through the second half of 2025 and into early 2026.
Where does that leave buyers and sellers today? The median price is roughly 9-10% below the most recent peak from June 2025. That is real money. On a $600,000 home, the difference between peak and current pricing represents approximately $54,000 to $60,000. For buyers who held off during the 2025 spring surge, February 2026 presents meaningfully better pricing than they would have found a year ago.
The month-over-month uptick from January to February is consistent with seasonal patterns and does not necessarily signal the start of a sustained price run. That said, prices have not revisited the December 2024 low either, which suggests a floor may be forming in the $560,000 to $570,000 range.
Median Active List Price Down 2.3% Year Over Year
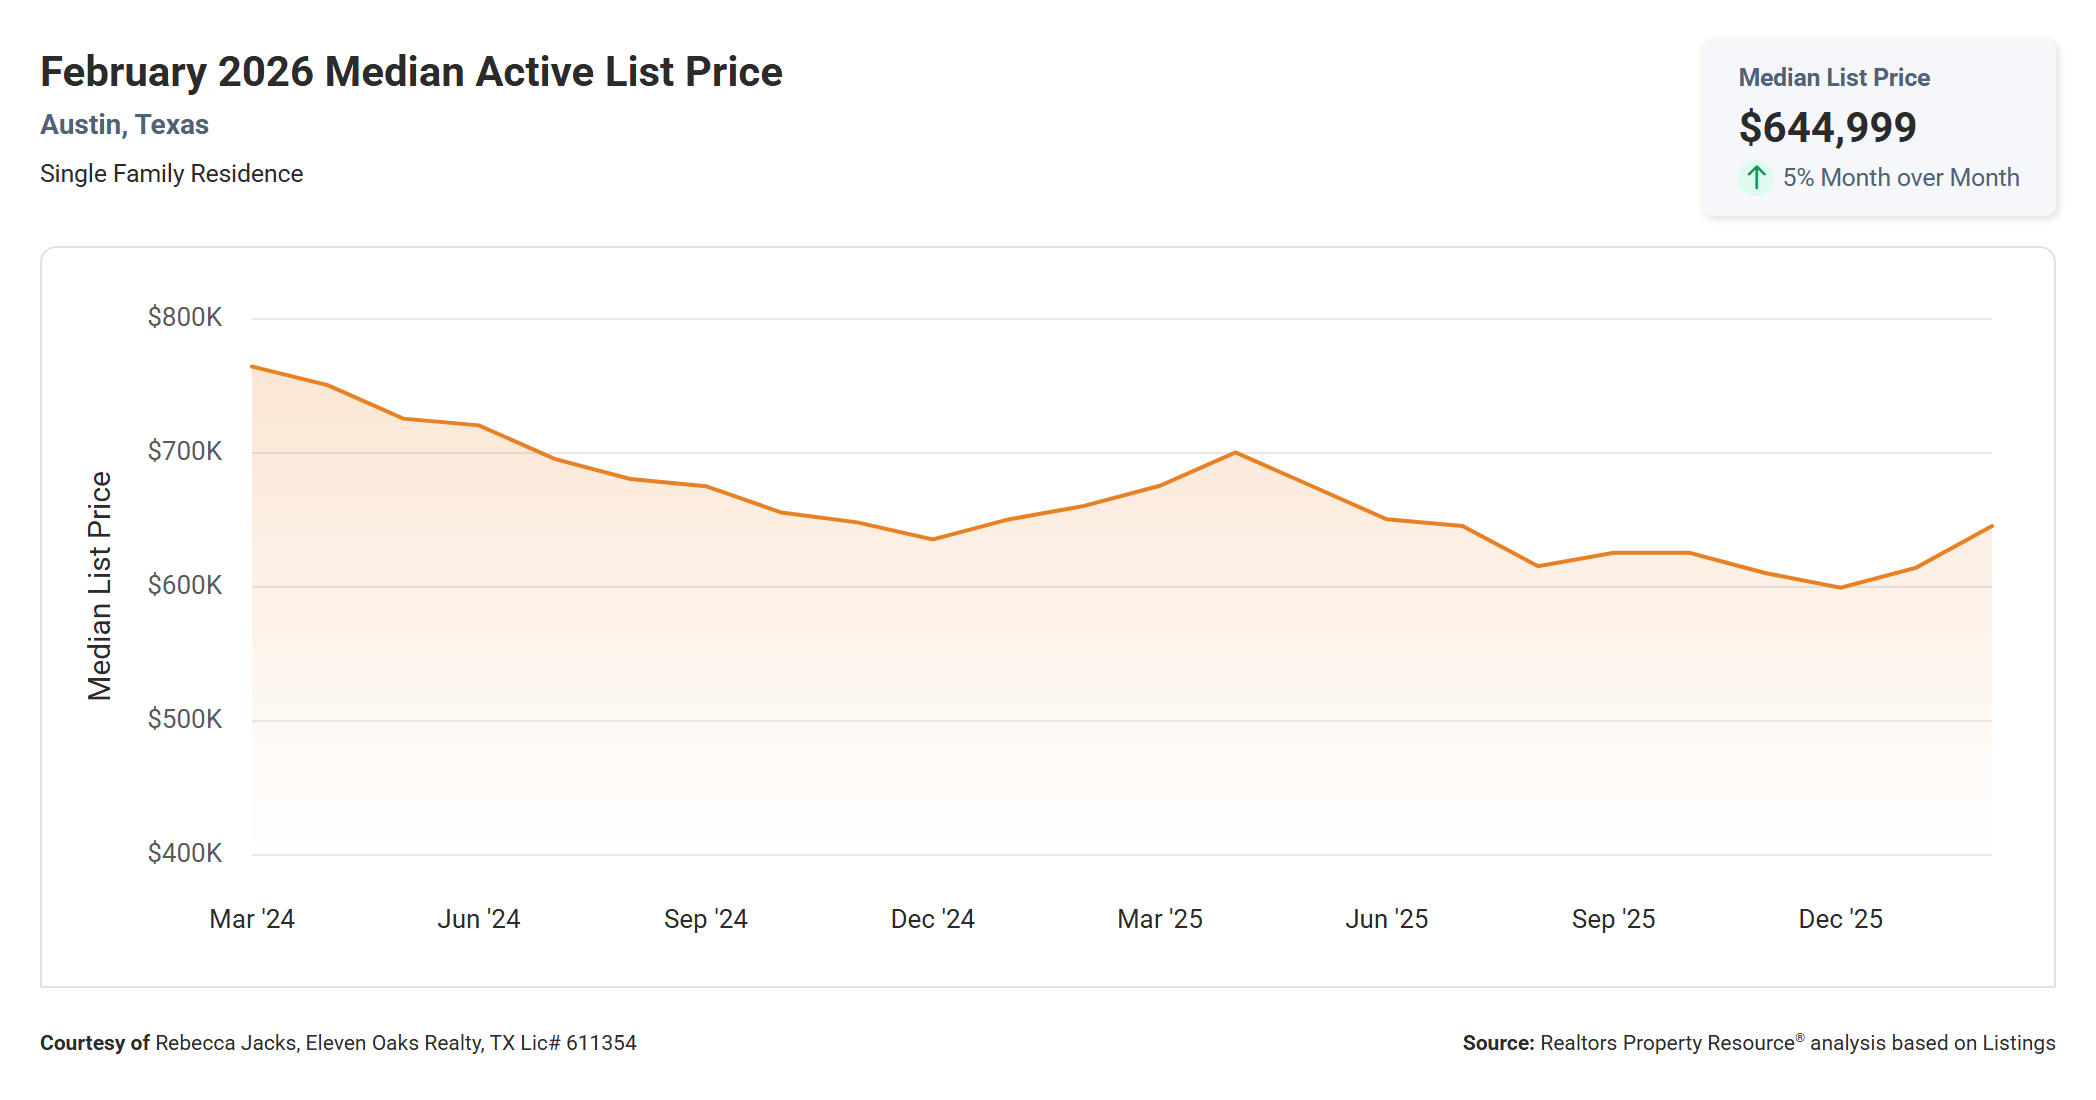
The median active list price in February 2026 was $644,999, up 5% from January's $614,000 and down 2.3% from February 2025's $660,000.
The jump from $614,000 to $644,999 in a single month is meaningful. It reflects the arrival of spring listings, which tend to skew higher than the winter inventory that carried over from the holidays. Sellers listing in February and March generally have more confidence in the market and price accordingly.
The gap between the median list price ($644,999) and the median sold price ($569,495) is worth paying attention to. That is a difference of roughly $75,500, or about 11.6%. Part of this gap reflects homes that are actively listed but have not yet sold, including overpriced listings that may sit for months. Part of it reflects the luxury segment, where high-priced listings pull the median up. Either way, it tells buyers that listed prices and closed prices are not the same thing, and that negotiation room exists in this market.
Looking at the two-year trend, list prices peaked around $750,000-$760,000 in early 2024 before falling steadily through the year. They partially recovered in early-to-mid 2025 and have since come back down. The February 2026 figure of $644,999 sits roughly in the middle of the two-year range.
Median Price Per Square Foot Down 5.0% Year Over Year
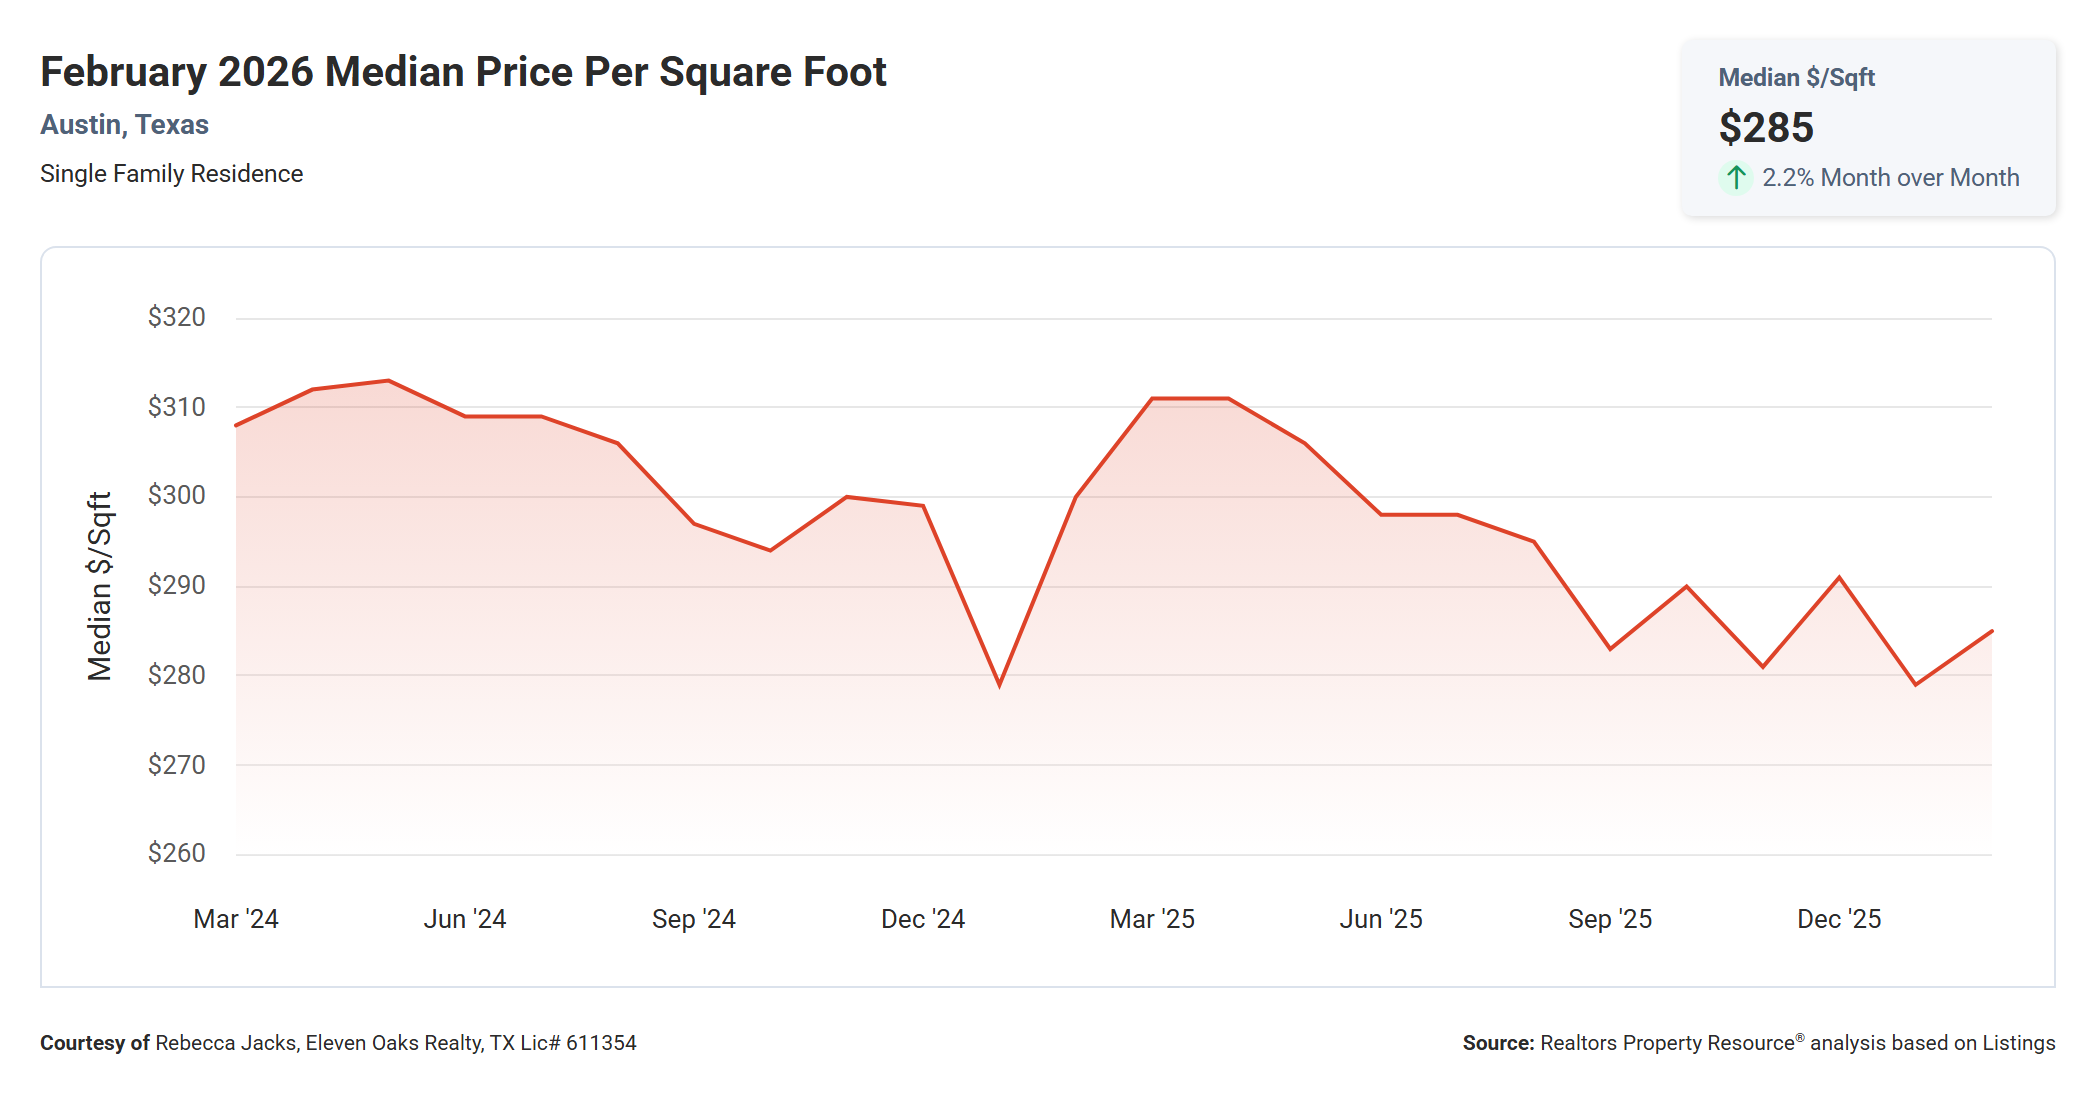
The median price per square foot in February 2026 was $285, up 2.2% from January's $279 and down 5% from February 2025's $300.
Price per square foot is one of the cleanest ways to compare value across homes of different sizes and configurations. At $285, buyers are paying significantly less per foot than they were a year ago, and dramatically less than the $310 to $315 per foot that was common in early 2024. If you are buying a 2,000-square-foot home, the difference between $300/sqft and $285/sqft is $30,000. That kind of shift materially changes what buyers get for their money.
The two-year chart shows a volatile but generally declining trend in price per square foot, with the low point hitting around $278 in December 2024. The current $285 represents a modest recovery from that floor, but the overall trajectory from the 2024 peak is still clearly downward. Sellers should factor this in when setting expectations.
Average Sold to List Price Essentially Unchanged Year Over Year
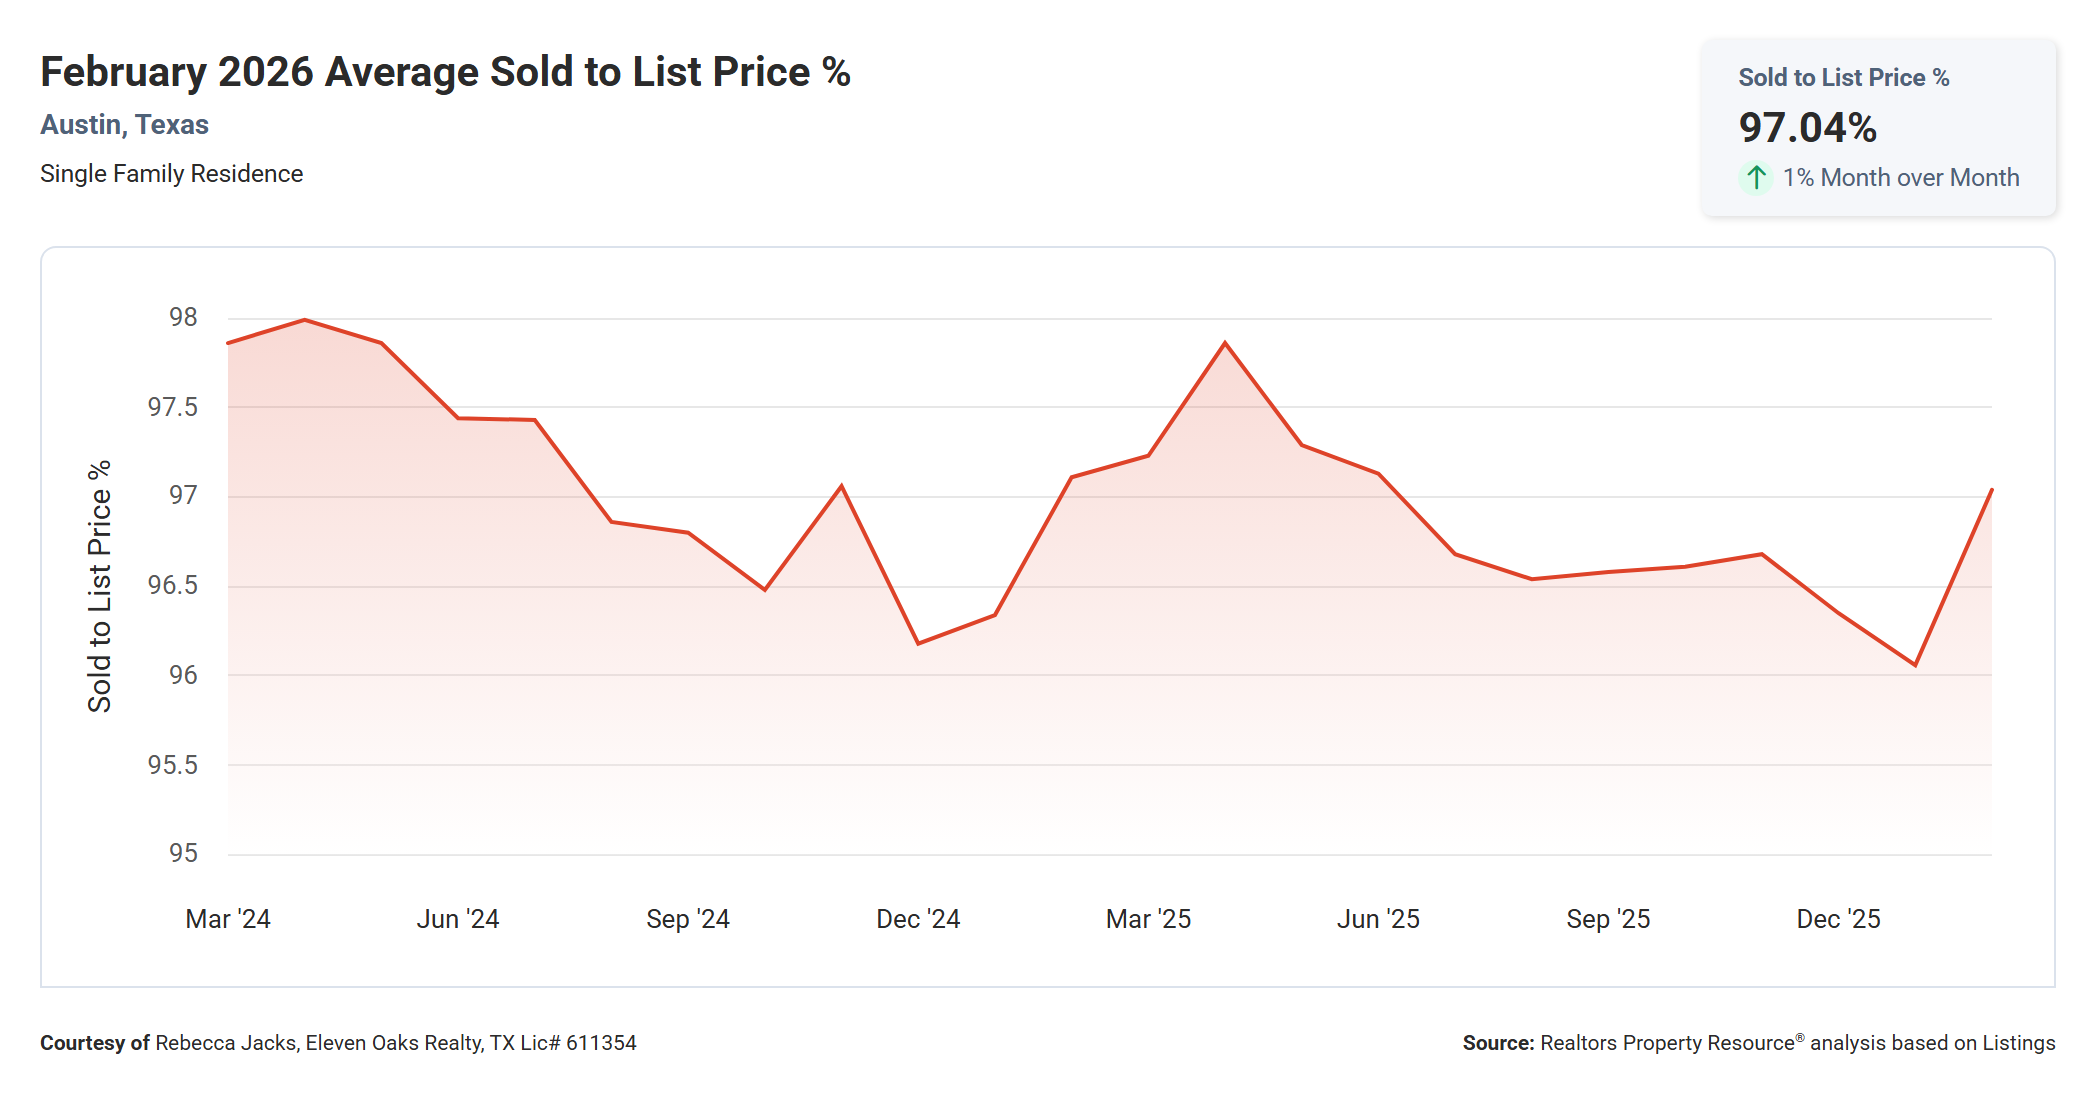
The average sold-to-list price percentage in February 2026 was 97.04%, up about 1% from January's 96.06% and essentially flat compared to February 2025's 97.11%.
This metric measures how close buyers pay to the seller's final asking price. At 97.04%, the typical buyer is paying about 3% below the listed price. On a $580,000 listing, that translates to roughly $17,400 in negotiated savings off the final price.
The jump from 96.06% in January to 97.04% in February is a signal worth watching. When more buyers compete for available homes, this number trends toward 100% or above. When buyers have leverage, it drifts lower. The uptick in February suggests that buyer competition warmed alongside the season.
Looking at the full chart, the sold-to-list ratio has stayed in a relatively tight band of 96% to 98% over the past two years, with occasional dips toward 96% in slower months and brief spikes toward 97.8% to 98% during competitive spring markets. The market has not seen the 100%+ ratios of 2021 and 2022, and February 2026's reading suggests conditions remain buyer-friendly, even if not dramatically so.
Median Time to Sell Up Slightly Year Over Year
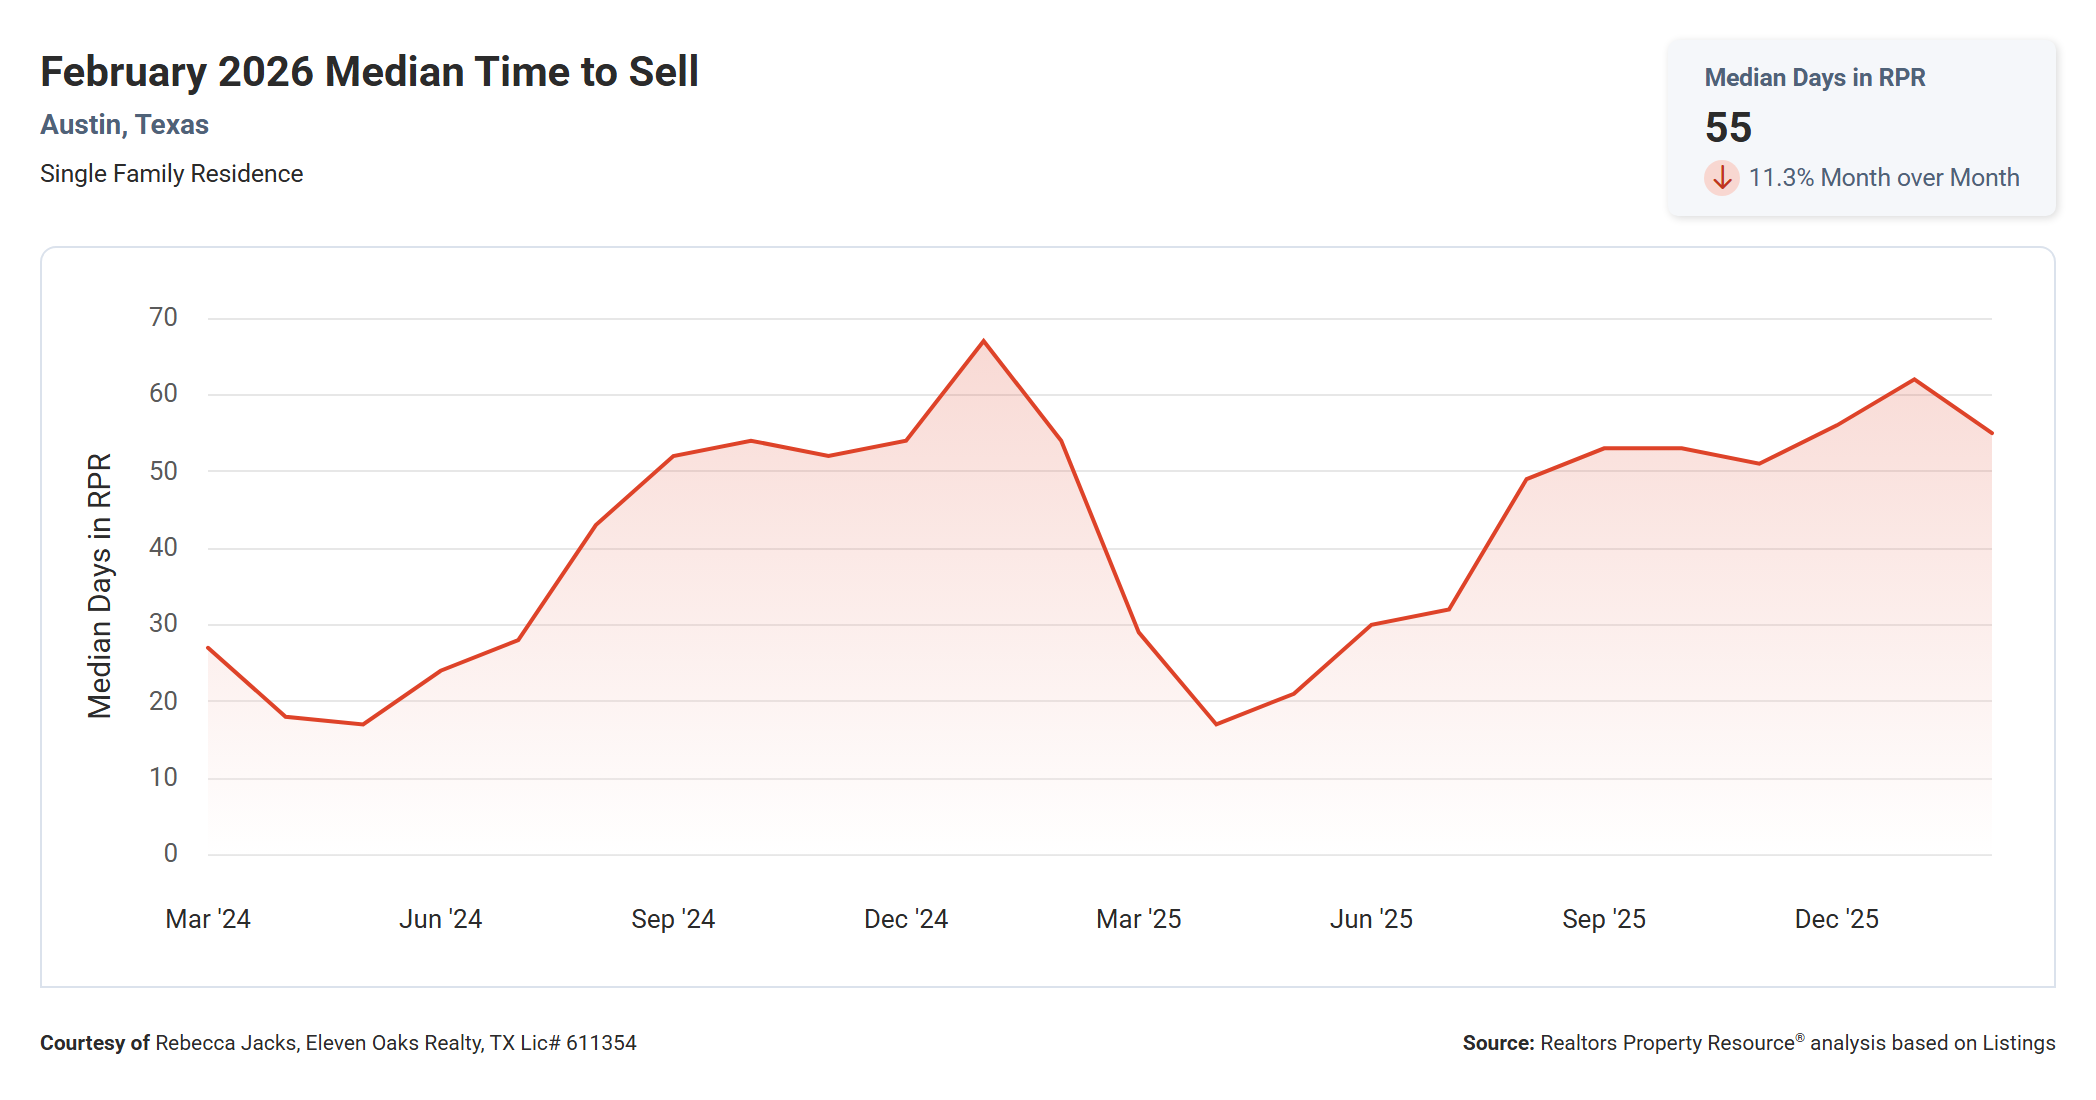
The median time to sell a home in Austin in February 2026 was 55 days, down 11.3% from January's 62 days and up slightly from February 2025's 54 days.
The drop from 62 days to 55 days in a single month is a strong seasonal signal. January is historically one of the slowest months for real estate. Buyers who are serious about purchasing before spring competition peaks tend to get active in February, which absorbs inventory faster and shortens the time homes sit on the market.
Keep in mind that 55 days is the median. Half of all homes that sold in February went under contract faster than that. Well-priced homes in popular price ranges and locations are still finding buyers within two to four weeks. The homes dragging the median upward are the ones that have had to reduce their price or address other objections before finding a buyer.
The two-year trend shows that days on market spiked sharply in late 2024, hitting a two-year high around 66 to 67 days, before dropping back quickly in early 2025. After another gradual climb through fall 2025, the market is again at an elevated but not alarming level. The direction from here will depend heavily on whether spring 2026 brings the same surge in buyer activity seen in early 2025.
Months Supply of Inventory Down 6.5% Year Over Year
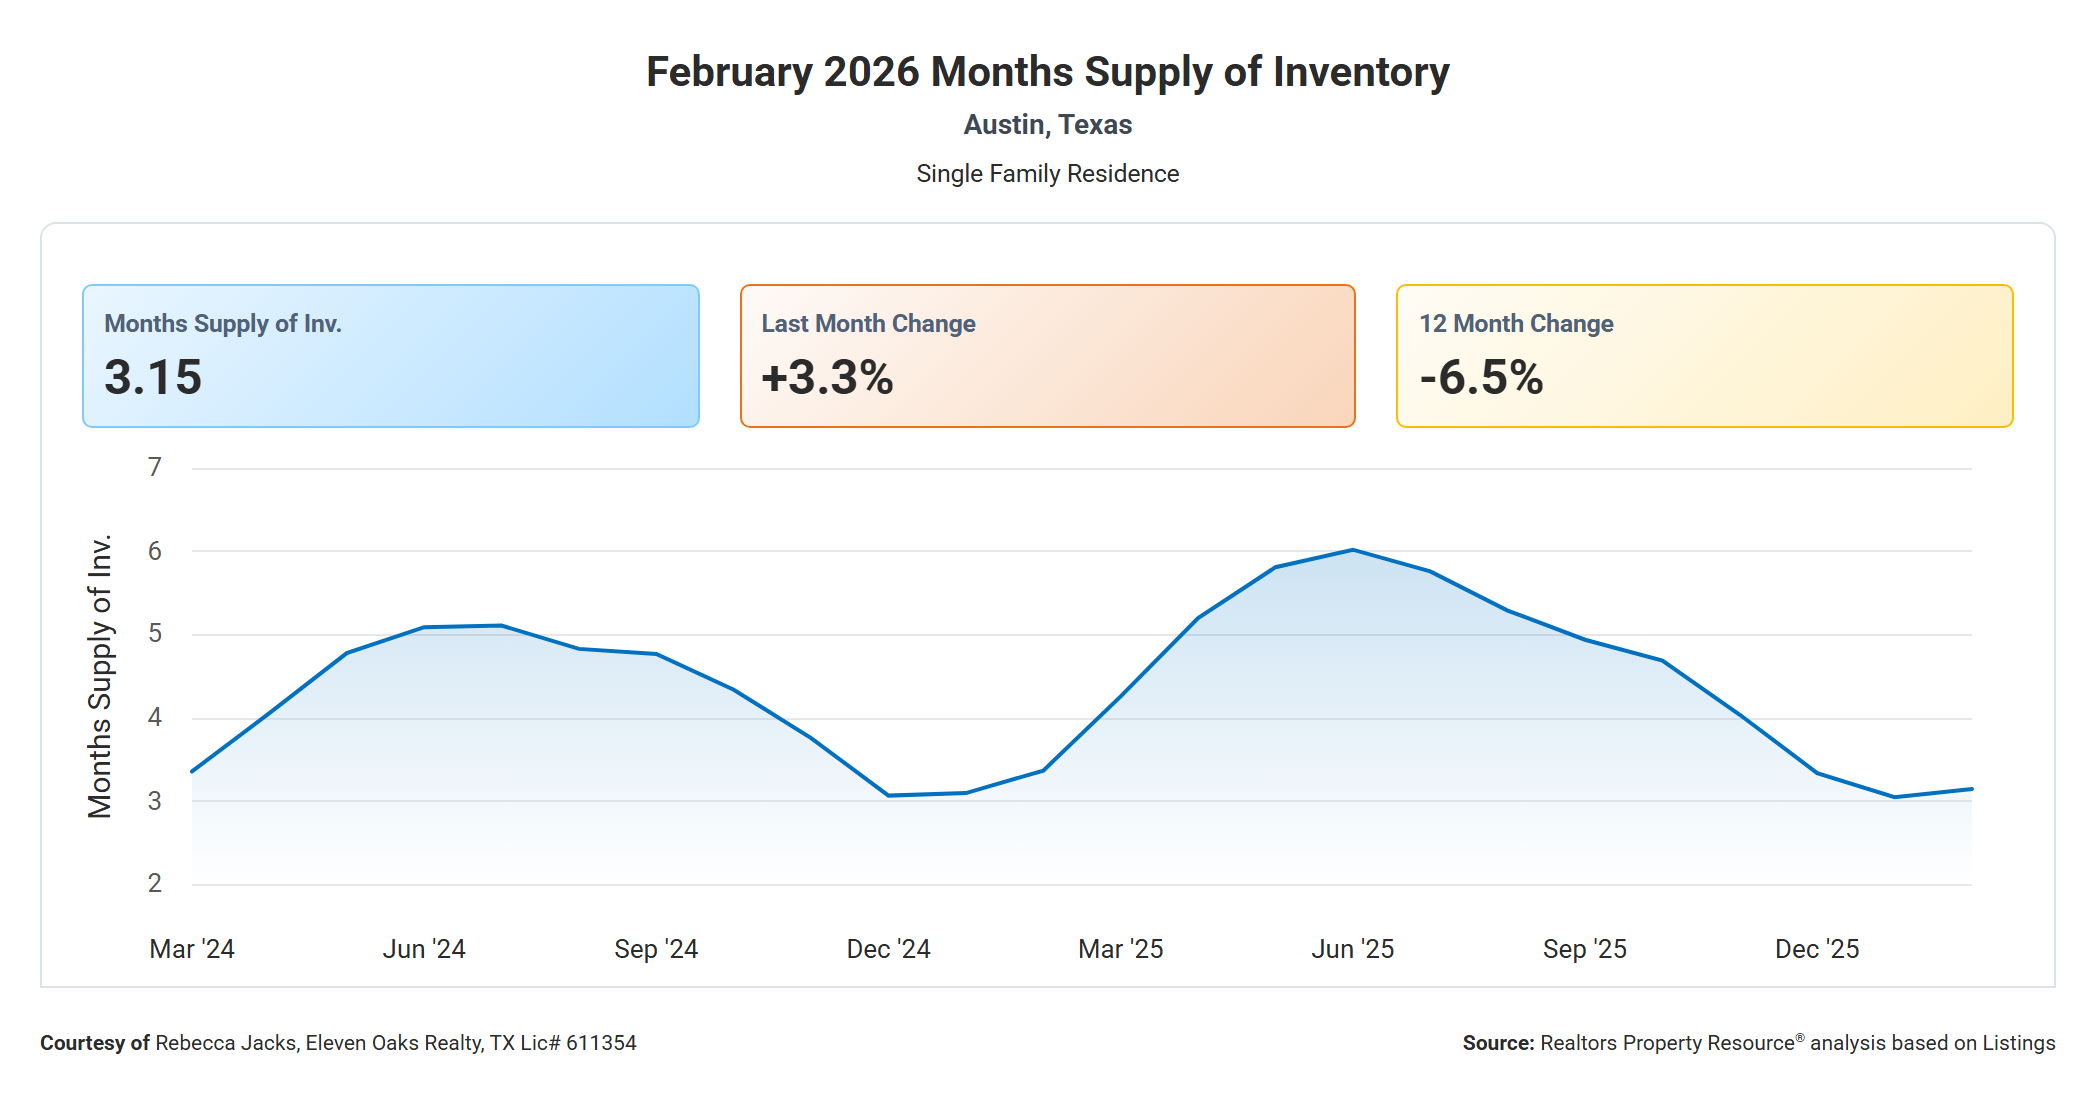
The months supply of inventory in February 2026 was 3.15, up 3.3% from January's 3.05 and down 6.5% from February 2025's 3.37.
Months of supply is calculated by dividing the number of active listings by the monthly sales pace. A supply of 4 to 6 months is generally considered balanced. Below 4 months typically favors sellers; above 6 months typically favors buyers. At 3.15 months, Austin technically remains in seller's market territory, though well short of the extreme seller's conditions of 2021 and 2022, when supply dipped below one month.
The 6.5% year-over-year decline is one of the more interesting data points in this report. Despite Austin's inventory feeling elevated compared to a few years ago, there are actually fewer months of supply now than there were in February 2025. That is because sales have held up while active listings have come down from their mid-2025 peak. If sales volume continues to improve through spring, inventory tightening could put modest upward pressure on prices by summer.
Active Listings Down 2.8% Year Over Year
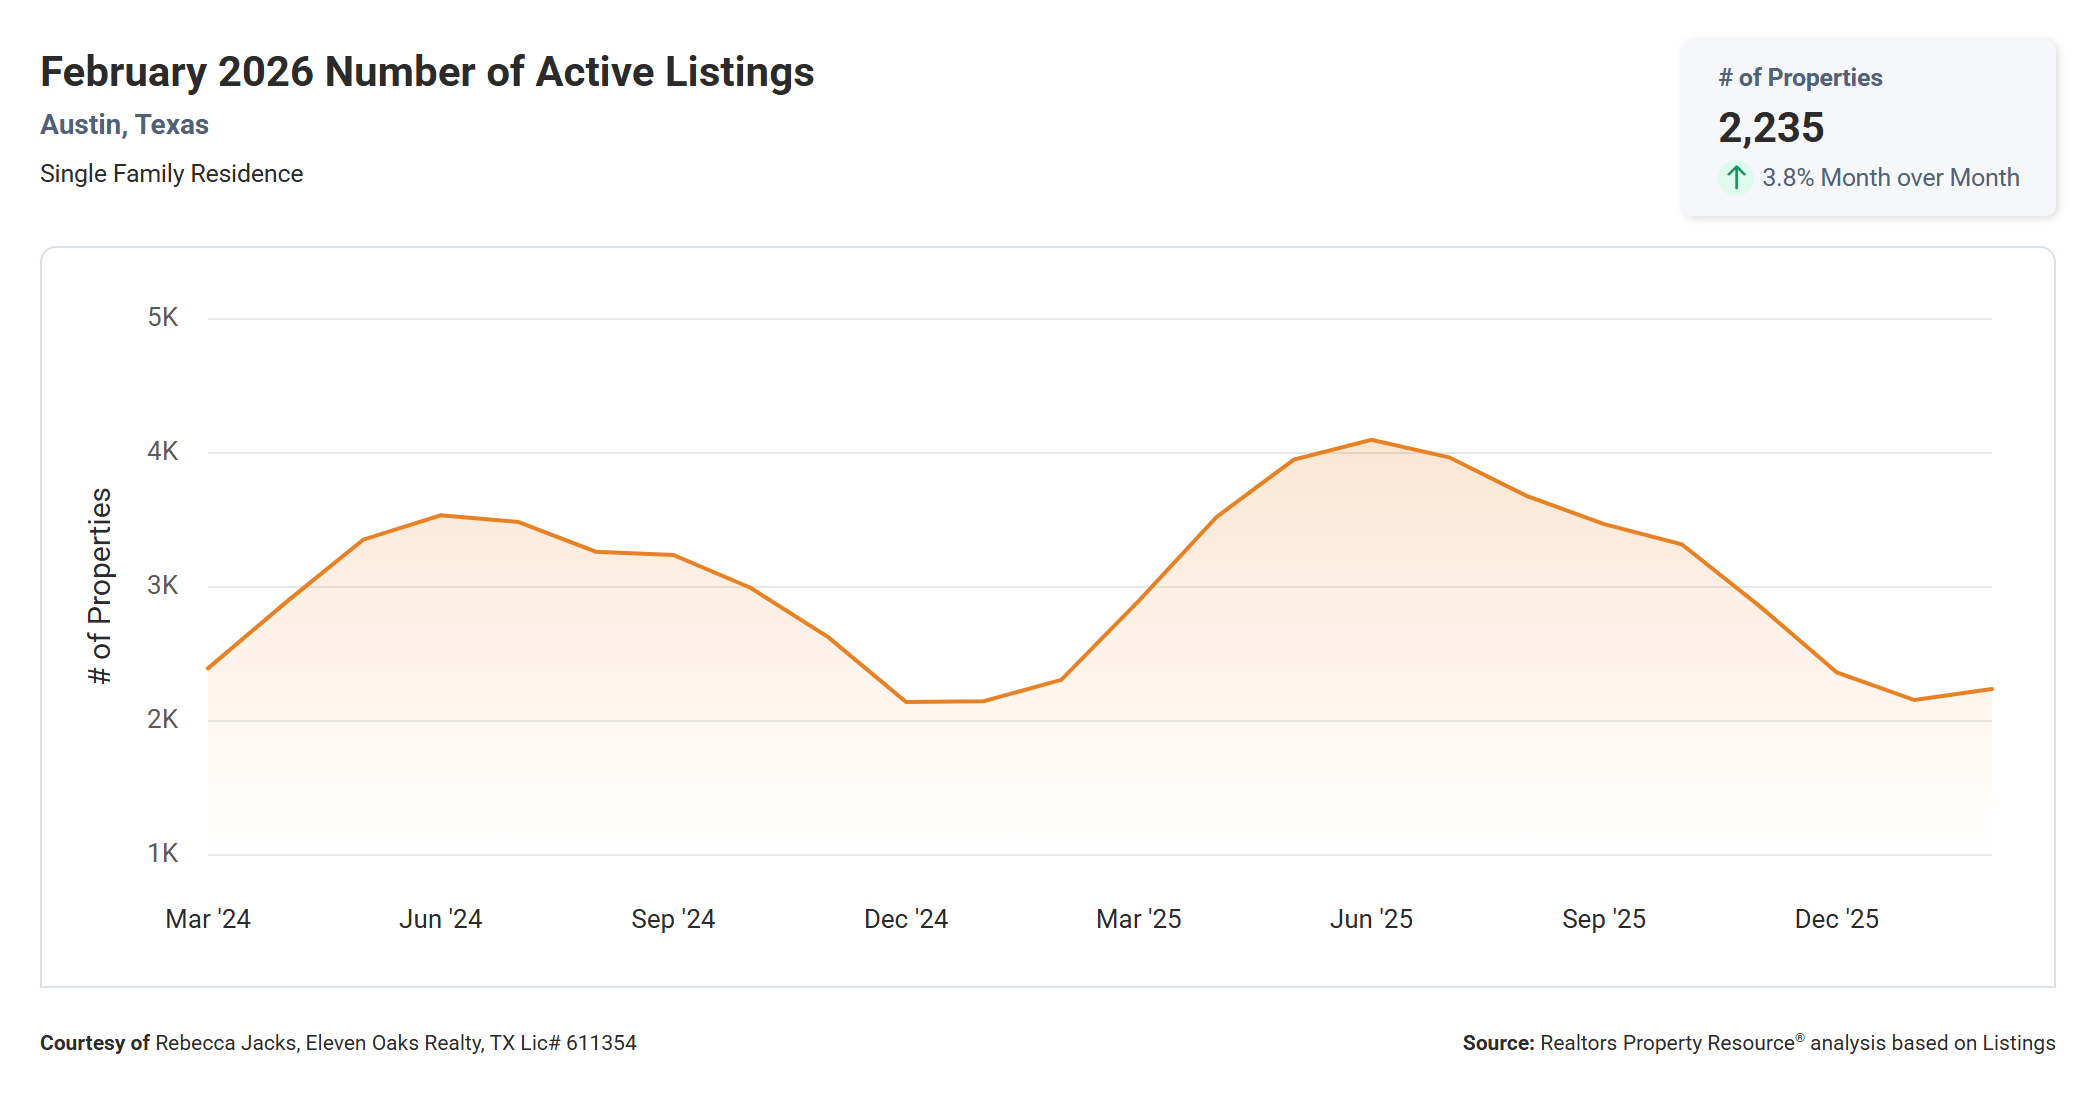
There were 2,235 active listings in Austin in February 2026, up 3.8% from January's 2,150 and down 2.8% from February 2025's 2,300.
The two-year chart on active listings tells a compelling story. Inventory surged dramatically through the first half of 2025, peaking around 4,000 active listings in the June 2025 timeframe. Since then, it has come down steadily as the market absorbed homes and sellers pulled unsuccessful listings. At 2,235, current inventory is roughly 44% below that peak.
For buyers, this reduction means fewer choices than existed at the mid-2025 high. But compared to February 2024, the market still carries more options than buyers had in that earlier period. The moderate February uptick is normal for the season and reflects the beginning of spring listings entering the market.
For sellers, the decline from peak inventory is a positive sign. Fewer competing listings means your home has a better chance of standing out, assuming it is priced and presented well.
New Listings Down 2.0% Year Over Year
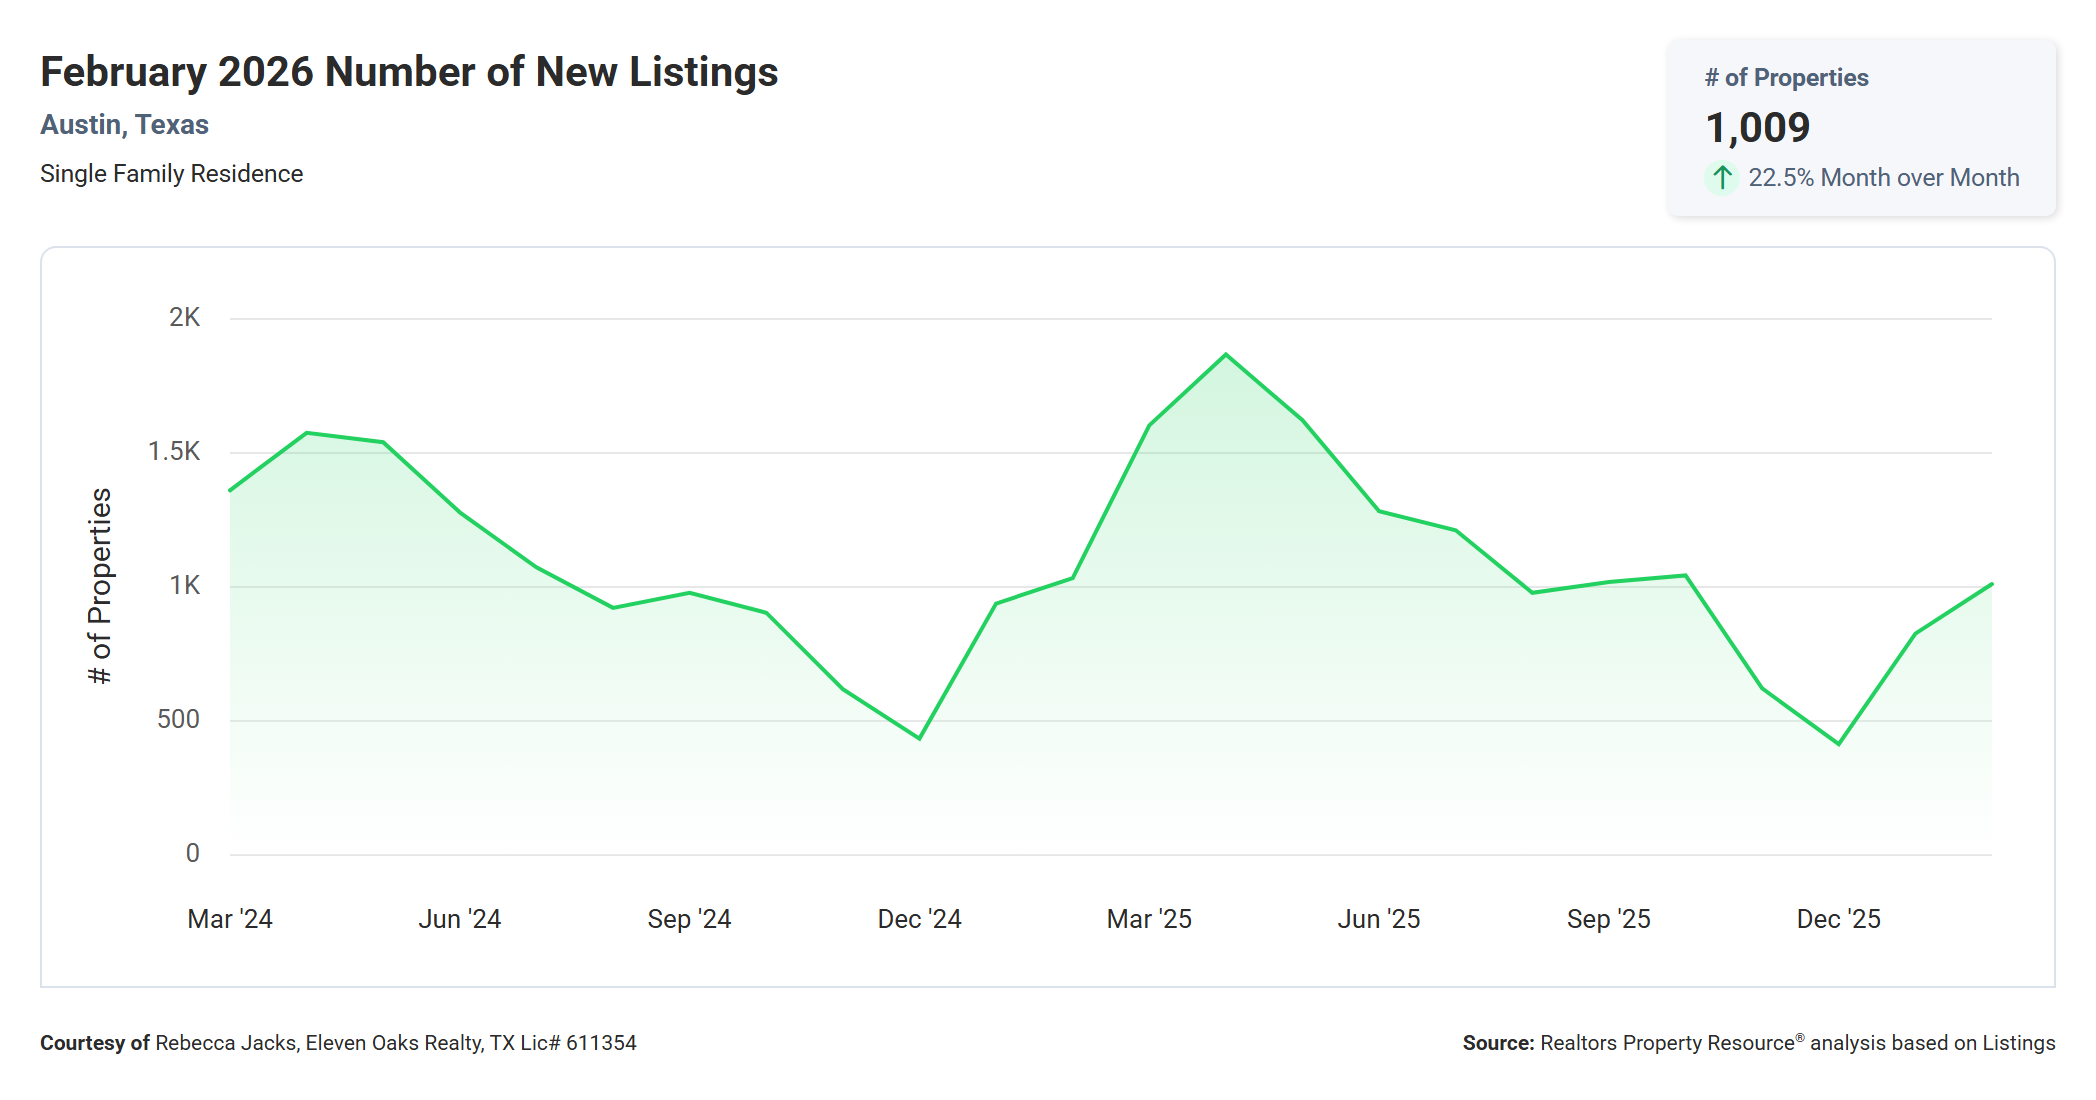
There were 1,009 new single-family listings in Austin in February 2026, up 22.5% from January's 824 and down slightly from February 2025's 1,030.
The jump from 824 to 1,009 new listings in a single month confirms that the spring selling season has begun. This is the highest new listing count since early-to-mid 2025, and it signals that sellers who were sitting on the sidelines through the winter are beginning to move.
The year-over-year comparison is reassuring for buyers: new listing supply is coming to market at nearly the same pace as February 2025. For anyone frustrated by the extremely limited inventory that characterized the 2021 to 2023 market, today's environment offers substantially more options. The chart clearly shows the two-year cycle, with seasonal peaks in spring and sharp pullbacks in December and January, followed by recovery. February 2026 is tracking almost identically to February 2025 in terms of new supply entering the market.
New Pending Listings Up 3.8% Year Over Year
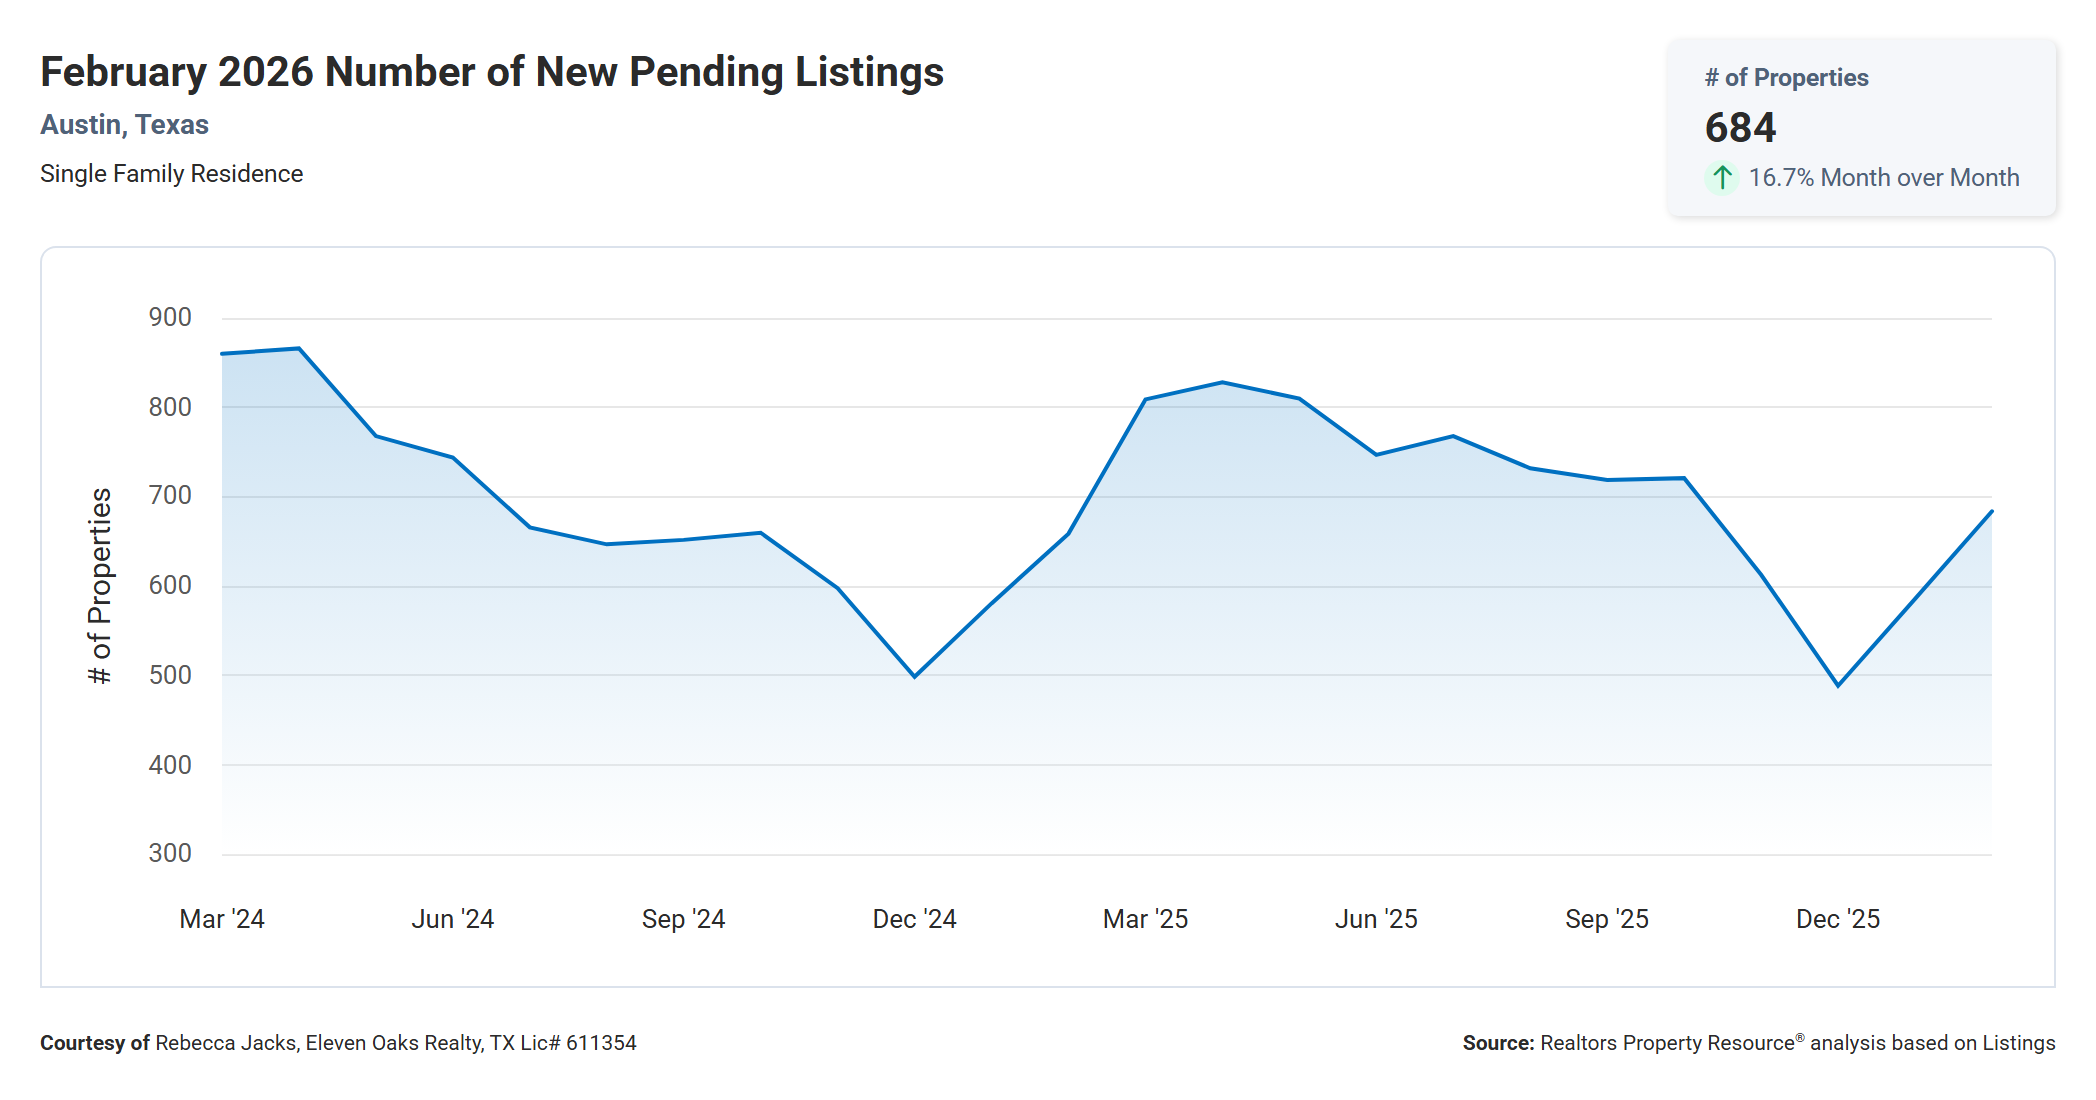
There were 684 new pending listings in Austin in February 2026, up 16.7% from January's 586 and up 3.8% from February 2025's 659.
Pending listings represent homes that are under contract but have not yet closed. This is one of the forward-looking indicators in the report, because what goes pending today typically closes in the next 30 to 60 days. February's 16.7% jump from January tells us that buyer activity ramped up meaningfully as the month progressed.
The 3.8% year-over-year increase is particularly noteworthy. Buyer demand in February 2026 is slightly stronger than it was at the same point in 2025, even with mortgage rates still elevated. This suggests that either more buyers have adjusted to current rate levels, or that the price reductions of the past 12 months have brought enough homes into reach to spur action. Likely both.
Homes Sold Essentially Flat Year Over Year
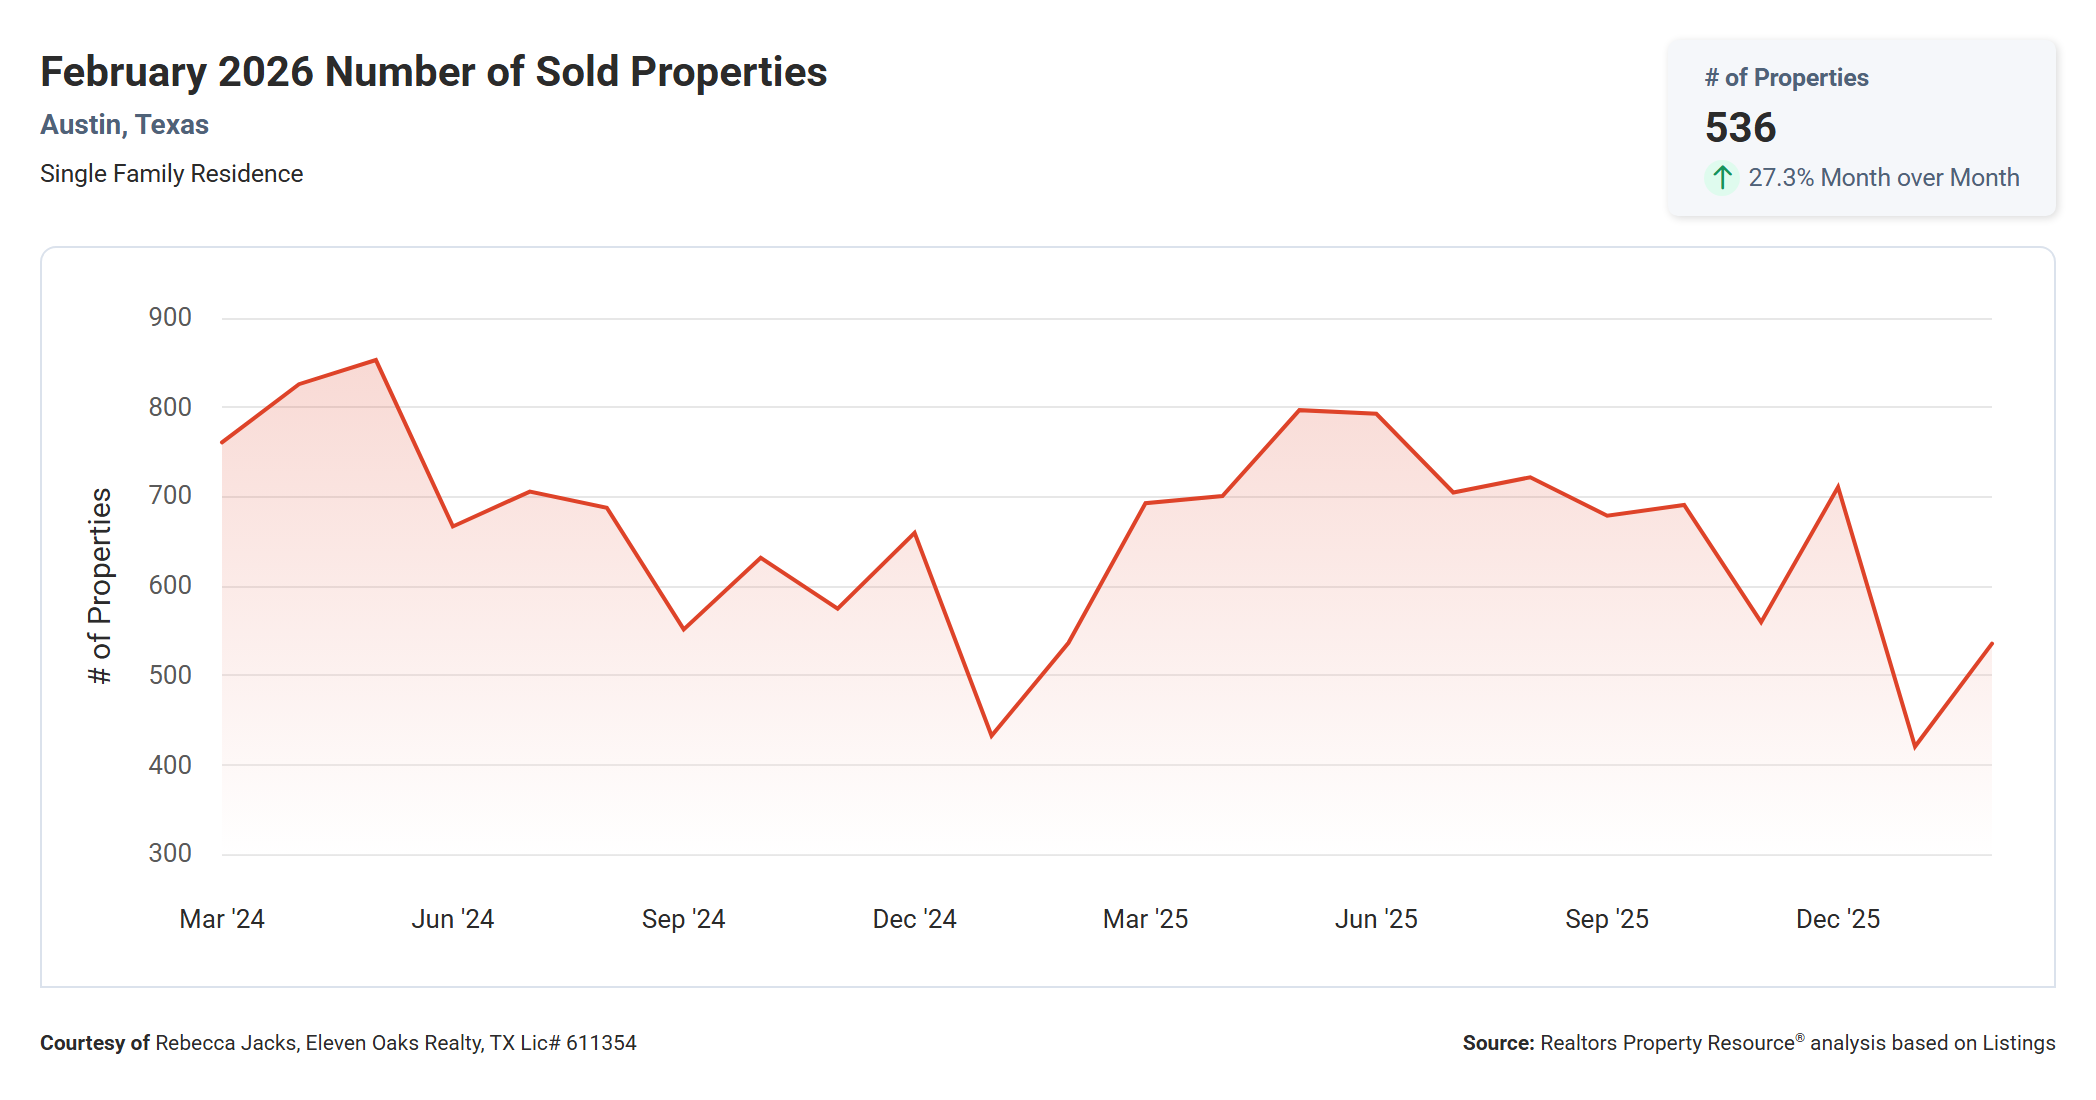
536 single-family homes sold in Austin in February 2026, up 27.3% from January's 421 and essentially flat compared to February 2025's 537.
The 27.3% month-over-month jump in sales is the most dramatic number in this report. It reflects the typical January-to-February seasonal acceleration, but the magnitude is notable. More than 100 additional transactions closed in February compared to January, generating roughly $93 million more in sales volume.
The year-over-year near-parity (536 vs. 537) is also meaningful. Despite elevated mortgage rates and the broader uncertainty in the market, Austin closed essentially the same number of homes in February 2026 as it did in February 2025. The market is not collapsing. Buyers are buying, and sellers who price appropriately are selling.
The two-year chart shows a consistent pattern of seasonal peaks (spring and early summer) and troughs (December and January), with sales volume recovering each spring. February 2026 is following that seasonal pattern right on script.
Total Sales Volume Down 4.8% Year Over Year
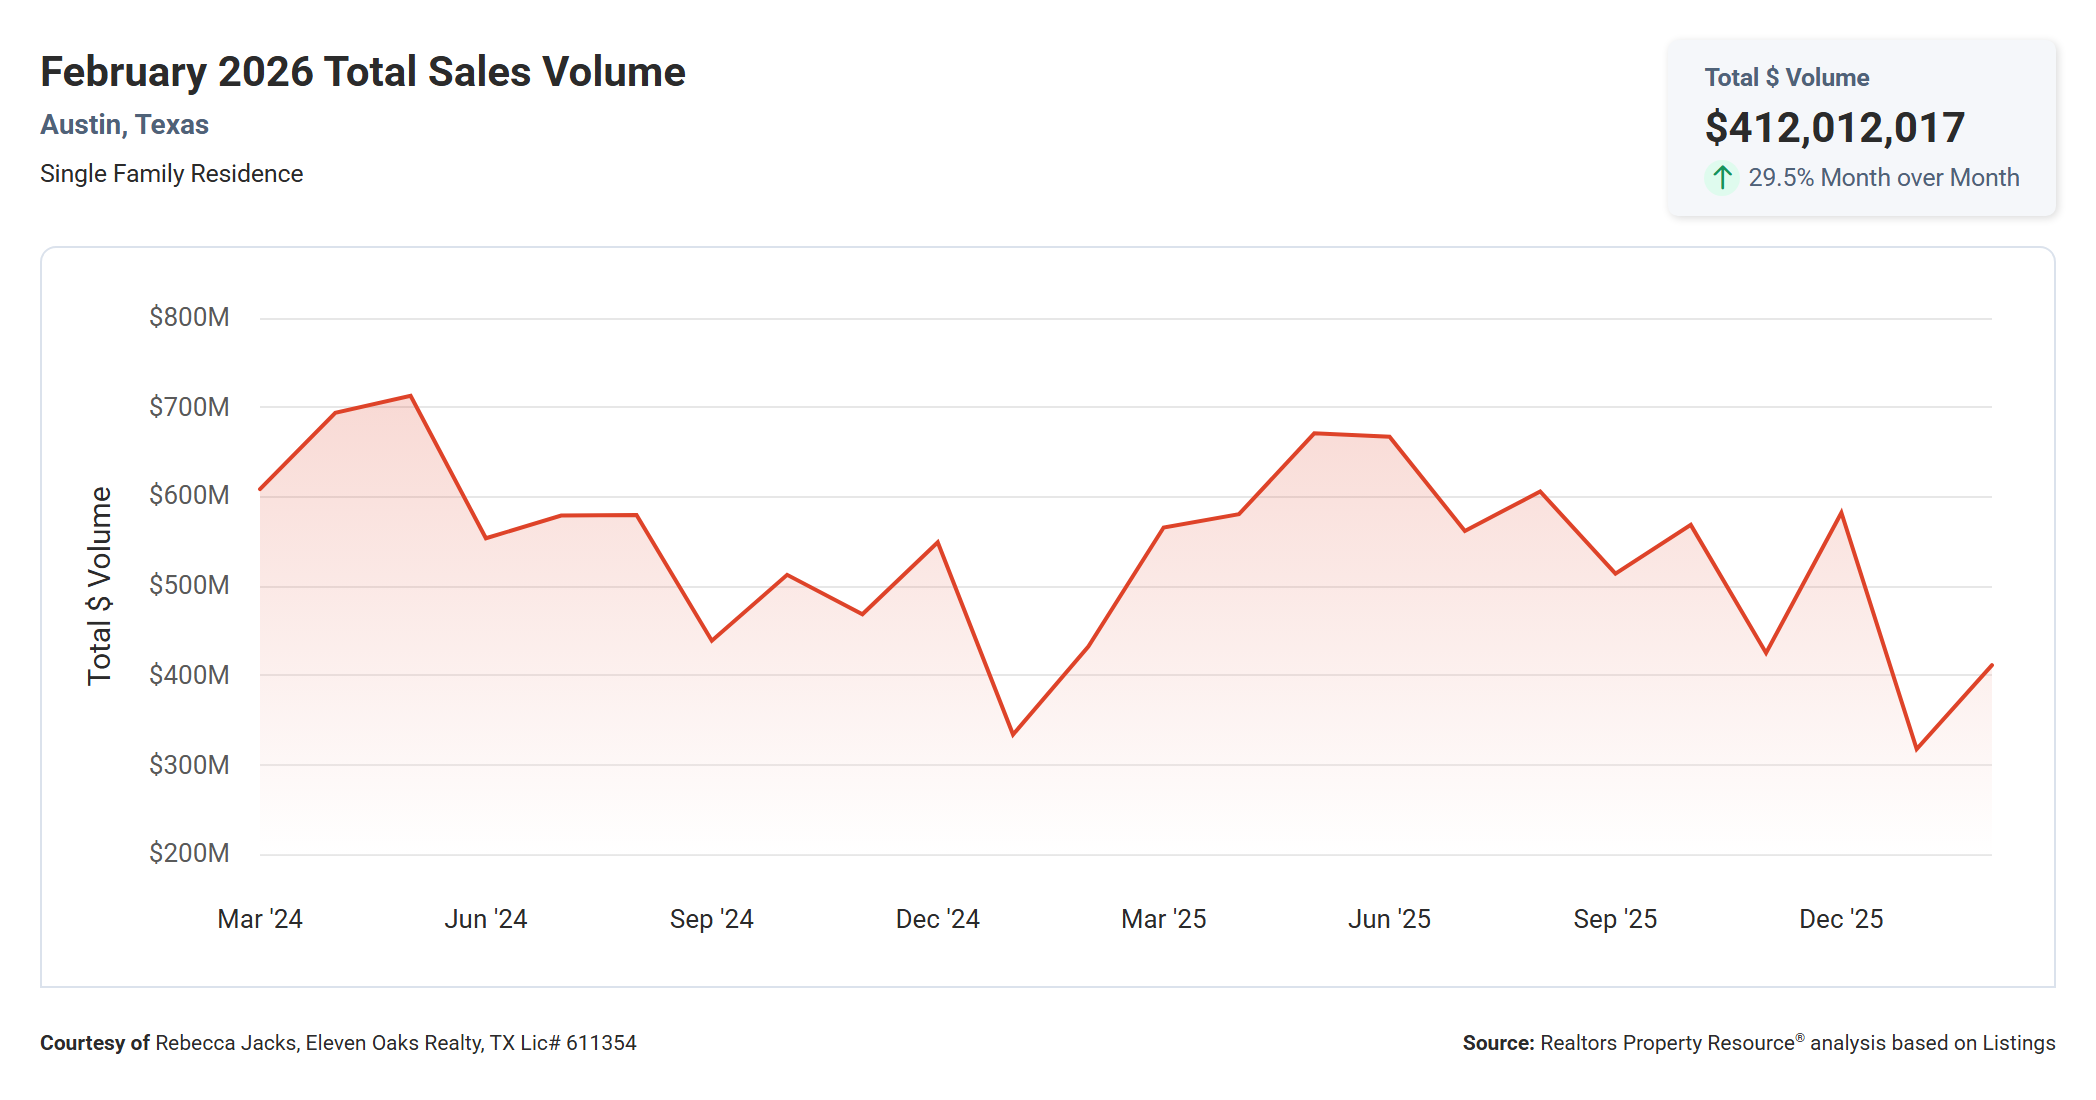
Total sales volume in Austin in February 2026 was $412,012,017, up 29.5% from January's $318.15 million and down 4.8% from February 2025's $432.88 million.
Over $412 million in single-family home sales in a single month is a significant figure. The 29.5% month-over-month jump reflects the combined effect of more homes selling and slightly higher prices than January. The year-over-year decline of 4.8% is primarily driven by lower average prices rather than dramatically fewer transactions, since the sold count is nearly unchanged from a year ago.
The two-year chart shows the seasonal rhythm clearly. Volume peaks in summer (Austin saw months approaching or exceeding $650-700 million in spring and early summer 2025), dips in December and January, and begins recovering in February. If 2026 follows 2025's pattern, monthly sales volume could climb toward $550-650 million by June.
February 2026 Austin Real Estate by the Numbers
The table below is pulled directly from the Austin Board of REALTORS MLS statistics for February 2026 and covers 574 closed single-family residential transactions in the city of Austin. The most expensive home that sold in February 2026 sold for $7,050,000 and the least expensive home sold for $157,500. Homes ranged in size from 720 to 9,275 square feet with an average size of 2,279 square feet. The average price per square foot for a home that sold in Austin in February 2026 was $322.26 with the lowest being $62.92 per square foot and the highest being $1,793.19 per square foot. It took, on average, 75 days to sell a home in Austin and sellers received, on average, 92.67% of their original list prices.
| Min | Max | Avg | Median | |
|---|---|---|---|---|
| Beds | 2 | 7 | 4 | 3 |
| Baths | 1 | 10 | 3 | 3 |
| Sq Ft | 720 | 9,275 | 2,279 | 2,073 |
| Lot Sq Ft | 2,128 | 804,118 | 13,232 | 8,276 |
| List Price | $150,000 | $7,500,000 | $786,926 | $588,463 |
| LP/Sq Ft | $64.34 | $1,422.31 | $332.00 | $290.55 |
| Acres | 0.05 | 18.460 | 0.304 | 0.190 |
| Close Price | $157,500 | $7,050,000 | $763,473 | $572,500 |
| CP/Sq Ft | $62.92 | $1,793.19 | $322.26 | $282.94 |
| CP/LP% | 68% | 164% | 97.04% | 98% |
| CP/OLP% | 61% | 164% | 92.67% | 94% |
| ADOM | 0 | 441 | 75 | 52 |
A few numbers in this table stand out. The CP/LP% column shows the close price relative to the final list price. The median of 98% means that once sellers settle on a price the market accepts, buyers are paying very close to that number. But the CP/OLP% column tells a different story: the median home sold at 94% of its original asking price. That 4-percentage-point gap represents the price reduction most sellers had to accept before finding a buyer. For a home originally listed at $600,000, that is roughly a $24,000 reduction before it goes under contract.
The average days on market of 75 versus the median of 52 reflects the wide range in the market. Competitively priced homes in desirable locations are moving in well under two months, while overpriced homes or those with challenges are sitting considerably longer, pulling the average up.
The range of the market itself is striking. The least expensive closed sale in February was $157,500 and the most expensive was $7,050,000. Austin's housing market is not monolithic, and what is true for a $300,000 home in Pflugerville is not necessarily true for a $2 million home in Tarrytown.
Where Buyers Are Shopping: A Look at Price Ranges
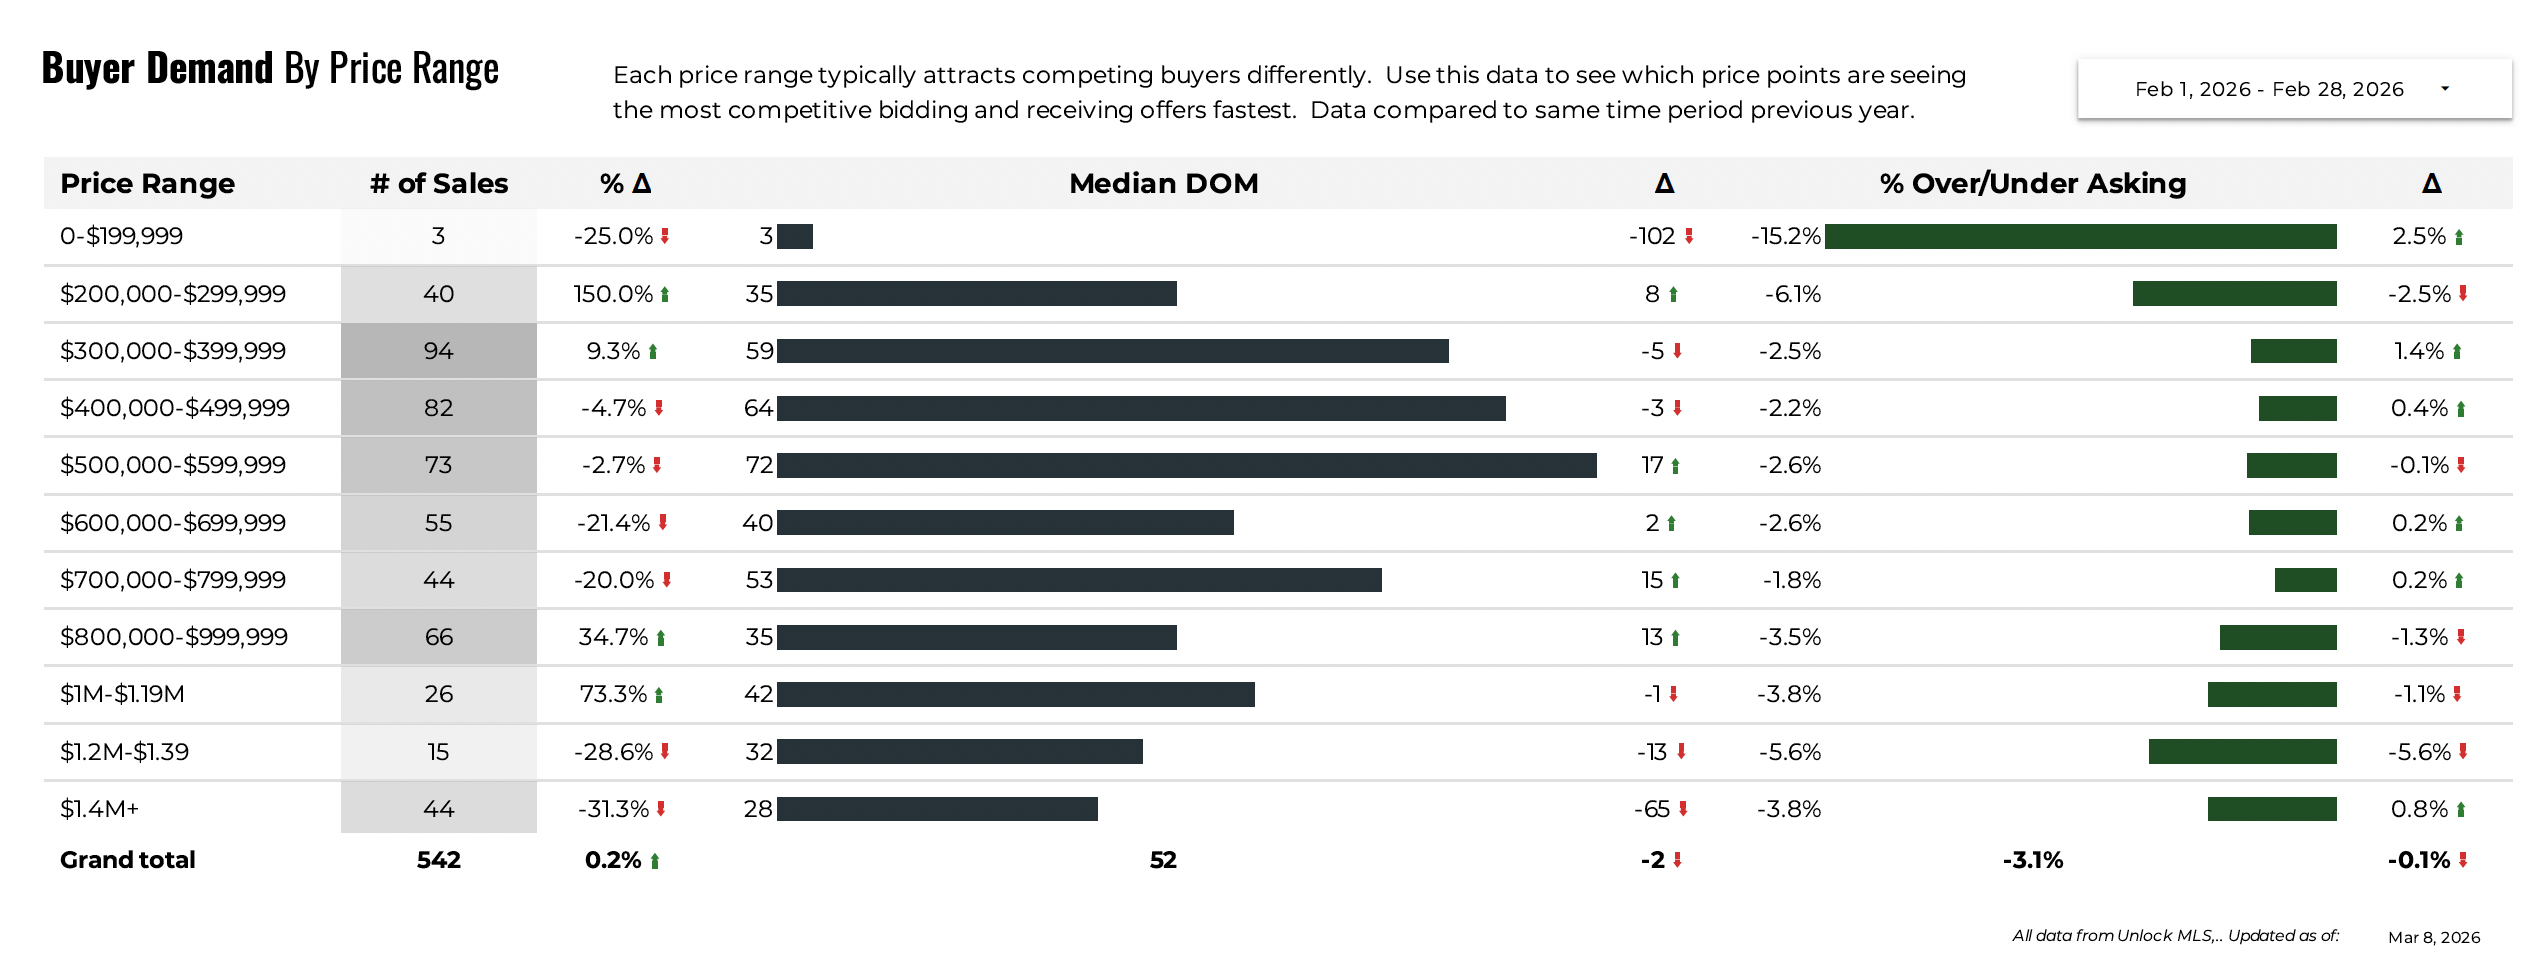
One of the more revealing data points in this month's supplemental data is the breakdown of closed sales by price range. Here is where Austin buyers actually transacted in February 2026, based on 552 closed transactions tracked through Unlock MLS:
The $300,000 to $399,999 range led all brackets with 95 sales, representing 17.2% of all transactions. The $400,000 to $499,999 range came in second with 83 sales (15%), followed closely by $500,000 to $599,999 with 73 sales (13.2%). Together, those three brackets alone accounted for 45.4% of all Austin single-family sales in February.
The middle and upper-middle price ranges also saw solid activity. There were 56 sales in the $600,000 to $699,999 range (10.1%), 46 in the $700,000 to $799,999 range (8.3%), and 67 sales in the $800,000 to $999,999 range (12.1%). The $800K to $999K bracket outpacing the $600K-$699K and $700K-$799K brackets individually is a signal that Austin's high-end market has real depth.
At the lower end, only 3 homes sold for under $200,000, representing just 0.54% of the market. Another 40 homes sold in the $200,000 to $299,999 range (7.25%). The sub-$300K segment as a whole now accounts for fewer than 8% of all Austin single-family transactions. Buyers looking in that price range will need to look to outlying suburbs.
At the upper end, 48 homes sold above $1.4 million in February, representing 8.7% of transactions. Another 41 homes sold between $1 million and $1.4 million (26 in the $1M-$1.19M range and 15 in the $1.2M-$1.39M range), meaning nearly 16% of February's Austin sales were seven-figure transactions. The luxury market is an active and consistent part of Austin's real estate landscape.
For buyers with a budget in the $300,000 to $599,999 range, February's data is encouraging. Nearly half of all sales happened in your price range, meaning you have real competition for those homes, but you are also in the most liquid part of the market. Homes in that range sell, and they sell consistently.
The Listing-to-Close Price Gap: What Sellers Need to Know
One data point from the February statistics that deserves its own discussion is the difference between the CP/LP% and CP/OLP% figures.
The median home sold at 98% of its final list price (CP/LP%), which sounds solid. But it sold at only 94% of its original list price (CP/OLP%). That 4-point gap means the typical seller reduced their price at least once before finding a buyer, and likely by a meaningful amount.
On a home originally listed at $650,000, a 6% reduction to the original price works out to $39,000. The seller then received 98% of that reduced price, netting approximately $627,000 before closing costs.
The takeaway is not that the Austin market is weak. It is that pricing accuracy at launch matters more than it has in years. Homes priced right from day one spend less time on market, attract more competing offers, and typically net more than homes that require price reductions. The sellers getting close to their original asking price are the ones who priced with current data, not with the optimism of 2022.
What This Means for Buyers
If you have been watching the Austin market and waiting for conditions to improve, February 2026's data offers some encouragement.
Prices are down 4.3% from a year ago and about 9-10% below last year's peak. That correction translates to real purchasing power. At $285 per square foot, you are getting more home for your dollar than buyers paid in 2024 or during the first half of 2025.
The sold-to-list price ratio of 97.04% and the CP/OLP ratio of 94% both indicate that negotiation room exists. Buyers can and do submit offers below list price and find success, particularly on homes that have been sitting for more than 30 days. At 3.15 months of supply, the market is not so tight that you need to wave all contingencies to compete. Inspections, appraisals, and option periods are back on the table for most transactions.
The seasonal reality, however, is that February's relatively buyer-favorable conditions tend to tighten as spring arrives. With 1,009 new listings entering the market and 684 pending contracts already executed in February alone, the pace is picking up. Buyers who act in late winter and early spring typically face less competition than those who wait until April, May, and June.
Financing rates remain a real factor. If rates are keeping you on the sidelines, it is worth having a conversation with a lender about strategies including rate buydowns, adjustable-rate products, or seller-paid closing costs that can reduce your effective rate. Some of these tools have become more common in the current environment.
What This Means for Sellers
February's data has more good news for sellers than many might expect, but it comes with important caveats about pricing.
The 27.3% jump in closed sales from January to February tells you that buyer demand is real and active. Homes that sold in February had been under contract in late January and early February, which means the buyers who closed those deals got off the sidelines despite the winter season. More are coming.
The 22.5% increase in new listings is the challenge for sellers. You will have more competition in spring than you did in January, and each new listing that enters your price range gives buyers another option. Being first to market and priced correctly is a meaningful advantage.
The 94% CP/OLP ratio is the most important number for sellers setting their list price. Sellers who overprice and then reduce are netting less than those who price accurately from the start. If your agent is recommending a price that feels lower than you hoped, ask them to walk you through the CP/OLP data for comparable homes in your area. The data is unambiguous: buyers are not paying 2021 or early 2025 prices, and homes that launch at those levels are sitting.
The good news is that the market is not broken. At 97.04% sold-to-list (on final list prices), sellers who price competitively are finding buyers. The median days on market of 52 means that a well-priced home in a good location should be under contract within six to eight weeks. That is a normal, functional market, even if it is not the frenzied seller's market of recent memory.
Market Summary and Outlook
February 2026 painted a picture of a market in recovery mode. After a subdued January, closed sales jumped sharply, pending contracts rose, and new listings flooded in on schedule with the seasonal calendar. Price per square foot ticked up 2.2% from January. Days on market dropped 11.3%. The market's engine is running.
At the same time, year-over-year numbers remind us that this is still a softer environment than early 2025. Prices are down 4.3% from a year ago. Volume is off 4.8%. The gains are real but modest, and there is nothing in the February data that suggests a dramatic price surge is imminent.
The key variable for spring 2026 will be supply. With 2,235 active listings and 1,009 new listings entering in February, buyers have meaningful choices. If sales pace continues to accelerate as it did in 2025, inventory will tighten and prices could firm up. If rate uncertainty or broader economic conditions keep buyers cautious, the market may remain in this buyer-friendly equilibrium for several more months.
What is clear is that Austin's fundamentals remain intact. The city continues to draw employers, residents, and investment. The housing market is digesting the excesses of 2021 and 2022 through a gradual, orderly correction rather than a sharp downturn. That is a healthy dynamic for buyers, sellers, and the long-term stability of the market.
Time to Buy? Time to Sell?
Based on February 2026 data, here is an honest read of where both sides stand.
For buyers, the conditions right now are as good as they have been in several years. Prices are down from both 2024 and 2025 peaks. Inventory gives you real choices. Negotiation room exists. And spring competition is not yet at its peak. If you are financially ready and have found the right home, waiting for prices to drop further is a bet that may not pay off, particularly if rates ease and demand accelerates through spring. You will also have more leverage on a well-priced listing today than you will have competing against five other offers in May.
For sellers, the window to sell at a premium price may require patience that some sellers do not have. If you need to sell, price competitively from day one and invest in preparation and presentation. The buyers who closed in February are active and capable. They are not making lowball offers out of spite; they are responding to what the data tells them the market supports. Meet them where the data is.
If you are a seller who does not need to sell right now, watching the spring market unfold over the next 60 to 90 days before deciding is a reasonable approach. If pending contracts continue to grow and inventory tightens, spring could bring modestly stronger pricing. If listings pile up and buyers stay cautious, waiting will not have helped.
Action Items for Buyers
- Get pre-approved now, before you start touring homes seriously. Sellers want to see a current pre-approval letter, and having one in hand allows you to move quickly when the right home appears.
- Work with your agent to identify the price ranges and neighborhoods where you have the most buying power. The $300,000 to $599,999 range is where the most transactions happen, which means the most data for pricing analysis and the most opportunity.
- Review the CP/OLP data for any home you are considering making an offer on. If a home has had price reductions, ask your agent to pull the original list date and price. Understanding the seller's history helps you frame your offer appropriately.
- Ask your lender about temporary rate buydowns or seller-paid closing costs. In the current environment, many sellers are willing to contribute to closing costs as an alternative to further price reductions. This can meaningfully reduce your effective rate in the first one to two years of the loan.
- Pay attention to days on market. Homes sitting beyond 45 to 60 days are often candidates for negotiation. Homes that are fresh to market and priced right are less likely to accommodate significant concessions.
- Do not skip the inspection. The market in 2026 supports buyers having full inspection rights in most transactions. Use them.
Action Items for Sellers
- Pull the most recent comparable sales before setting your list price, specifically looking at CP/OLP ratios for homes similar to yours. Price from current data, not from what your neighbor sold for in spring 2025.
- Invest in preparation before you list. Deep cleaning, fresh paint in neutral colors, decluttering, and professional photography are consistently among the highest-return improvements a seller can make. In a market where buyers have options, first impressions close more doors than anything else.
- Launch at a price you are willing to accept. The data shows that sellers who reduce their price after listing net less than those who price correctly from the start. If your agent recommends a number that feels low, ask them to show you the closed sales that support it.
- Be flexible on seller contributions. Rather than reducing your price, consider offering to contribute toward the buyer's closing costs or a rate buydown. This can be more appealing to buyers while costing you a similar amount as a price cut.
- Consider your timing carefully. The spring market (March through June) historically produces the most buyer activity in Austin. If you can be ready to list by mid-to-late March, you will catch the front edge of peak demand.
- Keep your home show-ready throughout the listing period. Sellers who are difficult to schedule showings with lose buyers before they ever make an offer.
Final Word on the Market
The February 2026 Austin real estate market is one that rewards preparation and realistic expectations on both sides of the transaction. Buyers have more options and more negotiating leverage than they have had in years. Sellers who approach the market with current data and competitive pricing are successfully closing transactions at prices that are still strong by any historical measure outside of the 2021-2022 anomaly.
The numbers in this report tell a story of a market that has corrected from its peak, absorbed the correction without breaking, and is now showing early signs of seasonal recovery. That is not a reason for panic or for undue optimism. It is a reason to be informed, deliberate, and ready to act when the right opportunity presents itself.
If you are an Austin homeowner wondering what your home is worth today, or a buyer trying to understand whether now is the right time to make a move, the data is your best guide. Read it, understand it, and make the decision that fits your life and financial situation.
Questions About the February 2026 Austin Real Estate Price Report?
Have questions about what the February 2026 Austin Real Estate Price Report means for your specific situation? We are happy to help. If you are thinking about buying a home in Austin, our Buyers page has resources to help you understand the process and get started. If you are thinking about selling, our Sellers page walks through what to expect in today's market.
Reach out to Rebecca Jacks and the team at Eleven Oaks Realty. We have been helping buyers and sellers since 1978 and we are here to help you make the best decision for your situation, whatever that looks like.
Data sources: Realtors Property Resource (RPR), Austin Board of REALTORS MLS, Unlock MLS. All figures are for single-family residential properties in the city of Austin. Reported figures reflect February 1, 2026 through February 28, 2026. Some variation between data sources may exist due to differing methodology and timing of data pulls.




Leave a Reply