
Eleven Oaks Realty is proud to present their September 2026 Austin Condo Price Report measuring activity in the Austin condo market. Our September 2026 Austin Condo Price Report covers all condominiums and townhomes in the City of Austin.
September was a slow month for Austin condo sales. RPR recorded 100 condos sold, down 33.8% from August, and the median sold price slipped 4.1% to $358,025. New pending contracts fell 30.5% month over month to 82, which points to a quiet October for closings as the market moves into its usual fall and winter slowdown.
All data below covers condominiums and townhomes in the City of Austin. Data is sourced from Realtors Property Resource (RPR) and the Austin Board of REALTORS MLS, with supplemental data from Unlock MLS. Some metrics may vary slightly between sources due to differing methodology; where differences exist, they are noted.
The Austin Condo Market is a Buyer's Market
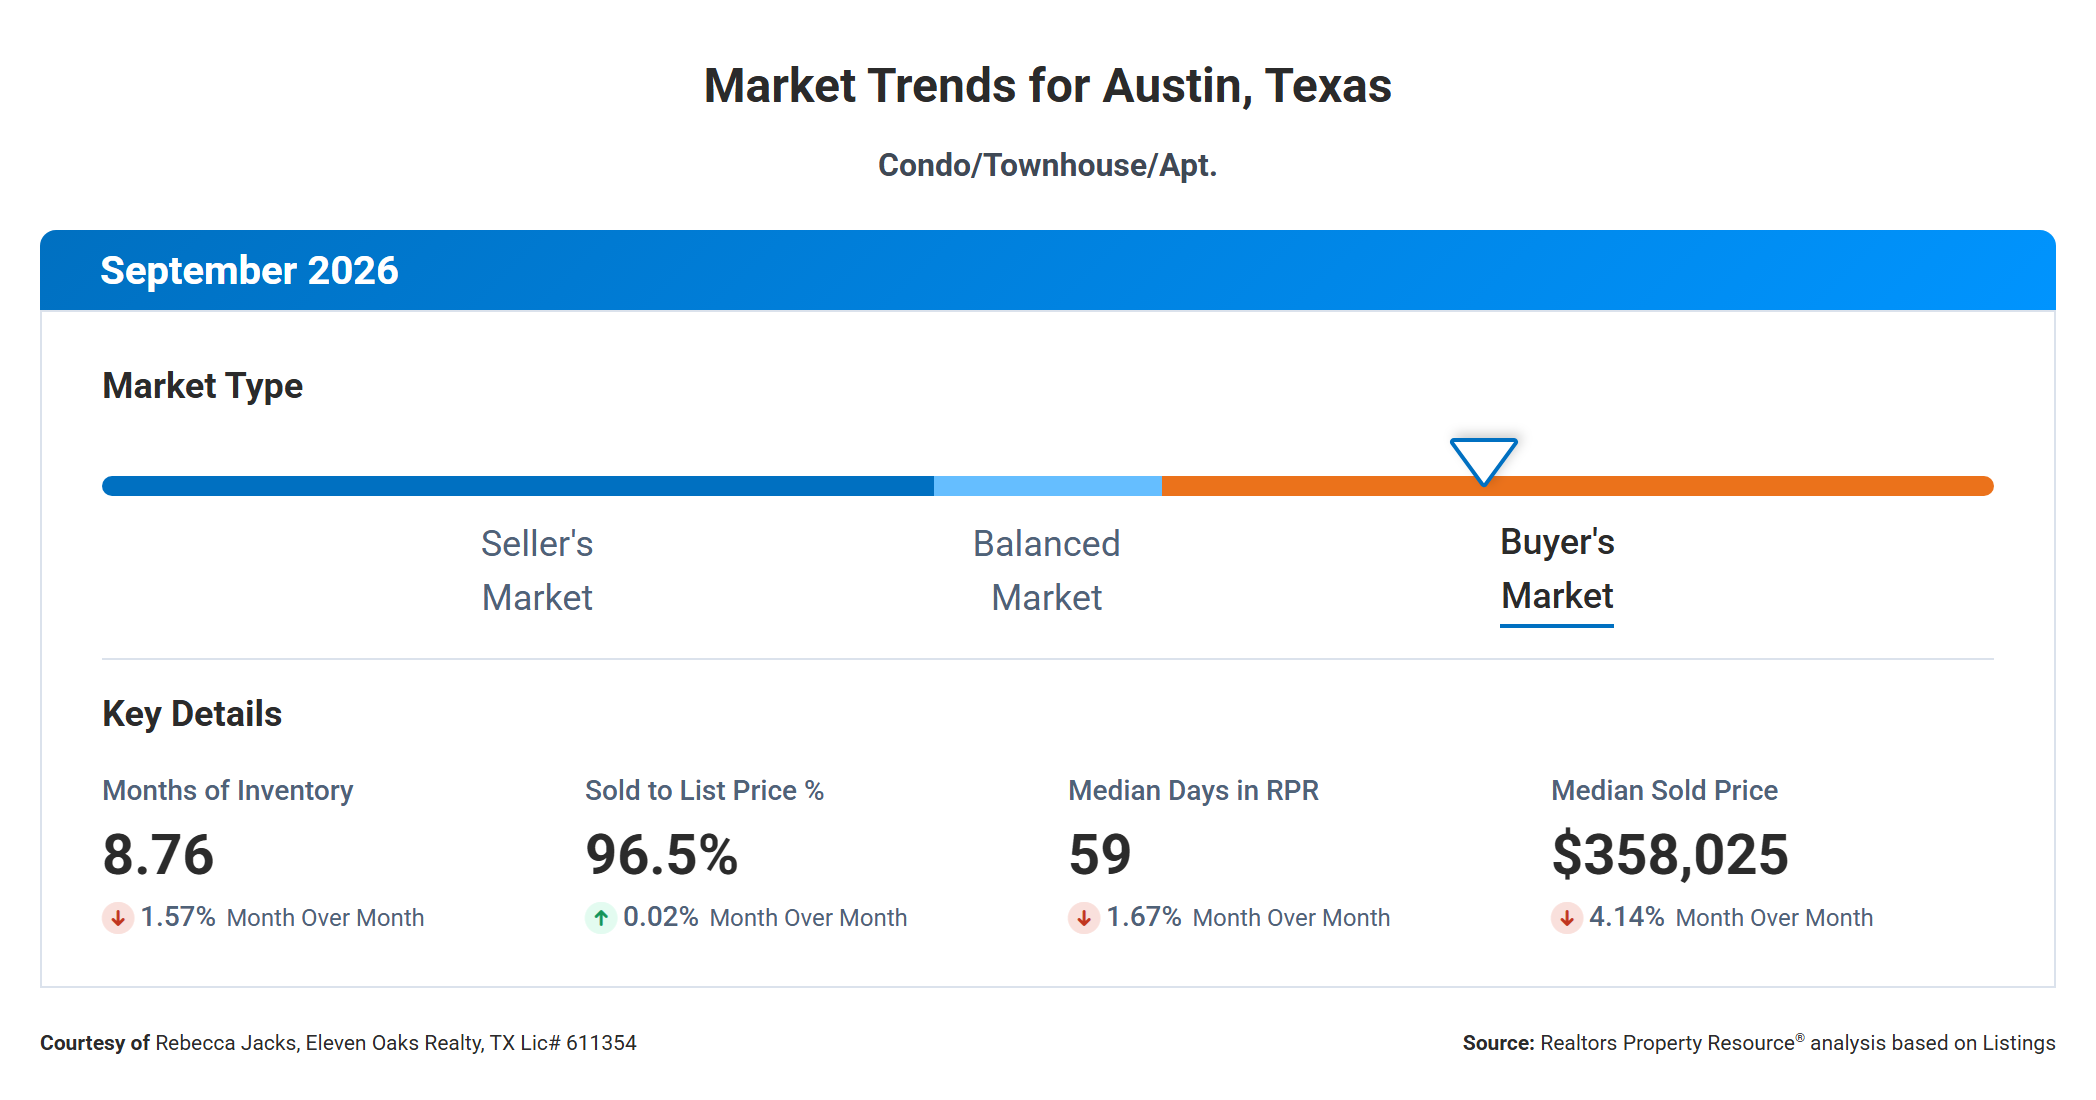
With 8.76 months of supply, the Austin condo market remains firmly in buyer's market territory. A balanced market typically runs between four and six months of supply, so condo buyers today have more listings to choose from than there are buyers to absorb them. In practical terms, that means you can take your time, compare buildings, and negotiate on price, repairs, and closing costs.
The four key metrics on the RPR Market Trends dashboard moved in mixed directions in September. Months of inventory dipped 1.57% month over month to 8.76. The sold to list price percentage held at 96.5%, up just 0.02%. Median days in RPR edged down 1.67% to 59 days, and the median sold price fell 4.14% to $358,025.
Taken together, these signals describe a market where supply is slowly tightening because fewer sellers are listing, but buyers still hold the leverage. Sellers who price correctly are getting about 96.5 cents on the dollar, and buyers who are patient have room to negotiate.
What the Numbers Mean For Buyers
Prices are working in your favor. The September median sold price of $358,025 is 1.2% lower than September 2025 and 4.1% lower than August. The median active list price of $375,000 is down 6.0% from a year ago, and ABoR MLS data shows sellers received an average of 93.01% of their original list prices. On a $375,000 condo, that gap represents about $26,000 in negotiating room between where a seller starts and where the deal closes.
Selection is still wide. RPR counted 1,393 active condo listings in September, and Unlock MLS shows 1,379 active listings as of October 6. Active listings are down 12.4% from a year ago, but with 8.76 months of supply you will rarely feel rushed. More than half of those active listings (724, or about 53%) have already taken at least one price cut.
Timing matters heading into the fourth quarter. New pending contracts fell to 82 in September according to RPR, the lowest level on the two-year chart. Fewer buyers are competing right now, and historically October through December is when Austin condo sales slow the most. If you are ready to buy, the next three months typically bring the least competition of the year.
Get pre-approved before you start touring so you can move quickly on a listing that fits. Focus on condos that have been on the market for 45 days or longer, since those sellers are the most likely to accept an offer below list or contribute to closing costs. Ask your agent for each listing's price history, because a condo that has already dropped its price once is often open to further negotiation.
What the Numbers Mean For Sellers
Demand cooled noticeably in September. RPR recorded 100 condos sold, down 33.8% from August's 151, and new pending contracts dropped 30.5% to 82. The other data sources show a smaller decline (ABoR MLS counted 140 closed sales and Unlock MLS counted 132), but every source agrees that September was slower than August and slower than last September.
Pricing is the single biggest factor in how your sale turns out. Austin condo sellers received 96.44% of their final list price on average, but only 93.01% of their original list price. That 3.4-point gap is what overpricing costs. Sellers who start too high end up chasing the market down with reductions, and the median condo in September still took 58 days to sell according to ABoR.
You are competing with a lot of inventory. There are roughly 1,390 condos for sale in Austin and 280 new listings came on the market in September. Buyers can compare your unit side by side with dozens of others in the same price range, so condition, presentation, and HOA information all matter more than they did a few years ago.
The good news is that well-priced condos are still selling. The sold to list price ratio has held steady around 96.5% for three months, and median days on market is down 32.2% from a year ago. Sellers who price at or slightly below the competition at launch are getting offers in a reasonable time frame.
Median Sold Price Down 1.2% Year Over Year
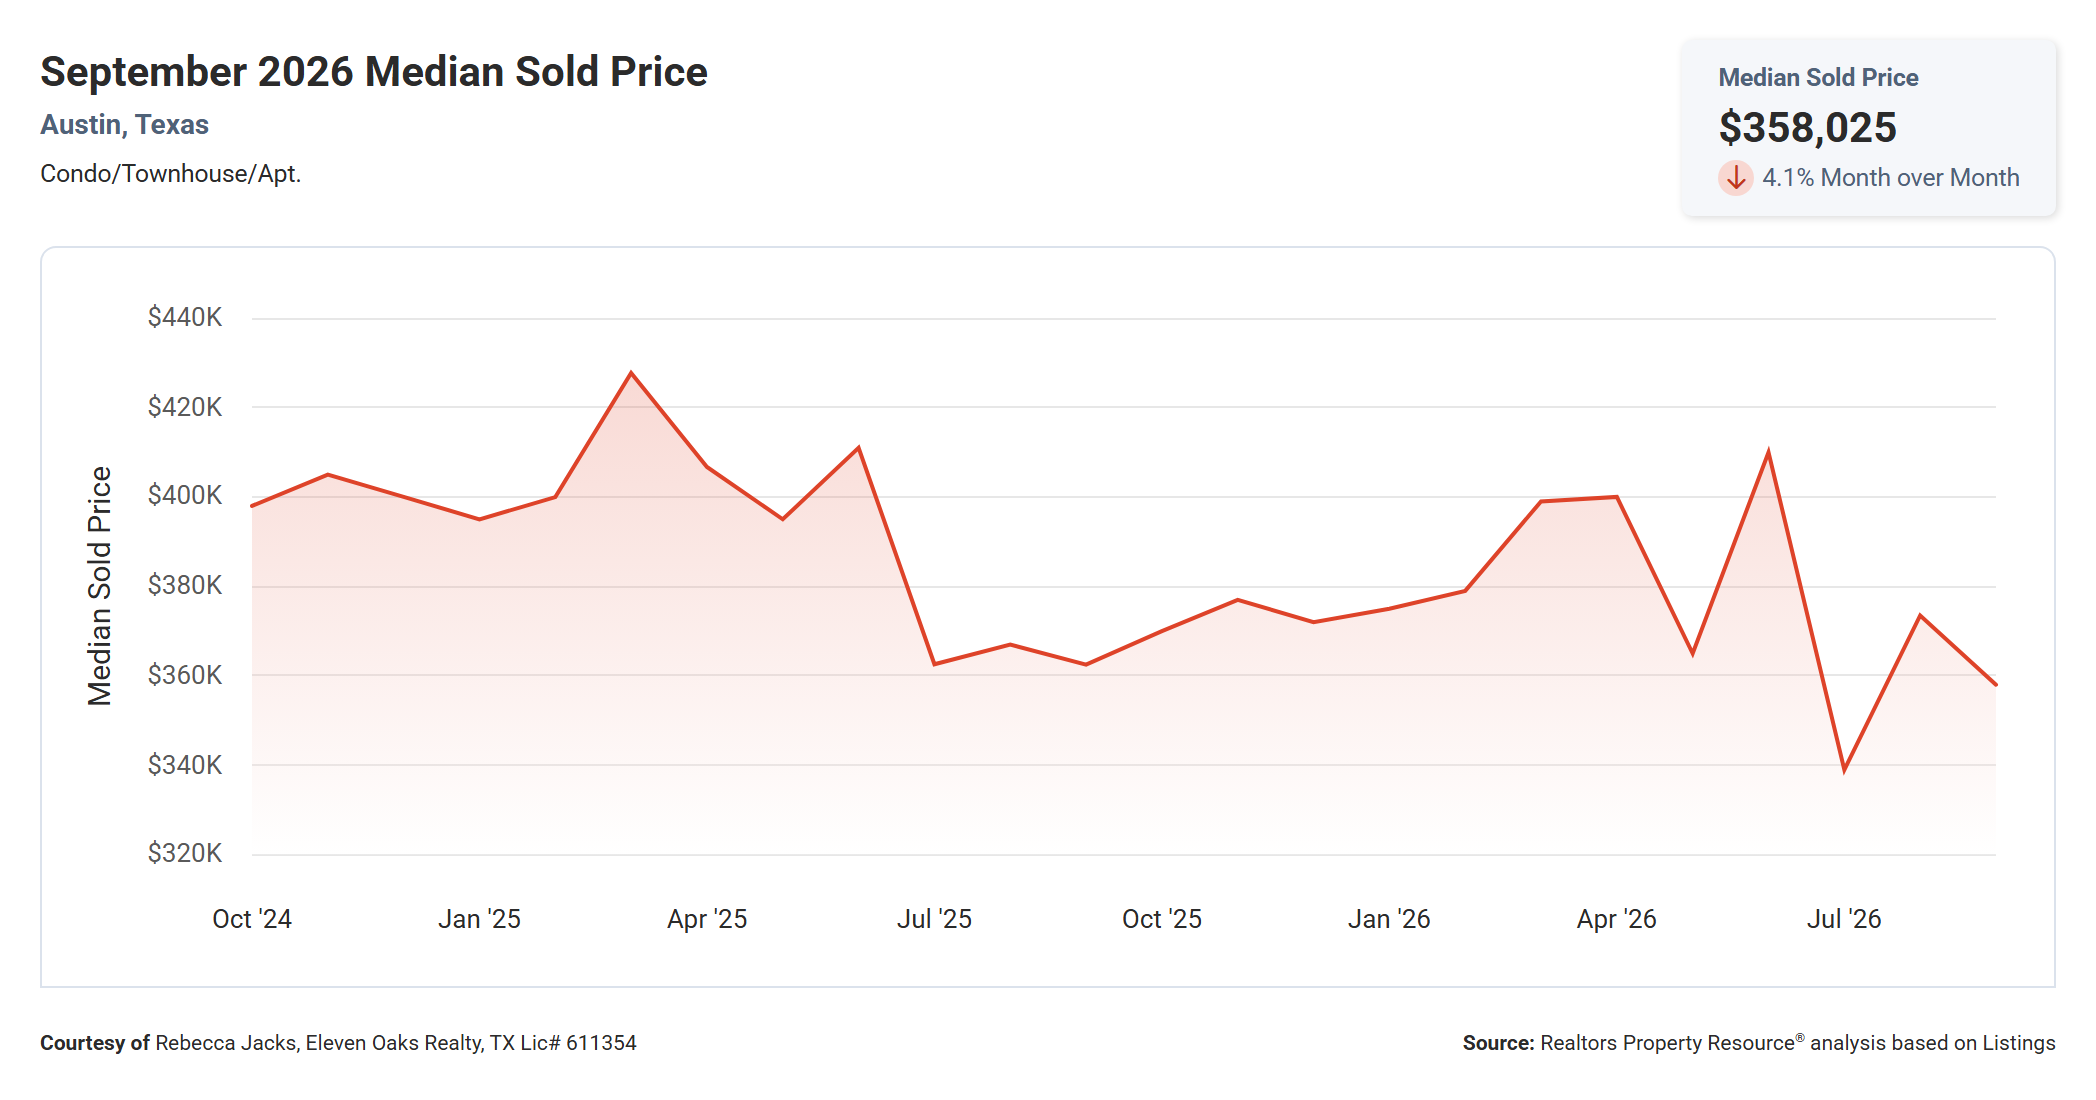
The median sold price for Austin condos was $358,025 in September 2026, down 4.1% from $373,500 in August and down 1.2% from $362,500 in September 2025.
The two-year chart shows how choppy condo prices have been in 2026. The median hit about $410,000 in June, dropped to roughly $339,000 in July, recovered to $373,500 in August, and slipped again in September. Those swings reflect the mix of condos that close each month as much as any real change in value. A month with more downtown high-rise sales pulls the median up, and a month heavy with older one-bedroom units pulls it down.
For buyers, the more useful read is the trend line. Since mid-2025, the median has mostly ranged between $360,000 and $400,000, well below the $428,000 high reached in March 2025. That puts September's $358,025 near the bottom of the recent range.
Watch the October and November medians. If prices hold in the $350,000 to $375,000 range through the fall, the market is stabilizing. A move below $340,000 would suggest further softening heading into 2027.
Median Active List Price Down 6.0% Year Over Year
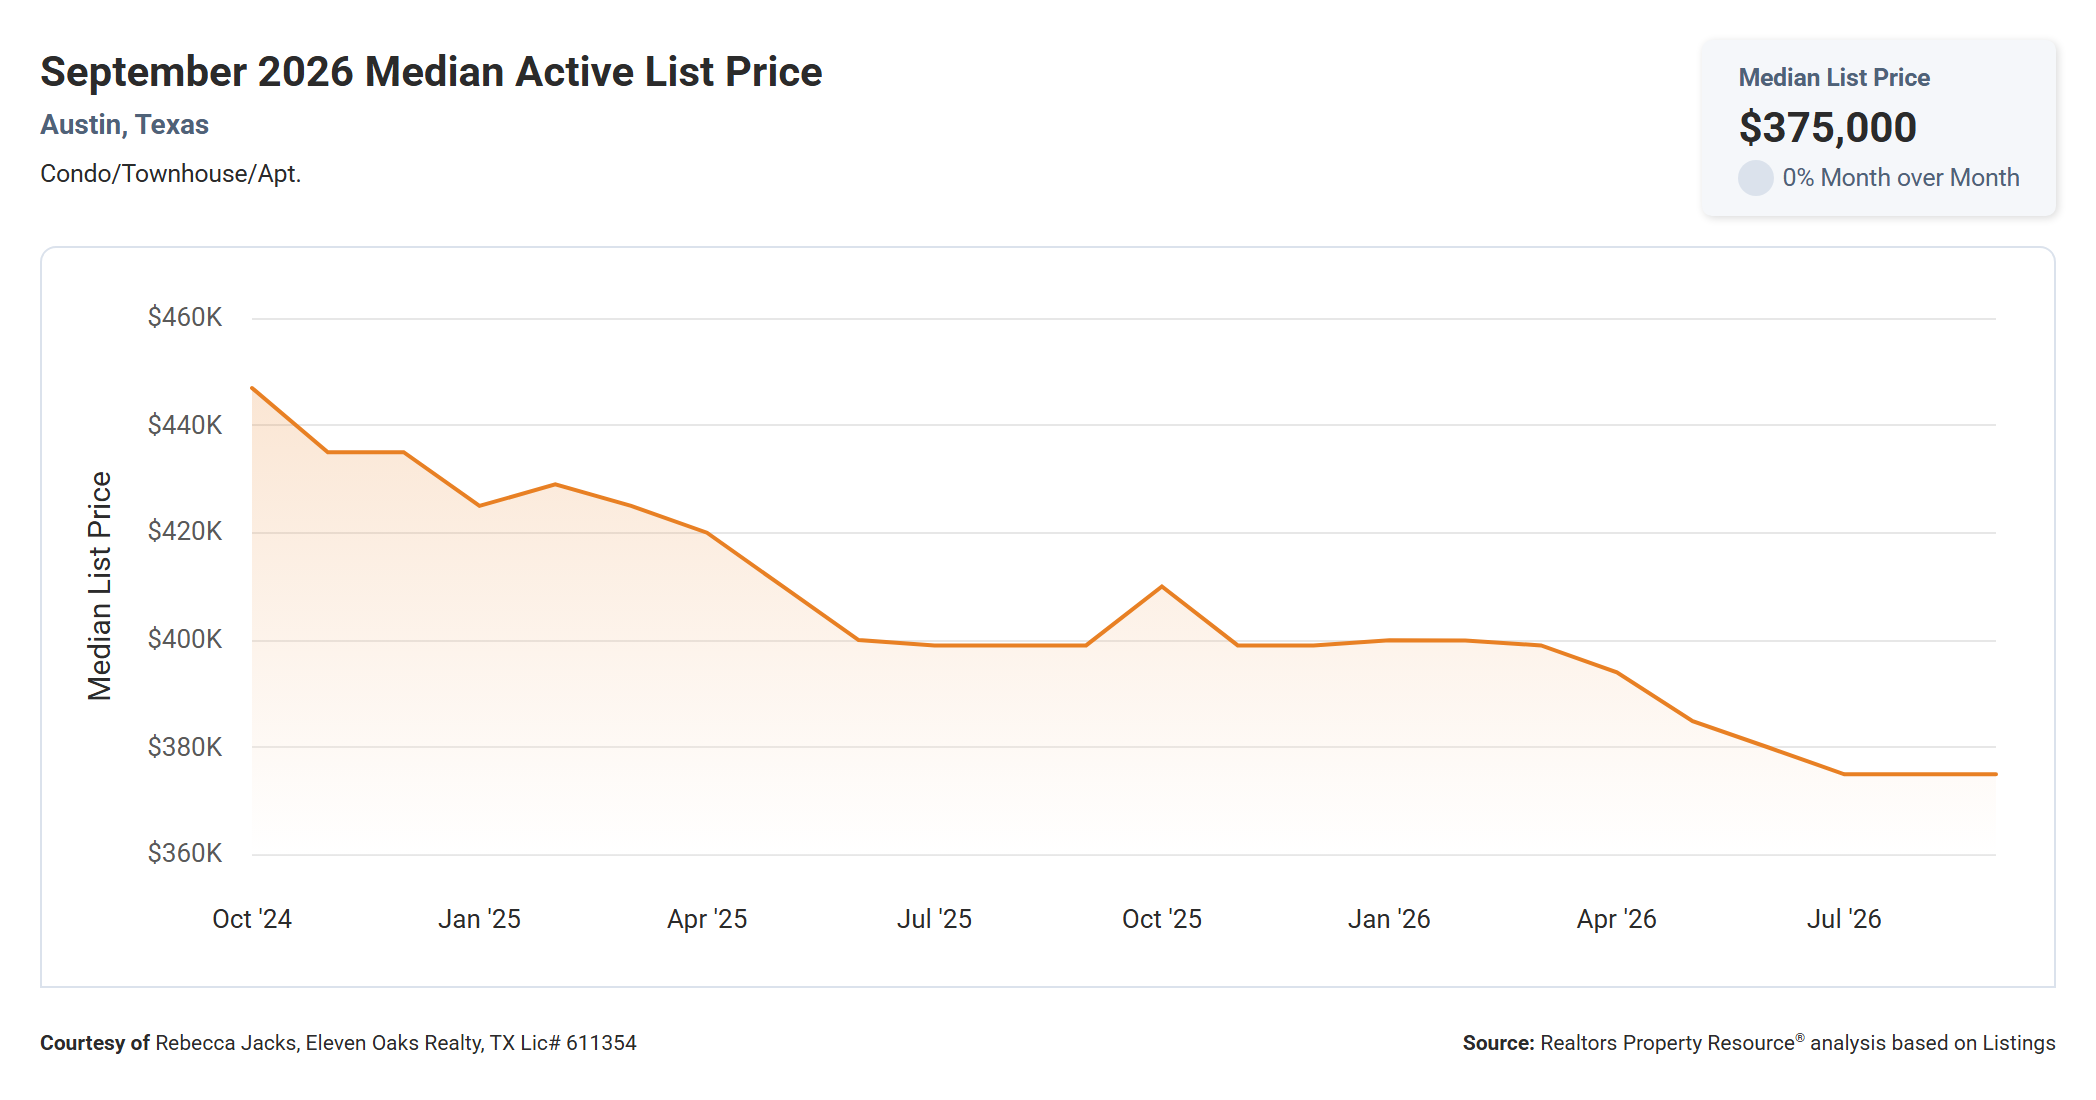
The median active list price for Austin condos was $375,000 in September 2026, unchanged from August and down 6.0% from $399,000 in September 2025.
The list price chart tells a cleaner story than the sold price chart. Asking prices fell steadily from about $447,000 in October 2024 to $400,000 by mid-2025, held near $400,000 through early 2026, then dropped again from April through July before leveling off at $375,000 for the past three months.
That decline matters because sellers set list prices based on what they see selling around them. A $24,000 drop in the median asking price over 12 months shows sellers are adjusting their expectations. For buyers, it means the starting point for negotiations is lower than it was a year ago.
If the median list price holds at $375,000 through October, it suggests sellers have found a floor. A further decline would signal that sellers expect continued price pressure into the winter.
Median Price Per Square Foot Up 3.7% Year Over Year
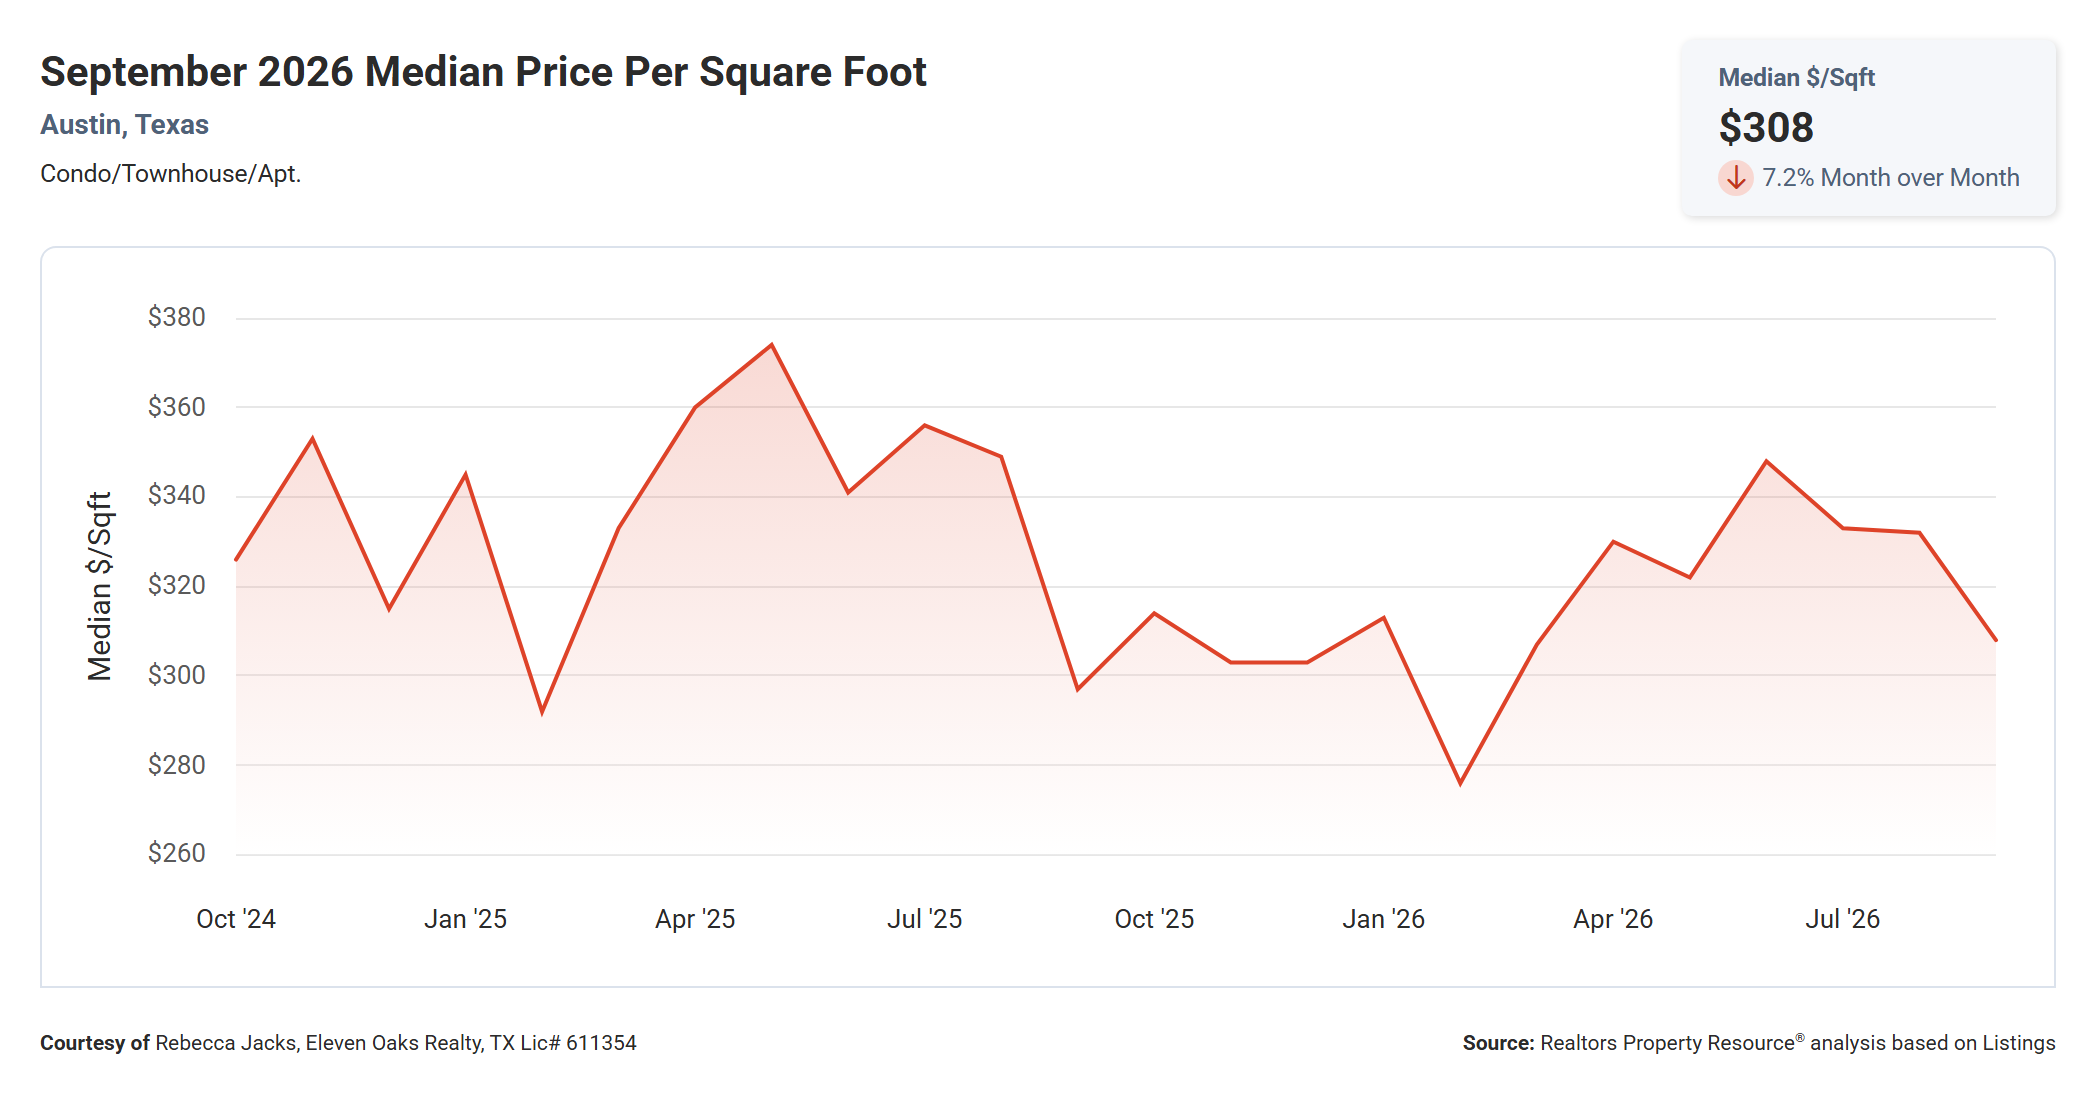
The median price per square foot for Austin condos was $308 in September 2026, down 7.2% from $332 in August but up 3.7% from $297 in September 2025.
September 2025 was one of the low points on the two-year chart, which makes the year-over-year comparison look better than the broader trend. Price per square foot climbed from a low of about $276 in February 2026 to roughly $348 in June, then eased back over the summer. The September figure of $308 sits in the middle of the two-year range.
Price per square foot is a better gauge of value than median price for condos because unit sizes vary widely. ABoR MLS data shows the median condo sold in September was 1,247 square feet, but sales ranged from 300 to 3,958 square feet. Comparing price per square foot helps you judge whether a specific listing is priced in line with the market.
If you are comparing two condos in the same building or area, a difference of $30 to $50 per square foot often reflects finishes, views, floor level, or parking, so ask what is driving the gap before you assume one unit is a better deal.
Average Sold to List Price Up 1.1% Year Over Year
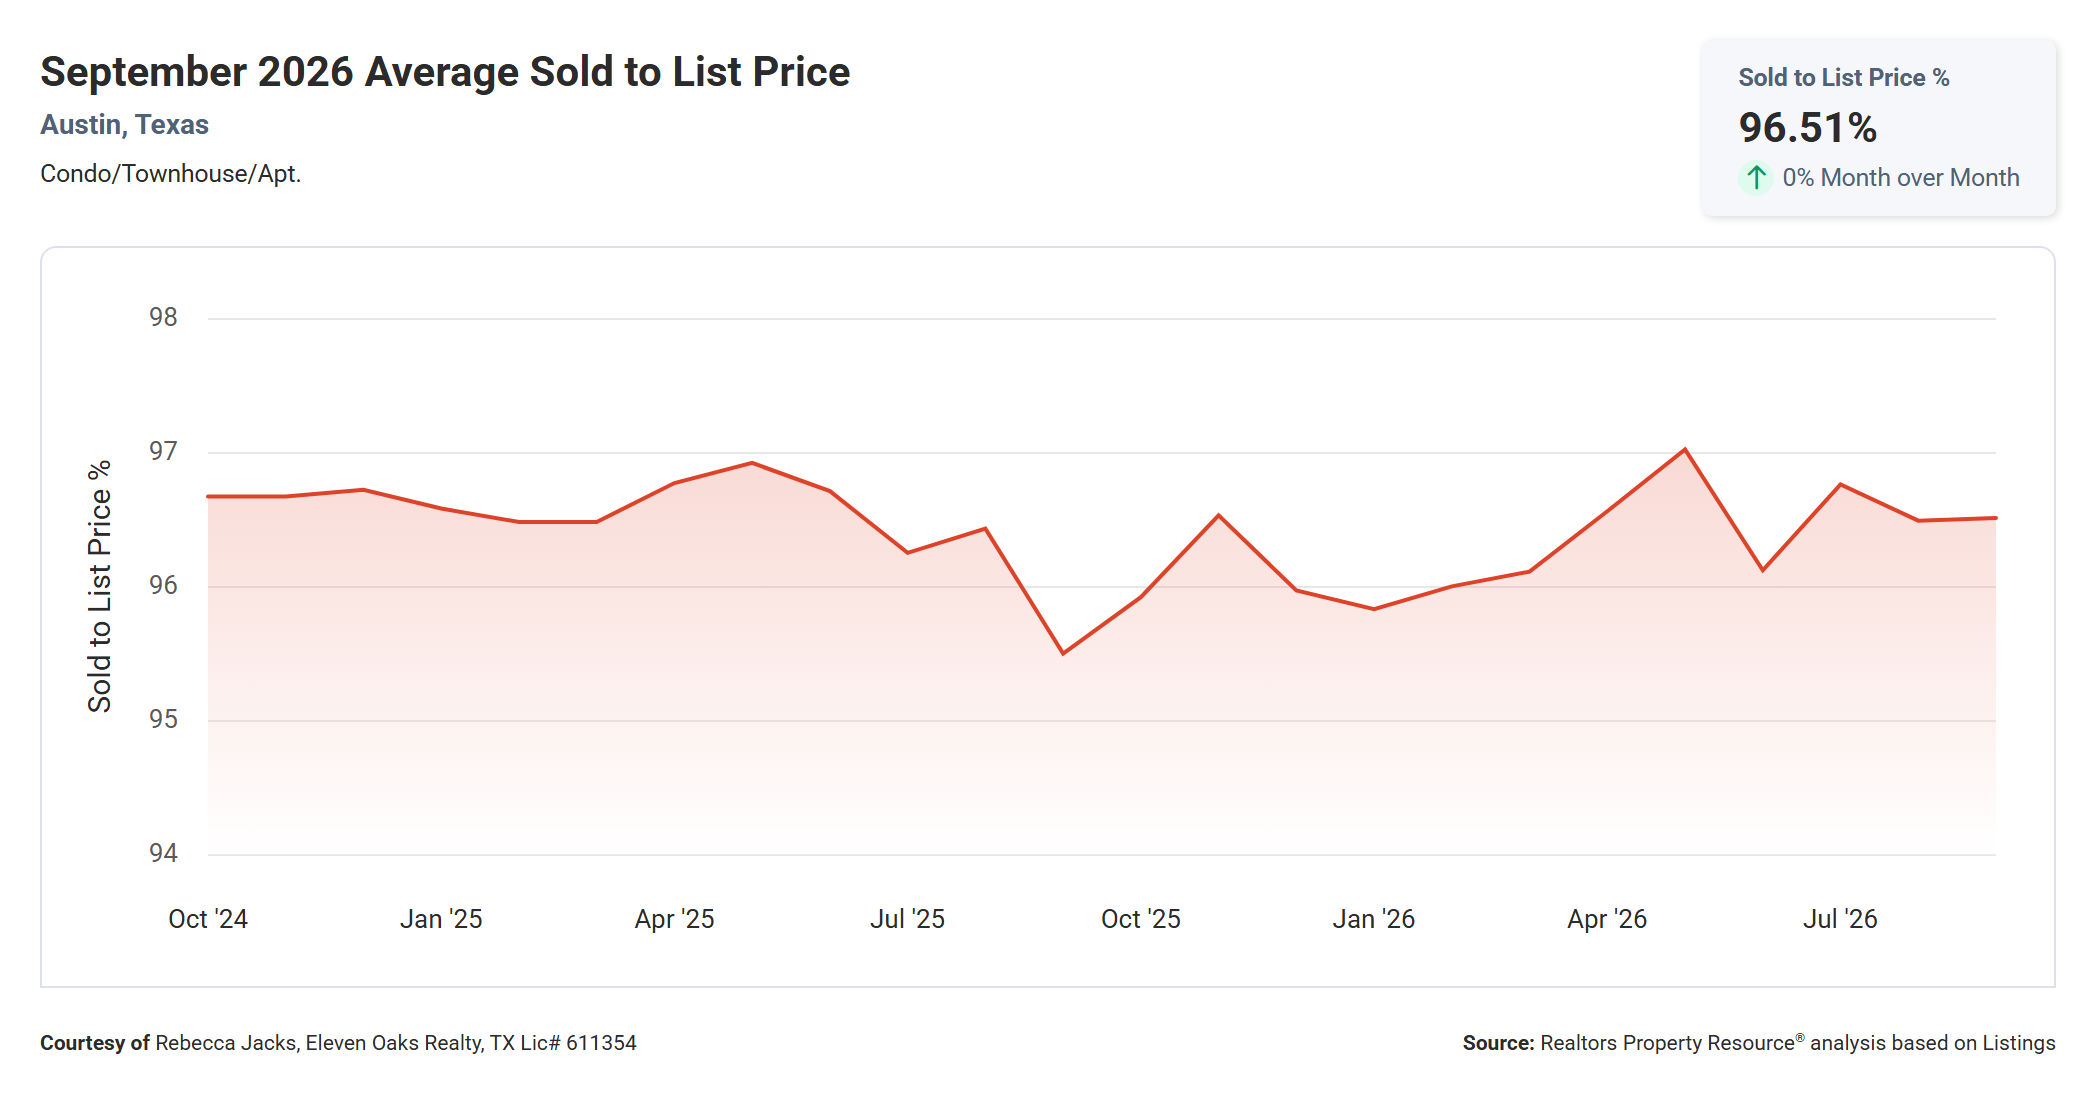
The average sold to list price percentage for Austin condos was 96.51% in September 2026, essentially flat from 96.49% in August and up 1.1% from 95.5% in September 2025.
This metric has been remarkably steady. Over the past two years it has stayed between about 95.5% and 97%, with September 2025 marking the low point. The current 96.51% means a typical condo sold for about 3.5% below its final asking price.
On a $375,000 condo, that works out to roughly $13,000 below list. Keep in mind this measures the final list price. When you factor in price reductions before the sale, the discount from the original asking price is larger (see the Listing-to-Close Price Gap section below).
For sellers, the steady ratio is reassuring. Condos that are priced right are not seeing deep discounts at the negotiating table. For buyers, it sets a realistic expectation: offers 3% to 5% below a fairly priced listing are normal in this market, while offers 10% or more below list usually only work on stale or overpriced units.
Median Time to Sell Down 32.2% Year Over Year
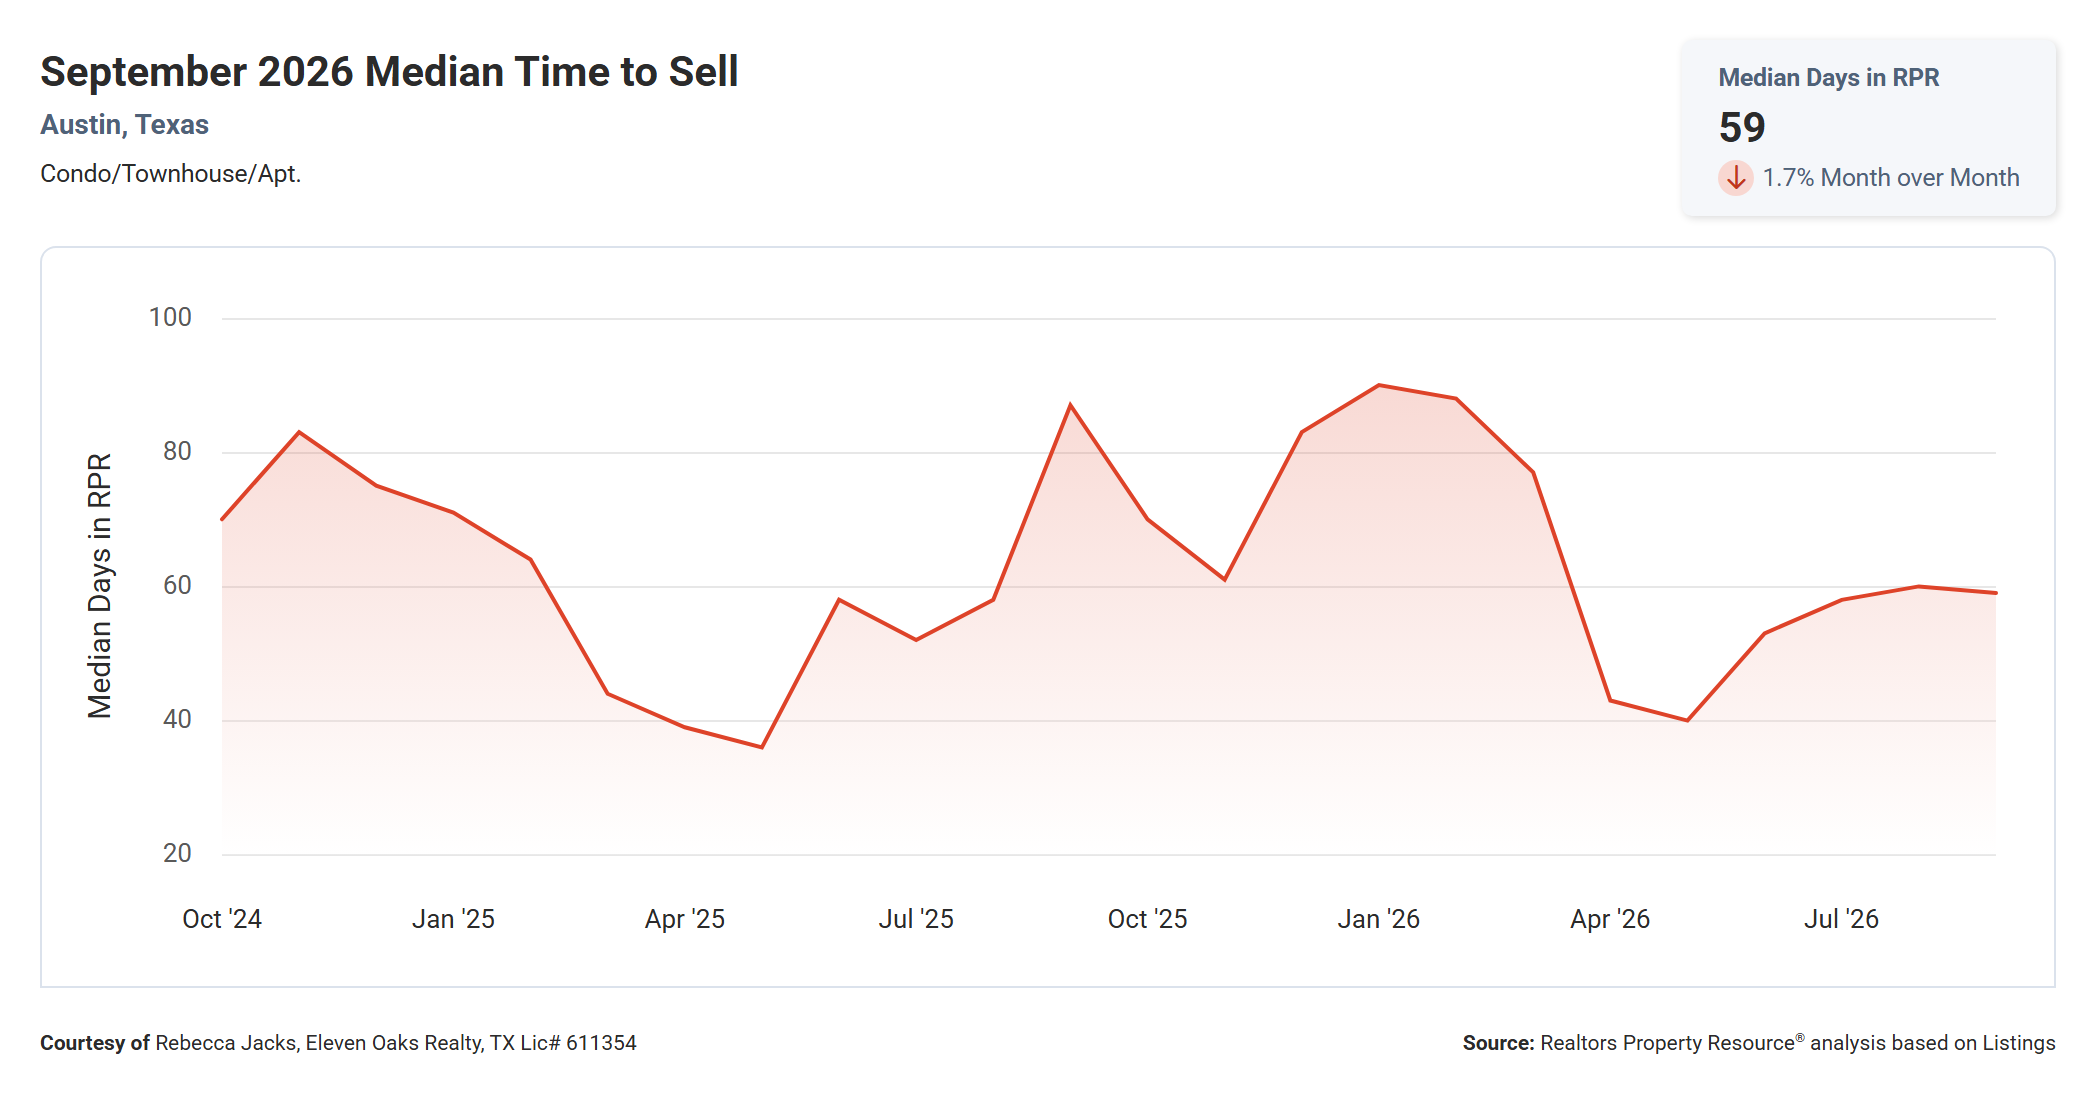
The median time to sell for Austin condos was 59 days in September 2026, down 1.7% from 60 days in August and down 32.2% from 87 days in September 2025.
That is the most encouraging year-over-year number in this month's report. Last September, condos were taking nearly three months to sell. The chart shows median days on market spiked to about 87 days in September 2025, climbed to roughly 90 days in January 2026, then dropped sharply in the spring to about 40 days in May. Since then, the median has drifted back up to the high 50s.
Unlock MLS data supports this trend, showing a median of 58 days on market in September, 27 days faster than a year ago. Condos are not flying off the market, but they are moving faster than they were during last fall's slowdown.
Expect days on market to rise through the end of the year. In both 2024 and 2025, median days on market climbed in the fourth quarter and stayed elevated into January. Sellers listing this fall should plan for a two to three month timeline.
Months Supply of Inventory Down 9.8% Year Over Year
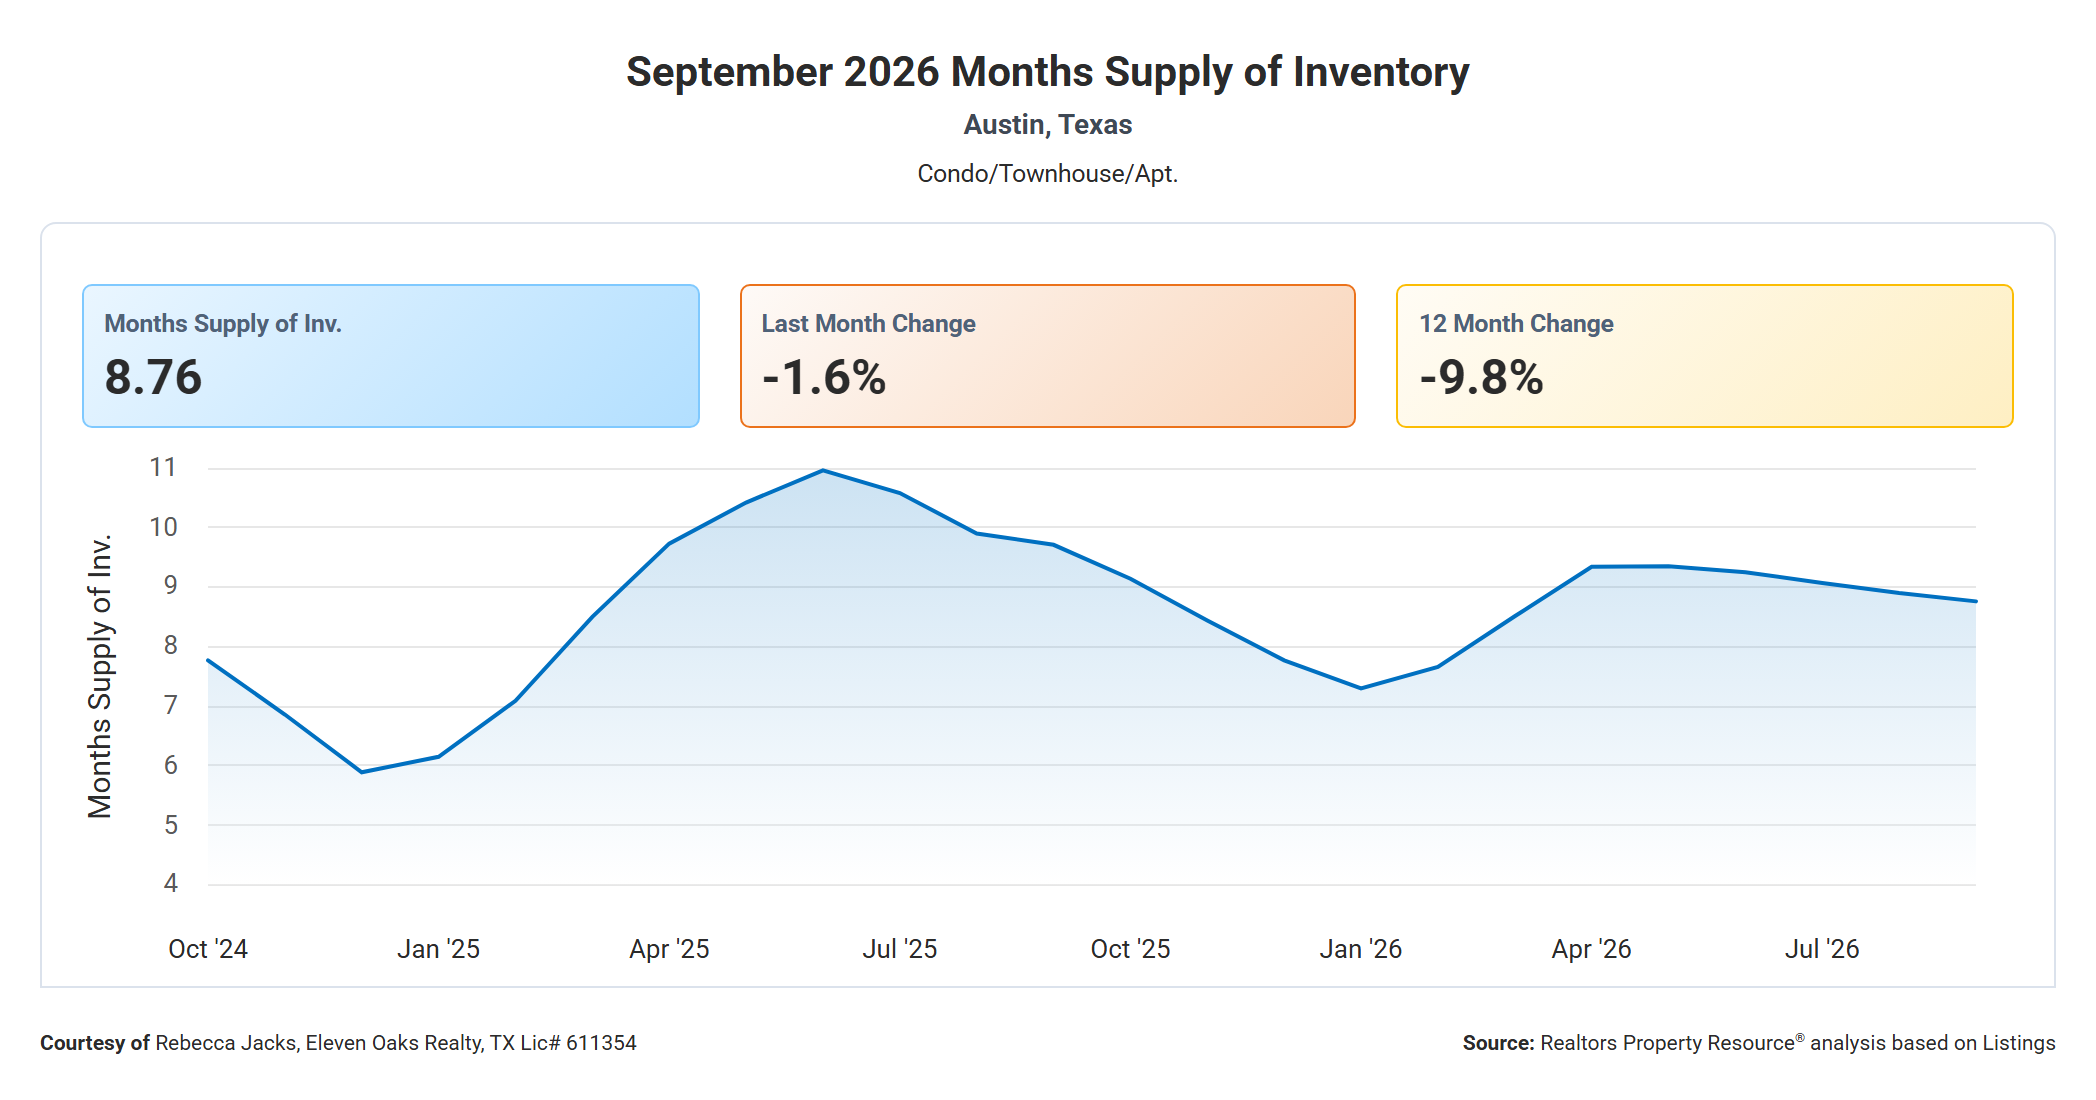
The months supply of inventory for Austin condos was 8.76 months in September 2026, down 1.6% from 8.9 months in August and down 9.8% from 9.71 months in September 2025.
Months of supply measures how long it would take to sell every active listing at the current pace of sales. Anything above six months is a buyer's market, and Austin condos have stayed above seven months for most of the past two years. Supply peaked near 11 months in June 2025, fell to about 7.3 months in January 2026, then rose back above 9 months in the spring.
The slow decline since May is a modest positive for sellers. Inventory is shrinking because fewer new listings are coming on the market, not because buyers are snapping up condos faster. Unlock MLS calculates months of supply differently and shows 10.87 months as of October 6, so both sources confirm this remains a buyer's market.
Watch whether months of supply drops toward seven months over the winter as it did last year. A seasonal dip is normal, but if supply stays above eight months through December, buyers will carry strong negotiating leverage into the spring 2027 market.
Active Listings Down 12.4% Year Over Year
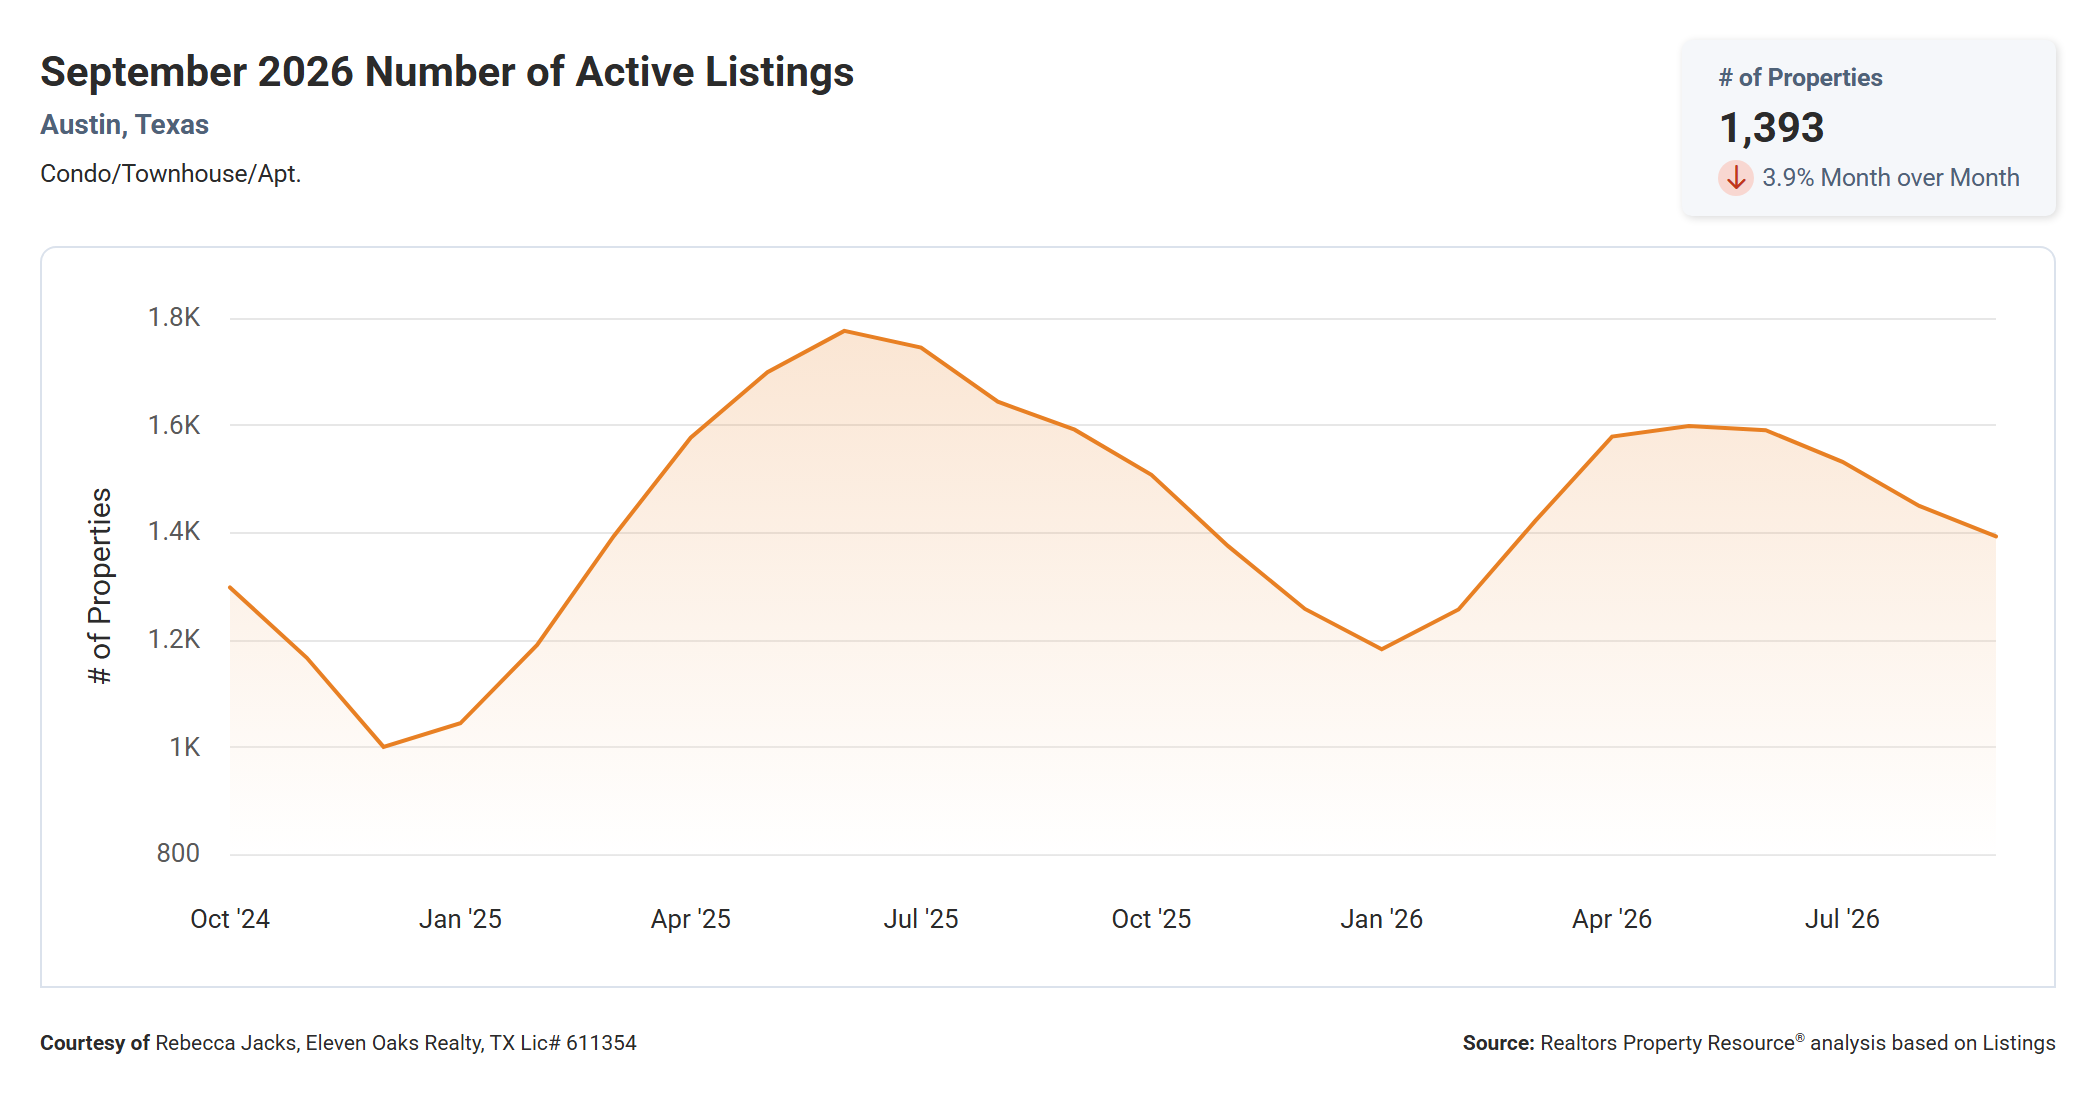
There were 1,393 active condo listings in Austin in September 2026, down 3.9% from 1,450 in August and down 12.4% from 1,590 in September 2025.
The active listings chart follows a clear seasonal pattern. Inventory bottoms out in December and January, builds through the spring, and peaks in early summer. The 2026 peak of about 1,600 listings in May was noticeably lower than the 2025 peak of roughly 1,780 in June, and inventory has declined each month since.
Fewer listings is a meaningful shift. Since the spring, Austin condo inventory has run consistently below year-ago levels, and the gap has widened to about 200 listings. Buyers still have plenty of choices, but the gap is narrowing.
If active listings follow last year's pattern, expect inventory to drop toward 1,200 by the end of the year. That would give buyers fewer choices this winter than they had in the spring, though still far more than the roughly 1,000 listings available in December 2024.
New Listings Down 14.4% Year Over Year
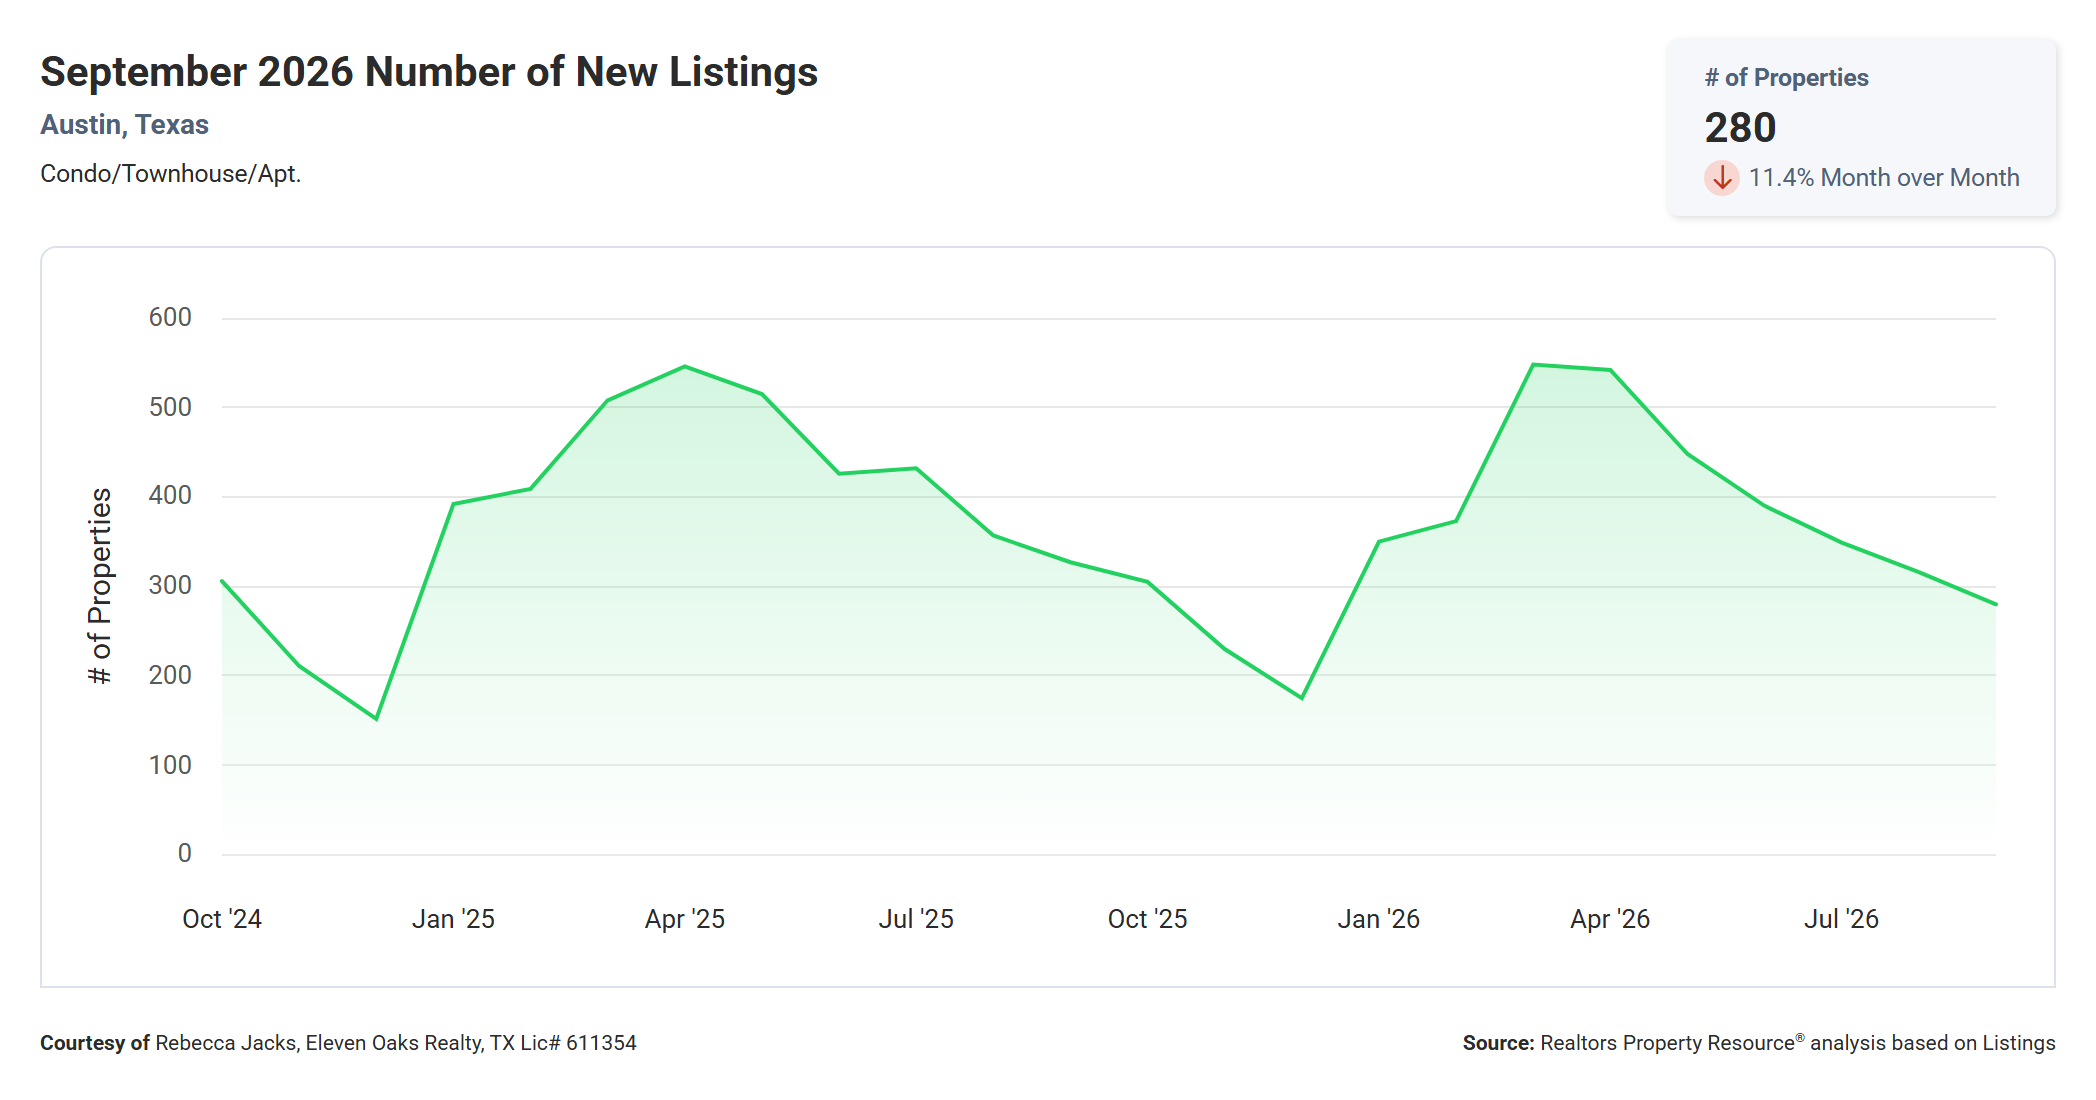
There were 280 new condo listings in Austin in September 2026, down 11.4% from 316 in August and down 14.4% from 327 in September 2025.
New listings have declined every month since March, when about 550 condos came on the market. September's 280 is the lowest monthly total since December 2025. Unlock MLS shows a smaller drop, counting 308 new listings in September (down 1.6% from a year ago), and year to date there have been 3,676 new condo listings, down 4.3% from 2025.
The steady drop in new listings is the main reason inventory is shrinking. Fewer sellers are choosing to list in a market where prices are flat to down, and many owners with low mortgage rates have little reason to sell.
For sellers, fewer new listings means slightly less competition this fall. For buyers, it means the best new listings may not last as long as they did earlier in the year.
New Pending Listings Down 37.4% Year Over Year
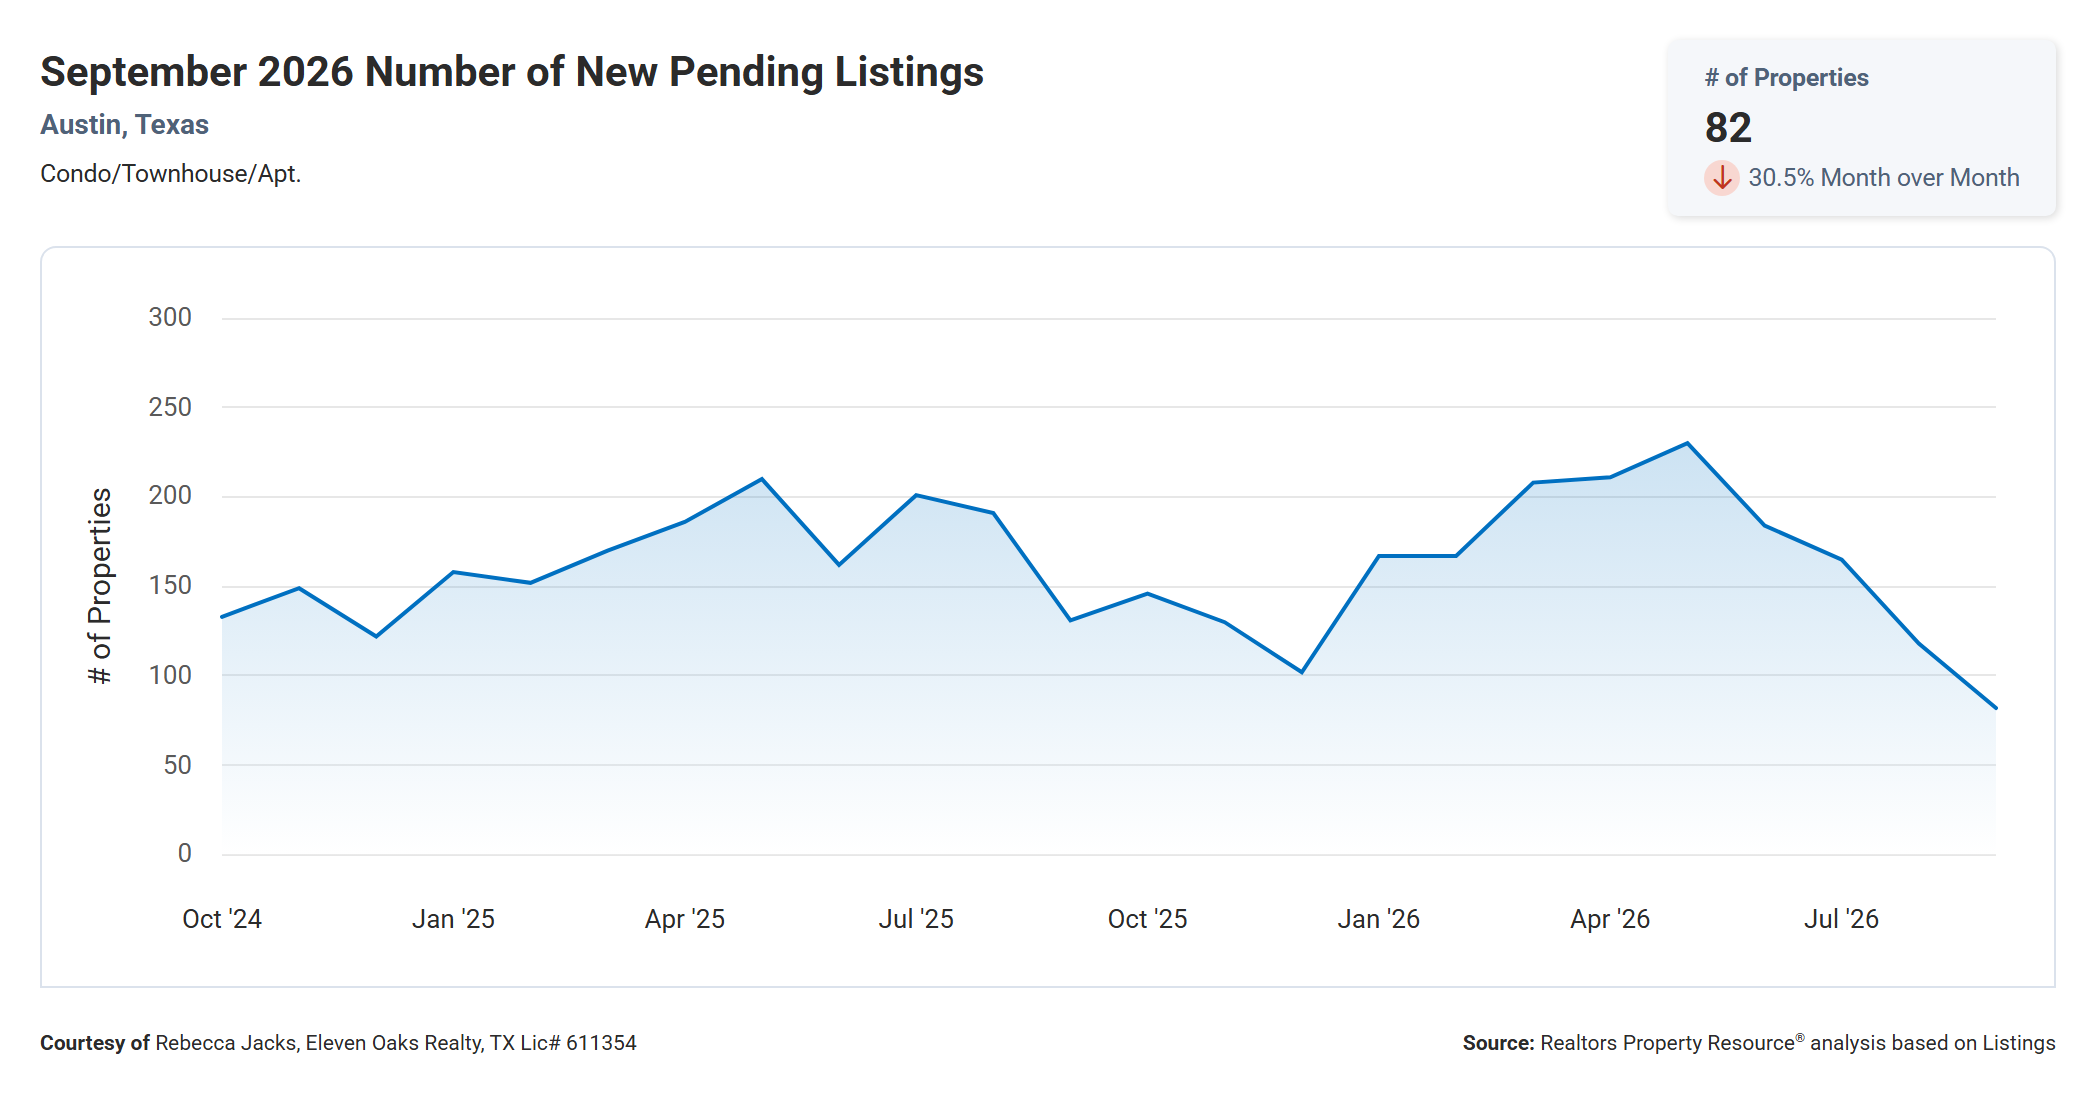
There were 82 new pending condo listings in Austin in September 2026, down 30.5% from 118 in August and down 37.4% from 131 in September 2025.
According to RPR, that is the lowest monthly total on the two-year chart. Pending contracts peaked at about 230 in May 2026 and have fallen every month since. The RPR data points to a sharp pullback in buyer activity heading into the fall.
Unlock MLS paints a different picture. It counted 126 new condo contracts in September, up 6.8% from 118 a year ago, and shows year-to-date pending contracts running ahead of 2025. The two sources measure pending activity differently, and the most recent month in any data source can shift as late-reported contracts are added. The truth is likely somewhere in between: buyer activity slowed in September, but not as dramatically as the RPR chart suggests.
Pending contracts are the best leading indicator of future closings. Whichever source you follow, September's contract activity points to a slower October and November for condo sales.
Condos Sold Down 41.9% Year Over Year
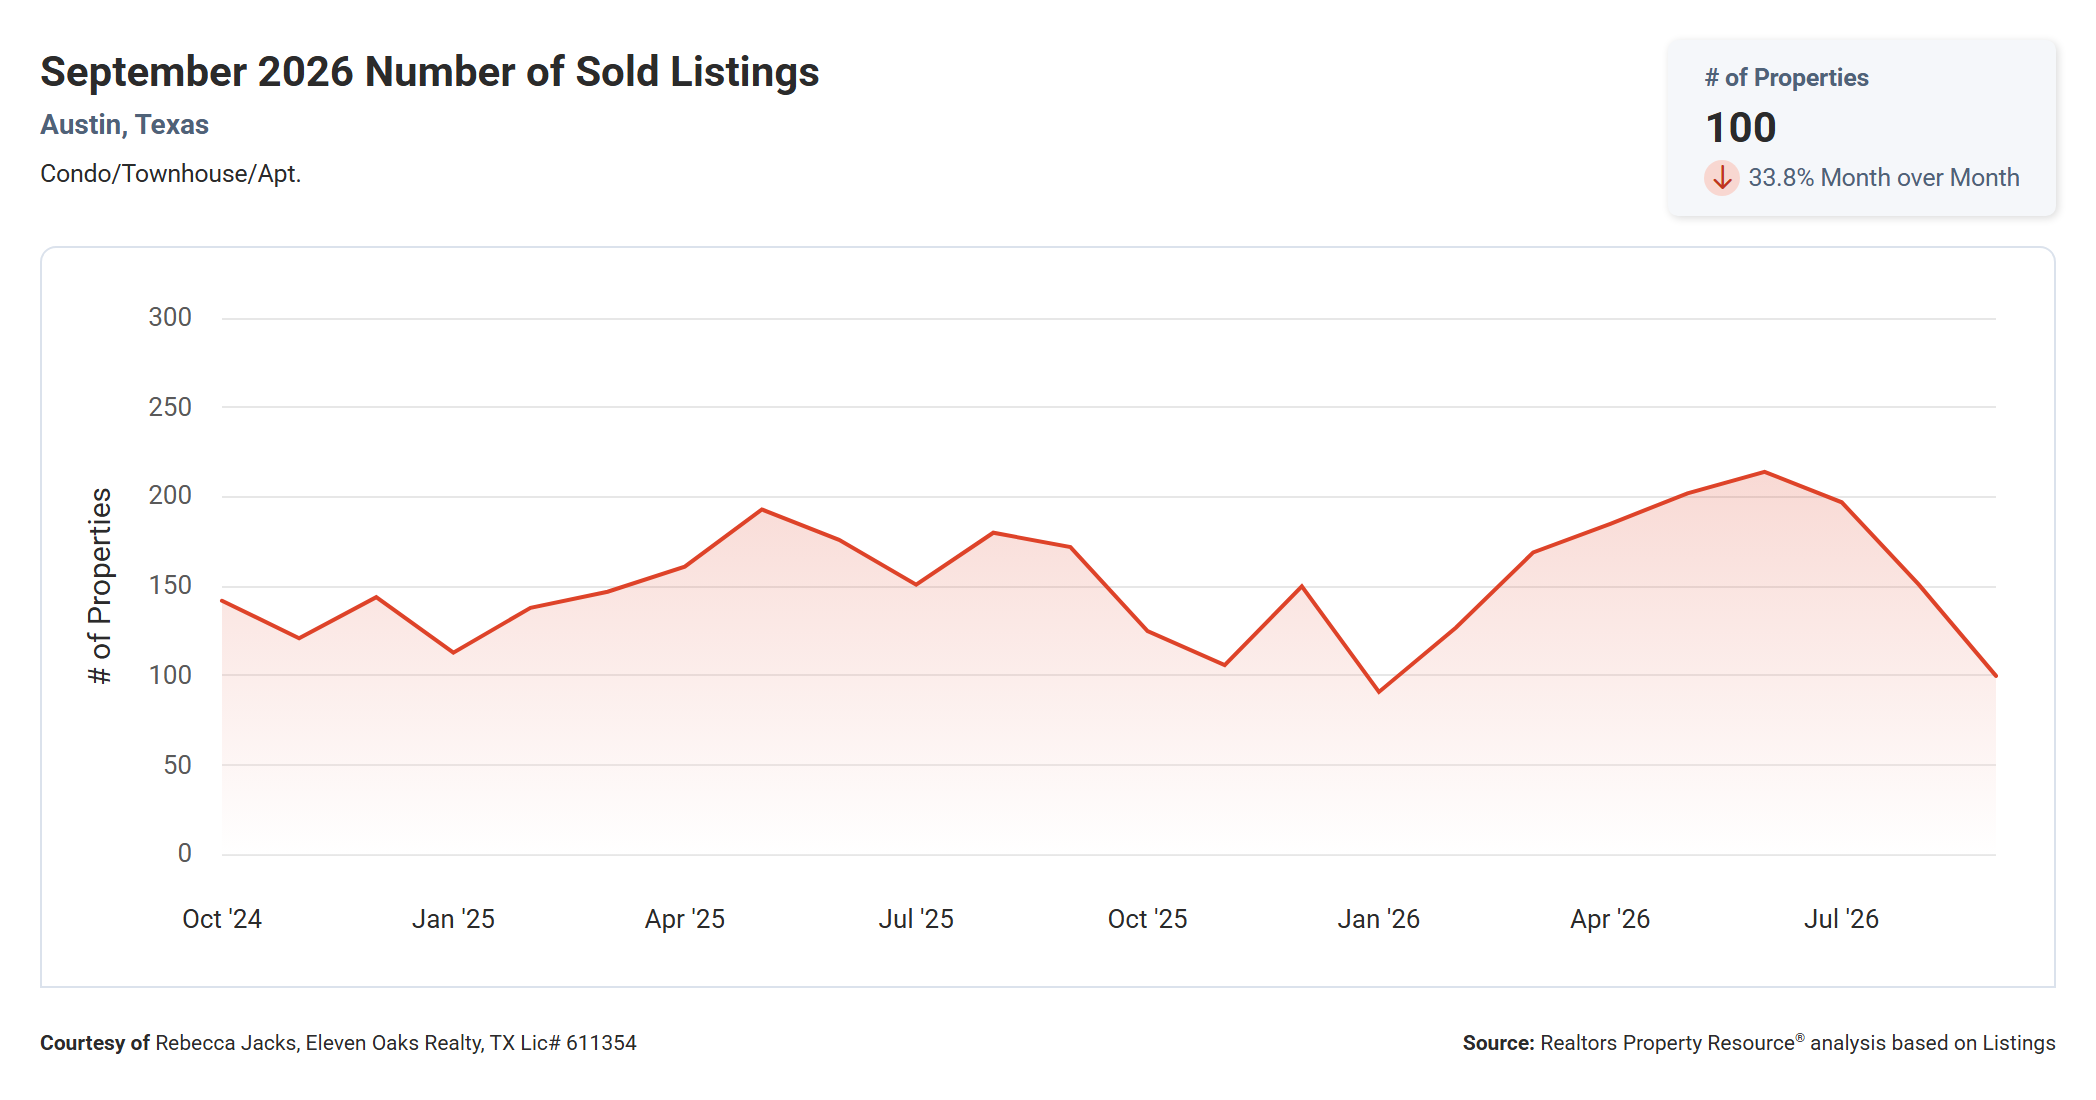
RPR recorded 100 condos sold in Austin in September 2026, down 33.8% from 151 in August and down 41.9% from 172 in September 2025.
The other data sources show a smaller decline. ABoR MLS counted 140 closed condo and townhome sales in September, and Unlock MLS counted 132, down 22.8% from a year ago. The difference between sources is larger than usual this month, likely due to the timing of data pulls and how each source classifies property types. According to RPR, September was the slowest month for condo sales since January.
Sales rose steadily through the first half of 2026, reaching about 215 in June according to RPR, before falling in July, August, and September. Year to date, Unlock MLS shows 1,497 condo sales through early October, up 3.0% from the same period in 2025. So while September was weak, 2026 as a whole is still running slightly ahead of last year.
The decline in pending contracts suggests October sales will also be modest. Expect sales to stay in the 100 to 140 range through the end of the year.
Total Sales Volume Down 41.8% Year Over Year
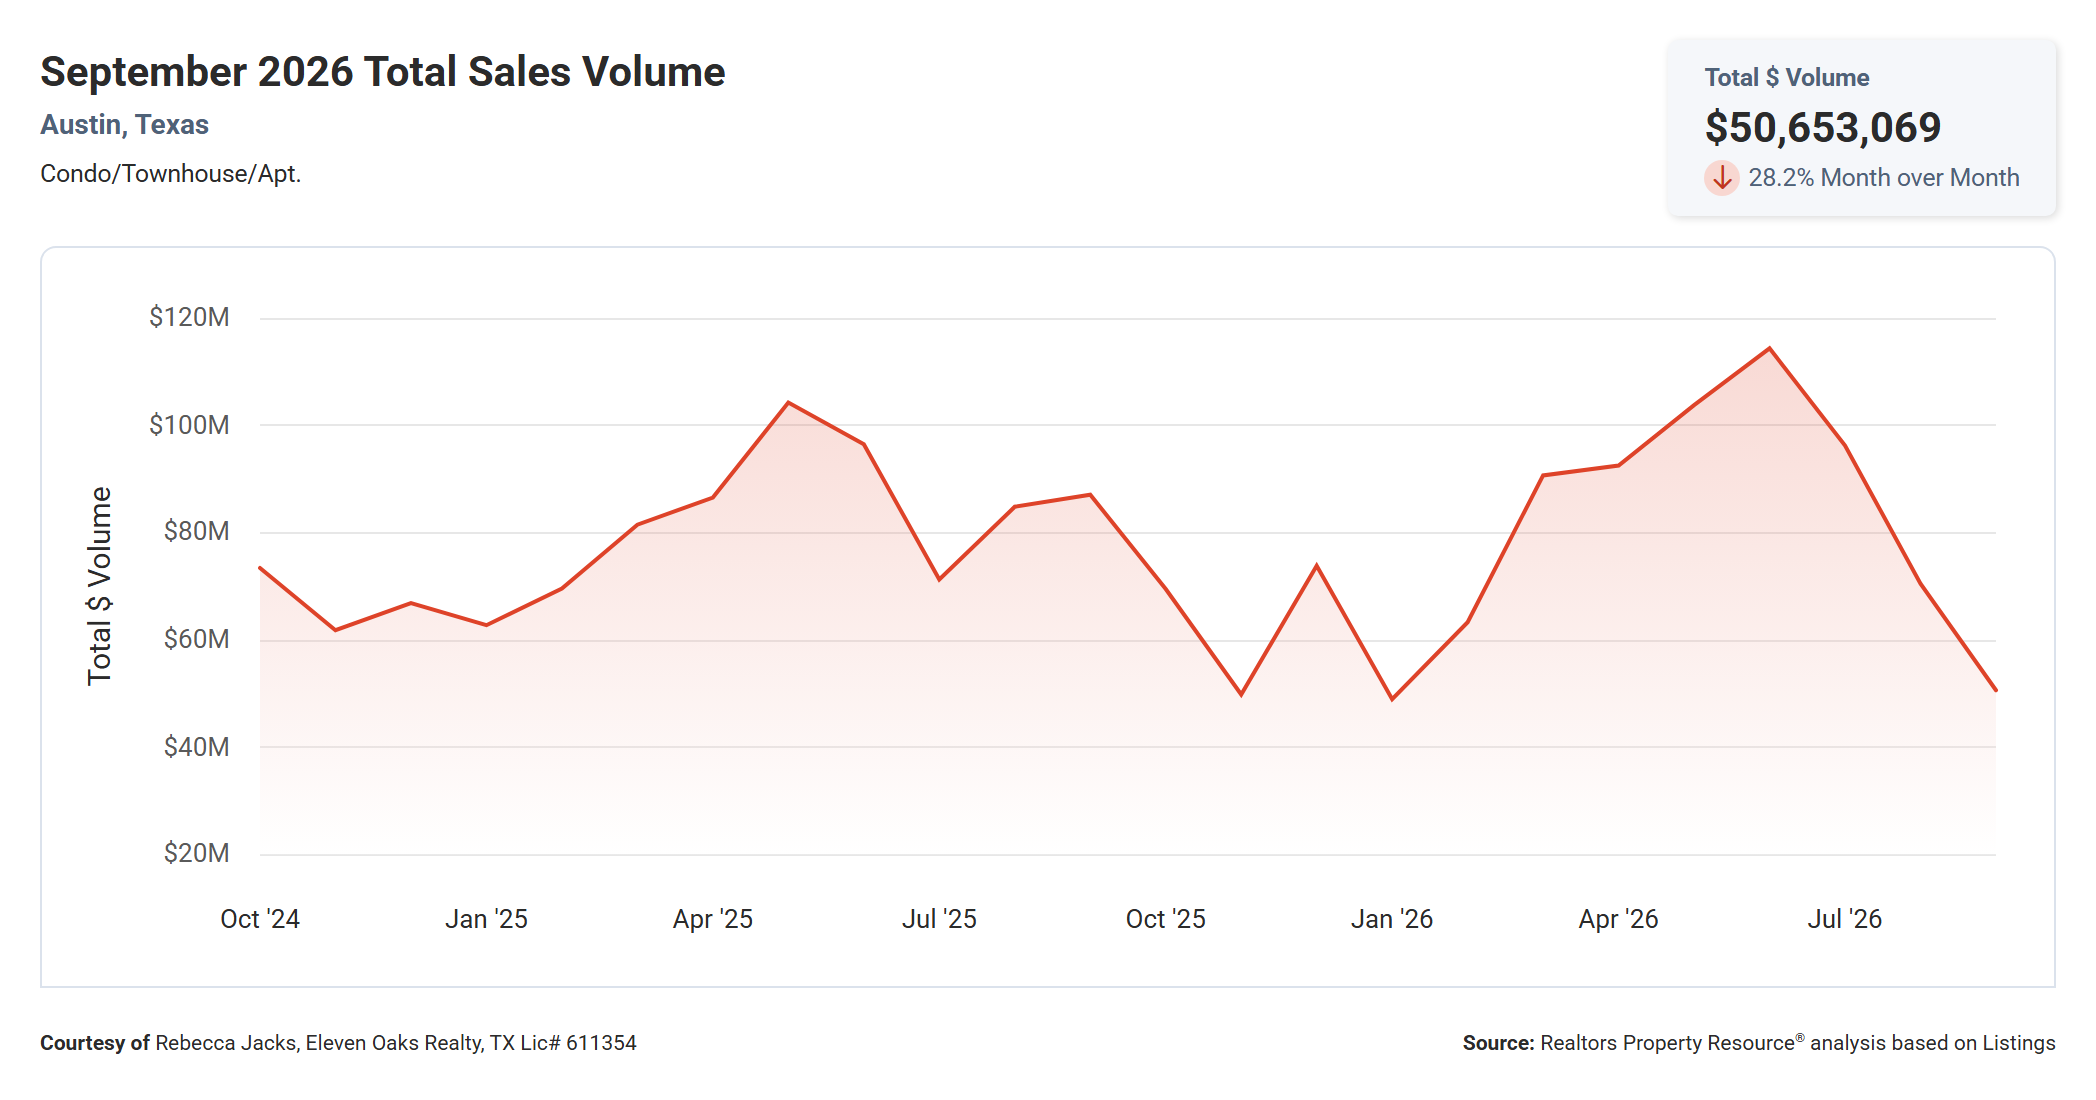
Total condo sales volume in Austin was $50,653,069 in September 2026, down 28.2% from $70.51 million in August and down 41.8% from $87.08 million in September 2025.
Sales volume combines the number of sales with sale prices, so a drop in both produces a sharp decline. The 2026 peak came in June at about $114 million, the highest point on the two-year chart, before falling for three straight months. Unlock MLS reports September volume at $65.4 million, down 24.5% from last year, reflecting its higher sales count.
Year to date, Unlock MLS shows $763.16 million in condo sales volume, up 0.6% from the same period in 2025. That means the strong spring offset the weak late summer, leaving 2026 roughly even with last year.
September 2026 Austin Condo by the Numbers
The table below is pulled directly from the Austin Board of REALTORS MLS statistics for September 2026 and covers 140 closed condominium and townhome transactions in the City of Austin.
| Min | Max | Avg | Median | |
|---|---|---|---|---|
| Beds | 1 | 5 | 2 | 2 |
| Baths | 1 | 6 | 2 | 2 |
| Sq Ft | 300 | 3,958 | 1,407 | 1,247 |
| Lot Sq Ft | -- | 150,674,040 | 1,103,190 | 2,409 |
| List Price | $99,000 | $2,950,000 | $511,796 | $367,495 |
| LP/Sq Ft | $110.49 | $1,625.34 | $360.25 | $309.59 |
| Acres | -- | 3,459.000 | 25.326 | 0.055 |
| Close Price | $90,000 | $2,875,000 | $491,024 | $350,120 |
| CP/Sq Ft | $122.17 | $1,584.02 | $346.15 | $298.45 |
| CP/LP% | 85.00% | 116.00% | 96.44% | 97.00% |
| CP/OLP% | 67.00% | 208.00% | 93.01% | 94.00% |
| ADOM | 0 | 516 | 80 | 58 |
The most expensive condo that sold in September 2026 sold for $2,875,000 and the least expensive condo sold for $90,000. Condos ranged in size from 300 to 3,958 square feet with an average size of 1,407 square feet. The average price per square foot for a condo that sold in Austin in September 2026 was $346.15 with the lowest being $122.17 per square foot and the highest being $1,584.02 per square foot. It took, on average, 80 days to sell a condo in Austin and sellers received, on average, 93.01% of their original list prices.
The gap between the CP/LP% and CP/OLP% figures tells the real pricing story. Sellers received 96.44% of their final list price on average, but only 93.01% of their original list price. That difference shows how many sellers had to cut their price before finding a buyer. The average days on market of 80 is well above the median of 58, which means a smaller group of condos sat on the market for a very long time (one took 516 days) and pulled the average up.
The range of close prices, from $90,000 to $2,875,000, shows how broad the Austin condo market is. A buyer can find a small studio for under $100,000 or a luxury downtown residence approaching $3 million. The lot size and acreage figures include a few large shared-property records that skew the maximums and averages, so the medians (2,409 square feet and 0.055 acres) are the more useful numbers for those two rows.
Where Buyers Are Shopping: A Look at Price Ranges
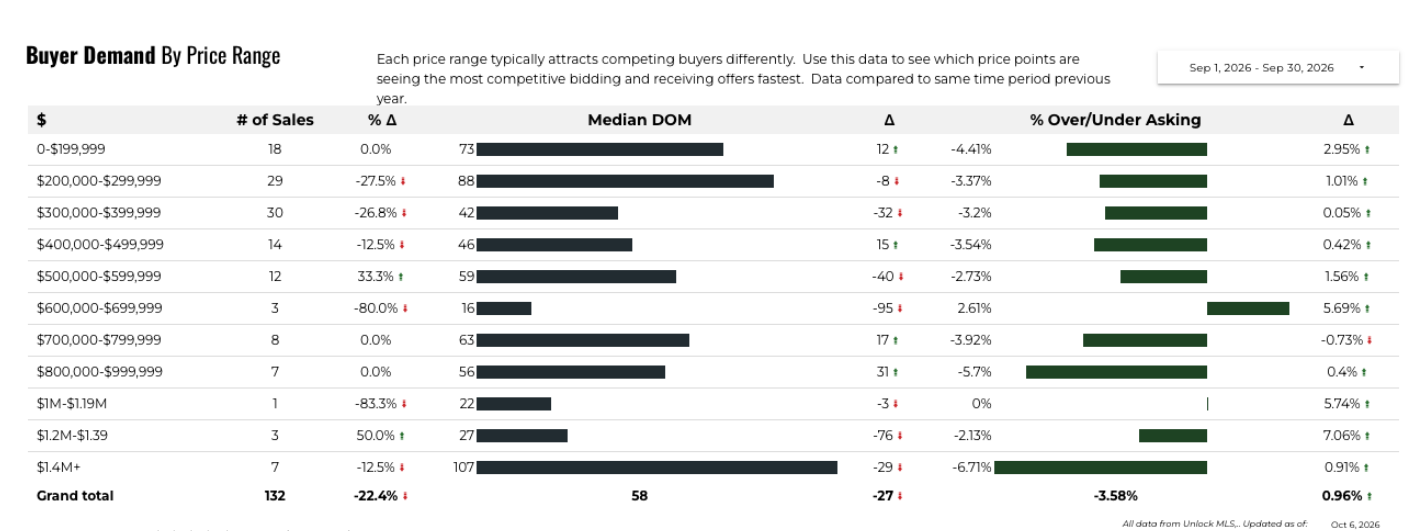
Unlock MLS recorded 132 condo and townhome sales in Austin in September 2026, down 22.4% from the same period last year, and the breakdown by price range shows where buyers are most active.
The three busiest price ranges were all under $400,000. The $300,000 to $399,999 range led with 30 sales, followed by $200,000 to $299,999 with 29 sales and under $200,000 with 18 sales. Together those three brackets made up 77 sales, or 58% of the market. Sales in the $200,000 to $299,999 and $300,000 to $399,999 ranges were each down about 27% from last year, which accounts for most of the overall decline.
The middle of the market was mixed. The $400,000 to $499,999 range had 14 sales (down 12.5%), while the $500,000 to $599,999 range was one of the few brackets to grow, with 12 sales, up 33.3% from last year. The $600,000 to $699,999 range had only 3 sales, down 80%, but those condos sold in a median of just 16 days and closed 2.61% above asking, the only bracket where buyers paid over list.
Speed varied widely by price. The slowest sellers were condos priced at $1.4 million and above (107 median days) and condos in the $200,000 to $299,999 range (88 days). Buyers had the most negotiating room at the top of the market, where $1.4 million-plus condos sold 6.71% below asking, and in the $800,000 to $999,999 range at 5.7% below asking. Overall, condos sold an average of 3.58% under asking, a slight improvement for sellers from last year.
The Listing-to-Close Price Gap: What Sellers Need to Know
The difference between a seller's original list price and the final sale price is one of the clearest measures of buyer leverage. In September, Austin condo sellers received 96.44% of their final list price but only 93.01% of their original list price, according to ABoR MLS. Unlock MLS shows a similar pattern, with a list-to-close ratio of 91.97%.
Here is what that looks like in dollars. The median list price for condos that sold in September was $367,495. At the median CP/OLP of 94%, a condo originally listed at that price would close at about $345,445, a reduction of roughly $22,000 from the original asking price. At the average CP/OLP of 93.01%, the reduction grows to more than $25,000.
The takeaway is simple: pricing correctly from day one matters more than any price reduction you make later. Overpriced condos sit on the market, collect price cuts, and often sell for less than they would have if they had launched at the right price. A competitive list price brings the most buyer attention during the first two to three weeks, when a new listing gets the most views.
Price Drops in the Austin Condo Market
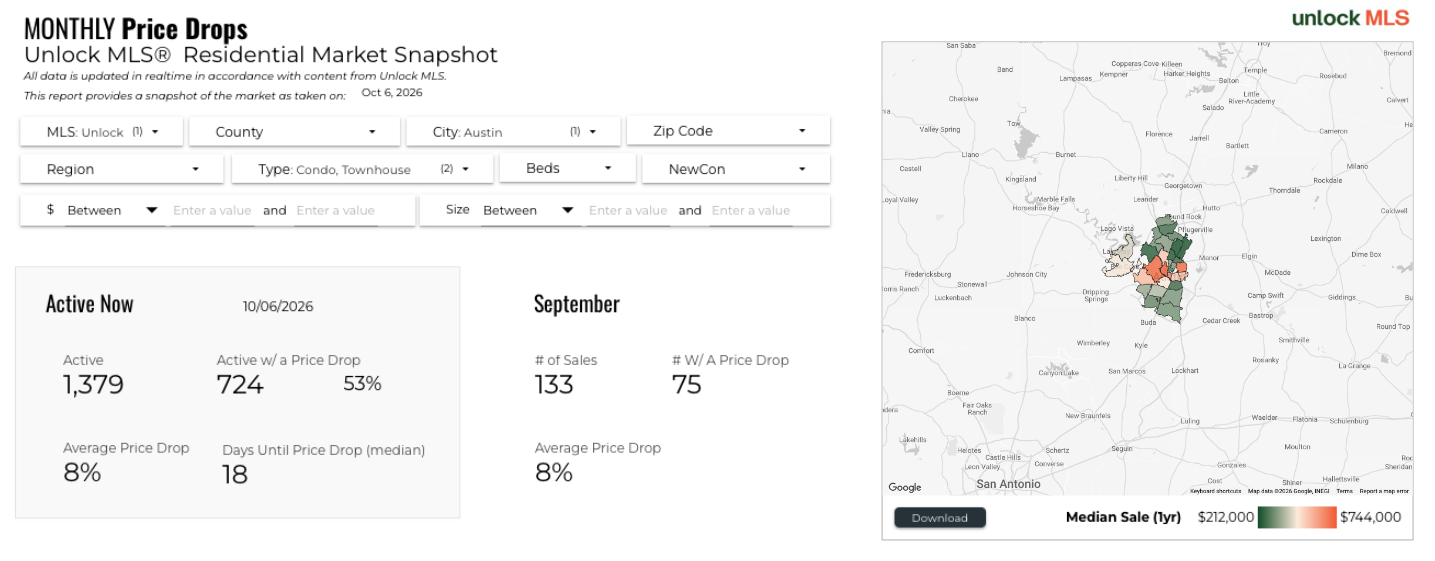
Price cuts are now the norm in the Austin condo market. As of October 6, 724 of the 1,379 active condo listings (about 53%) had taken at least one price drop, with an average reduction of 8%. The median listing took its first price cut just 18 days after hitting the market. Among September's closed sales, 75 of 133 (about 56%) had a price drop before selling, and those reductions also averaged 8%.
For buyers, this is a valuable strategy tool. A condo that has been on the market for more than a few weeks and has already dropped its price is a strong candidate for a below-list offer. Ask for the full price history on any condo you are considering, and pay attention to how long it sat at each price. Sellers who have already cut once are often willing to negotiate further rather than face a second or third reduction.
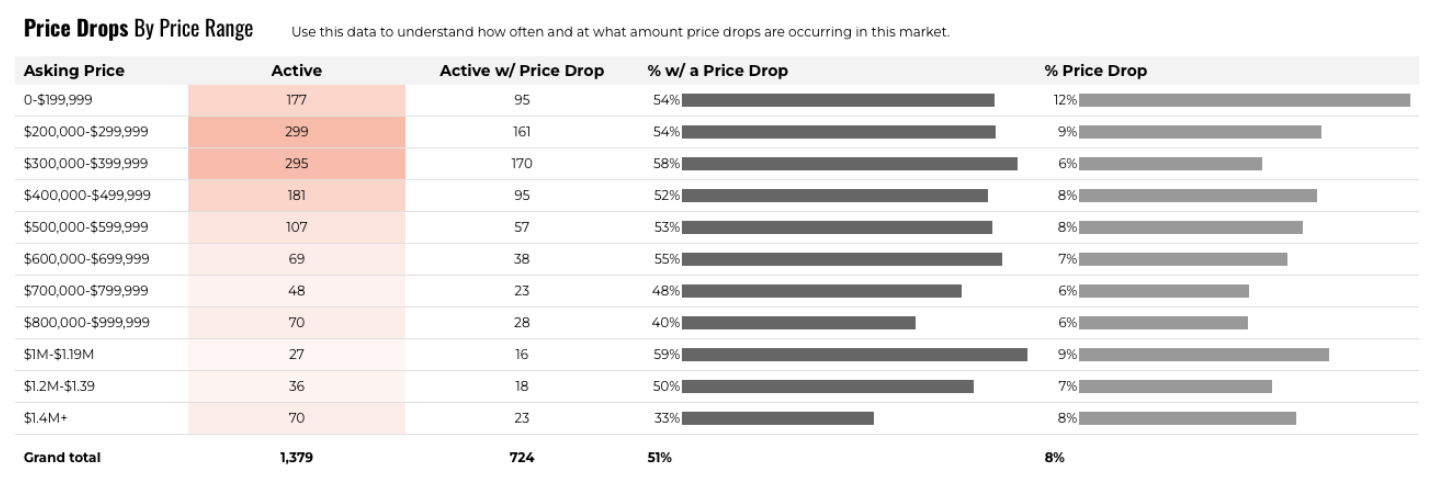
Sellers should look closely at the price range breakdown. Price drops are common at almost every price level, with 59% of listings between $1 million and $1.19 million and 58% of listings between $300,000 and $399,999 carrying a reduction. The deepest cuts are at the bottom of the market, where condos under $200,000 have dropped an average of 12% and condos between $200,000 and $299,999 have dropped 9%. Condos priced at $1.4 million and above are least likely to have a price drop (33%), followed by the $800,000 to $999,999 range (40%).
Price cuts do work, but not instantly. Unlock MLS shows that in September, condos that dropped their price went under contract a median of 37 days after the reduction. The quarterly average price drop has run between roughly 6.8% and 9.8% for the past three years, peaking at 9.79% in the fourth quarter of 2025. A seller who prices right at launch avoids both the reduction and the extra five or more weeks on the market.
2025 Full Year Austin Condo Market Recap
Austin recorded 1,813 condo and townhome sales in 2025, down 5.1% from 2024, according to Unlock MLS. The annual median sale price was $390,000, down 4.3% from the prior year, and total sales volume was $943.01 million, down 4.6%. The average price per square foot fell to $376, about $19 less than in 2024, and the median days on market rose by six days to 56. Condos sold an average of 3.6% below asking for the year.
The 2025 market followed a familiar seasonal pattern. Sales were weakest in January (113) and November (106), and strongest in May (192) and August (182). Monthly median prices peaked in March at $426,800 and bottomed out in September at $360,000, with the second half of the year running noticeably softer than the first.
Through September, 2026 is tracking slightly ahead of 2025 in sales activity but slightly behind in price. Unlock MLS shows 1,497 condo sales year to date, up 3.0% from the same period in 2025, and total volume of $763.16 million, up 0.6%. The year-to-date median sale price of $385,000 is down 2.5%, and average price per square foot of $364 is down 4.2%. In other words, more condos are selling in 2026, but at somewhat lower prices.
Months of Supply by Price Range
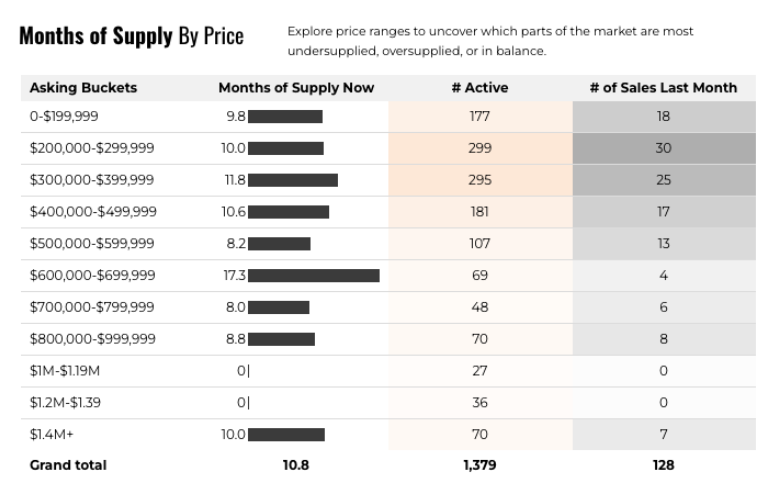
Not every part of the condo market carries the same level of buyer leverage. Unlock MLS breaks down months of supply by asking price, and the results show which price ranges are most oversupplied.
The $600,000 to $699,999 range stands out with 17.3 months of supply (69 active listings and only 4 sales last month). That makes it the most oversupplied segment of the market and the best place for buyers to negotiate. The $300,000 to $399,999 range, which has the most active listings at 295, is also heavily supplied at 11.8 months. Even the busiest segments, under $200,000 and $200,000 to $299,999, carry 9.8 and 10.0 months of supply respectively.
The tightest segments are $700,000 to $799,999 at 8.0 months and $500,000 to $599,999 at 8.2 months, though both are still firmly buyer's market territory. Between $1 million and $1.39 million there are 63 active listings and zero sales last month, so months of supply cannot be calculated. That is a clear signal that buyers in that range have significant leverage. Unlock MLS shows 10.8 months of supply overall, higher than RPR's 8.76 months because the two sources calculate the figure differently.
Condo Prices by Bedroom Count
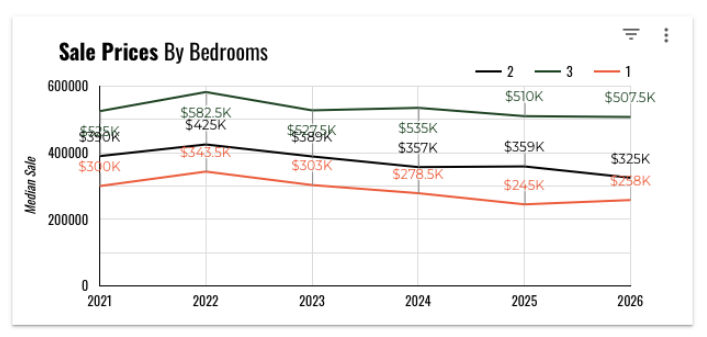
Breaking down median sale prices by bedroom count helps buyers compare condo configurations. Through 2026, the median one-bedroom condo in Austin has sold for about $258,000, the median two-bedroom for $325,000, and the median three-bedroom for $507,500, according to Unlock MLS.
The trends differ by size. One-bedroom condos are the only group showing a gain this year, up from $245,000 in 2025 to $258,000 so far in 2026, about 5%. Two-bedroom condos have dropped the most, from $359,000 in 2025 to $325,000 in 2026, a decline of about 9.5%. Three-bedroom condos are essentially flat, at $507,500 compared to $510,000 last year.
All three sizes remain well below their 2022 peaks. One-bedroom medians are down about 25% from $343,500, two-bedroom medians are down about 24% from $425,000, and three-bedroom medians are down about 13% from $582,500. If you are shopping for a two-bedroom condo, today's prices are the lowest since at least 2021, and the gap between a two-bedroom and a one-bedroom is only about $67,000.
Why the Average Condo Price Runs $146,000 Above the Median
In September, the average condo sale price in Austin was $495,527 according to Unlock MLS, while the median was $348,990. That is a gap of about $146,500. ABoR MLS shows a similar spread, with an average close price of $491,024 and a median of $350,120.
The gap exists because a relatively small number of high-priced sales pull the average up. In September, 18 condos sold for $800,000 or more, including seven above $1.4 million and one at $2,875,000. Those sales have a big effect on the average but very little effect on the median.
For most buyers and sellers, the median is the better number to follow. It shows what a typical Austin condo sold for. If you see a headline quoting the average condo price near $500,000, keep in mind that more than half of the condos sold in September closed for less than $350,000.
Where Austin Condo Prices Stand Against the 2022 Peak
Looking at a decade of Unlock MLS data puts the current market in perspective. The median Austin condo sold for $265,000 in 2016 and climbed every year to a peak of $458,000 in 2022. Since then, the annual median has declined each year: $422,000 in 2023, $407,400 in 2024, $390,000 in 2025, and about $385,000 so far in 2026.
That means the typical Austin condo is about 16% below its 2022 peak, but still roughly 45% above where prices were in 2016. Average price per square foot has fallen further, from $454 in 2022 to $364 in 2026, a decline of about 20%. Buyers today are getting more space for their money than at any time since 2020.
Sales volume tells a similar story. Austin recorded 3,931 condo sales in 2021, the high point of the decade. Sales fell to 1,974 in 2023 and 1,813 in 2025. With 1,497 sales through early October, 2026 is on pace to finish slightly ahead of 2025, which would be the first annual increase in sales since 2021. The pace of price declines has also slowed each year, from an 8% drop in 2023 to about 1% to 2% so far in 2026, which suggests the market may be close to finding its floor.
Market Summary and Outlook
September was a slow month for the Austin condo market. Sales, pending contracts, and total volume all fell sharply from August, and the median sold price slipped 4.1% to $358,025. At the same time, the sold to list price ratio held steady at 96.5%, and days on market stayed under 60. The market slowed, but it did not break down.
Year-over-year comparisons are mixed. Prices are slightly lower than last September, with the median sold price down 1.2% and the median list price down 6.0%. But condos are selling much faster than they were a year ago (59 days versus 87), inventory is down 12.4%, and months of supply has fallen 9.8%. Year to date, sales are up 3.0% from 2025.
The key variable for the coming months is whether buyer activity rebounds. RPR shows pending contracts at their lowest level in two years, while Unlock MLS shows contract activity up from last September. If pendings stay low, expect sales to remain in the 100 to 140 range through the holidays and prices to stay soft. If they recover, the market could end the year on steadier footing.
Over the longer term, the Austin condo market has been adjusting since its 2022 peak, and that adjustment appears to be slowing. Prices have fallen about 16% from the peak, sales are stabilizing, and new listings are declining. Austin's job market and population growth continue to support long-term demand, especially for condos near downtown, the Domain, and major employers.
Time to Buy? Time to Sell?
For buyers, conditions are favorable. With 8.76 months of supply, more than half of active listings carrying a price cut, and prices about 16% below their 2022 peak, you have time and leverage. Interest rates and your own financial situation still matter most, but if you are ready, the fall and winter months typically bring the least competition and the most motivated sellers.
For sellers, the market rewards accurate pricing. Condos that are priced correctly at launch are selling for about 96.5% of list in under two months. Condos that are overpriced are taking cuts averaging 8% and spending more than five additional weeks on the market. If you need to sell this fall, price competitively against the active listings in your building and price range.
If you can wait, watch the next 60 to 90 days closely. Spring is historically the busiest season for Austin condos, with new pendings and sales typically climbing from February through May. If inventory continues to decline and pending activity recovers, listing in early spring 2027 could put you in front of more buyers with less competition than sellers faced this year.
Action Items for Buyers
- Get pre-approved now so you can make a strong offer when the right condo comes along, since fewer buyers are active this fall and a ready buyer has more negotiating power.
- Target listings that have been on the market for 45 days or more, because the median condo takes its first price cut just 18 days after listing and longer-listed sellers are often the most flexible.
- Ask for the price history on every condo you consider, since 53% of active listings have already dropped their price by an average of 8%.
- Look closely at the $600,000 to $699,999 and $1 million to $1.39 million ranges, where months of supply is the highest and sellers have the fewest buyers.
- Compare price per square foot rather than total price when evaluating condos of different sizes, using the September median of $308 per square foot as a benchmark.
- Review HOA budgets, reserve studies, and special assessment history before making an offer, because those costs affect your monthly payment and long-term value as much as the purchase price.
Action Items for Sellers
- Price your condo against current active listings in your building and price range, not against what sold in the spring, since the median list price has fallen to $375,000, down 6.0% from last year.
- Launch at a competitive price to avoid the average 8% price cut that 56% of September's sold condos had to take before closing.
- Prepare your condo before listing with fresh paint, repairs, and professional photos, because buyers can compare your unit to roughly 1,390 other active listings.
- Have your HOA documents, budget, and recent meeting minutes ready on day one so buyers and lenders can move quickly.
- Plan for a timeline of two to three months, since the median condo took 58 to 59 days to sell in September and days on market typically rise in the fourth quarter.
- Consider offering buyer incentives such as closing cost help or a rate buydown, which can attract buyers in a market where condos sell an average of 3.58% below asking.
Final Word on the Austin Condo Market
The Austin condo market in September 2026 rewards buyers who are prepared and sellers who are realistic. Buyers have more choices and more negotiating room than at any point in recent years, while sellers who price correctly are still finding buyers at about 96.5% of their list price.
Taken together, the numbers describe a market that slowed in late summer but is not in freefall. Prices are slightly lower than a year ago, inventory is shrinking, condos are selling faster than last fall, and year-to-date sales are running ahead of 2025. The long correction from the 2022 peak appears to be leveling off.
Whether you are buying or selling, the right move depends on your goals, your timeline, and your finances. Make the decision that fits your life, and talk with an experienced Austin condo agent who can walk you through the numbers for your specific building and price range.
Questions About the September 2026 Austin Condo Price Report?
Have questions about what the September 2026 Austin Condo Price Report means for your specific situation? We are happy to help. If you are thinking about buying a condo in Austin, our Buyers page has resources to help you understand the process and get started. If you are thinking about selling, our Sellers page walks through what to expect in today's market. You can also find our full collection of monthly reports on our Austin Real Estate Price Report page.
Reach out to Rebecca Jacks and the team at Eleven Oaks Realty. Call or text (512) 827-8323 or email info@11OaksRealty.com. We have been helping buyers and sellers since 1978 and we are here to help you make the best decision for your situation, whatever that looks like.
Data sources: Realtors Property Resource (RPR), Austin Board of REALTORS MLS, Unlock MLS. All figures are for condominiums and townhomes in the City of Austin. Reported figures reflect September 1, 2026 through September 30, 2026. Some variation between data sources may exist due to differing methodology and timing of data pulls.




Leave a Reply