
Stand in a model home in one of Austin’s newer master planned communities and ask the sales representative if the price on the sign is negotiable, and you will usually hear some version of the same answer. The price is the price. Incentives are available, but the number itself does not move.
The closed sales tell a different story. Across 25 Austin area neighborhoods covering 1,807 closed sales over the past twelve months, the typical home sold roughly $73,000 below the price it was originally listed at. Not the price it went under contract at. The very first number the seller asked.
Every figure in this post comes from closed sales recorded in Unlock MLS between September 1, 2025 and August 31, 2026, not from active listings, asking prices, or general advice.
What we looked at, and why closed sales tell a different story
This analysis covers 19,809 closed single family sales across 1,244 named neighborhoods in 25 Austin area areas over one full year. Two ratios do the work throughout this post, and it is worth defining both plainly because MLS shorthand blurs the difference that matters most.
Close to final list price is what a home sold for compared to the price it was carrying on the day it went under contract. Close to original list price is what it sold for compared to the very first price the seller asked when the home hit the market.
The gap between those two numbers is the whole story. A home can close at 99 percent of its final list price and still have sold for 87 percent of what it originally asked, if the price was cut two or three times along the way before that final contract. The first number looks like a strong, competitive market. The second number is what the buyer actually saved.
Across all 464 Austin area neighborhoods with 10 or more closed sales in this window, the sales weighted median was 97.7 percent of final list price but only 94.4 percent of original list price. That three point gap, repeated across nearly 500 neighborhoods, is the credibility foundation for everything that follows, and it is not something a page built on active listing counts can show you.
Translated into dollars, that 94.4 percent baseline means a home first listed at $600,000 has been closing, on a typical basis, around $566,400. That is roughly $33,600 of movement in the metro-wide average alone, before you even look at whether the specific neighborhood you are shopping falls above or below that baseline.
This matters most if you are choosing between two similar new communities and the sales representative in each one is telling you the price is firm. Closed sale history is the one thing that tells you which of those two firm prices actually has room behind it, and it is public record, not a guess or a negotiating tactic on your side.
The 25 neighborhoods where the gap is widest
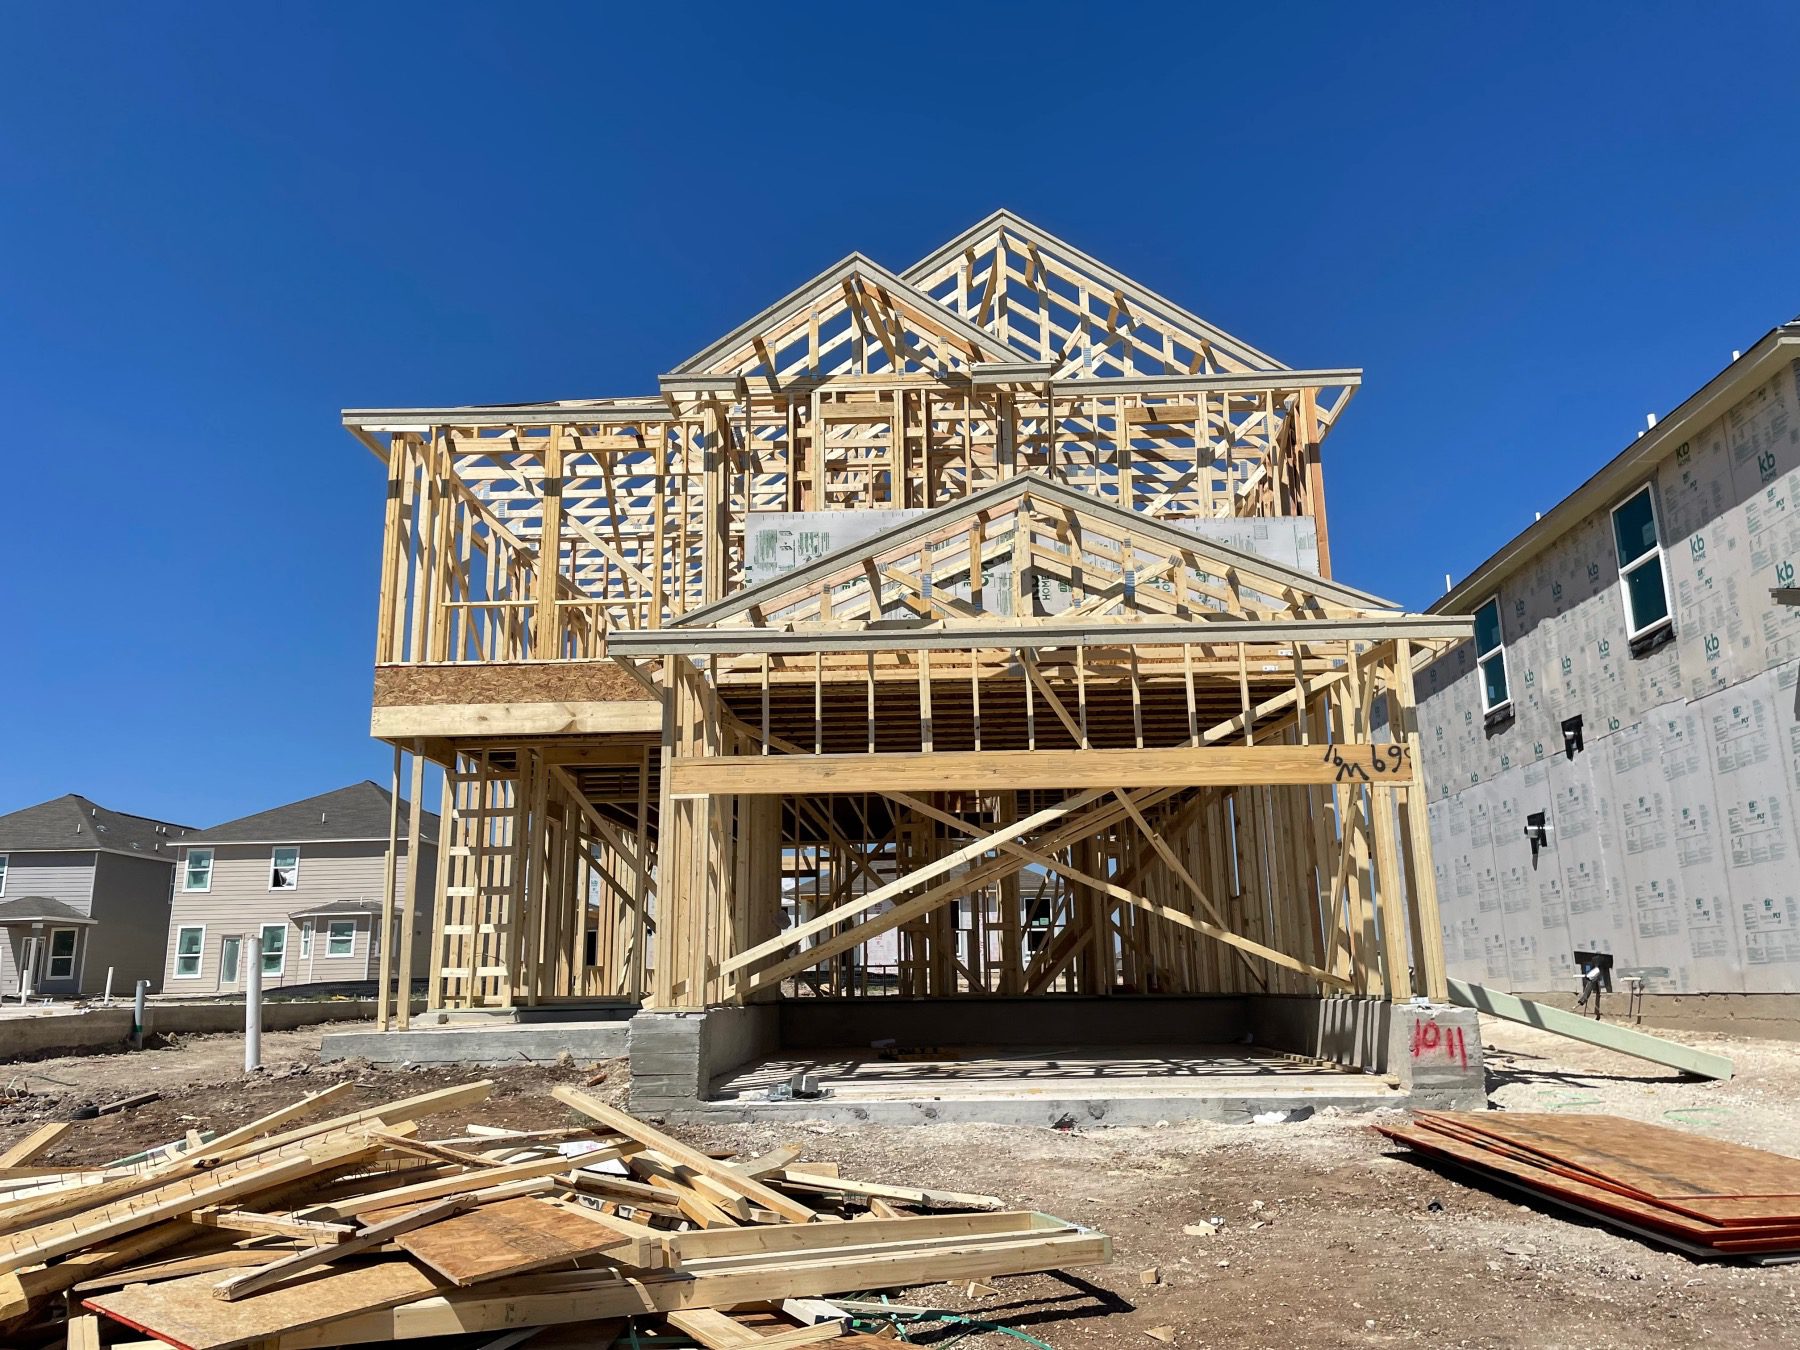
To find where sellers have actually cut prices rather than simply priced correctly from day one, we filtered the 464 qualifying neighborhoods for a specific combination. Homes closing at 95 percent or more of their final asking price, but 90 percent or less of their original asking price. That pairing is the fingerprint of a price that got cut, then met. The home was not sitting unsold. It sold close to what it was asking most recently. It just was not asking what it started at.
Twenty five neighborhoods matched that filter, representing 1,807 closed sales. The full list, sorted from the widest gap to the narrowest, is below.
| Neighborhood | Area | Closed sales | Pct of original list | Median DOM | Median close price |
|---|---|---|---|---|---|
| Lakeside at Tessera | Lago Vista | 44 | 81% | 228 | $449,900 |
| Parkside Peninsula | Georgetown | 25 | 85% | 99 | $559,990 |
| Palmera Ridge | Leander | 70 | 86% | 184 | $777,500 |
| Retreat at San Gabriel | Georgetown | 25 | 86% | 117 | $534,990 |
| Cotton Brook | Hutto | 94 | 87% | 71 | $349,995 |
| Edgewood | Leander | 43 | 87% | 117 | $632,000 |
| Heights at San Gabriel | Georgetown | 26 | 88% | 181 | $399,990 |
| Parkside on the River | Georgetown | 205 | 88% | 113 | $624,000 |
| 6 Creeks | Kyle | 168 | 88% | 122 | $498,500 |
| Carneros Ranch | Leander | 24 | 88% | 97 | $666,500 |
| Tuscan Village | Lakeway | 12 | 88.5% | 112 | $515,000 |
| North Cat Mountain | Northwest Austin | 13 | 89% | 71 | $1,010,000 |
| Santa Rita Ranch | Liberty Hill | 448 | 89% | 98 | $549,900 |
| Travisso | Leander | 124 | 89% | 93 | $872,500 |
| Hawkes Landing | Leander | 29 | 89% | 72 | $589,990 |
| Hillcrest | Southwest Austin | 10 | 89% | 55 | $402,500 |
| Crossing at Onion Creek | Southeast Austin | 25 | 89% | 53 | $335,000 |
| Barksdale | Leander | 33 | 89% | 82 | $680,000 |
| La Ventana | Driftwood | 20 | 89.5% | 97 | $1,205,000 |
| Crosswinds | Kyle | 102 | 90% | 100 | $359,450 |
| Parmer Ranch | Georgetown | 75 | 90% | 122 | $514,900 |
| Crescent Bluff | Georgetown | 25 | 90% | 129 | $489,055 |
| Heritage | Dripping Springs | 97 | 90% | 74 | $452,313 |
| Bouldin Creek | South Austin | 58 | 90% | 33 | $1,148,500 |
| Carpenter Hill | Buda | 12 | 90% | 95 | $562,000 |
Lakeside at Tessera in Lago Vista sits at the extreme end. Forty four closed sales, a median 228 days on market, and homes closing at 81 percent of what they were originally asked. On a home first listed near $555,000, that works out to a median close price of $449,900.
Santa Rita Ranch in Liberty Hill tells a different version of the same story. With 448 closed sales, it is the second busiest neighborhood in the entire metro area, and it still closed at 89 percent of original list after a median of 98 days on market. Volume and a meaningful price cut are showing up together in the same community.
The honest caveat, because five of these are not builder communities
Five entries on that list are established resale neighborhoods, not master planned builder communities, and calling that out plainly is exactly what separates a data driven post from a marketing page.
Bouldin Creek in South Austin closed 58 sales at 90 percent of original list. North Cat Mountain in Northwest Austin closed 13 sales at 89 percent. La Ventana in Driftwood closed 20 sales at 89.5 percent. Hillcrest in Southwest Austin closed 10 sales at 89 percent. Tuscan Village in Lakeway closed 12 sales at 88.5 percent. None of these five is a new construction community.
What that tells us is useful for any buyer, not just one shopping new builds. The same statistical fingerprint, a price that closes near its most recent ask but well below its first ask, shows up whenever a seller starts high and comes down, whether that seller is a national builder or a homeowner who priced on hope. In Bouldin Creek, the median close was $1,148,500 after only 33 days on market, which tells you the homes were not sitting unloved. They were simply launched above what the market would pay and corrected quickly.
The lesson is not that builders are uniquely soft on price. The lesson is that any seller who has already cut once has told you something true about their pricing, and the data lets you see who those sellers are before you ever write an offer. That still leaves 20 of the 25 neighborhoods on this list as active new construction communities, which is the majority and the reason this post exists. Correcting for the handful of legacy resale neighborhoods that happen to share the same statistical fingerprint does not change the underlying story. Most of this list is builders.
Where this is happening on the map
Georgetown and Leander tie for the most affected neighborhoods, with 6 each. Kyle has 2. Every other area on the list has 1.
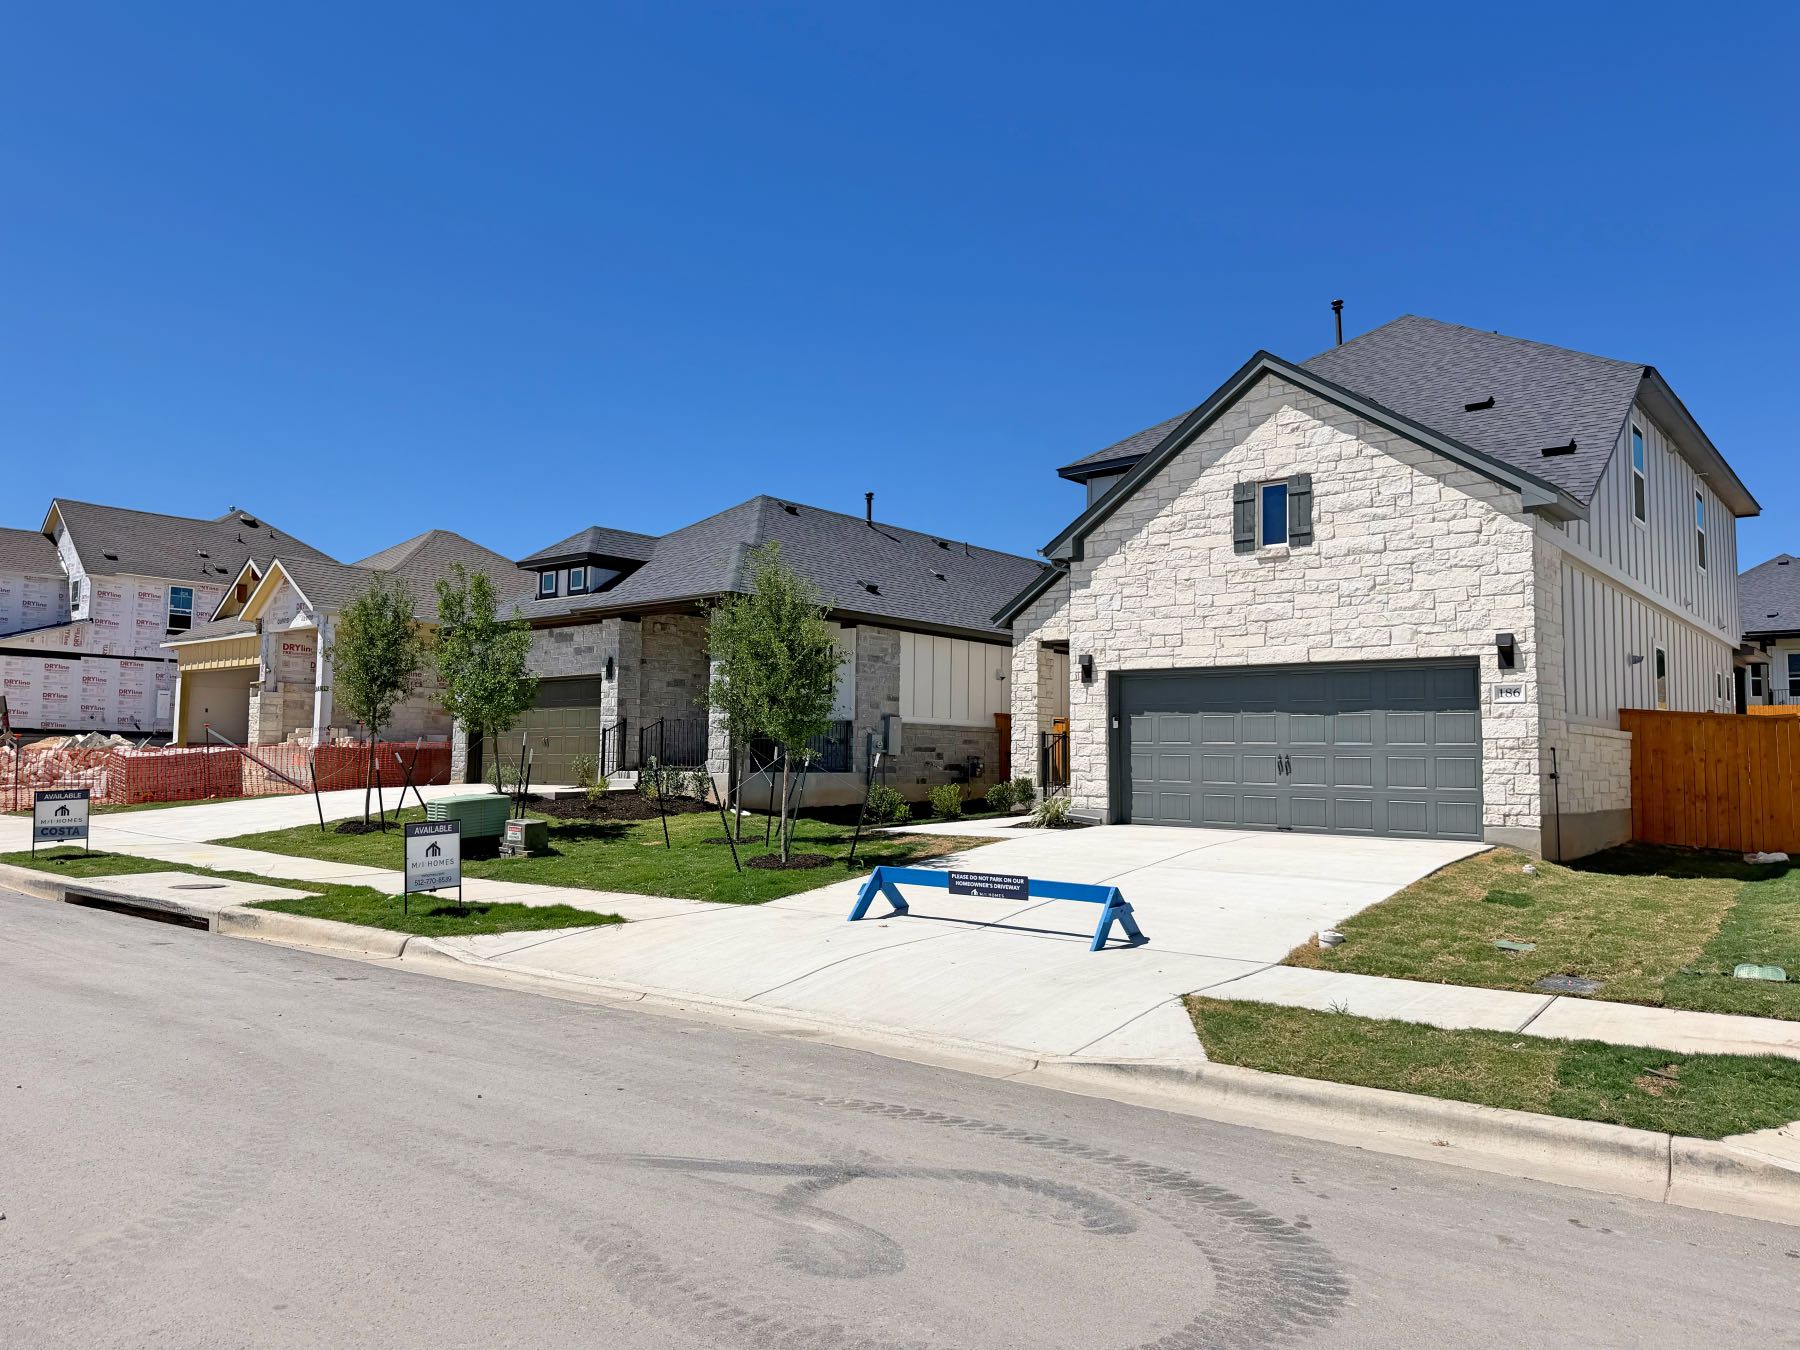
Kyle's two are 6 Creeks, with 168 closed sales at 88 percent of original list, and Crosswinds, with 102 closed sales at 90 percent. Between them that is 270 closed sales showing the same pattern in a single suburb, which makes Kyle a meaningful part of this story rather than a footnote.
In Georgetown, the six are Parkside on the River, Parkside Peninsula, Retreat at San Gabriel, Heights at San Gabriel, Parmer Ranch, and Crescent Bluff. These are concentrated in the newer growth corridor rather than in established Georgetown neighborhoods.
In Leander, the six are Palmera Ridge, Edgewood, Carneros Ranch, Travisso, Hawkes Landing, and Barksdale.
Here is the breakout for both areas side by side.
| Area | Neighborhood | Closed sales | Pct of original list | Median DOM |
|---|---|---|---|---|
| Georgetown | Parkside on the River | 205 | 88% | 113 |
| Georgetown | Parkside Peninsula | 25 | 85% | 99 |
| Georgetown | Retreat at San Gabriel | 25 | 86% | 117 |
| Georgetown | Heights at San Gabriel | 26 | 88% | 181 |
| Georgetown | Parmer Ranch | 75 | 90% | 122 |
| Georgetown | Crescent Bluff | 25 | 90% | 129 |
| Leander | Palmera Ridge | 70 | 86% | 184 |
| Leander | Edgewood | 43 | 87% | 117 |
| Leander | Carneros Ranch | 24 | 88% | 97 |
| Leander | Travisso | 124 | 89% | 93 |
| Leander | Hawkes Landing | 29 | 89% | 72 |
| Leander | Barksdale | 33 | 89% | 82 |
Look at the two area totals side by side and a small difference shows up. Georgetown's six neighborhoods lean toward higher closed sales counts and a wider spread of days on market, from 99 days up to 181. Leander's six lean toward a narrower band, mostly in the 72 to 184 day range, but with fewer total closings in most of its listed communities. Neither area is uniformly slower or faster than the other. Each has at least one neighborhood pricing well ahead of what buyers were willing to pay.
The more useful half of this map, for a buyer deciding where to shop, is where this pattern is essentially absent. Across the same 464 neighborhoods, 142 of them, representing 4,329 closed sales, sold at 96 percent or more of their original asking price in 30 days or less, with a median close price of $507,250. Those are Austin area neighborhoods where the first price and the sold price are close to the same number, and buyers who wait for a builder to soften are more likely to lose the house than get a discount.
Why builders would rather give you a rate buydown than cut the price
If the closed sale data shows this much movement, it is worth asking why a builder's posted price so rarely looks negotiable in the model home. The answer is protecting the headline number.
A visible price cut on one home re-prices every other unsold home in that same community at the same time. It also tends to anger the buyers who already closed at the higher number, since resale value and reputation both take a hit when a neighbor's home appears to have sold for less a few weeks later. A builder has strong reasons to avoid that outcome if there is any other way to move a home.
What builders do instead is offer rate buydowns, closing cost credits, and design center allowances. Those incentives protect the number on the sign while still making the deal work for a buyer who is on the fence. A rate buydown in particular can be modeled internally to cost the builder less per home than an equivalent price cut would, while still moving a buyer's monthly payment enough to close the deal, which is a big part of why it is usually the first tool offered rather than the last.
Incentives are the first line of defense. What this data shows is what happens when incentives alone are not enough to move the home. The price comes down anyway, and in these 25 communities it came down a median of roughly $73,000.
For a buyer, that order of operations is useful information on its own. If a community is already offering a rate buydown or closing cost credit on top of its posted price, that is the builder signaling flexibility before you have asked for anything. It does not automatically mean the price itself will move too, but paired with a slow days on market number for that community, it is worth asking your buyer's agent to find out directly rather than assuming the sign price is final.
Our August 13, 2026 post breaks down how builder rate buydowns and closing cost credits actually work in more detail, including when an incentive is worth more to you than a lower price and when it is not. For the broader tradeoffs between buying new and buying resale, see our guide to buying new construction in the Austin area.

What a buyer should actually do with this
Knowing that the list price moves is only useful if you know what to check before you write an offer, and every one of the checks below is something your own buyer's agent can run on your behalf, usually in a single afternoon. Here are five concrete steps.
- Ask your buyer's agent for the original list price of the home you are looking at, and the date it was first listed. This is public record in the MLS and takes only a few minutes to pull.
- Ask your buyer's agent what the last three closings in the community actually sold for, not what is currently listed. Active list prices tell you what the builder hopes for. Closed prices tell you what buyers actually agreed to pay.
- Watch days on market at the community level, not the home level. A community sitting at a median of 100 or more days has a different negotiating posture than one clearing in three weeks. For a data-backed way to calibrate exactly how much below asking to offer based on days on market, see What 19,809 Austin Home Sales Say About When to Offer Below Asking.
- Ask your buyer's agent about standing or finished spec inventory specifically. A finished home carrying a monthly cost for the builder is a different conversation than a home that has not been started yet.
- Bring your own representation before you register at the model home, not after. Registration timing can affect how your agent is recognized later in the transaction, and a buyer's agent who is already involved can ask these four questions on your behalf from the first visit.
If you want a fuller explanation of why registration timing matters, our guide to using your own agent on new construction walks through it in detail.
One more group should be paying attention to this data: resale sellers inside these same 25 communities. If you are selling a three year old home in a community where the builder down the street is still cutting prices on new inventory, you are competing with new construction whether you intend to or not, and a buyer touring both will notice the gap immediately. Price accordingly, or be prepared to wait out the incentive cycle until the builder sells through its remaining inventory.
Frequently asked questions
Rarely on the posted price itself, at least not upfront. Builders generally prefer incentives like rate buydowns and closing cost credits over a visible price cut. But the closed sale data shows that in at least 25 Austin area neighborhoods, the original asking price has still come down by a median of roughly $73,000 once incentives alone were not enough.
It varies widely by community. Across 464 Austin area neighborhoods with enough sales to measure reliably, the sales weighted median was 94.4 percent of original asking price. In the 25 neighborhoods with the widest gaps, homes closed at 81 to 90 percent of their original asking price.
Georgetown and Leander have the most affected neighborhoods in this dataset, with 6 each, followed by Kyle with 2. Lago Vista has the single widest gap of any neighborhood measured, at Lakeside at Tessera.
It depends on your own numbers. A rate buydown lowers your monthly payment for a set period without changing the purchase price, while a price reduction lowers what you owe and finance from day one. Our companion post on builder rate buydowns and closing cost credits walks through how to compare the two for your specific loan.
Usually a combination of pricing above what the current market will pay and normal seasonal demand shifts. Several of the neighborhoods in this analysis carried a median days on market well above 100, and those same neighborhoods also carried the widest gaps between original and closed price.
Yes. Builders welcome buyer's agents, and using one costs you nothing extra since the builder typically pays the commission. The key is bringing your agent with you before you register at the model home, not after.
It can affect how those homes appraise for resale in the near term, which is exactly why builders try to avoid visible cuts and lean on incentives instead. It is also why buyers who already closed in a community sometimes feel frustrated when a neighbor's home closes for less a few months later.
Ask your buyer's agent to pull the full MLS listing history for the home, which shows the original list price and every price change since. This is standard information any licensed agent can access in minutes.
Closing and call to action
The asking price in a new Austin area community is a starting position, not a fixed number. The closed sale record from September 1, 2025 through August 31, 2026 shows how far that starting position has already moved before you ever walk into the model home, and it will keep moving as the market does.
Talk to a Specialist before you write an offer on new construction in any of the areas covered here. Send us the community you are considering and we will pull its original list prices, its recent closing history, and its current days on market, so your first offer is grounded in the same data behind this post rather than a guess.
Ready to price your next new construction offer with real data?




Leave a Reply