
Eleven Oaks Realty is proud to present their October 2026 Austin Multi Family Real Estate Price Report measuring activity in the Austin multi family market. This report includes all multi family properties (duplex, triplex and quadplex) that sold in October 2026.
October was a quiet month for Austin multi family. Only 15 properties closed, down from 21 in September, and the median sold price slipped 5% to $475,000. The bigger story is on the contract side: just 9 new pending sales were recorded, the lowest count in two years, while inventory pushed up to 9 months of supply. With a market this small, a handful of transactions can swing the numbers sharply, so read the percentages below with that in mind.
All data below covers multi family residential properties (duplex, triplex, and quadplex) in the city of Austin. Data is sourced from Realtors Property Resource (RPR) and the Austin Board of REALTORS MLS. Some metrics may vary slightly between sources due to differing methodology; where differences exist, they are noted.
The Austin Multi Family Market is a Buyer’s Market
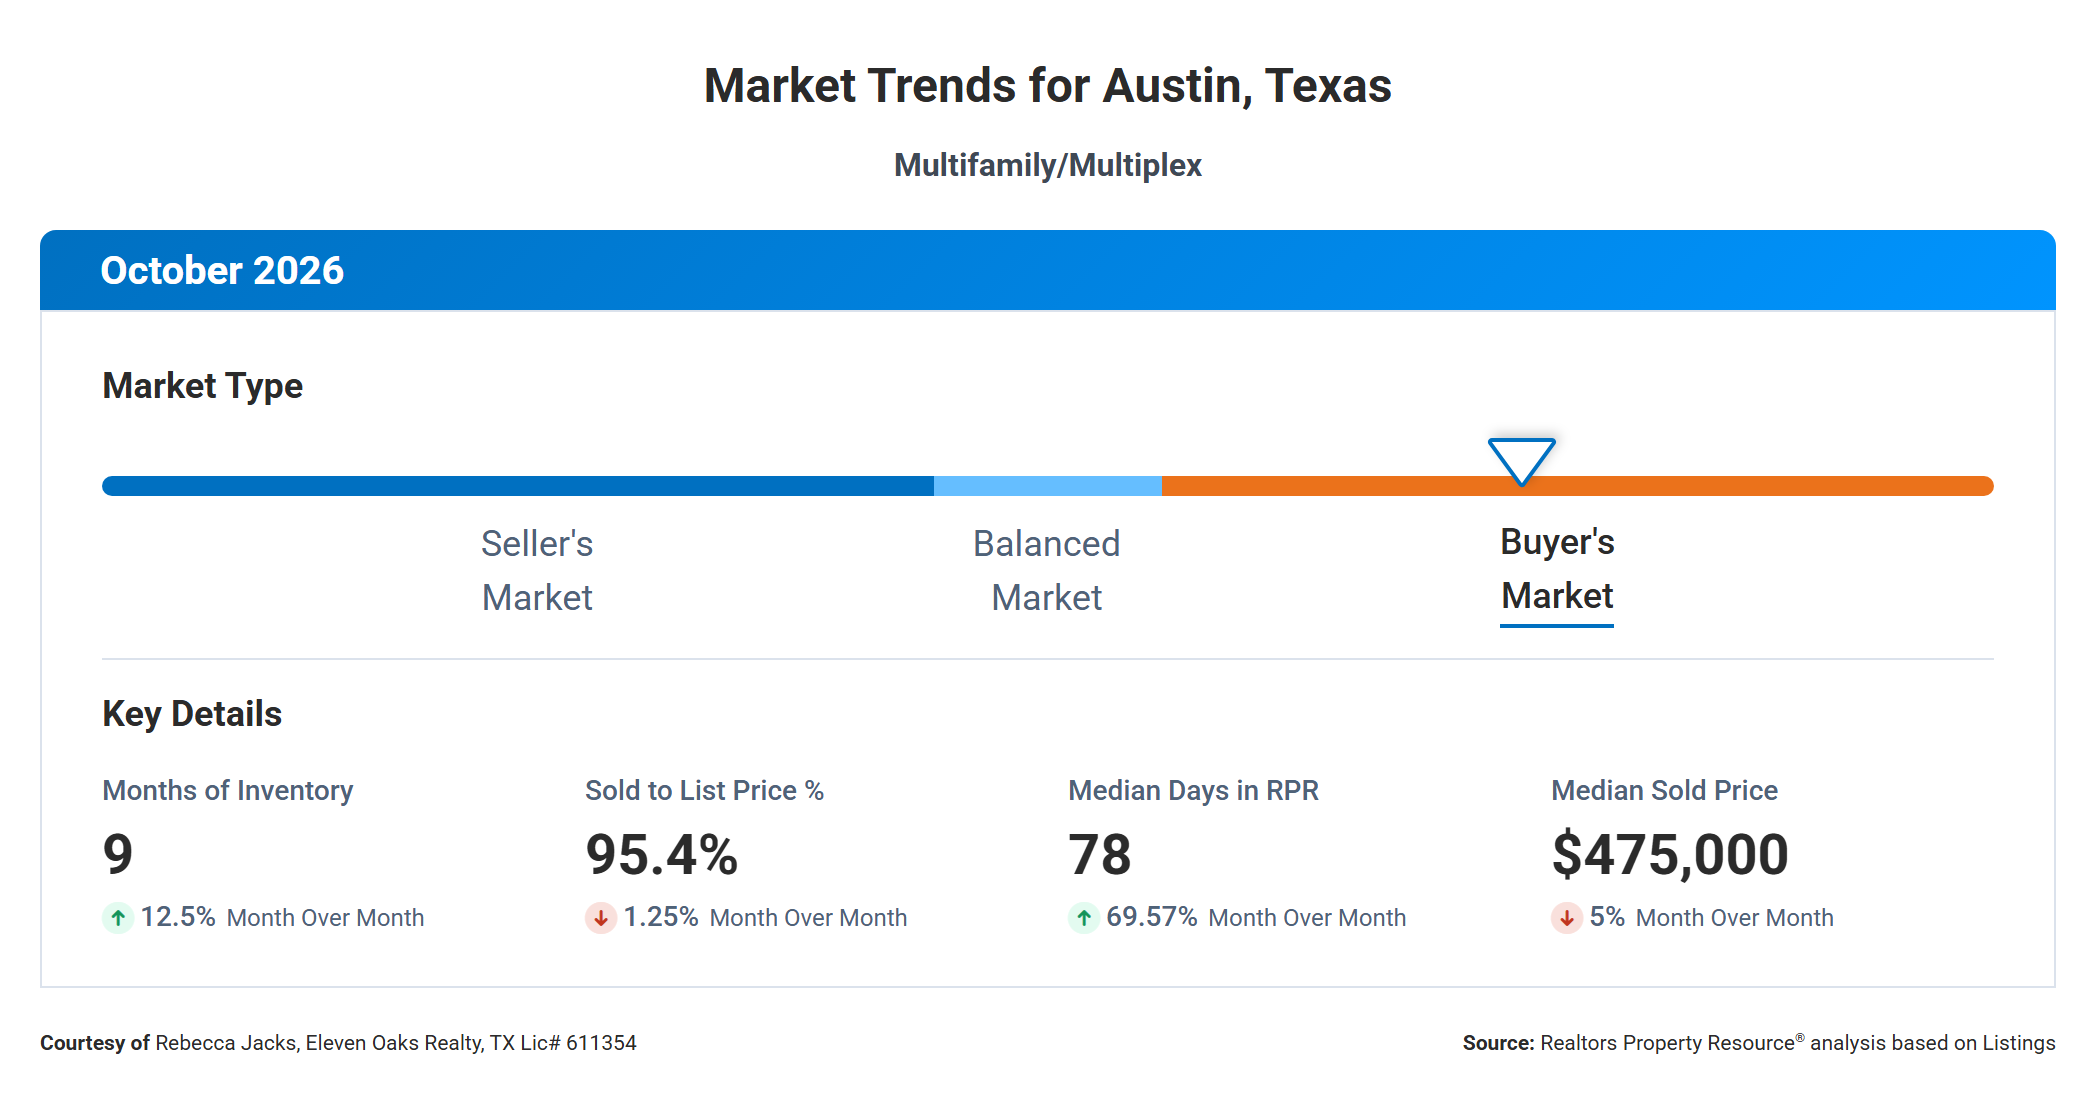
RPR rates the Austin multi family market as a buyer’s market for October 2026, and the gauge sits well into buyer territory. Months of inventory climbed 12.5% from September to 9 months. Anything above roughly 6 months tilts the advantage toward buyers, so at 9 months you have more choices and more room to negotiate than sellers would like.
The other three dashboard metrics point the same direction. Sold to list price eased 1.25% to 95.4%, meaning the typical buyer paid about 4.6% below the final asking price. Median days in RPR jumped 69.57% to 78 days, and the median sold price fell 5% to $475,000. Fewer sales, longer marketing times, and softer prices in the same month is a consistent buyer’s market signal.
Keep in mind that the multi family market is far thinner than the single family market. Fifteen closings is a small sample, and one or two unusual sales can move a monthly figure more than you would expect. Taken together, though, these signals say buyers currently hold the stronger hand, and sellers need sharp pricing and patience.
Median Sold Price Down 12% Year Over Year
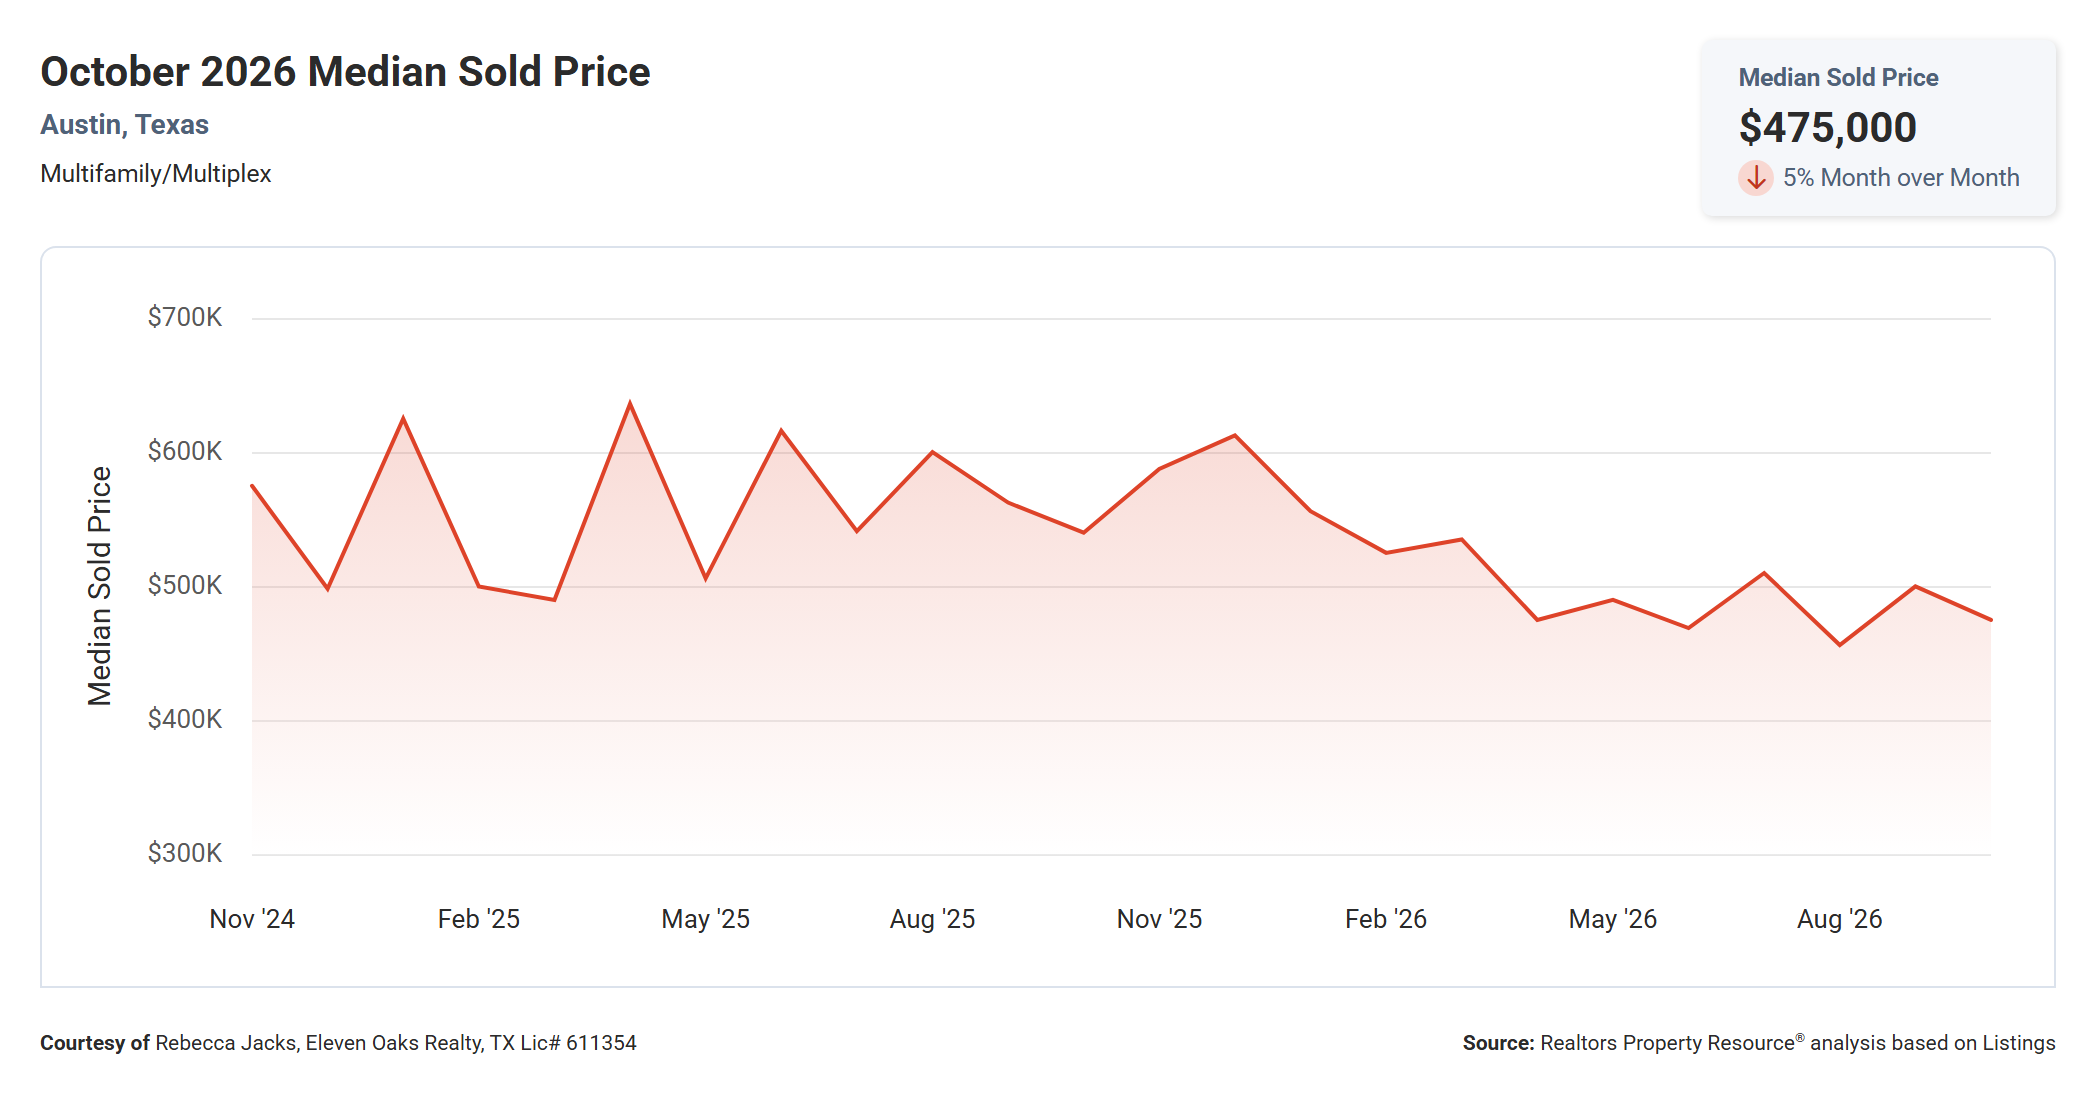
The median sold price for Austin multi family properties was $475,000 in October 2026, down 5% from $500,000 in September and down 12% from $540,000 in October 2025.
Over the two-year chart, prices show a clear downward drift. Throughout 2025 the median regularly reached the $600,000 range, with peaks above $630,000 in spring 2025. Since spring 2026 the median has mostly stayed between about $455,000 and $510,000, so October’s $475,000 sits in the middle of the new, lower range rather than setting a fresh low.
For buyers, a 12% year-over-year decline means a property that would have cost about $540,000 a year ago now trades closer to $475,000, a difference of roughly $65,000. That gap matters for investors because it lowers the cost basis and can improve the math on rental returns. For sellers, the chart is a reminder that 2025 pricing is no longer the benchmark. Watch whether the median can hold above $450,000 over the next few months; a break below that level would confirm further softening.
Number of Sold Properties Down 6.3% Year Over Year
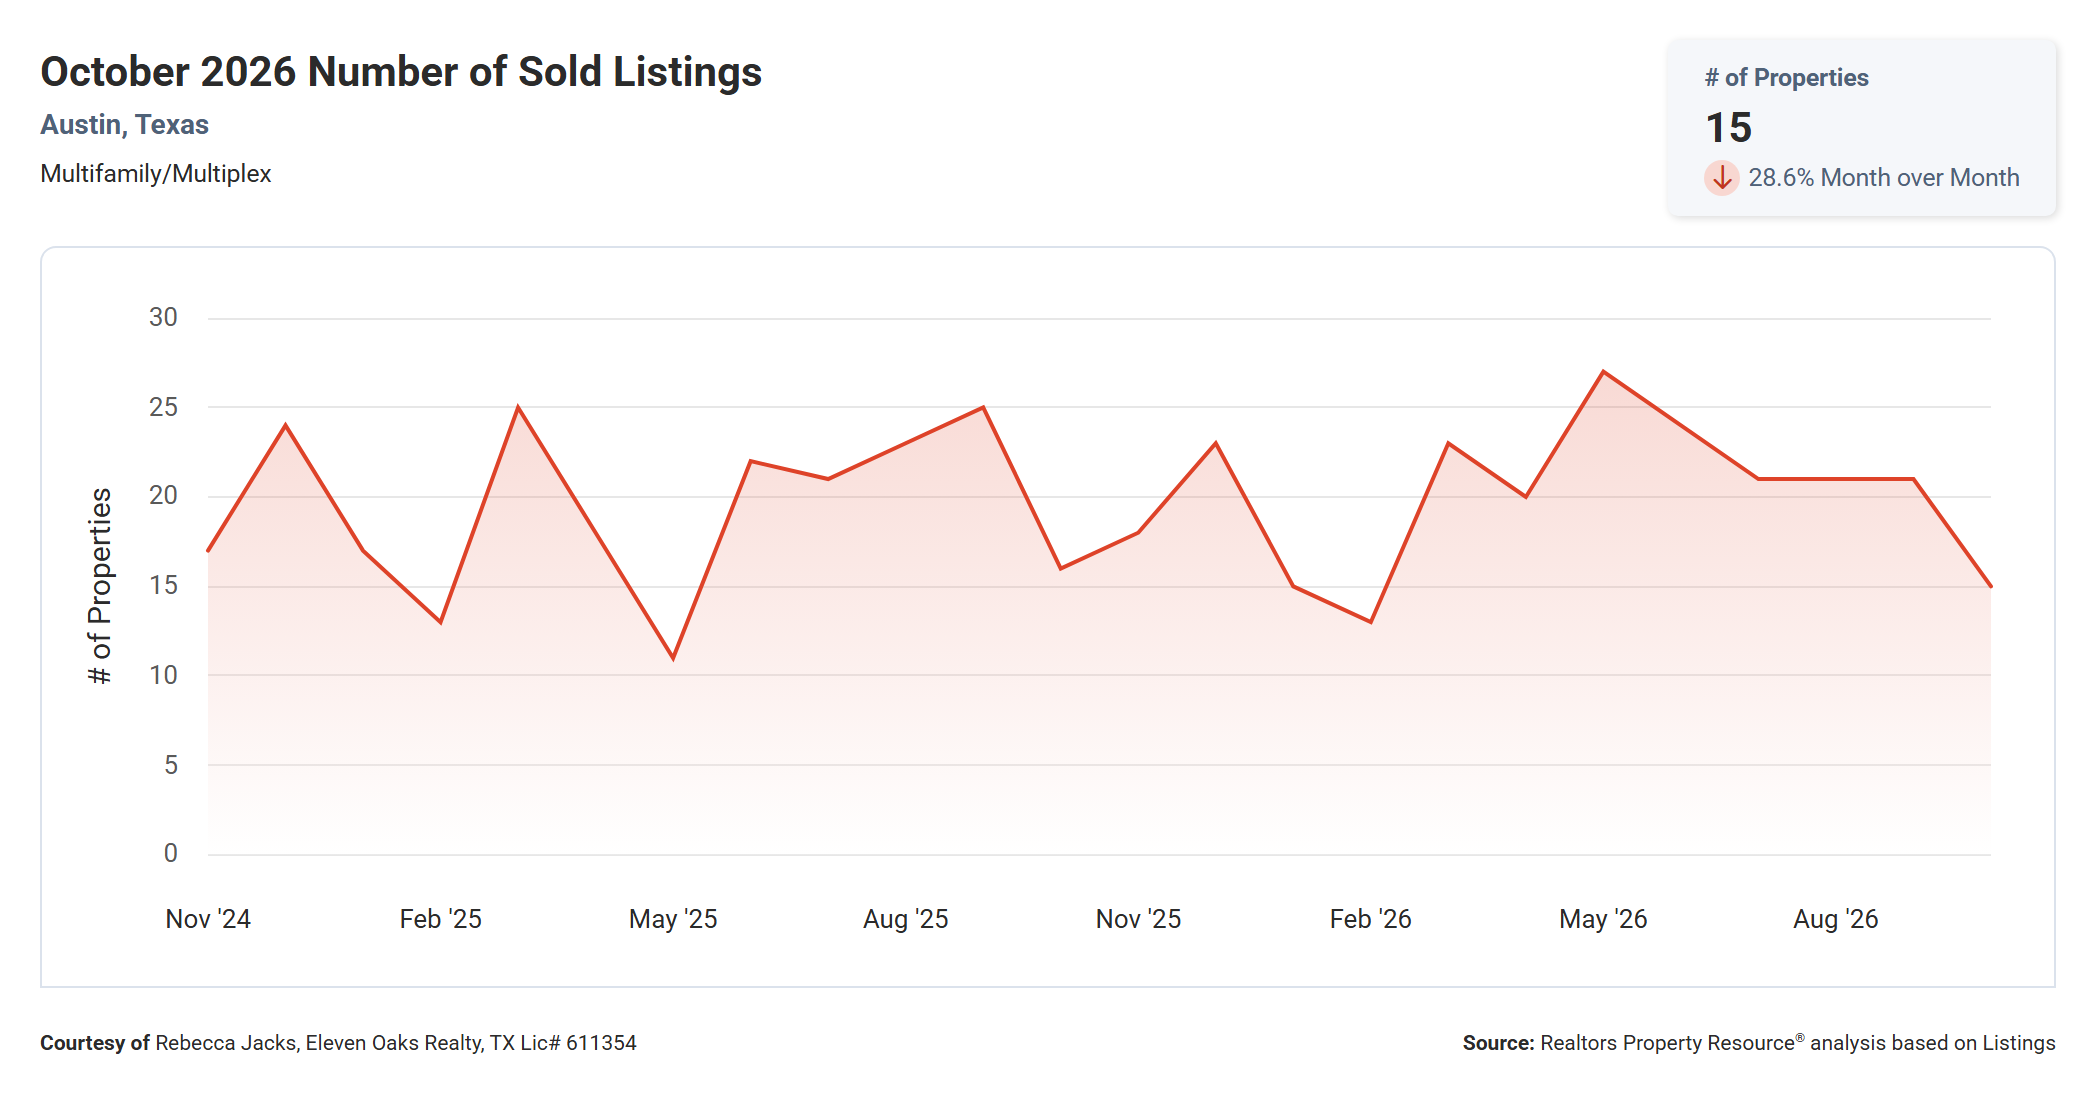
Fifteen multi family properties sold in Austin in October 2026, down 28.6% from 21 in September and down 6.3% from 16 in October 2025.
Sales have bounced between roughly 11 and 27 per month over the past two years. The high point was about 27 closings in May 2026, and the summer held steady at about 21 per month before October’s drop. The year-over-year comparison is close (15 versus 16), which suggests October’s slowdown is partly seasonal rather than a sudden collapse in demand.
For sellers, fewer closings means fewer fresh comparable sales to support a price, so appraisals and buyer offers may lean on older data. For buyers, a slower closing pace often means sellers who have been on the market for a while are more open to negotiating.
Average Sold to List Price Up Slightly Year Over Year
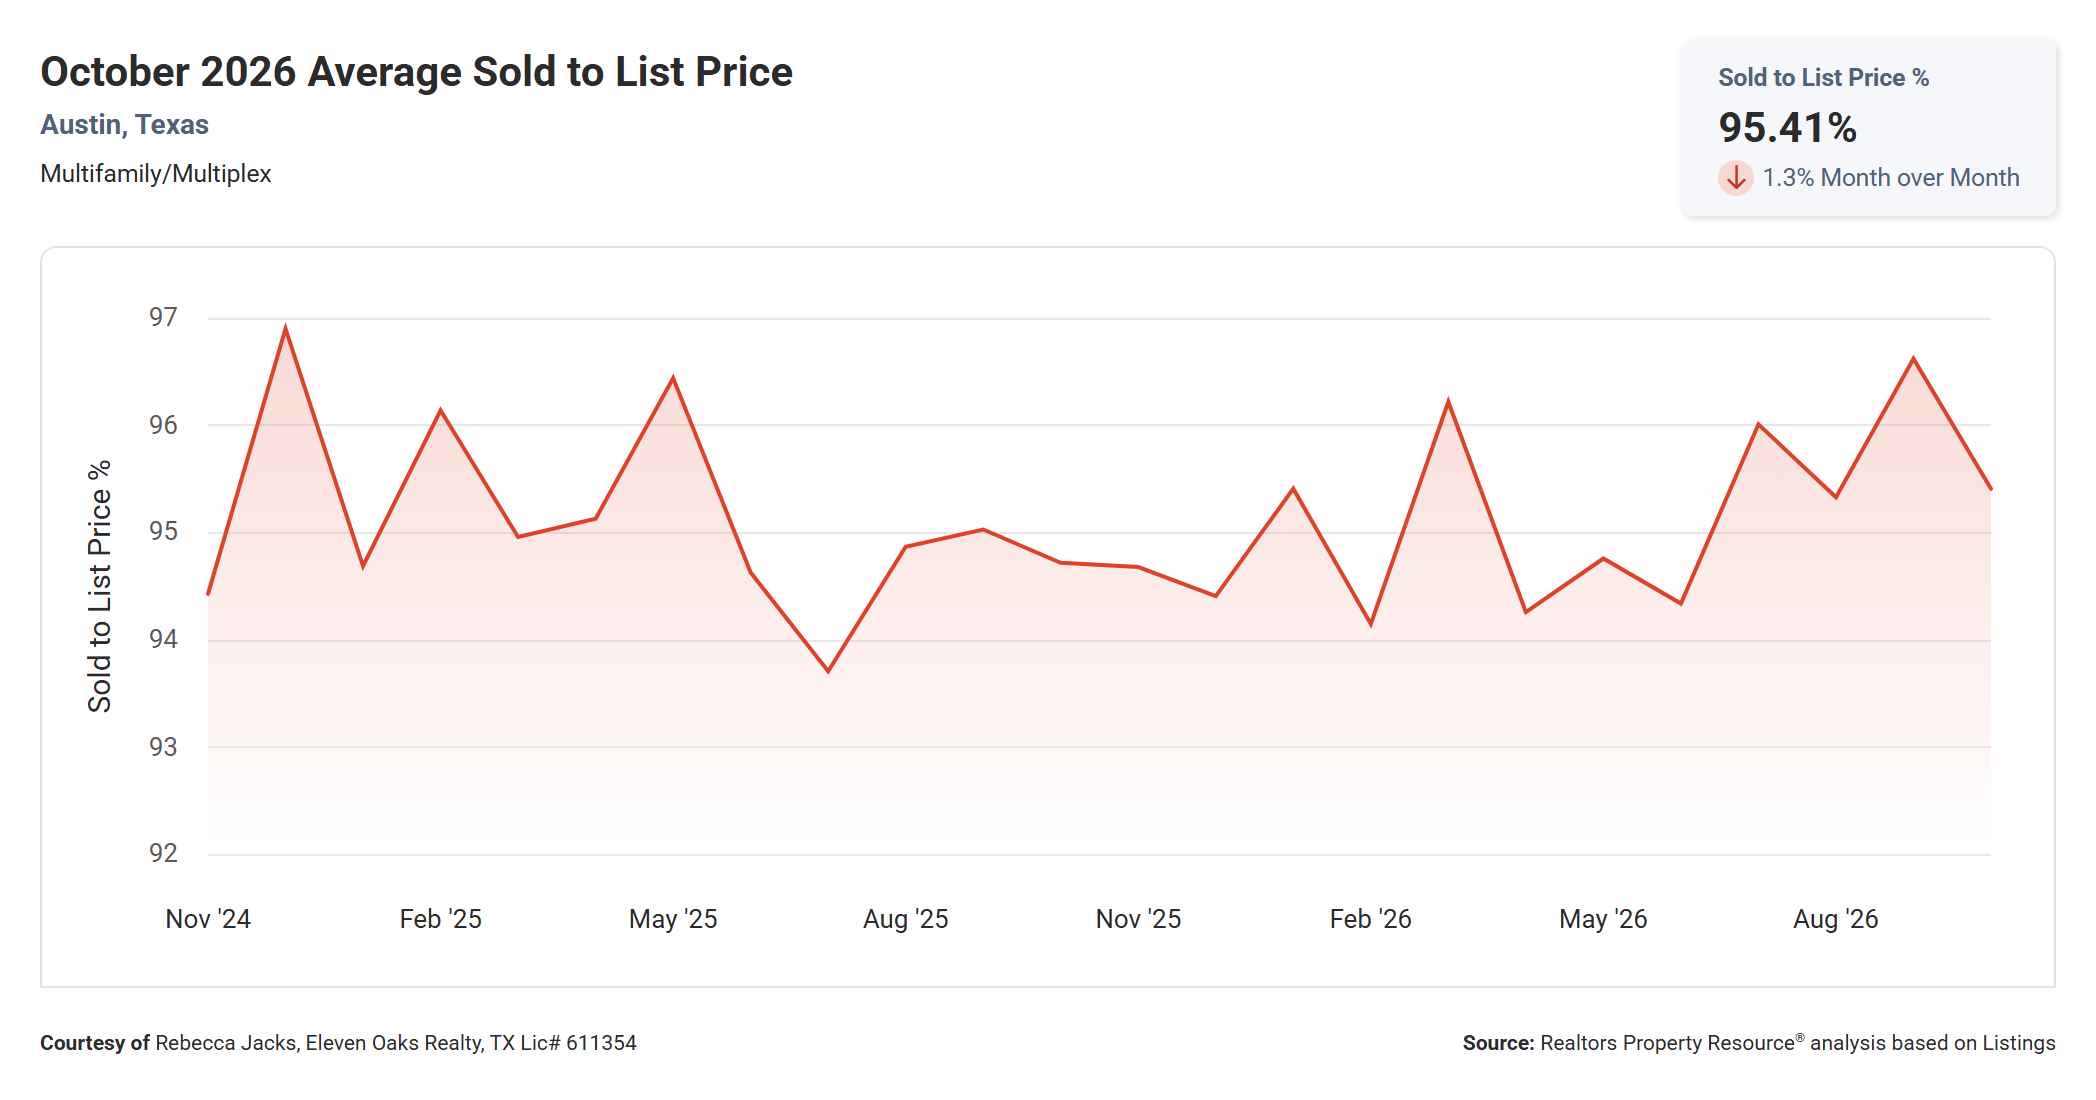
The average sold to list price ratio was 95.41% in October 2026, down 1.3% from 96.62% in September and up slightly (0.7%) from 94.72% in October 2025.
September’s 96.62% was one of the strongest readings in two years, so a pullback was not surprising. Over the full chart, this ratio has stayed between about 93.7% and 97%, which tells you multi family buyers in Austin consistently negotiate below asking price. October sits close to the middle of that range.
In practical terms, a seller listed at $500,000 would typically close around $477,000 at October’s ratio. Buyers should plan offers with that discount in mind, and sellers should expect it when setting a list price. Keep in mind this ratio measures against the final list price, after any reductions. The MLS data later in this report shows the discount from the original list price is much larger.
Median Time to Sell Up 41.8% Year Over Year
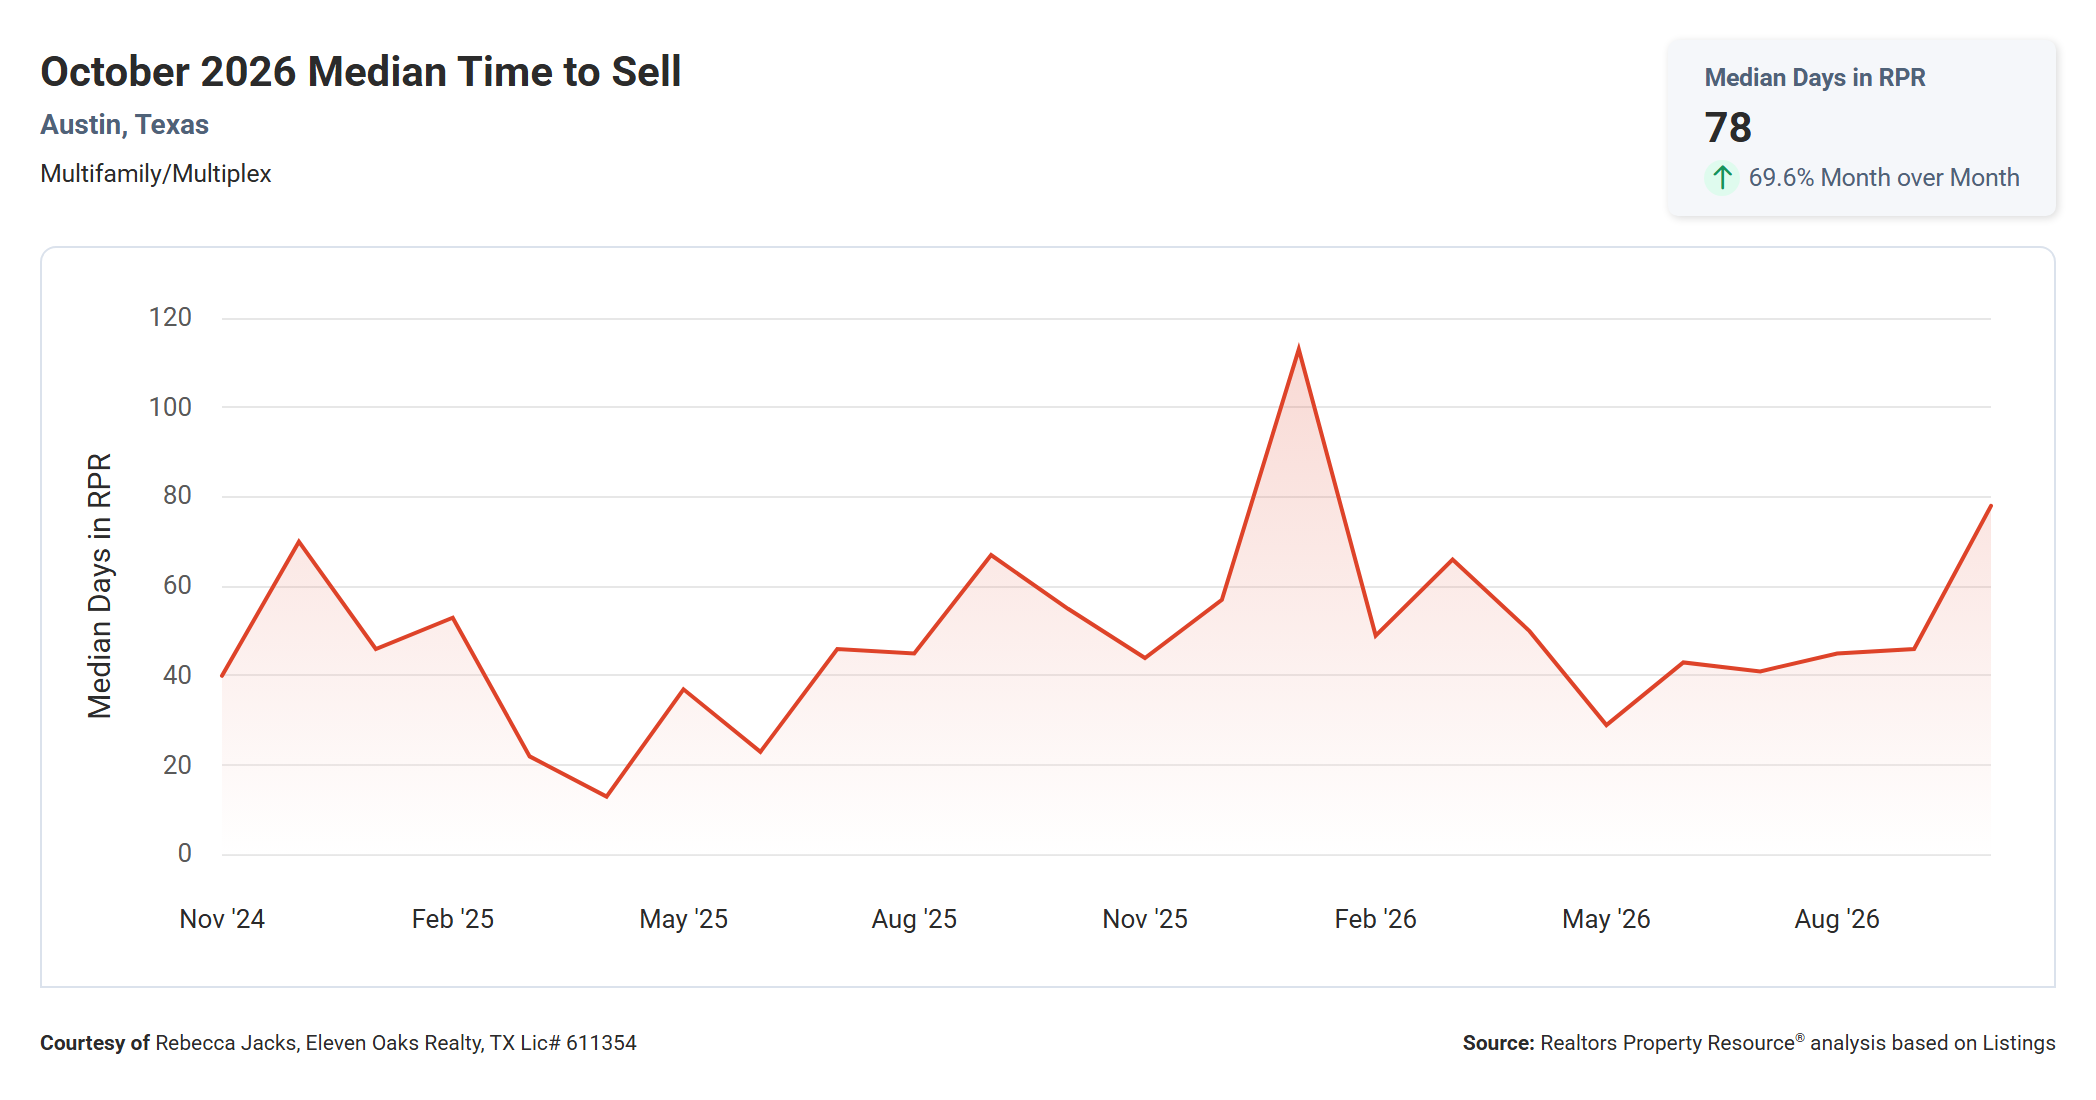
The median time to sell an Austin multi family property was 78 days in October 2026, up 69.6% from 46 days in September and up 41.8% from 55 days in October 2025.
This is the second-highest reading on the two-year chart, behind only the spike of about 113 days in January 2026. From May through September 2026 the median held in a tight band of roughly 29 to 46 days, so October’s jump stands out. Because only 15 properties closed, a few long-marketed listings finally selling can pull the median up quickly. The 69.6% monthly jump is a large swing, and small transaction volume in the multi family market can amplify percentage changes like this one.
For buyers, longer marketing times mean less pressure to decide quickly and more opportunity to find sellers who are ready to negotiate. Sellers should plan for a marketing period of two to three months and budget carrying costs (mortgage, taxes, insurance, and any vacancy) accordingly.
Median Price Per Square Foot Down 5.9% Year Over Year
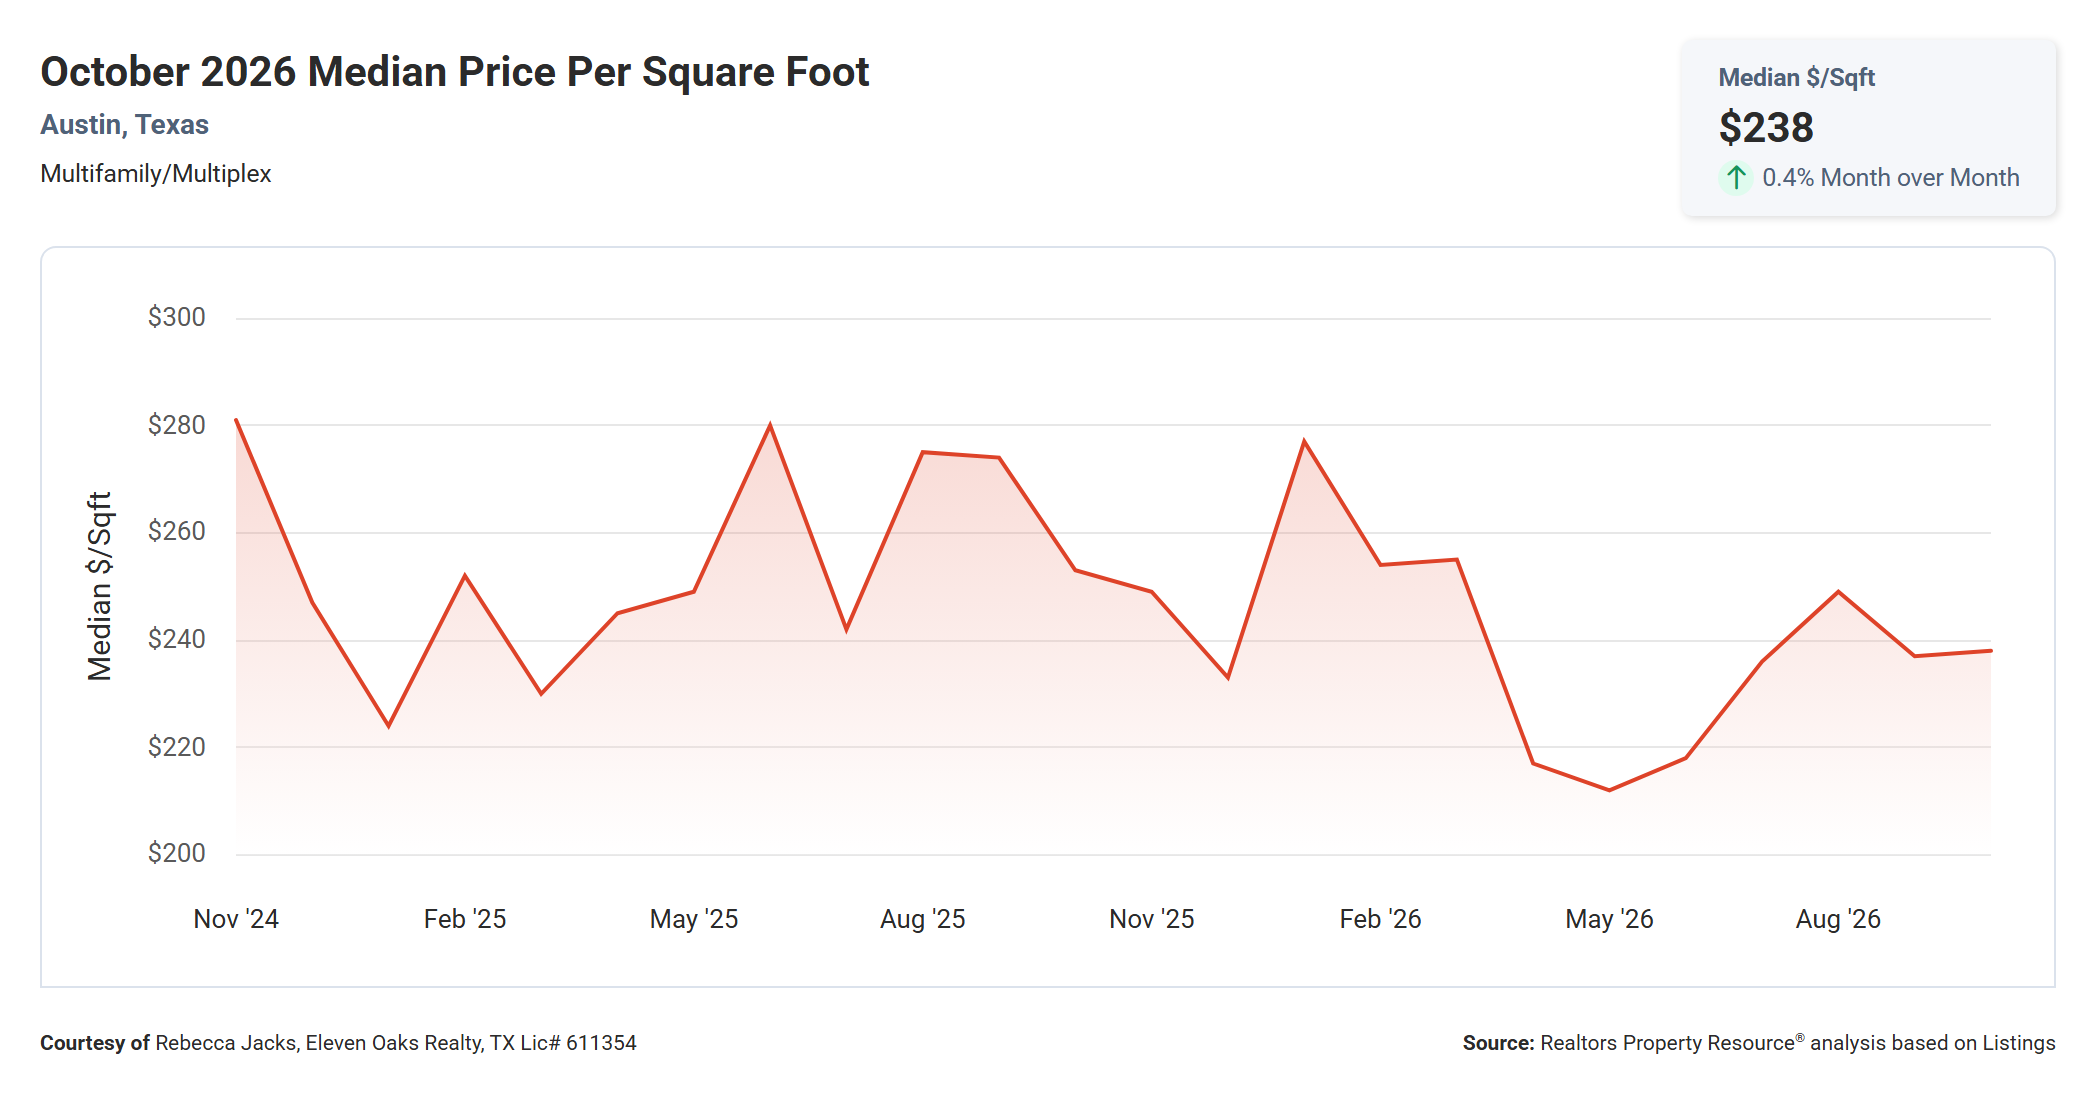
The median price per square foot was $238 in October 2026, up 0.4% from $237 in September and down 5.9% from $253 in October 2025.
Price per square foot bottomed out at about $212 in May 2026 and has recovered steadily since, reaching about $249 in August before settling in the high $230s. That recovery is a more encouraging signal than the median sold price alone. It suggests that part of the drop in median price reflects smaller or lower-priced properties selling, not only a decline in value per square foot.
For buyers comparing properties, $238 per square foot is a useful benchmark. Properties listed well above that level need to justify the premium with location, condition, rent rolls, or recent updates. Sellers can use the same benchmark to test whether their list price is in line with what the market is paying.
Total Sales Volume Down 20.2% Year Over Year
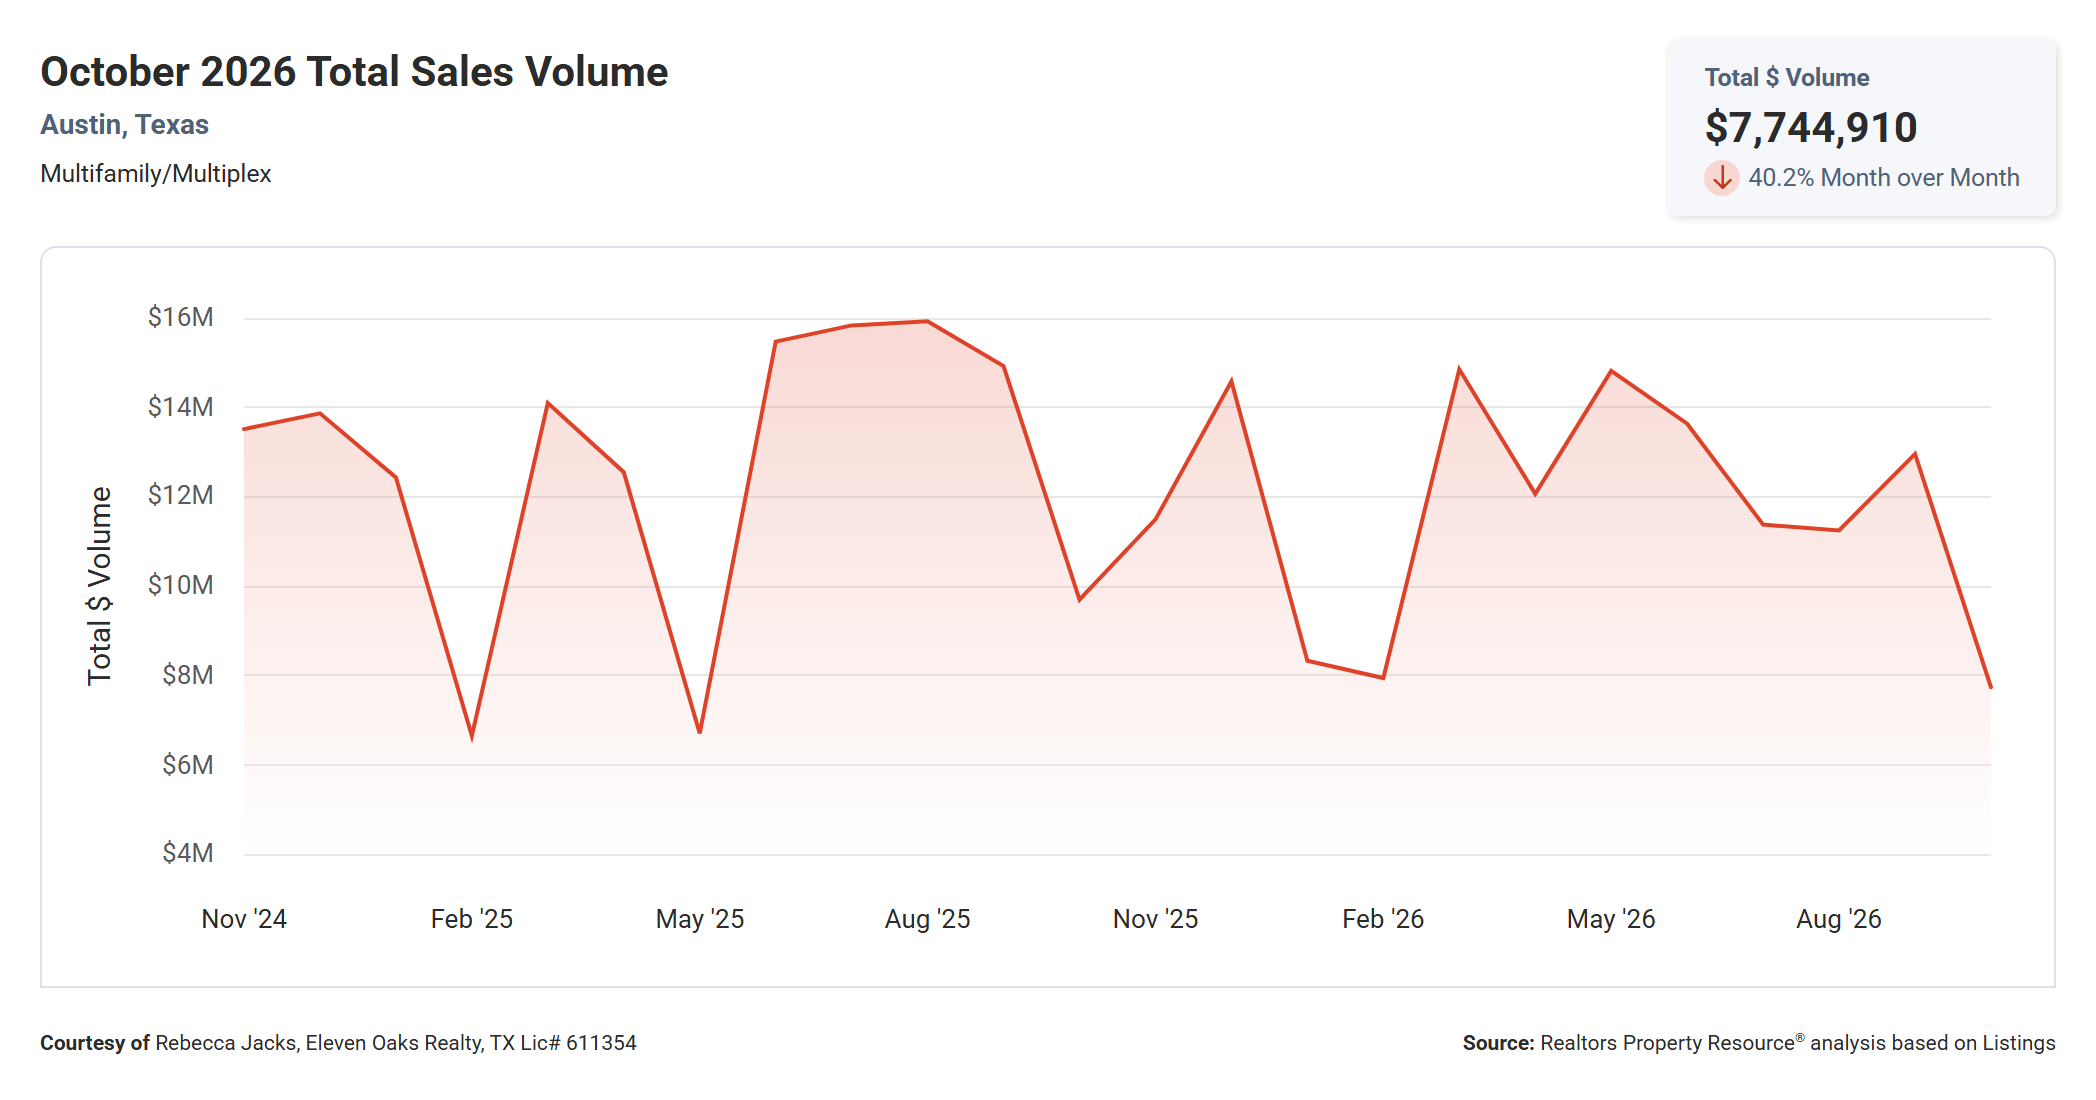
Total multi family sales volume in Austin was $7,744,910 in October 2026, down 40.2% from about $12.96 million in September and down 20.2% from about $9.7 million in October 2025.
October’s total is one of the lowest on the two-year chart. Only February 2025, May 2025, and February 2026 came in near or below this level, and those months were all seasonal low points. Volume is a combination of how many properties sold and at what price, and October was lower on both counts.
Lower dollar volume tells you the overall pace of investment in Austin duplexes, triplexes, and quadplexes slowed in October. For buyers, that means less competition. For sellers, it reinforces the importance of pricing to attract the smaller pool of active buyers.
Months Supply of Inventory Up 9.0% Year Over Year
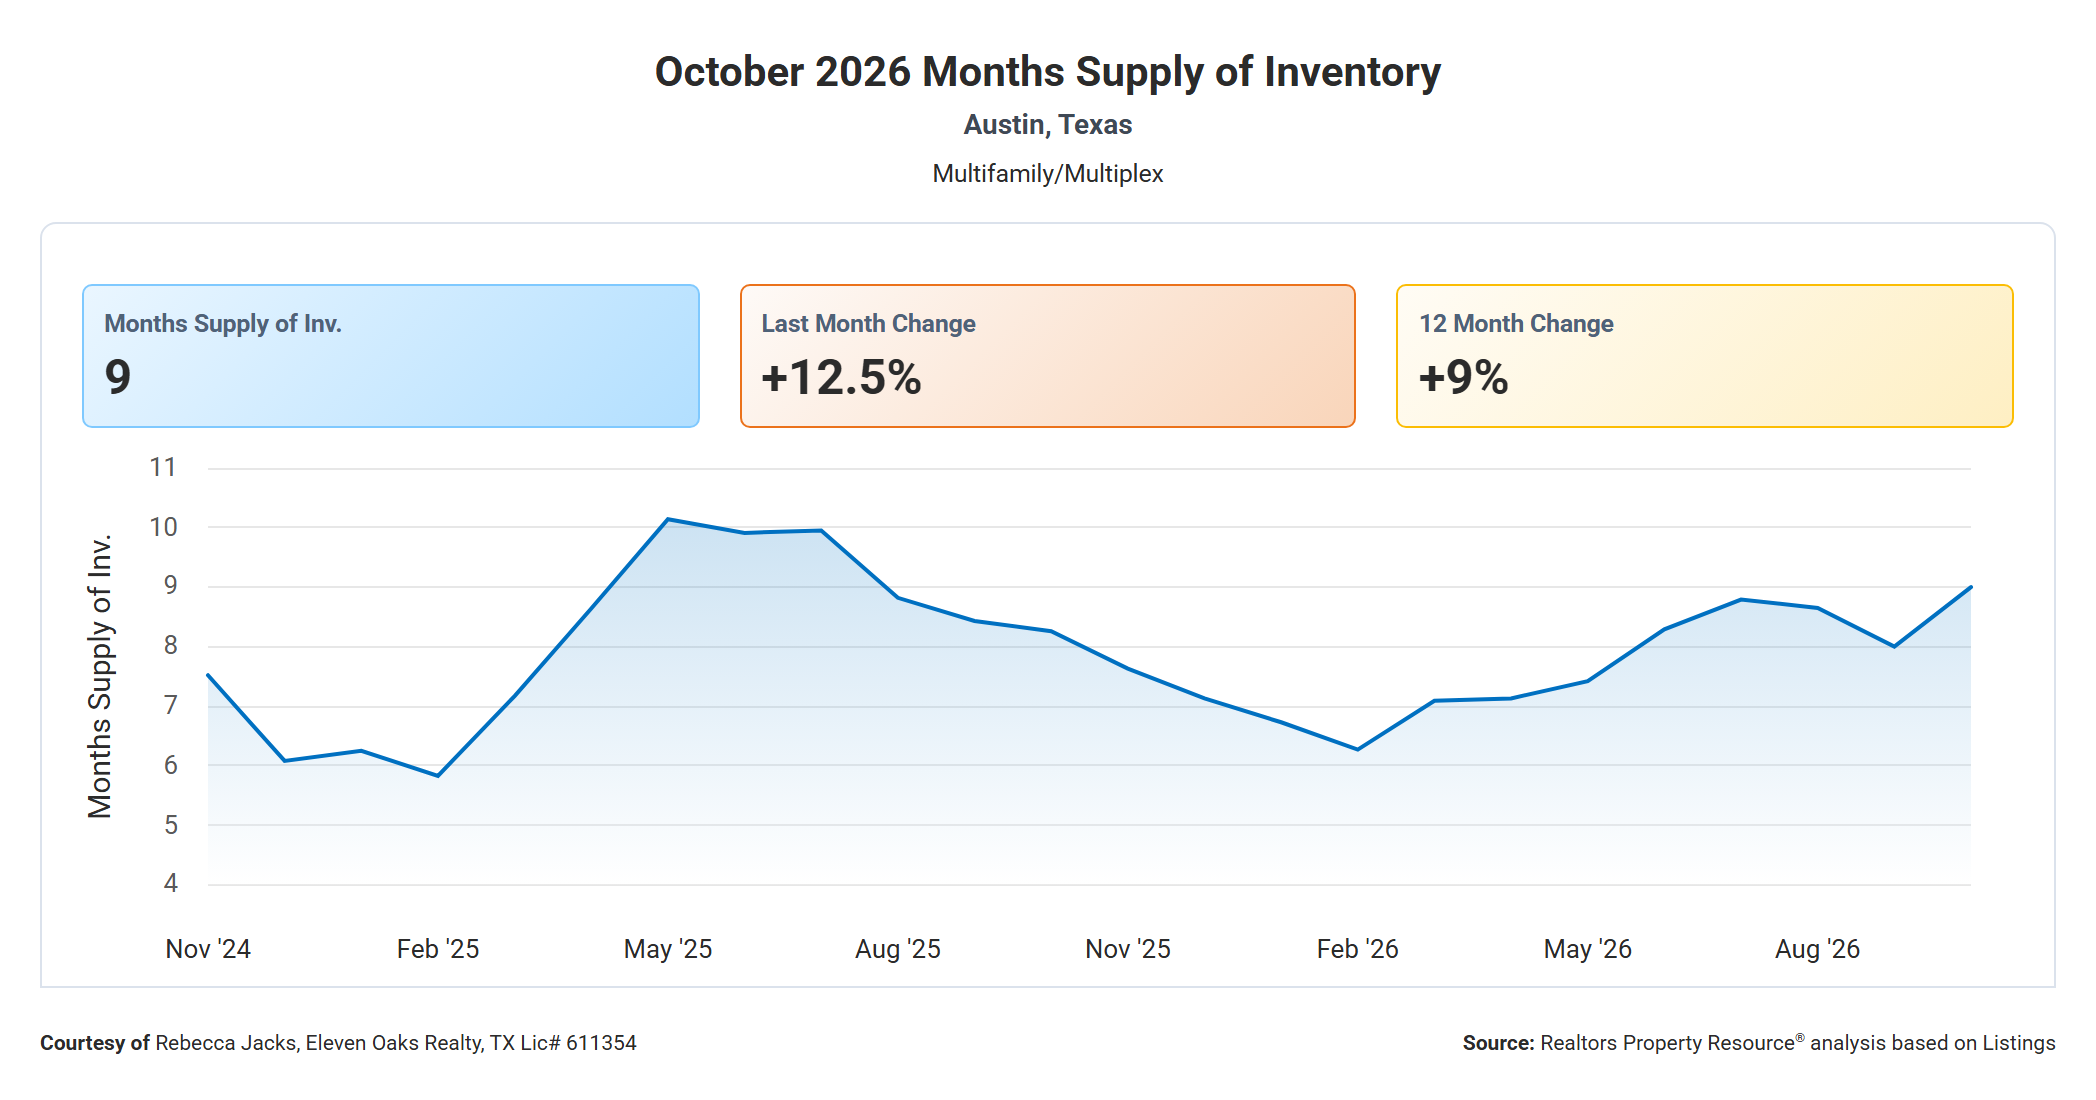
Months supply of inventory reached 9 months in October 2026, up 12.5% from 8 months in September and up 9.0% from 8.26 months in October 2025.
The chart shows inventory falling to about 6.3 months in February 2026 and then climbing steadily through the year. October’s reading is the highest since summer 2025, when supply briefly topped 10 months. At 9 months, it would take roughly three quarters of a year to sell every active multi family listing at the current sales pace.
This is the clearest buyer’s market indicator in the report. Buyers have time and options. Sellers are competing against a deep bench of other listings, which makes condition, pricing, and presentation the main ways to stand out.
New Pending Listings Down 67.9% Year Over Year
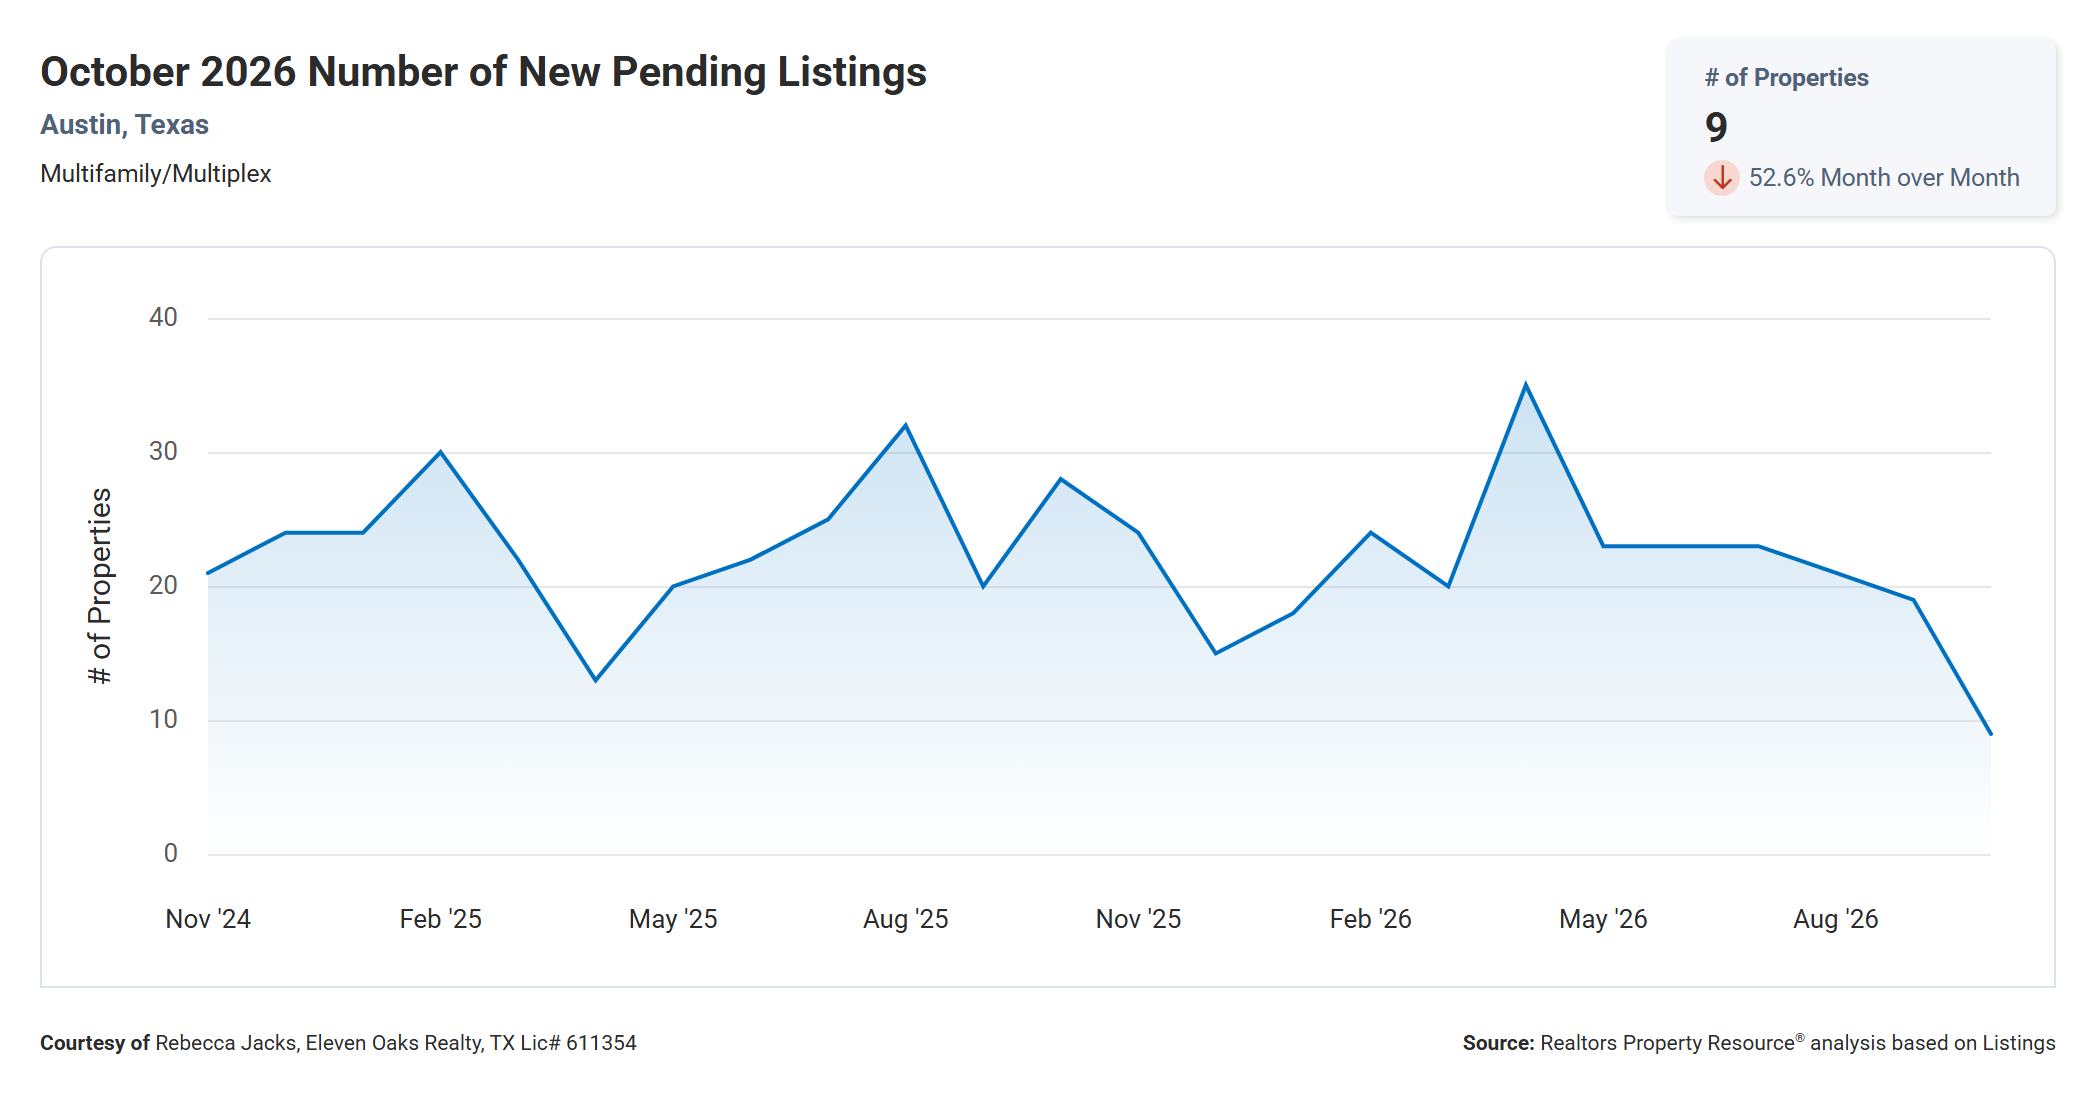
Only 9 multi family properties went under contract in Austin in October 2026, down 52.6% from 19 in September and down 67.9% from 28 in October 2025.
This is the lowest reading on the two-year chart, below the previous low of about 13 in April 2025. Pending sales had held in the low 20s through most of summer 2026 before sliding to 19 in September and then dropping sharply in October. Swings this large are partly a function of small numbers, since a difference of 10 contracts produces a 50%+ change, but the direction is still meaningful.
New pending sales are a leading indicator. Today’s contracts become next month’s closings, so 9 new pendings suggests November closings could come in low as well. Buyers who are ready to act may find motivated sellers heading into the holidays. Sellers should treat this as a signal that buyer activity cooled in October and price accordingly.
Median Active List Price Down 5.6% Year Over Year
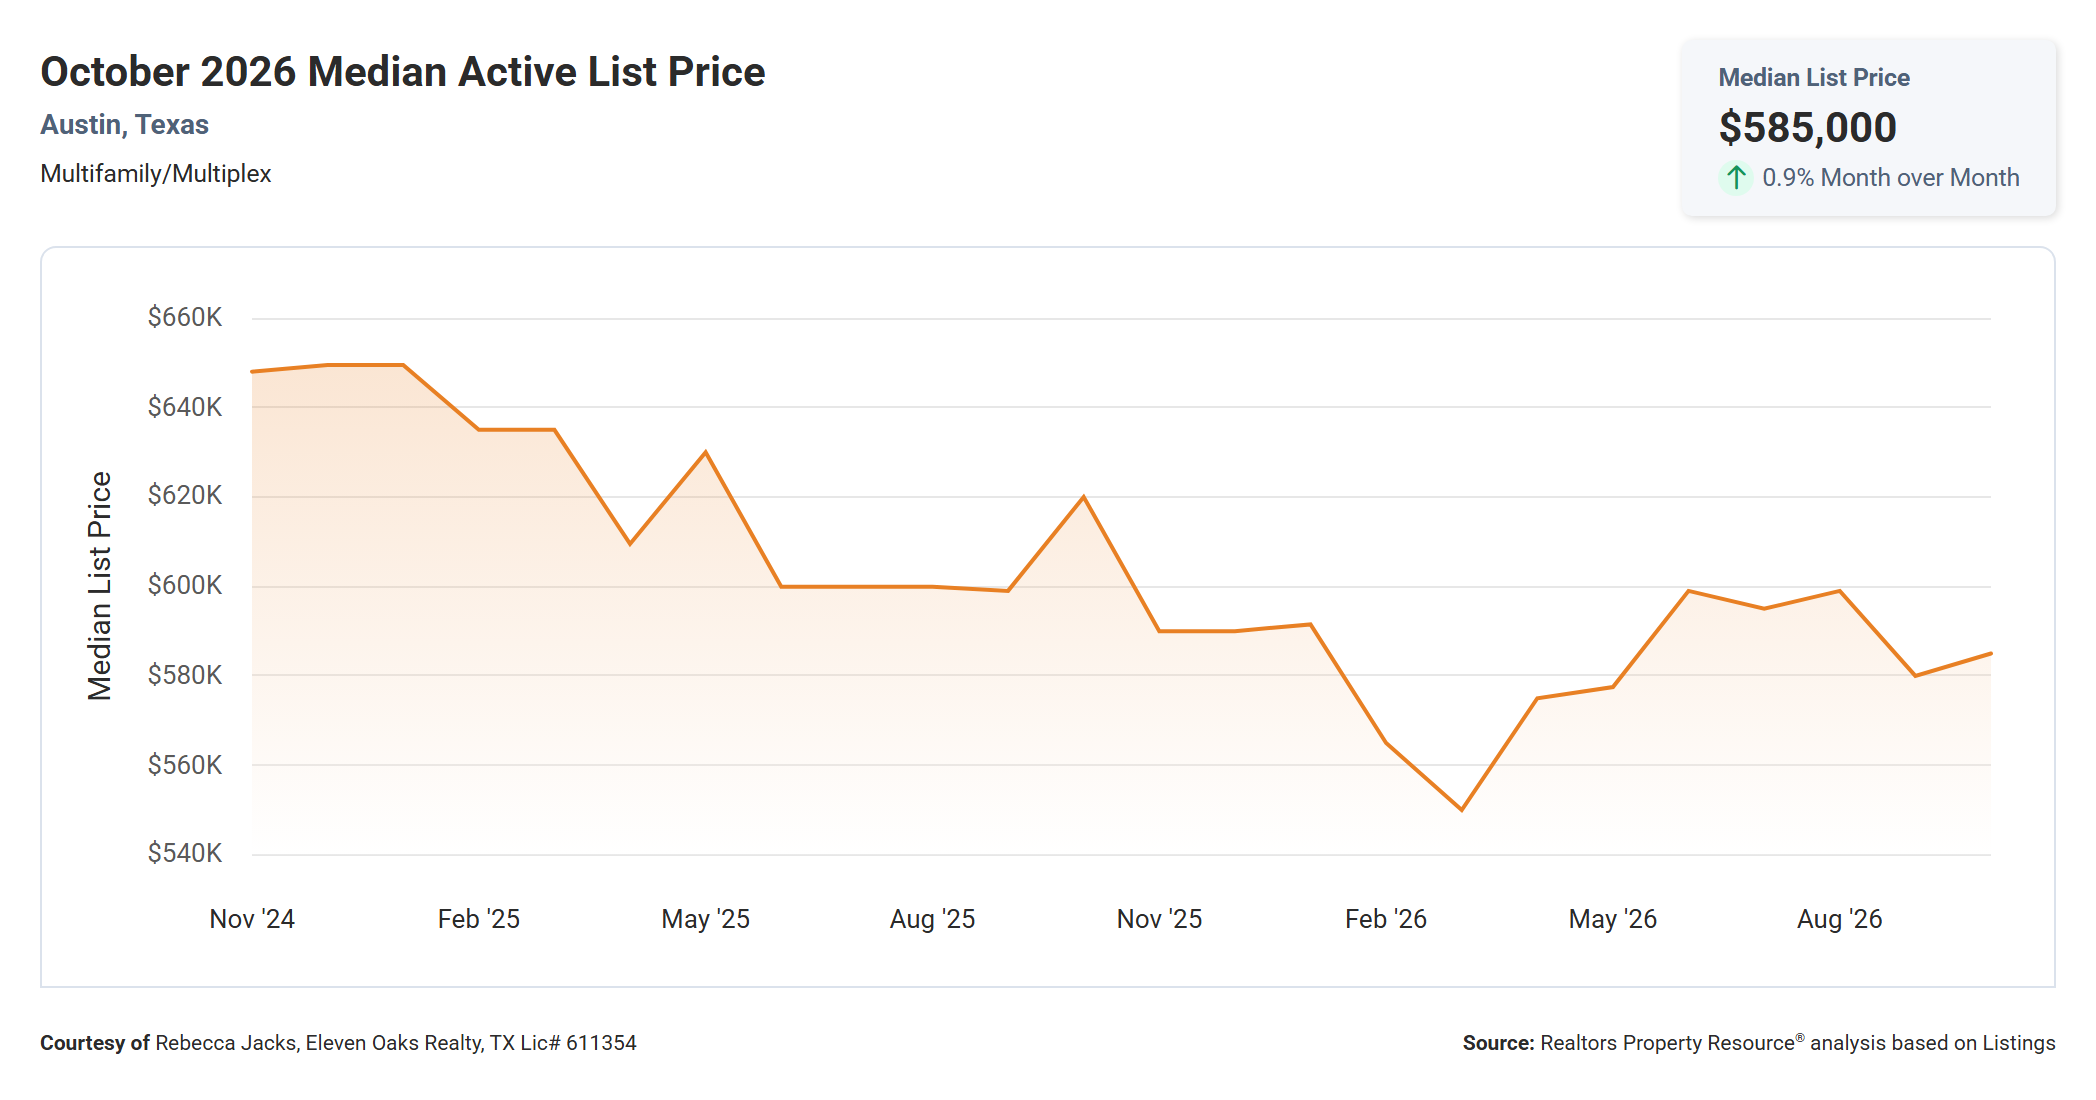
The median active list price was $585,000 in October 2026, up 0.9% from $580,000 in September and down 5.6% from $620,000 in October 2025.
Asking prices have stepped down over two years, from about $648,000 in late 2024 to a low of about $550,000 in March 2026, before recovering into the $575,000 to $600,000 range this spring and summer. October’s small uptick keeps the median list price near the middle of that recent range.
The more telling number is the gap between asking and selling prices. The median active list price of $585,000 is $110,000 above October’s median sold price of $475,000. Part of that gap reflects which properties sell first (lower-priced ones tend to move faster), but it also suggests many active listings are priced above what buyers are paying today. Sellers should price off recent sales, not off other active listings.
New Listings Down 4.4% Year Over Year
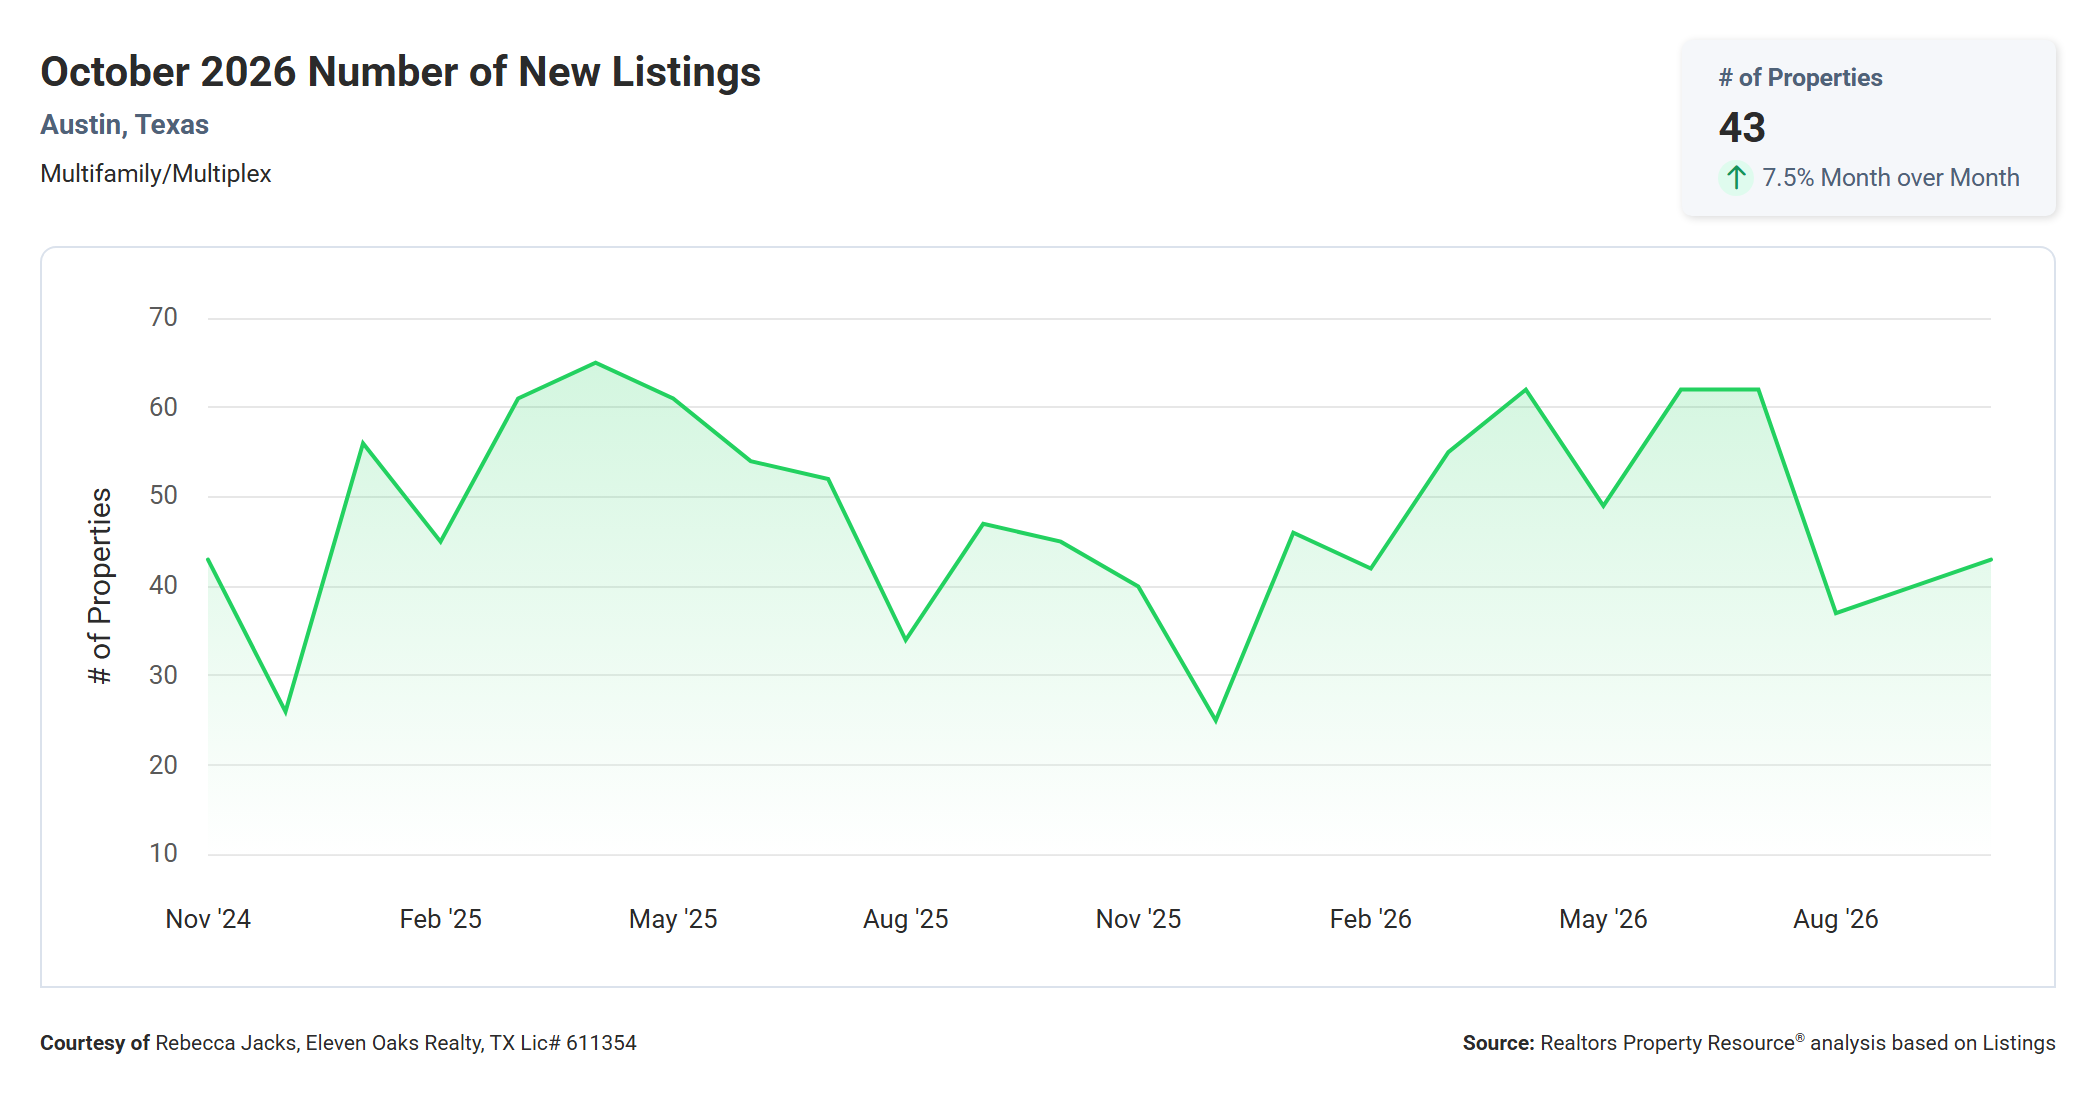
Forty-three new multi family listings came on the market in October 2026, up 7.5% from 40 in September and down 4.4% from 45 in October 2025.
New listings peaked at about 62 per month in spring and early summer 2026, then dropped to about 37 in August. October’s 43 is a modest rebound, close to the same month last year. The concern is the mismatch: 43 properties entered the market while only 9 went under contract, so supply is outpacing demand by a wide margin.
For buyers, a steady flow of new listings keeps options fresh. For sellers, it means new competition arrives every week, and the first few weeks on the market (when a listing gets the most attention) matter more than ever.
Active Listings Essentially Unchanged Year Over Year
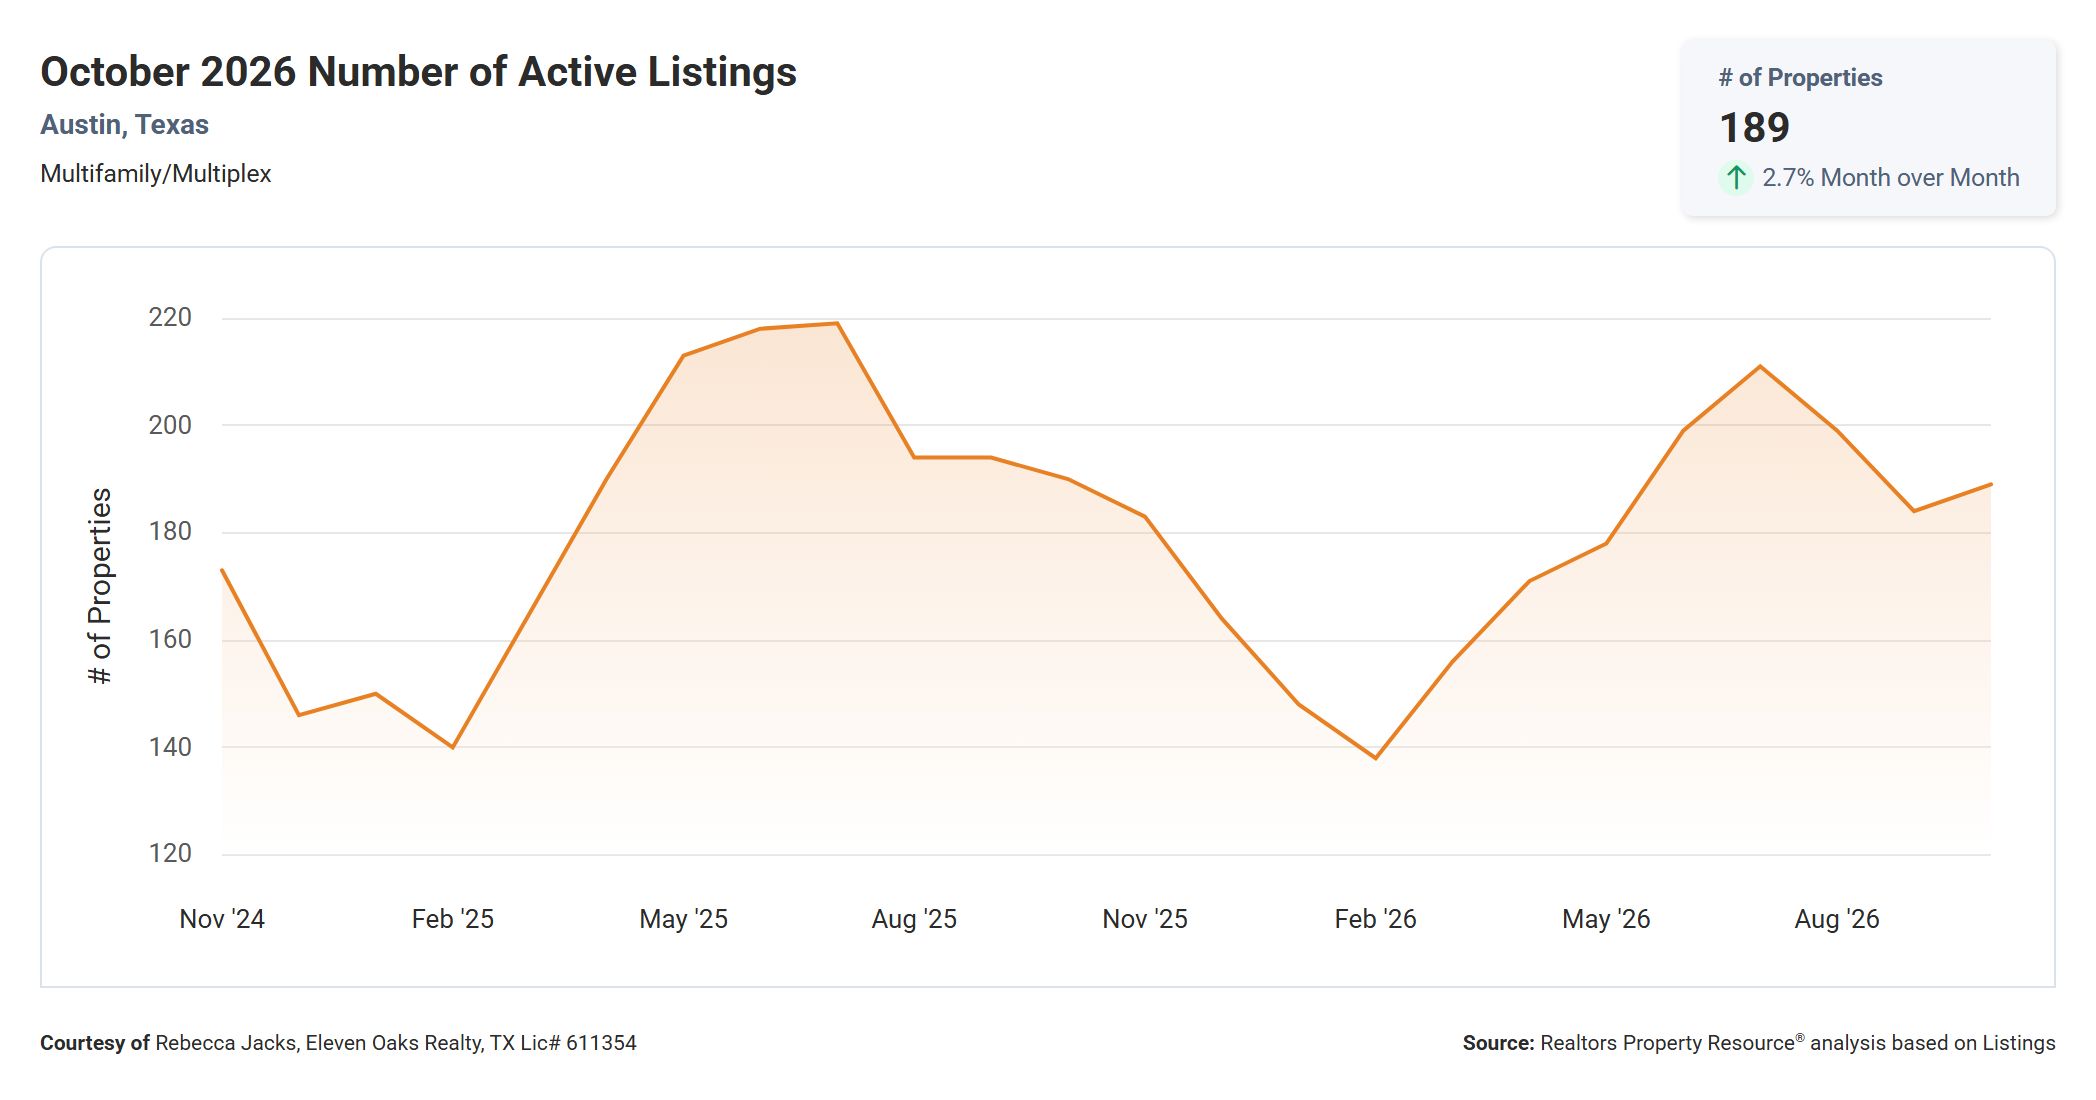
There were 189 active multi family listings in Austin in October 2026, up 2.7% from 184 in September and essentially unchanged (down 0.5%) from 190 in October 2025.
Active inventory follows a clear seasonal pattern on the chart: it builds through spring, peaks in summer (about 219 in July 2025 and about 211 in July 2026), then eases into winter. This fall, inventory dipped to 184 in September and ticked back up in October, which runs against the usual seasonal decline.
With 189 properties available and only 15 selling in a month, buyers have plenty to choose from. If the seasonal pattern holds, active listings should ease over the winter months, which could slowly improve conditions for sellers heading into early 2027.
The Two-Year Price Trend for Austin Multi Family
Looking at the full two years of RPR data gives helpful context for this month’s numbers. In late 2024 and through 2025, the median sold price frequently landed between $550,000 and $640,000. Since March 2026, it has not topped about $510,000. Asking prices tell a similar story, sliding from about $648,000 to the $580,000s.
Price per square foot shows a gentler path. After falling to about $212 in May 2026, it rebounded to the high $230s and $240s through summer and fall. That suggests the market has found more stable footing on value per square foot than the headline median price implies, and that the mix of properties selling (smaller duplexes versus larger quadplexes) explains part of the decline.
For long-term investors, this matters. Buying near the lower end of a two-year range can improve returns if Austin’s rental demand stays steady. For sellers, it means pricing against 2025 sales will usually overshoot what today’s buyers will pay.
October 2026 Austin Multi Family Real Estate by the Numbers
The table below is pulled directly from the Austin Board of REALTORS MLS statistics for October 2026 and covers 15 closed multi family transactions (duplex, triplex, and quadplex) in the city of Austin.
| Min | Max | Avg | Median | |
|---|---|---|---|---|
| Sq Ft | 1,380 | 2,864 | 2,112 | 2,040 |
| Lot Sq Ft | 3,960 | 18,726 | 9,176 | 9,100 |
| Acres | 0.091 | 0.430 | 0.211 | 0.209 |
| List Price | $309,000 | $825,000 | $538,653 | $490,000 |
| LP/Sq Ft | $167.03 | $503.62 | $261.05 | $243.50 |
| Close Price | $305,000 | $825,000 | $516,327 | $475,000 |
| CP/Sq Ft | $140.31 | $489.13 | $250.61 | $232.52 |
| CP/LP% | 73.00% | 103.00% | 95.33% | 97.00% |
| CP/OLP% | 66.00% | 103.00% | 90.00% | 90.00% |
| ADOM | 4 | 503 | 97 | 76 |
The most expensive multi family property that sold in October 2026 sold for $825,000 and the least expensive sold for $305,000. Properties ranged in size from 1,380 to 2,864 square feet with an average size of 2,112 square feet. The average price per square foot was $250.61 with the lowest being $140.31 per square foot and the highest being $489.13 per square foot. It took, on average, 97 days to sell a multi family property in Austin and sellers received, on average, 90.00% of their original list prices.
For sellers, the gap between CP/LP% and CP/OLP% is the most useful number in this table. Against the final list price, sellers averaged 95.33%. Against the original list price, they averaged just 90.00%. That 5.3-point difference reflects price reductions taken before going under contract. On a $500,000 original asking price, it is the difference between closing near $477,000 and closing near $450,000. Overpricing at the start does not just cost time; it tends to cost real dollars at the closing table.
Days on market tell a similar story. The median ADOM of 76 days lines up closely with RPR’s median of 78 days, but the average of 97 days is pulled up by at least one property that took 503 days to sell. The average close price of $516,327 sits about 8.7% above the median of $475,000, which means a few higher-priced sales (up to $825,000) lifted the average. With only 15 sales, the median is the more reliable gauge of a typical property this month. The MLS median close price matches RPR’s $475,000 exactly, and the average CP/LP% (95.33%) is within a tenth of a point of RPR’s 95.41%.
What This Means for Multi Family Buyers
Prices are meaningfully lower than a year ago. The median sold price of $475,000 is about $65,000 below October 2025, and the median price per square foot is down 5.9% to $238. If you have been waiting for Austin multi family pricing to come back to earth, October’s numbers show it has, at least compared to the 2025 range.
Negotiating room is real. With 9 months of supply, sold-to-list at 95.41%, and sellers receiving an average of only 90% of their original asking price, you are in a strong position to ask for price reductions, seller-paid closing costs, or repair credits. Properties that have been listed for 60 days or more deserve a close look, since those sellers are more likely to accept a strong offer below asking.
Most multi family buyers are investors or owner-occupants planning to rent out the other units, so run the numbers carefully. A lower purchase price helps your cap rate and cash flow, but verify current leases, rent rolls, vacancy history, and operating expenses before you write an offer. Financing terms for investment properties also differ from owner-occupied loans, so talk with your lender early.
On timing, the record-low 9 new pending sales suggests demand cooled sharply in October. The holiday stretch from November through January is traditionally slow, which can mean less competition and more flexible sellers. If you find a property that fits your goals, the current data supports moving forward with a firm, well-supported offer.
What This Means for Multi Family Sellers
Buyer demand softened in October. Closings fell to 15, new contracts dropped to 9 (the lowest in two years), and median time to sell rose to 78 days. Buyers are still out there, but they are more selective and less rushed than they were earlier this year.
Competition is stiff. With 189 active multi family listings and 43 new ones added in October, your property is one of many options. Buyers can compare, wait, and negotiate. The properties that sell are the ones priced in line with recent sales and presented well, with clean financials and clear rent rolls.
Pricing discipline matters even more in a thin market. Sellers in October averaged 95.33% of their final list price but only 90.00% of their original list price. That gap is the cost of starting too high. In a market with fewer qualified buyers, an overpriced listing can sit for months, collect price reductions, and end up selling for less than a property priced correctly from day one.
Looking ahead, conditions are unlikely to swing in sellers’ favor before early 2027. The low pending count points to a slow November, and inventory typically eases over the winter. If you need to sell in the next few months, price to the current market, not to last year’s sales. If you have flexibility, spring has historically brought more buyer activity on the RPR charts.
Market Summary and Outlook
October 2026 was a soft month for Austin multi family. Closings, sales volume, and especially new contracts all fell, while median time to sell jumped to 78 days and supply climbed to 9 months. The one steady bright spot was price per square foot, which held at $238 and remains well above its spring low.
Year over year, the market is broadly softer. The median sold price is down 12%, price per square foot is down 5.9%, pending sales are down 67.9%, and time to sell is up 41.8%. Active listings and new listings are roughly in line with a year ago, so the softness is coming more from the demand side than from a surge in supply.
The key variable for the coming months is whether buyer activity recovers. Pending sales are the number to watch. If contracts bounce back to the high teens or low 20s, October will look like a seasonal dip. If they stay in single digits, expect closings and prices to stay under pressure into early 2027. Interest rates and investment property financing costs will play a large role in how many investors return.
Long term, Austin’s multi family market is supported by steady rental demand in a growing metro, and duplexes, triplexes, and quadplexes remain one of the more accessible ways to own income property in the city. Today’s lower prices and longer marketing times reflect a market resetting from its 2025 levels, not a lack of interest in Austin itself.
Action Items for Multi Family Buyers
- Use the 9-month supply and the 90% average sale-to-original-list ratio to negotiate firmly, including price, closing costs, and repair credits.
- Focus on properties that have been listed for 60 days or longer, since sellers with longer marketing times are typically more flexible.
- Benchmark every property against the $238 median price per square foot and ask what justifies any premium above it.
- Request rent rolls, current leases, and at least 12 months of operating expenses before making an offer so you can verify cash flow.
- Get pre-approved for investment property financing now, since loan terms and down payment requirements differ from owner-occupied loans.
- Consider shopping during the slower holiday months, when the record-low pending count suggests you will face less competition.
Action Items for Multi Family Sellers
- Price your property based on recent closed sales near the $475,000 median, not on active listings priced around $585,000.
- Avoid starting high and reducing later, since October sellers lost an average of 10% from their original list price.
- Prepare clean, organized financials (rent roll, leases, expenses) before listing, because investor buyers will ask for them first.
- Budget for a 75 to 100 day marketing period and plan for carrying costs during that time.
- Make repairs and improve curb appeal before listing so your property stands out among 189 active listings.
- If your timeline is flexible, talk with your agent about whether listing in early spring could put you in front of more buyers.
Final Word on the Market
October 2026 rewarded patient, prepared buyers in the Austin multi family market. Supply is high, buyers are scarce, and sellers who started too high paid for it with longer marketing times and deeper discounts. Sellers who priced realistically and presented clean financials still found buyers.
The honest read is that this is a good time to buy and a challenging time to sell. Prices are lower than a year ago, negotiating room is wide, and competition among buyers is light. Sellers can still succeed, but only by pricing to today’s market and preparing the property and paperwork well.
Whichever side you are on, let the data guide you. Make the decision that fits your investment goals, your timeline, and your financial situation, not the headlines.
Questions About the October 2026 Austin Multi Family Real Estate Price Report?
Have questions about what the October 2026 Austin Multi Family Real Estate Price Report means for your specific situation? We are happy to help. If you are thinking about buying a multi family property in Austin, our Buyers page has resources to help you understand the process and get started. If you are thinking about selling, our Sellers page walks through what to expect in today’s market.
Reach out to Rebecca Jacks and the team at Eleven Oaks Realty. Call or text (512) 827-8323 or email info@11OaksRealty.com. We have been helping buyers and sellers since 1978 and we are here to help you make the best decision for your situation, whatever that looks like.
Data sources: Realtors Property Resource (RPR), Austin Board of REALTORS MLS. All figures are for multi family residential properties (duplex, triplex, and quadplex) in the city of Austin. Reported figures reflect October 1, 2026 through October 31, 2026. Some variation between data sources may exist due to differing methodology and timing of data pulls.




Leave a Reply