
Eleven Oaks Realty is proud to present their October 2026 Austin Real Estate Price Report measuring activity in the single family home market.
October brought the usual fall slowdown to Austin, with fewer closings, fewer new listings, and fewer homes going under contract than in September. Prices held up better than activity did. The median sold price of $583,750 slipped 2.2% from September but finished 3.7% higher than October 2025, and homes sold in a median of 41 days, 11 days faster than a year ago. This report walks through pricing, inventory, buyer demand by price range, and what all of it means for you whether you are buying or selling.
All data below covers single-family residential homes in the city of Austin. Data is sourced from Realtors Property Resource (RPR) and the Austin Board of REALTORS MLS. Some metrics may vary slightly between sources due to differing methodology; where differences exist, they are noted.
This month, one of those differences is larger than usual. RPR’s October counts for homes sold, total sales volume, new listings, and new pending listings came in well below what the MLS recorded (for example, 400 sold homes in RPR versus 582 in Unlock MLS and 596 on the ABoR statistics sheet). RPR calculates its monthly figures once and does not refresh them until the next month, so the October RPR graphs below are shown as published. For those four count-based metrics, we treat the MLS figures as the accurate numbers and use them in the headings and analysis. Price, ratio, and days-on-market metrics are much less affected and are reported from RPR as usual.
The Austin Real Estate Market is a Seller’s Market
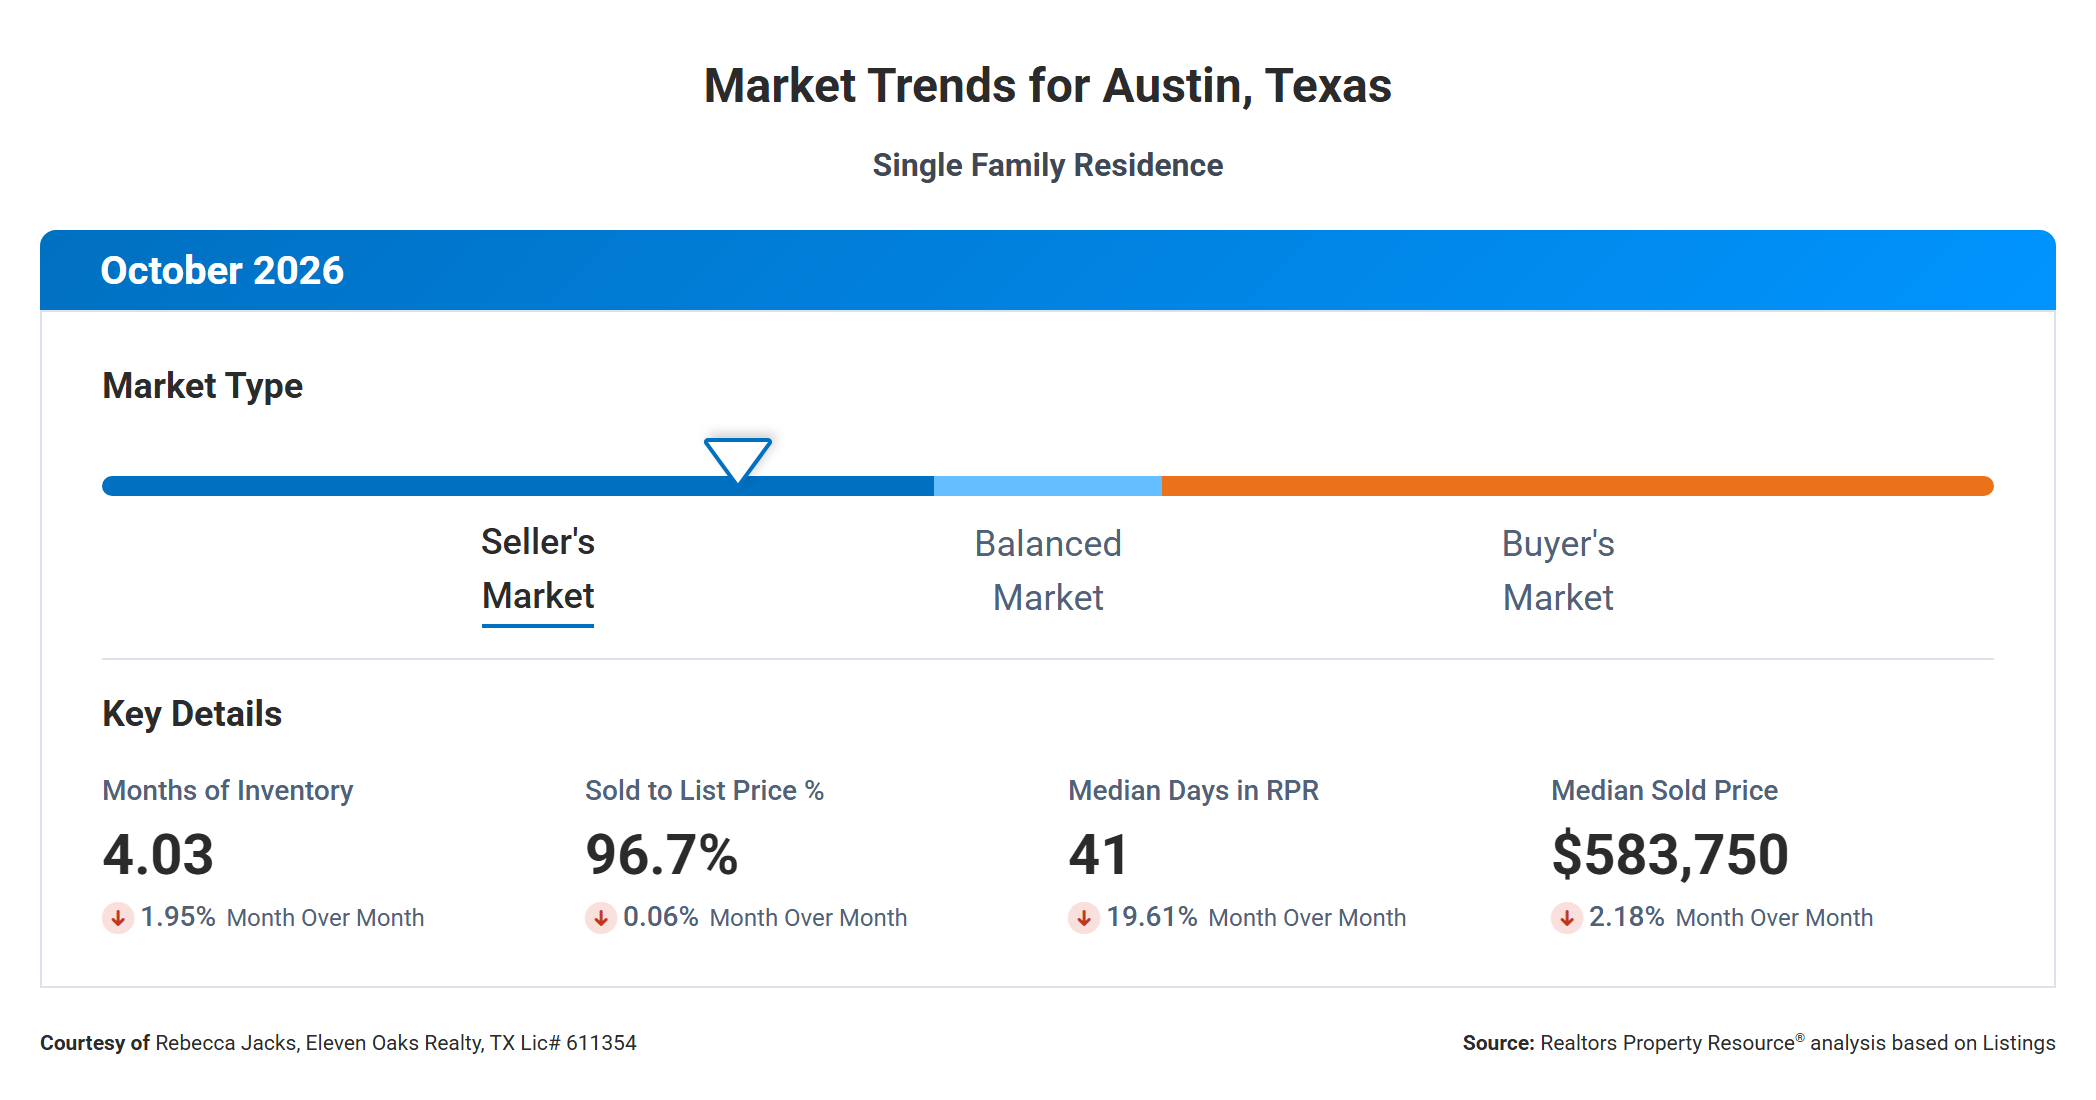
RPR classified Austin as a seller’s market for October 2026, with 4.03 months of inventory. Months supply measures how long it would take to sell every active listing at the current pace of sales, and the range from roughly four to six months is generally considered balanced. At 4.03 months, Austin sits right at the edge between a seller’s market and a balanced one, so you should read the label as "slightly in the seller’s favor" rather than a market where sellers hold all the cards.
The four key indicators on the dashboard all moved down from September. Months of inventory dipped 1.95% to 4.03. The sold-to-list price ratio eased 0.06% to 96.7%, meaning the typical home closed about 3.3% below its final asking price. Median days in RPR dropped 19.61% to 41 days, and the median sold price fell 2.18% to $583,750.
Taken together, these signals describe a market that is quieter heading into the holidays but still functioning well. Homes that are priced right are selling faster than they did last fall, and prices remain above where they were a year ago.
Median Sold Price Up 3.7% Year Over Year
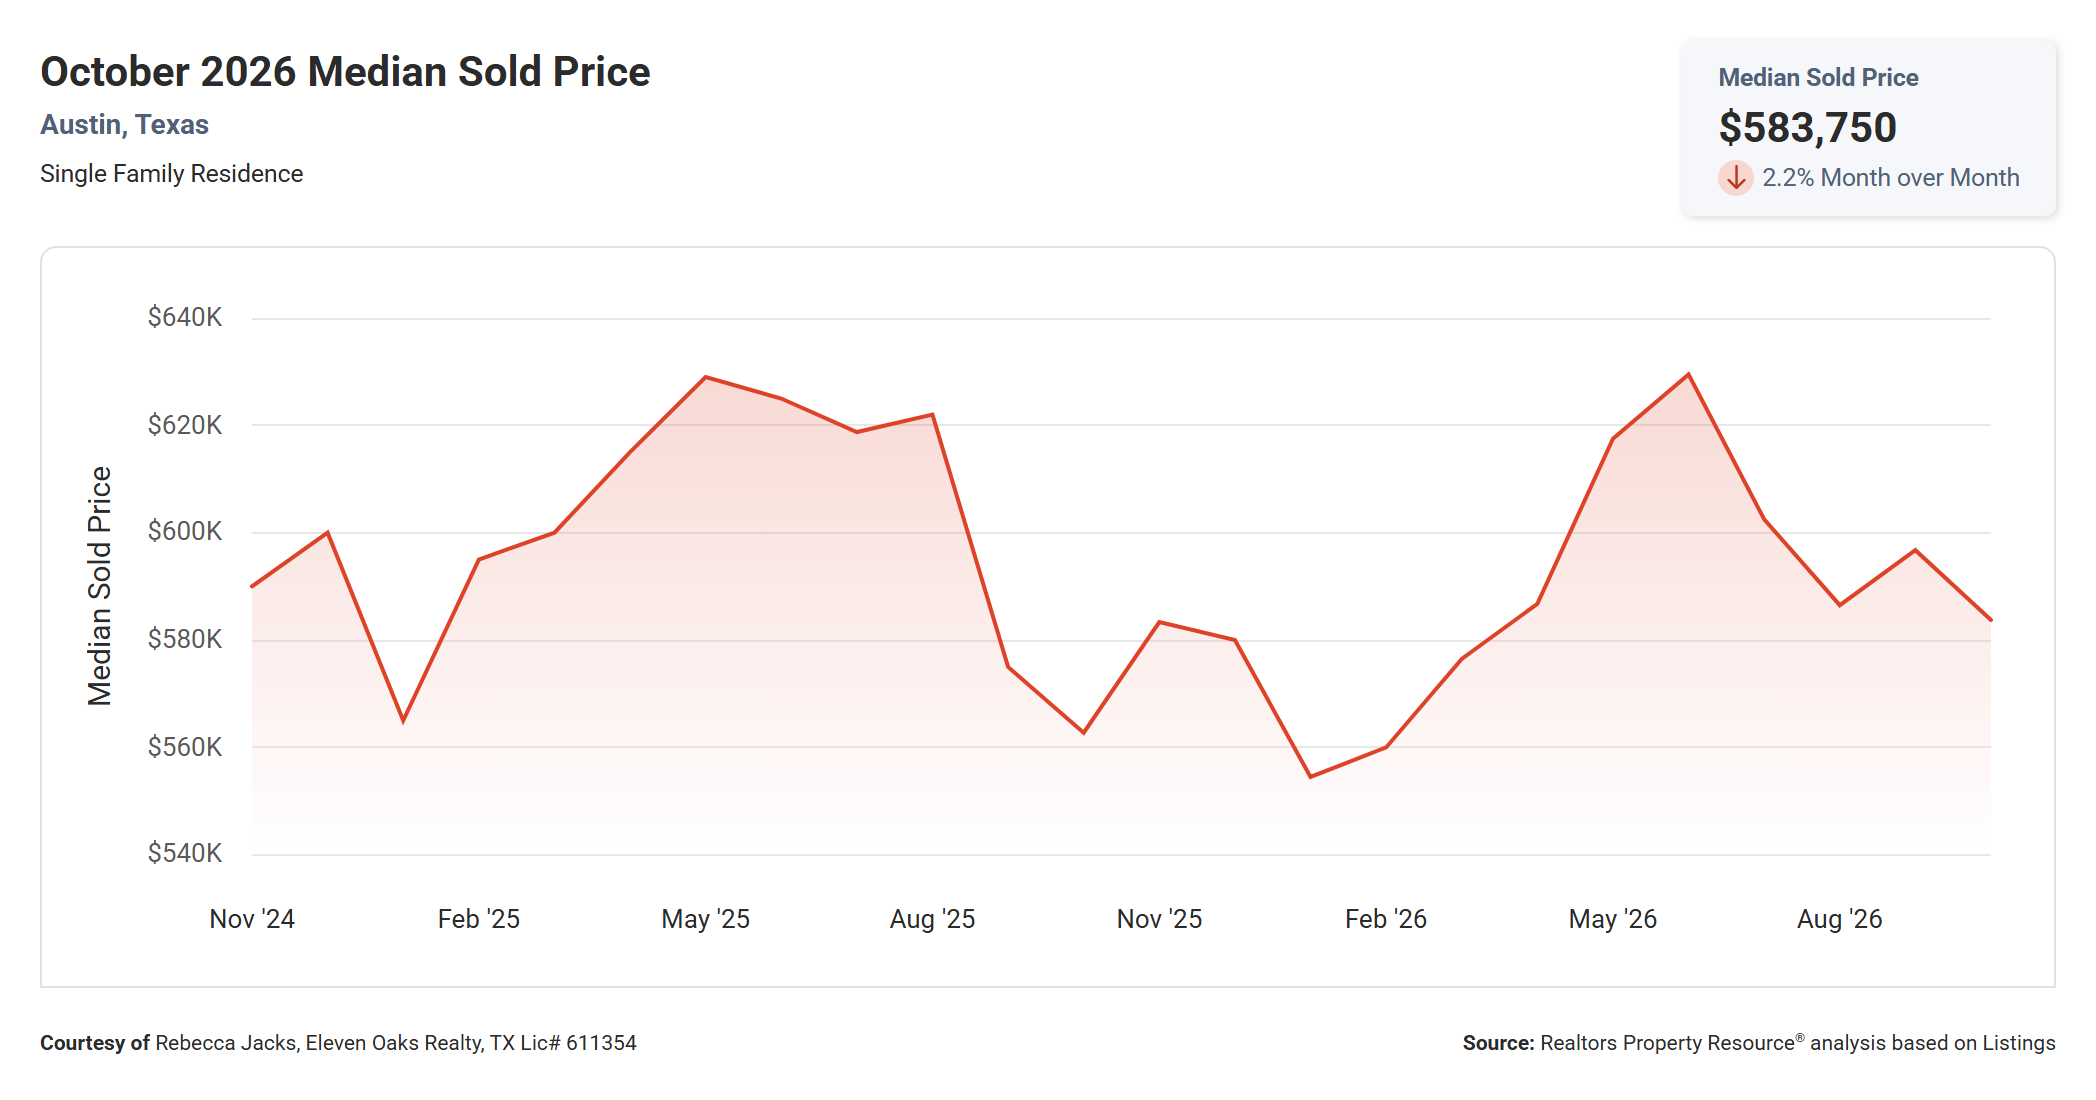
The median sold price for a single-family home in Austin was $583,750 in October 2026, down 2.2% from $596,750 in September and up 3.7% from $562,750 in October 2025.
Looking at the two-year chart, Austin’s median sold price follows a clear seasonal pattern. Prices climbed through the spring of both years, peaking near $629,000 in May 2025 and again near $630,000 in June 2026, then cooled through late summer and fall. The low point on the chart was roughly $555,000 in January 2026. October 2026 lands well above that winter low and above the same month last year.
For you as a buyer, a $21,000 increase over October 2025 is a reminder that Austin prices have stabilized and are not continuing to fall the way some headlines suggest. For sellers, the year-over-year gain is encouraging, though the month-over-month dip shows that fall pricing needs to reflect the slower season.
Watch the next two months closely. November and December historically bring the softest prices of the year in Austin, and the size of that seasonal dip will tell us a lot about how 2027 starts.
Median Active List Price Down 7.7% Year Over Year
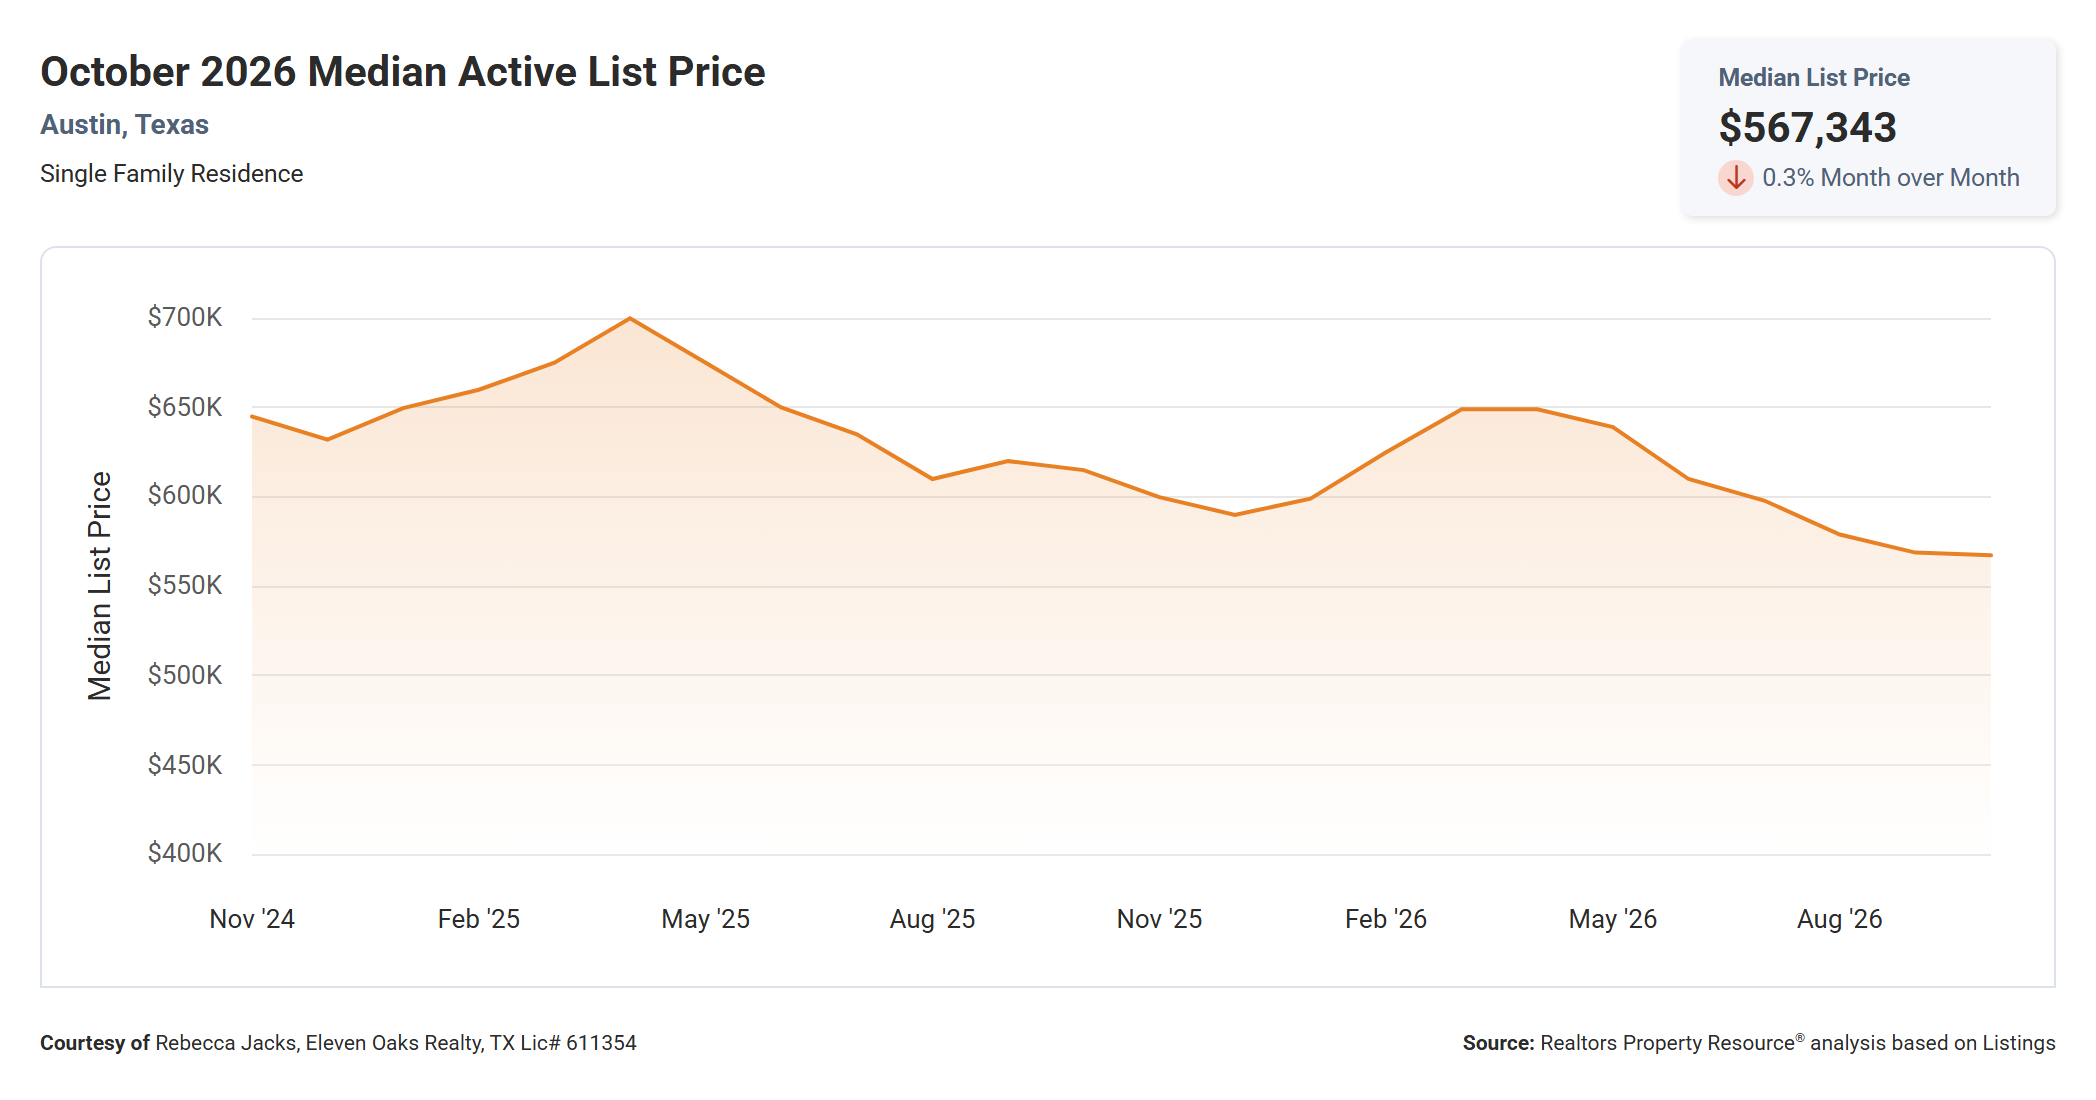
The median active list price in Austin was $567,343 in October 2026, down 0.3% from $568,890 in September and down 7.7% from $615,000 in October 2025.
Asking prices have declined steadily since the spring. Median list prices peaked around $650,000 in March and April 2026 and have drifted lower every month since. Today’s median list price is the lowest point on the two-year chart, and it sits below the median sold price for the month.
That gap tells an interesting story. The homes still sitting on the market are, on the whole, priced lower than the homes that actually sold in October. Sellers of higher-priced homes are getting deals done, while much of the remaining inventory is concentrated in lower price ranges. You will see this reflected in the price range data later in the report.
For buyers, a lower median asking price means more choices in the mid-$500s than you had a year ago. For sellers, it means your listing is competing against more modestly priced homes, so your price needs to make sense next to them.
Median Price Per Square Foot Down 2.8% Year Over Year
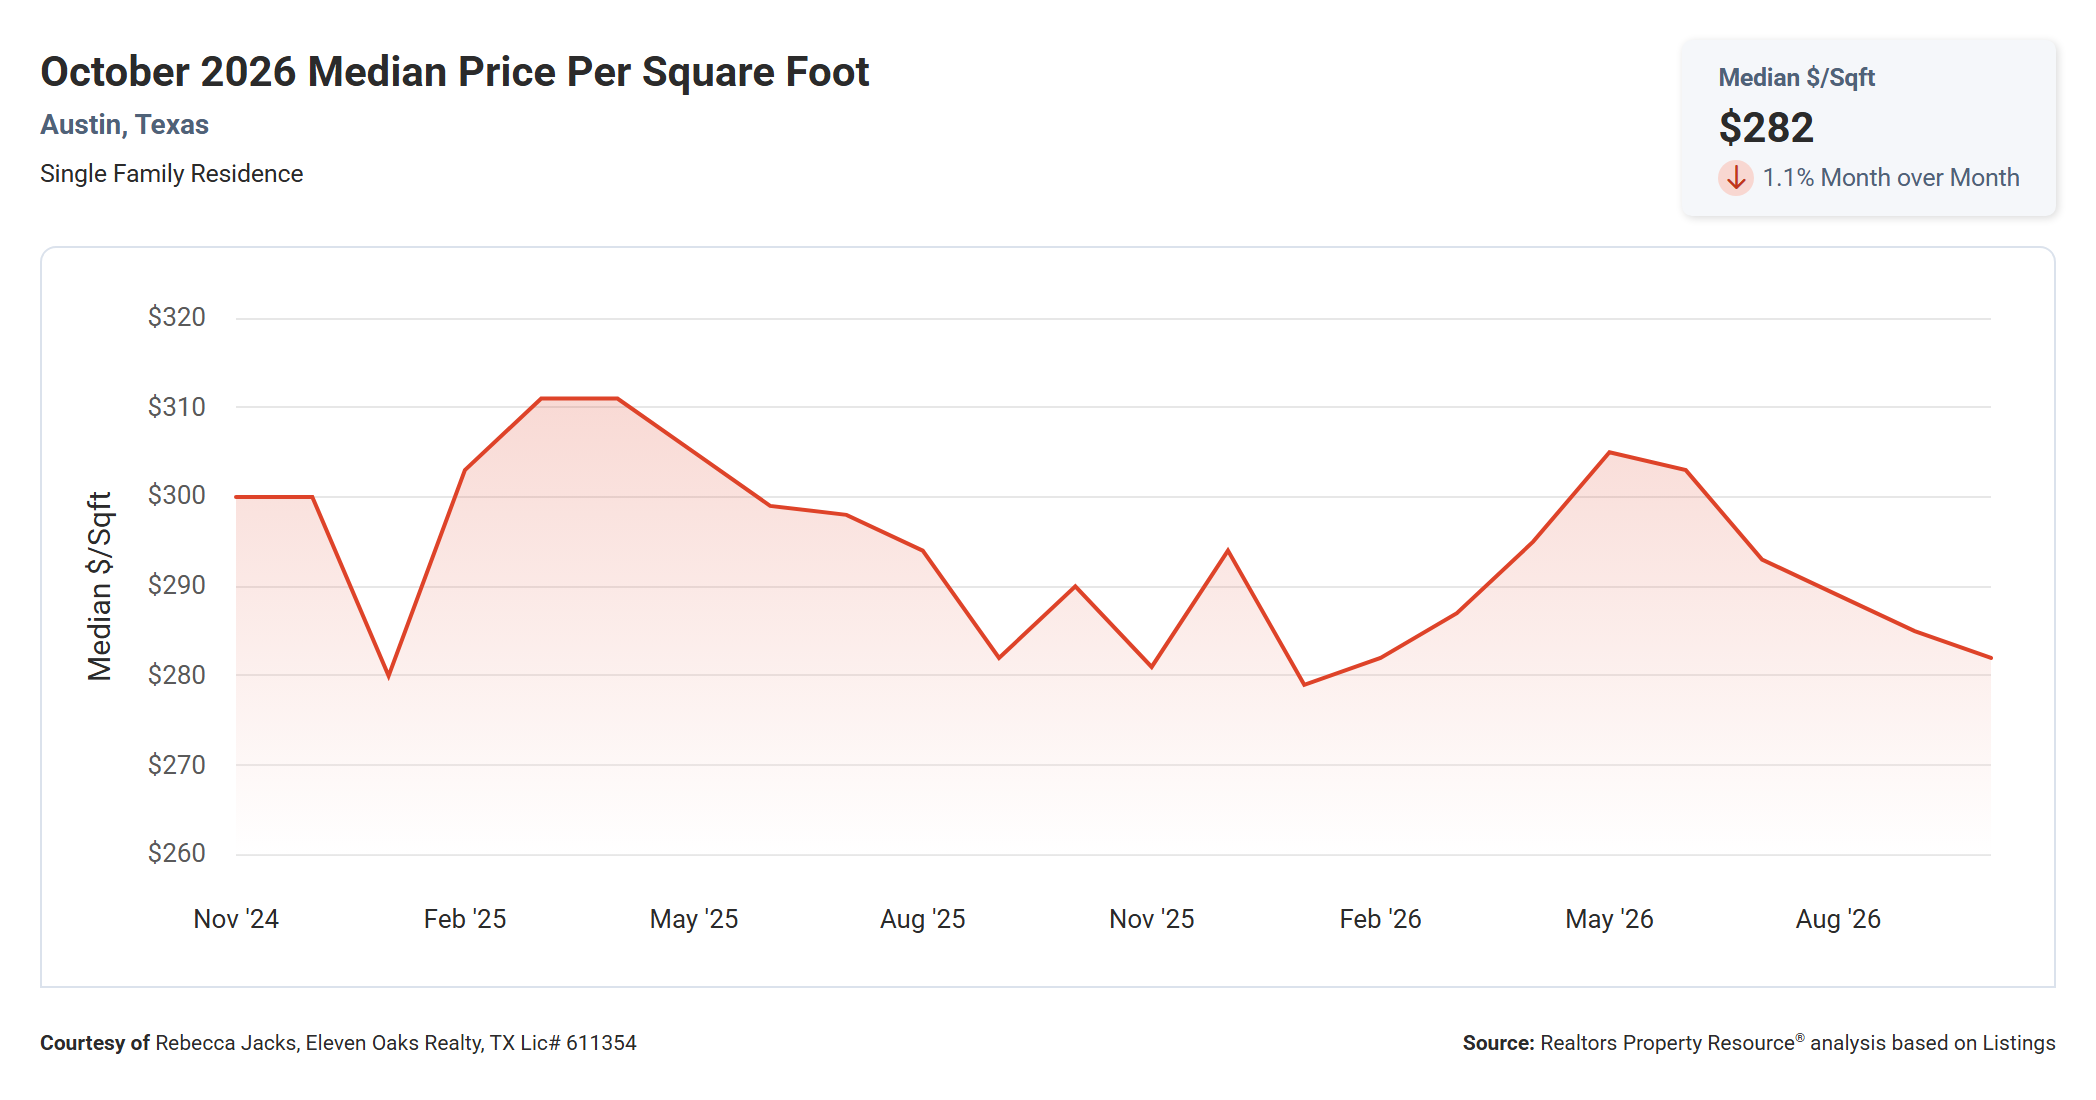
The median price per square foot in Austin was $282 in October 2026, down 1.1% from $285 in September and down 2.8% from $290 in October 2025.
Price per square foot peaked near $311 in March and April 2025 and reached a smaller high around $305 in May 2026. Since then it has stepped down each month to $282, close to the two-year low of about $279 recorded in January 2026.
So how can the median sold price be up year over year while price per square foot is down? The answer is home size. The typical home that sold in October was larger than the typical home that sold a year ago, so buyers paid a bit more in total while paying a bit less for each square foot. For you as a buyer, that means your dollar is stretching slightly further on space than it did last fall.
Average Sold to List Price Essentially Flat Year Over Year
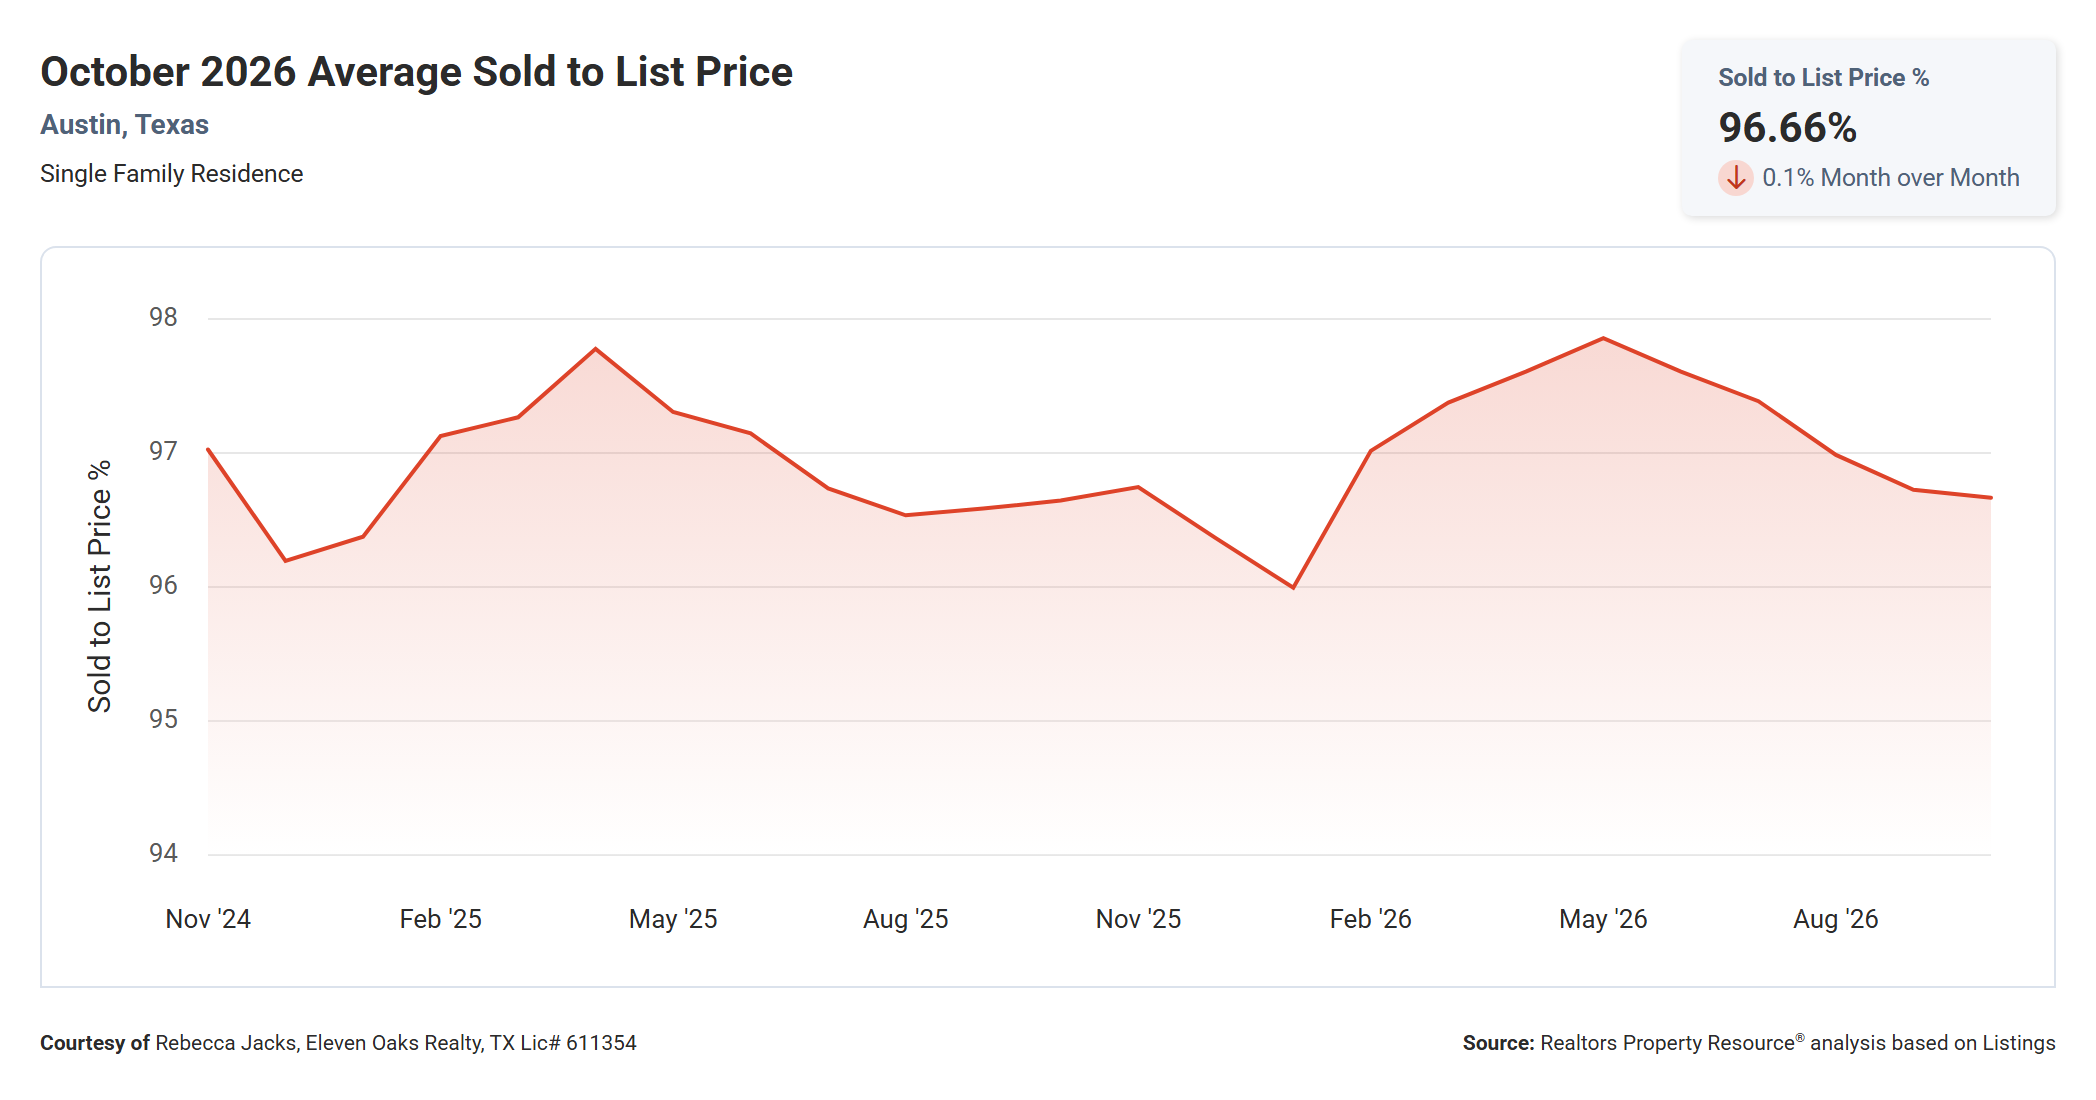
Austin homes sold for an average of 96.66% of their final list price in October 2026, down 0.1% from 96.72% in September and essentially flat compared to 96.64% in October 2025.
The two-year chart shows this ratio moving within a narrow band between about 96% and 98%. It peaked near 97.9% in May 2026, dipped to its low of about 96% in January 2026, and has eased back toward the middle of the range this fall.
In practical terms, a 96.66% ratio means the typical buyer negotiated about 3.3% off the final asking price. On a $583,750 home, that is roughly $19,500. That level of negotiation room has been remarkably consistent for over a year, which tells you the market has settled into a predictable rhythm.
Median Time to Sell Down 21.2% Year Over Year
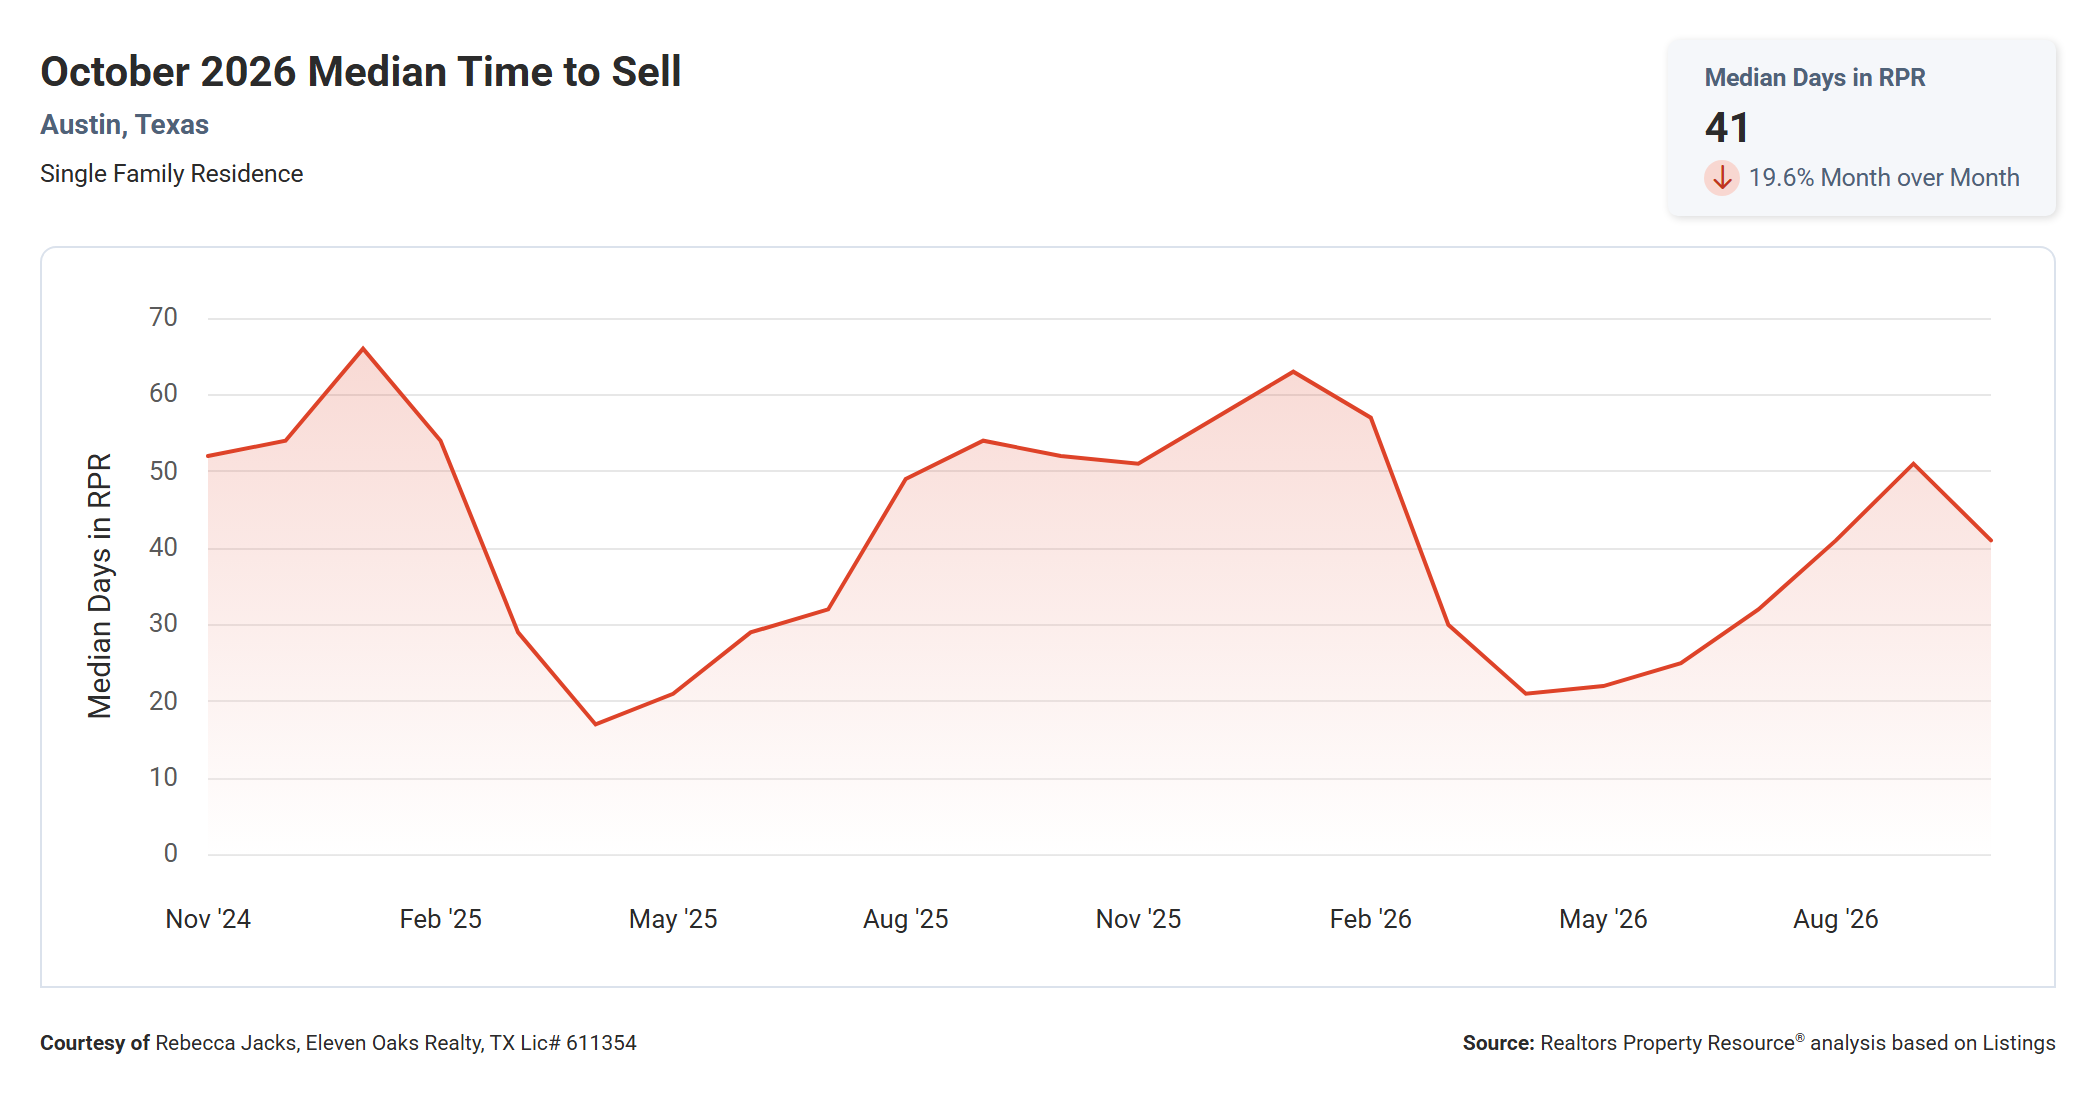
The median time to sell an Austin home was 41 days in October 2026, down 19.6% from 51 days in September and down 21.2% from 52 days in October 2025.
This is one of the more encouraging numbers in the report. The chart shows days on market climbing from a spring low of about 21 days to 51 days in September, which is typical for late summer. Instead of continuing to rise into the fall, the median dropped sharply in October. A year ago, days on market kept rising into January and peaked at 63 days.
Faster sales in October suggest that the homes that did sell were priced in line with buyer expectations. If you are selling, this is good news, though it applies mainly to homes that hit the market at the right price. If you are buying, it means well-priced homes are not lingering, even in a slower month.
Months Supply of Inventory Down 14.4% Year Over Year
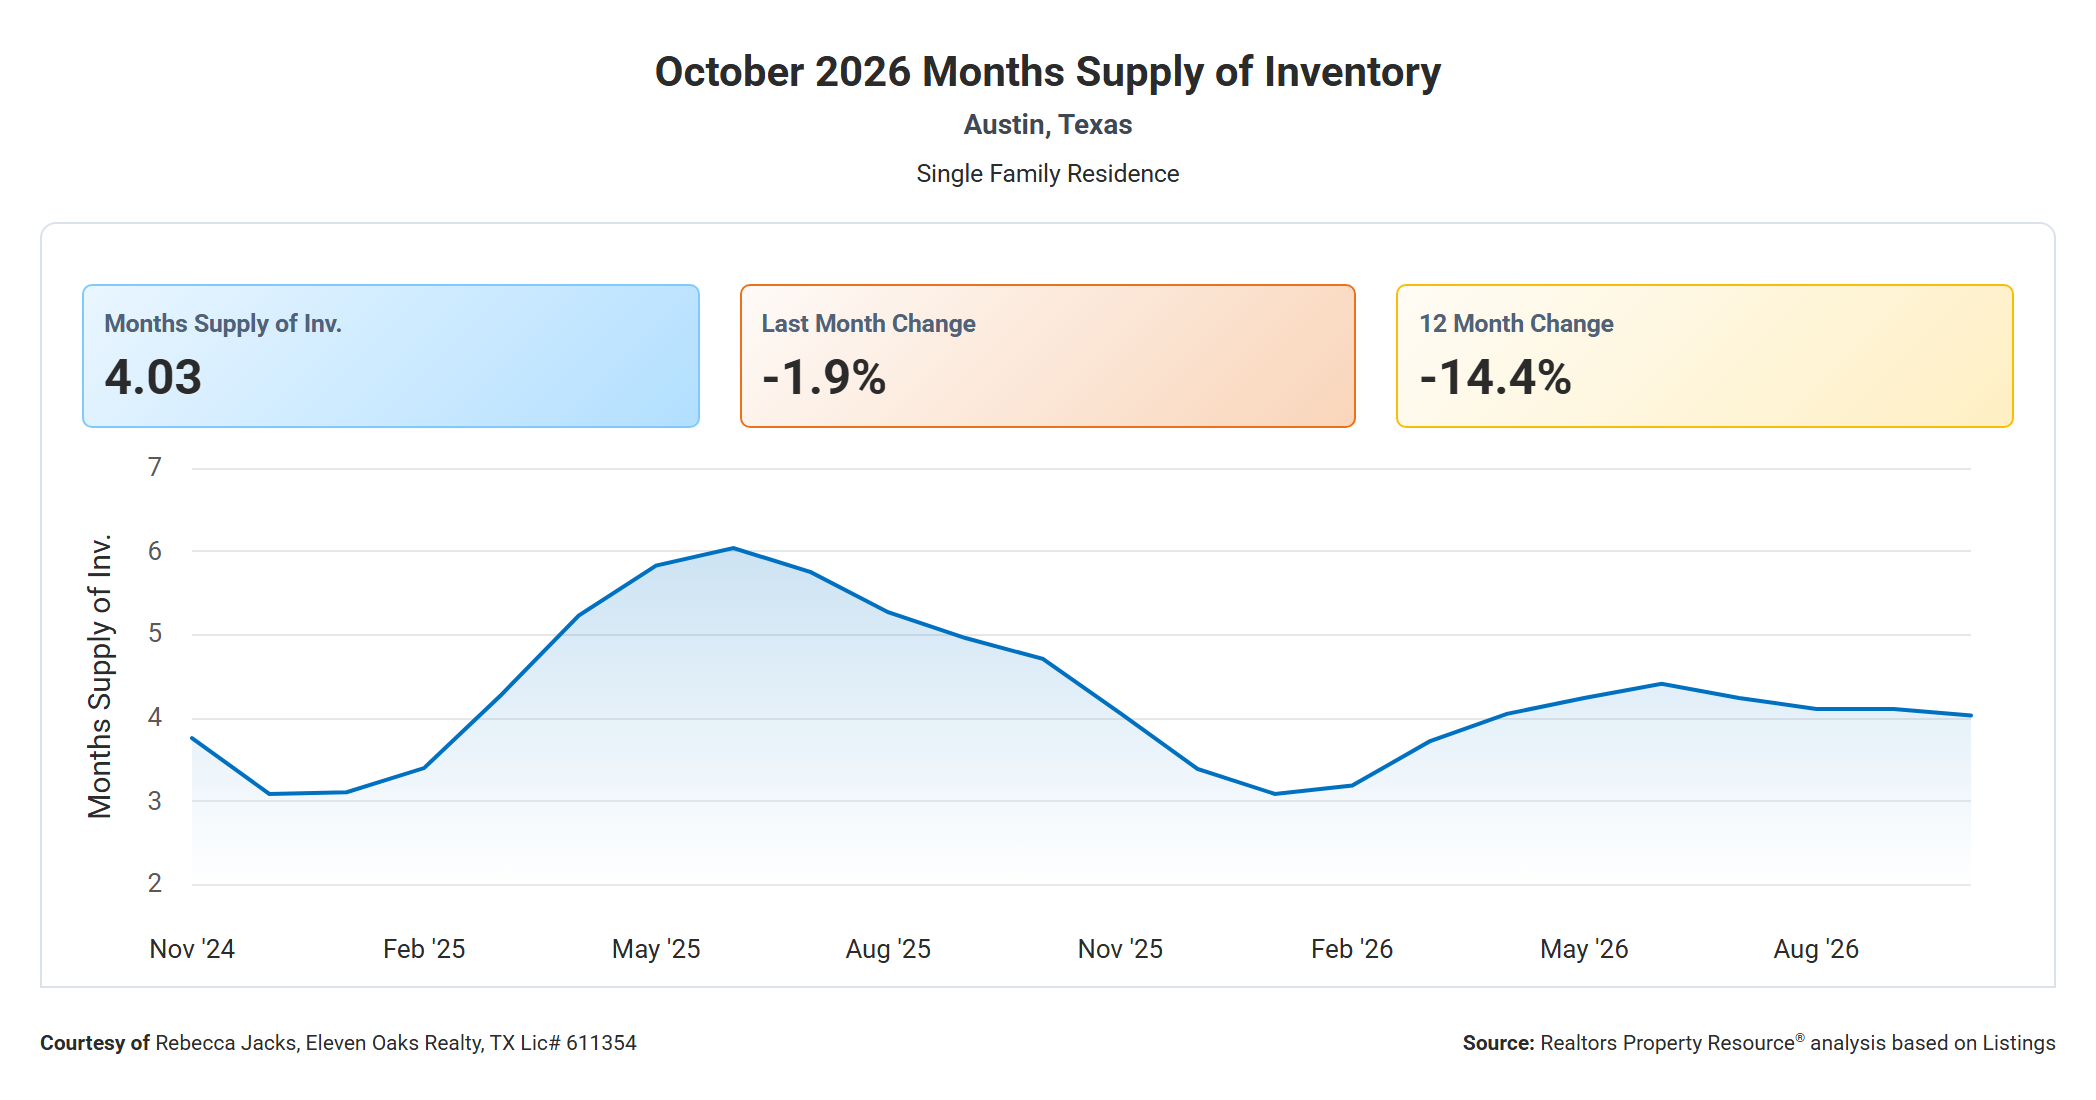
Austin had 4.03 months supply of inventory in October 2026, down 1.9% from 4.11 months in September and down 14.4% from 4.71 months in October 2025.
The chart shows a very different 2026 from 2025. Last year, inventory surged to just over six months in June 2025, which briefly put Austin in buyer’s market territory. This year, months supply has stayed in a much tighter range between about 3.1 and 4.4 months, never coming close to last year’s peak.
A lower months supply means the market has more balance between buyers and sellers than it did a year ago. Sellers face less competition than they did in 2025, and buyers are no longer seeing the overflowing inventory that gave them so much leverage last summer.
Active Listings Down 17.7% Year Over Year
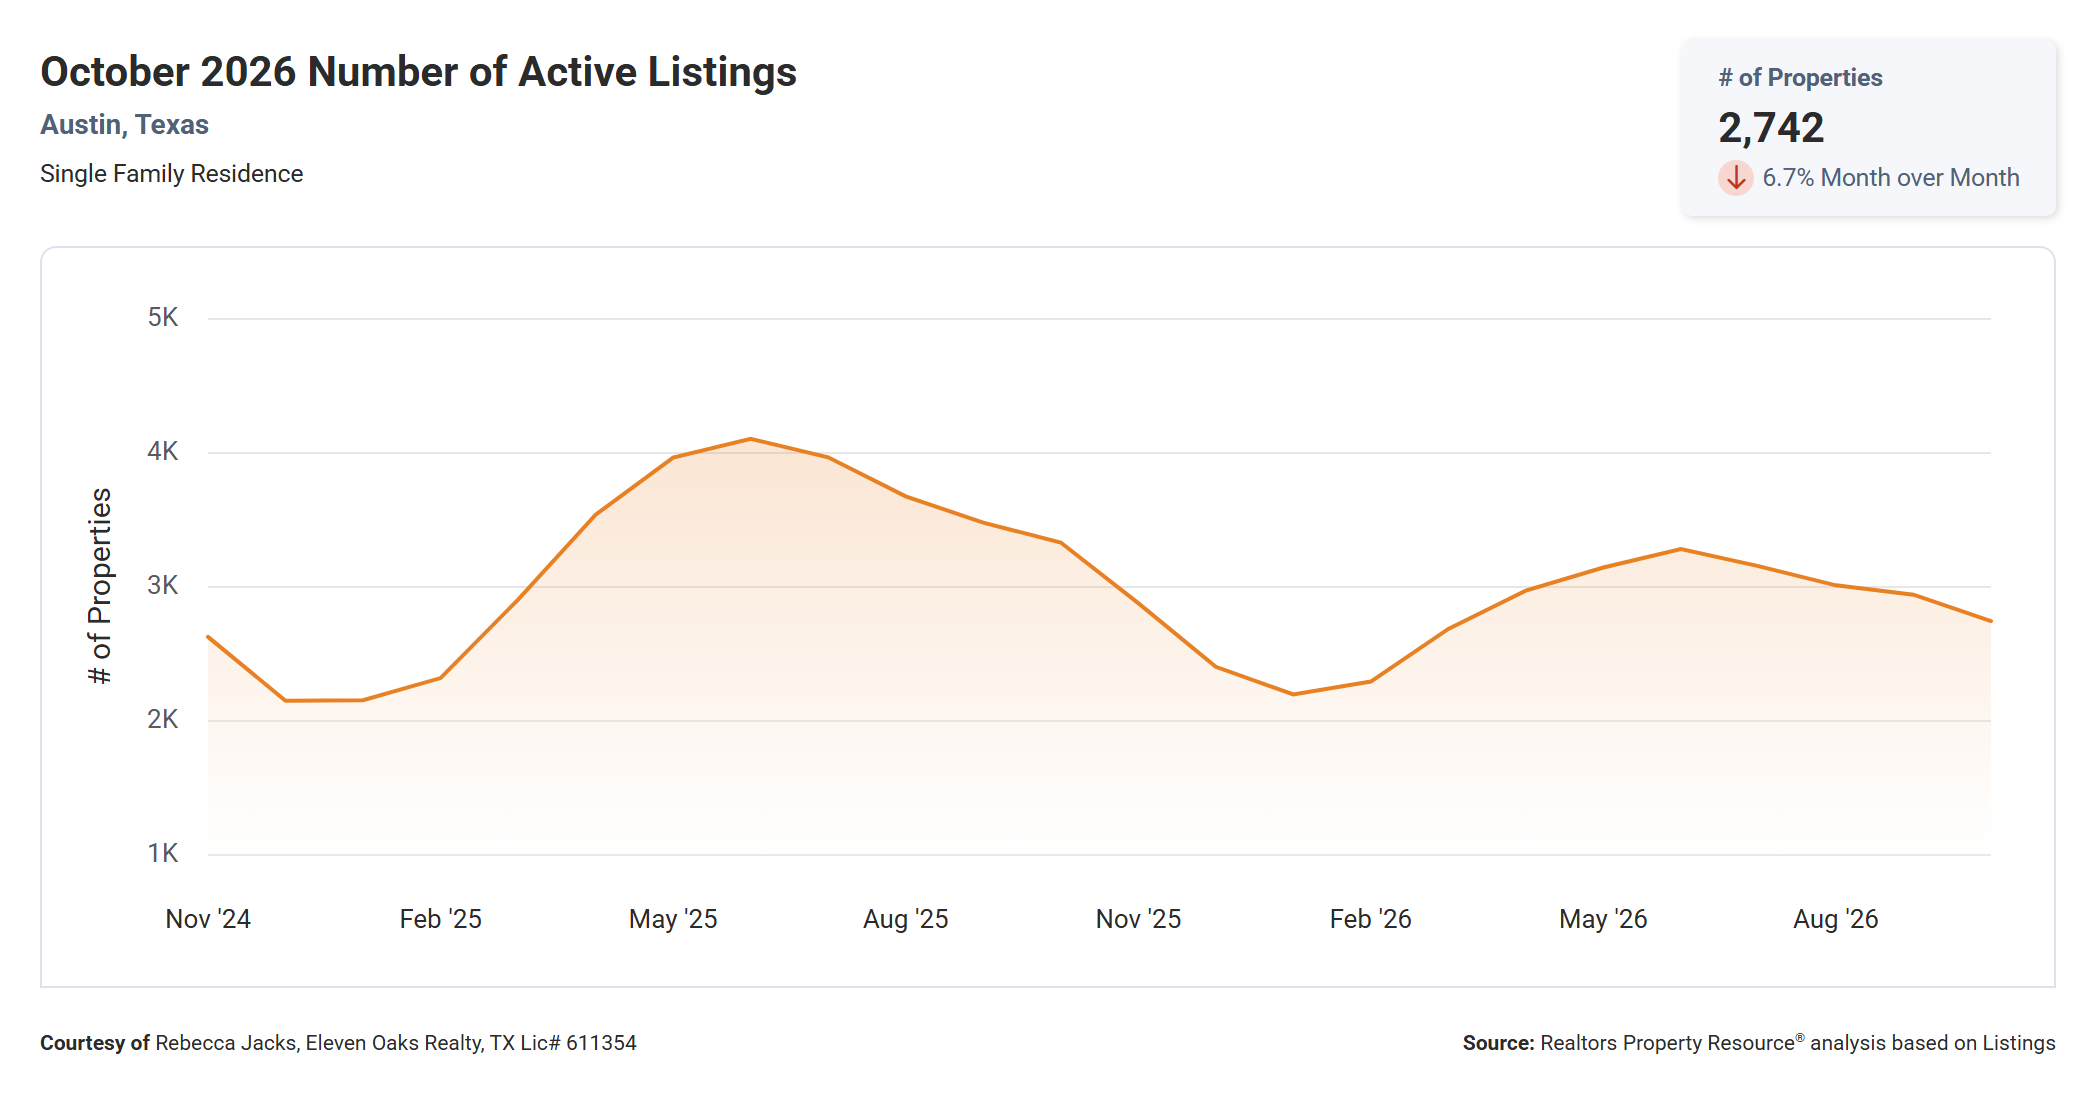
There were 2,742 active single-family listings in Austin in October 2026, down 6.7% from 2,940 in September and down 17.7% from 3,330 in October 2025.
Active inventory peaked at just over 4,000 homes in June 2025. The 2026 peak, about 3,300 homes in June, was noticeably lower, and inventory has declined every month since. Unlock MLS showed a similar 2,768 active listings as of November 10.
Fewer active listings is the main reason months supply is lower than it was a year ago. Sellers are being more selective about when they list, and many homes that would have sat on the market last year have either sold or been pulled. For buyers, this means fewer options than last fall, though still far more choice than in the tight markets of 2021 and 2022.
New Listings Down 20.4% Year Over Year
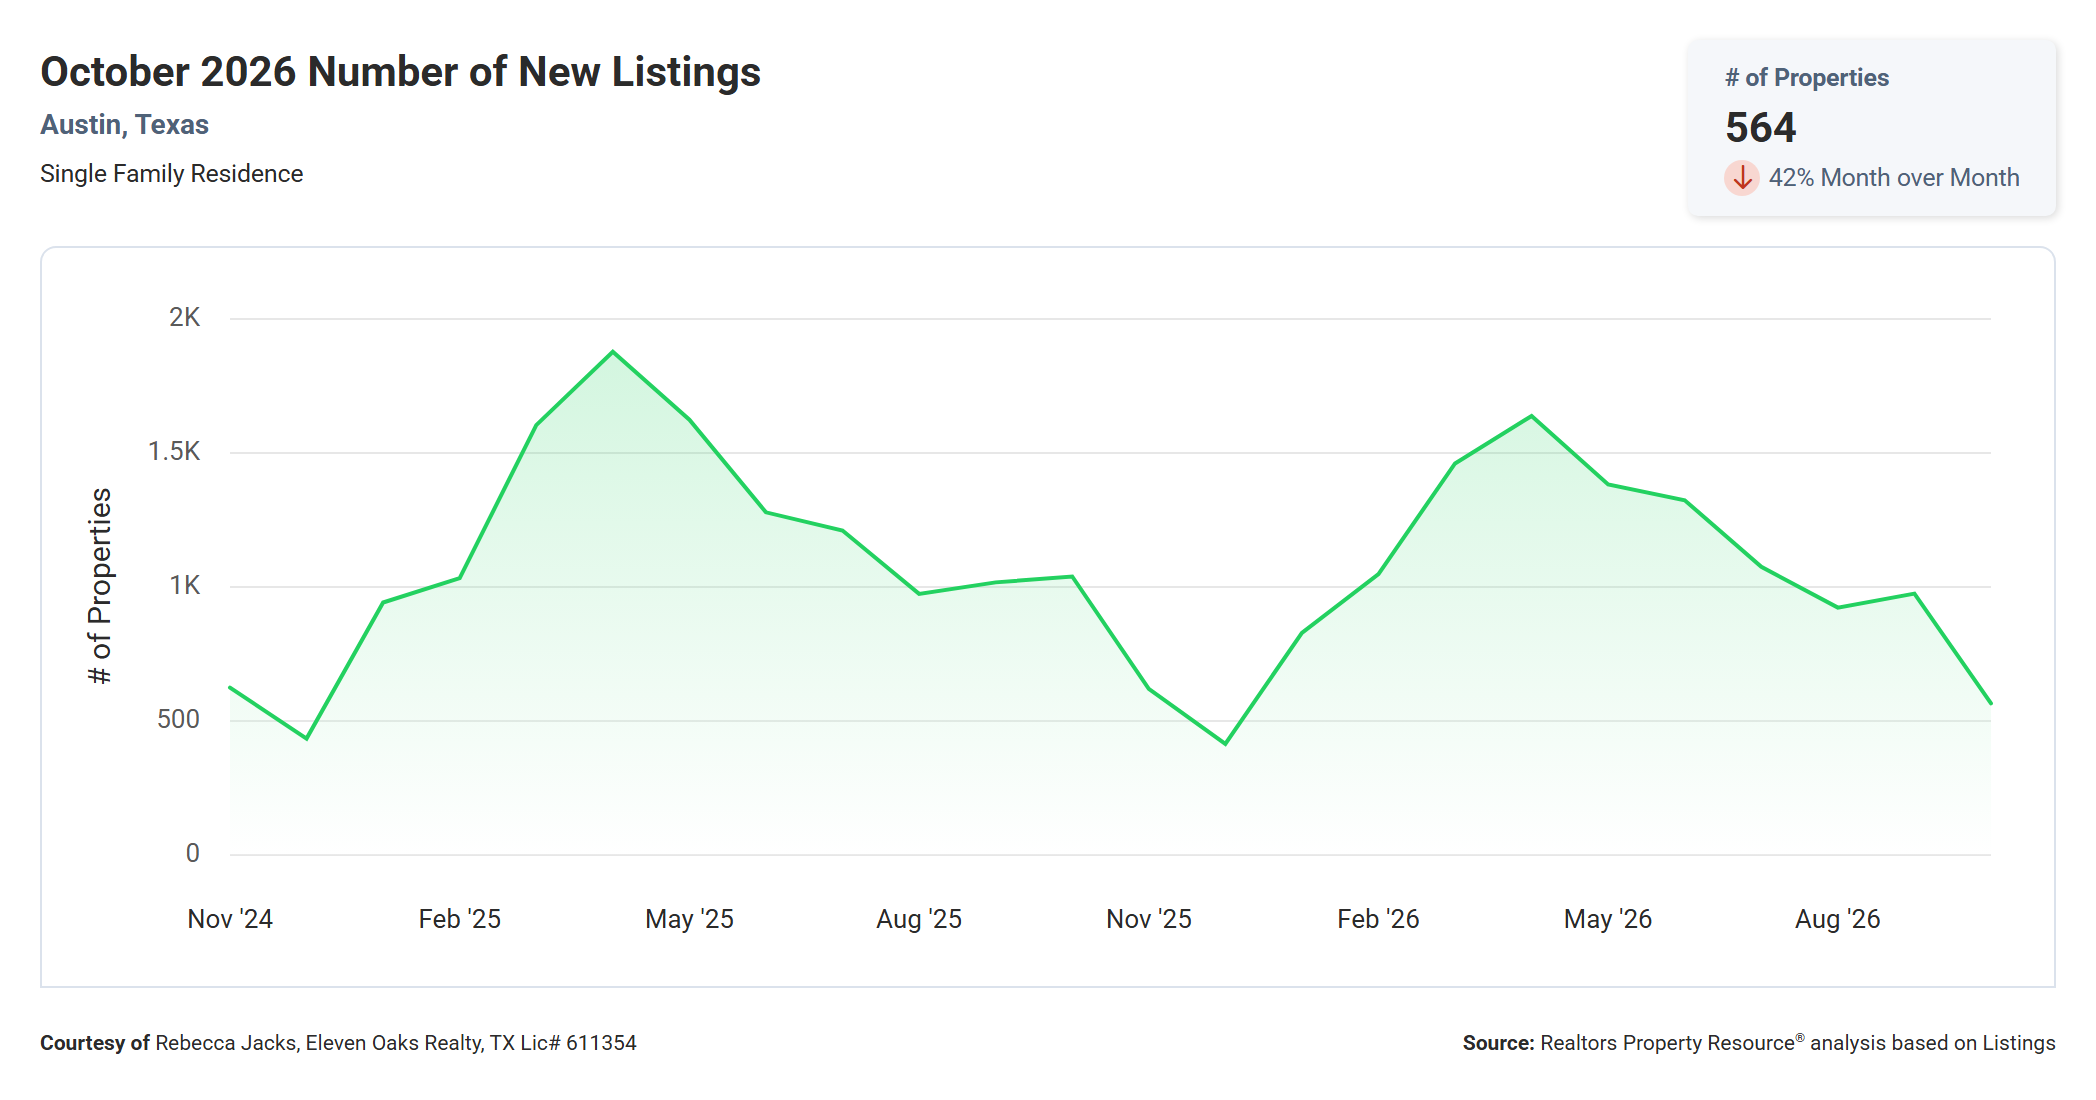
According to Unlock MLS, 832 new single-family listings came on the market in Austin in October 2026, down 18.2% from 1,017 in September and down 20.4% from 1,045 in October 2025.
The RPR graph above shows 564 new listings, down 42% month over month. That figure appears to reflect an incomplete data pull for October, and because RPR does not refresh its numbers until next month, we are relying on the MLS count here. Even the MLS figure shows a meaningful drop in new supply.
New listings follow the same seasonal curve every year, rising into spring and falling into winter. What stands out this October is how much lower new listings are than in October 2025, when 1,045 homes came on the market. Fewer sellers are listing in the fall, which is helping keep inventory in check.
For buyers, fewer new listings means less fresh inventory to choose from over the holidays. For sellers, it means less new competition, which can work in your favor if your home is ready.
New Pending Listings Down 16.0% Year Over Year
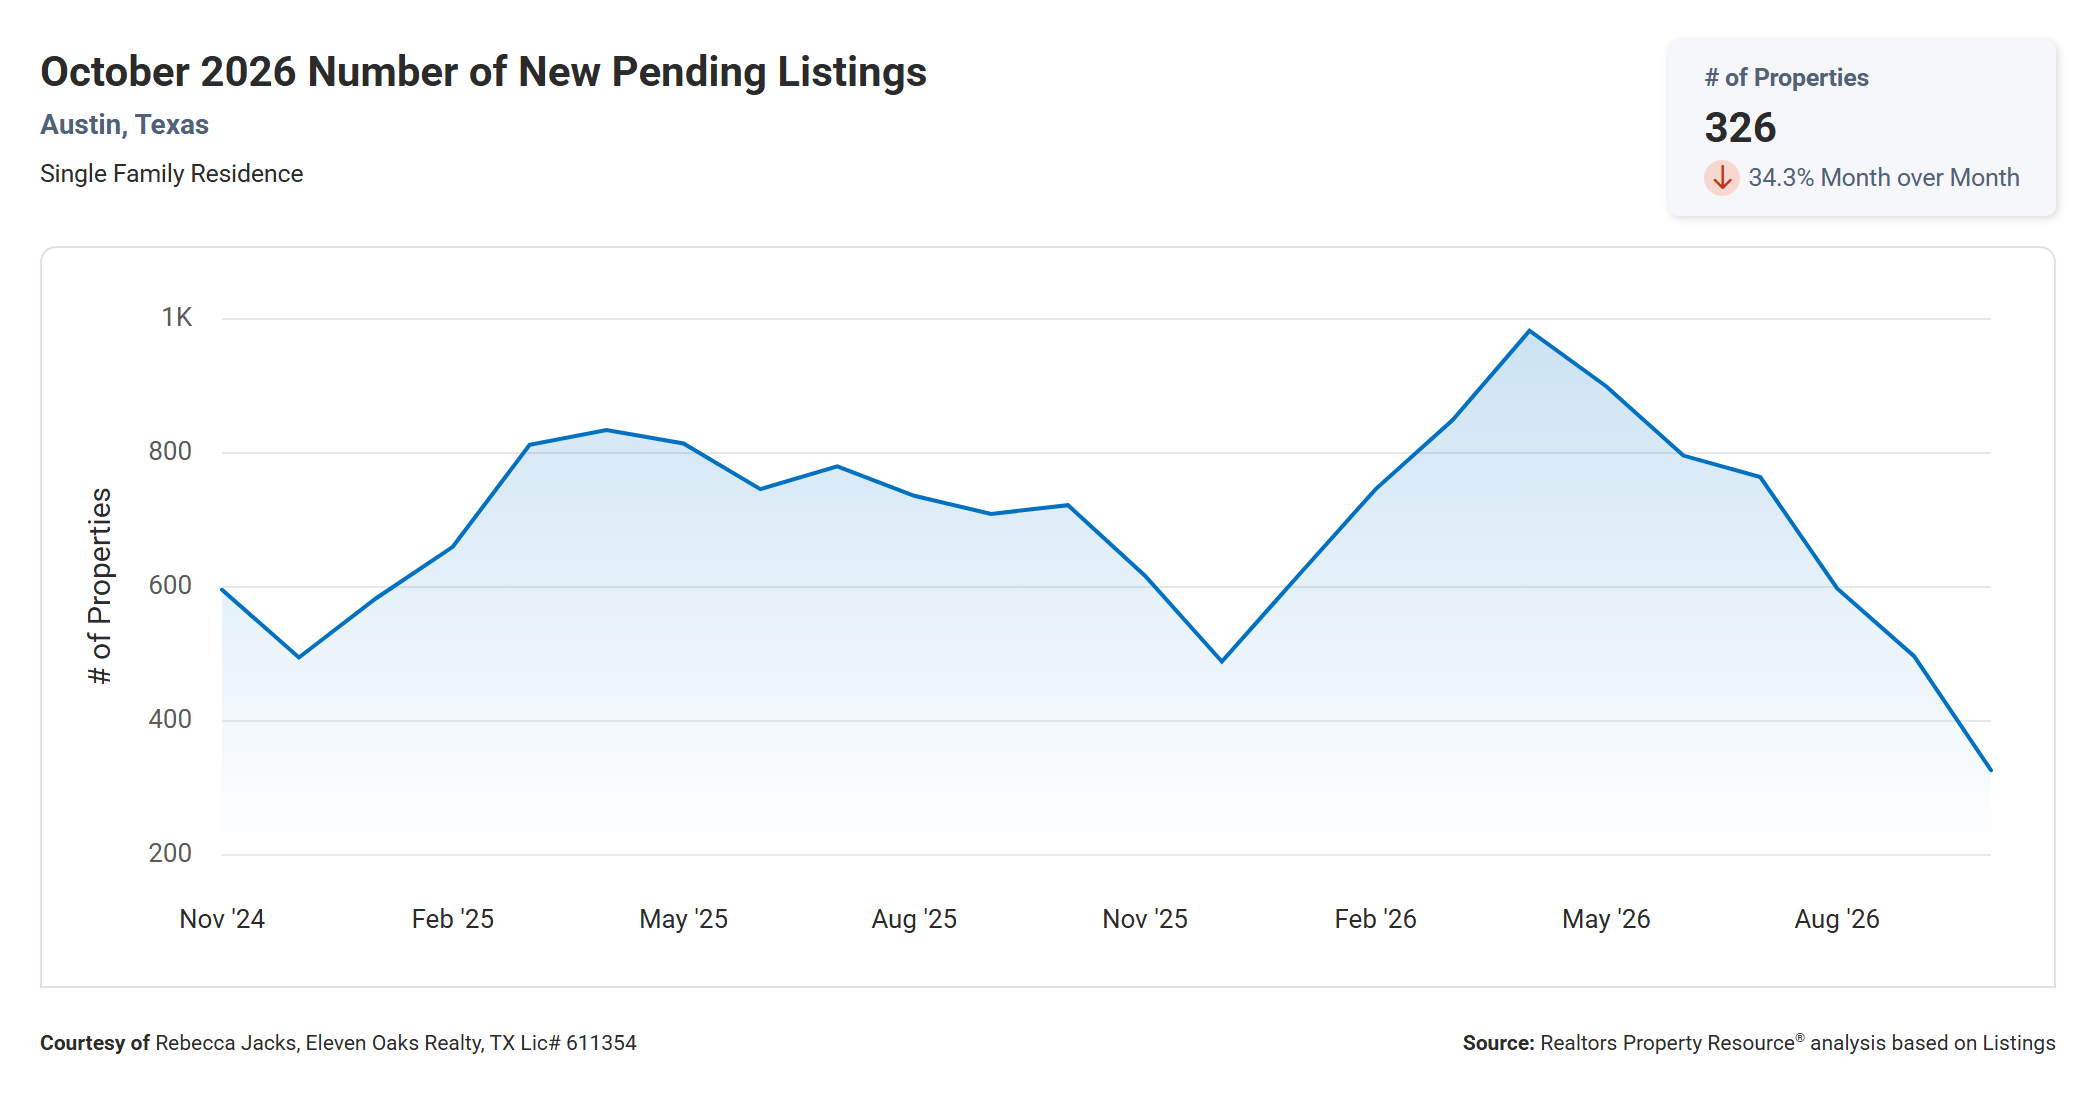
Unlock MLS recorded 581 homes going under contract in Austin in October 2026, down 1.7% from 591 in September and down 16.0% from 692 in October 2025.
RPR’s graph shows 326 new pending listings, down 34.3% month over month. Like the sold and new listing counts, that number looks incomplete for October, so the MLS figure is the better read on buyer activity this month.
The MLS data tells a calmer story than the RPR graph. New contracts were nearly unchanged from September, which suggests buyer demand held steady into the fall even as fewer homes came on the market. Pending sales did fall compared to last October, though, and that decline lines up with the 16.4% drop in closed sales.
Pending contracts are a leading indicator of closings over the next 30 to 45 days. With 581 new contracts in October, expect November closings to land in a similar range, roughly in line with seasonal patterns.
Homes Sold Down 16.4% Year Over Year
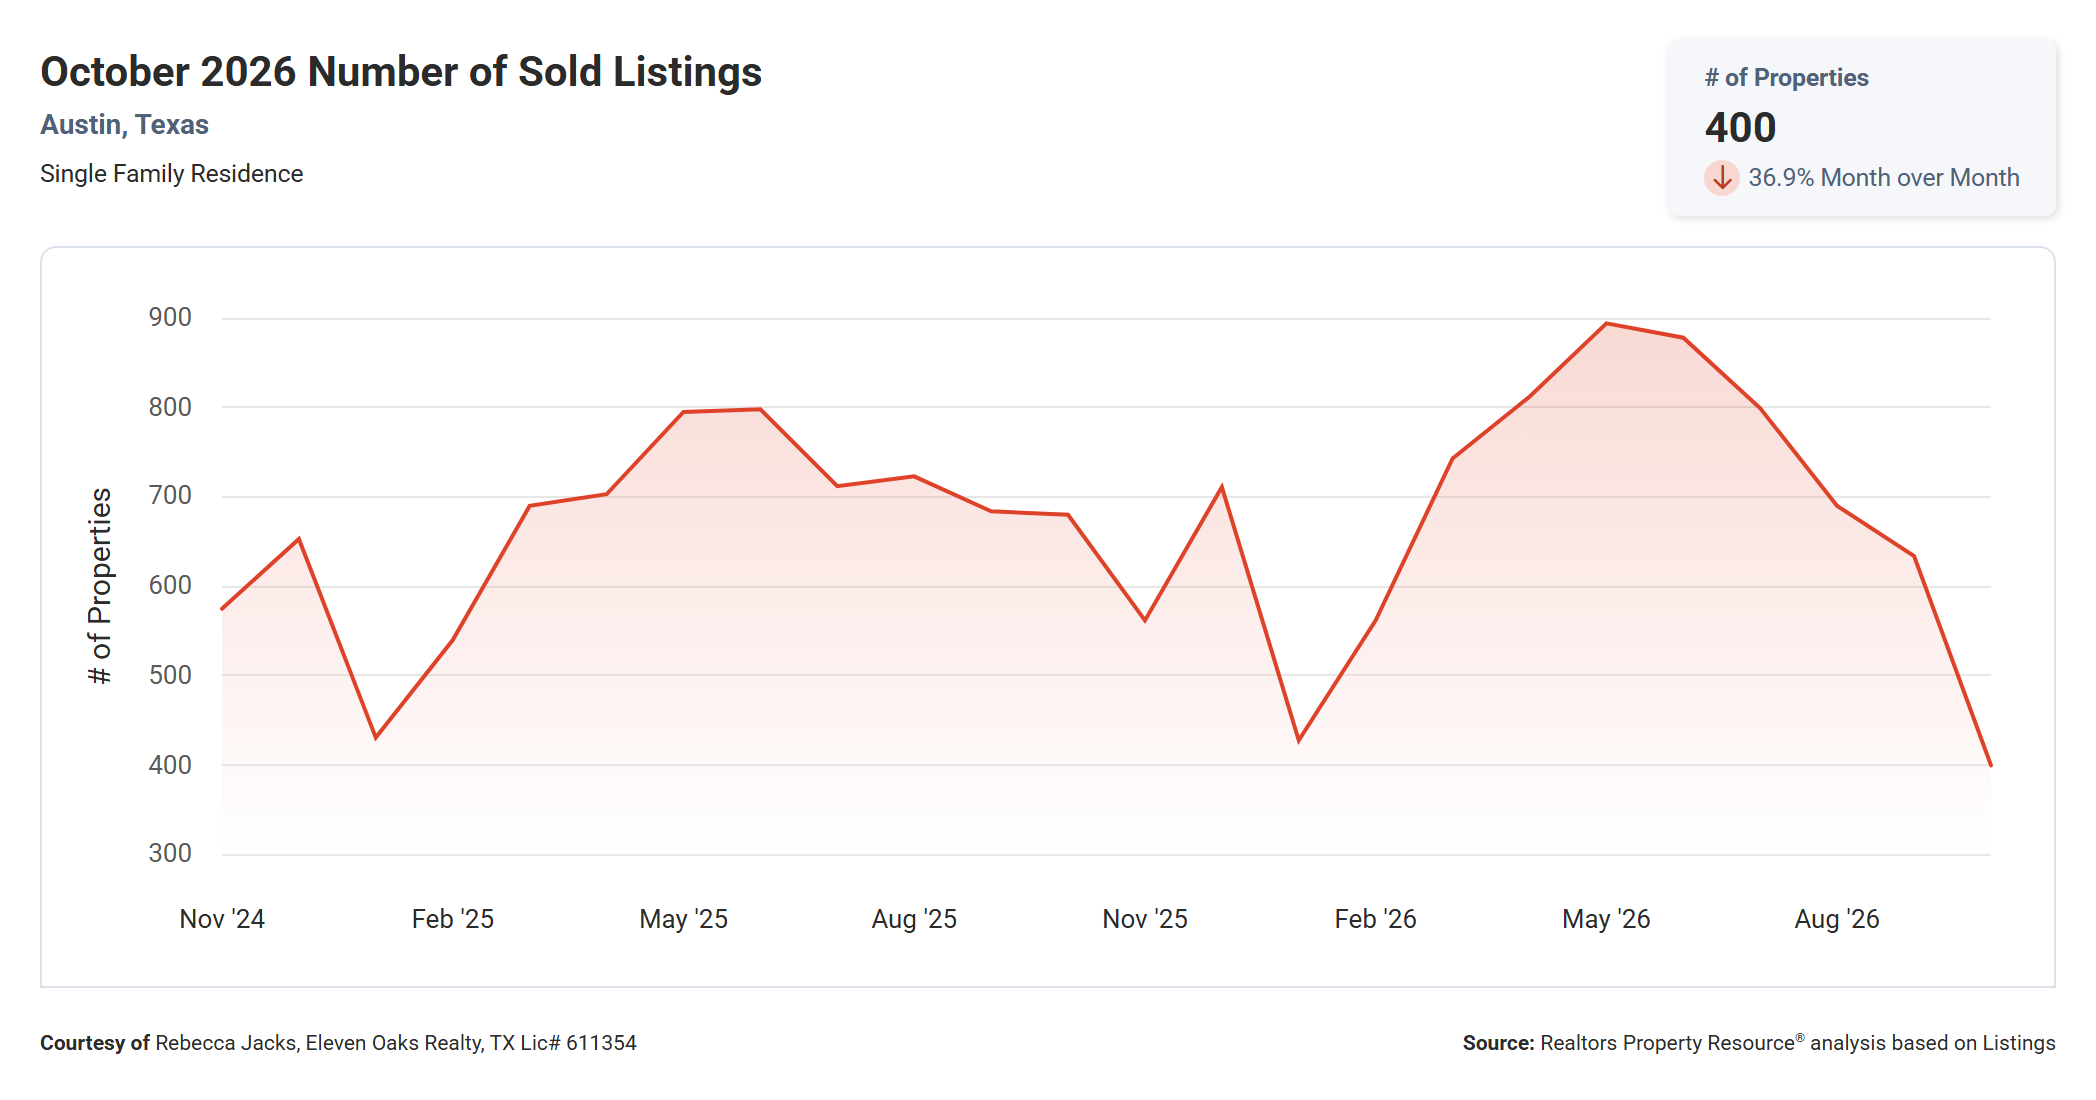
Unlock MLS reported 582 single-family home sales in Austin in October 2026, down 13.1% from 670 in September and down 16.4% from 696 in October 2025. The ABoR MLS statistics sheet shows 596 closed sales for the same period.
The RPR graph above shows 400 sold homes, down 36.9% month over month. That number is well below both MLS sources and appears to be an incomplete count for October. RPR will not update it until next month, so we are using the MLS figures as the accurate measure of sales.
Closed sales typically peak in May and June and decline through the fall. This year followed that pattern, with closings topping out above 900 in May 2026 before tapering off. The year-over-year decline is real, though. October 2026 closings were the lowest October total in the four years of MLS data we track (602 in 2023, 640 in 2024, and 696 in 2025).
Total Sales Volume Down 18.2% Year Over Year
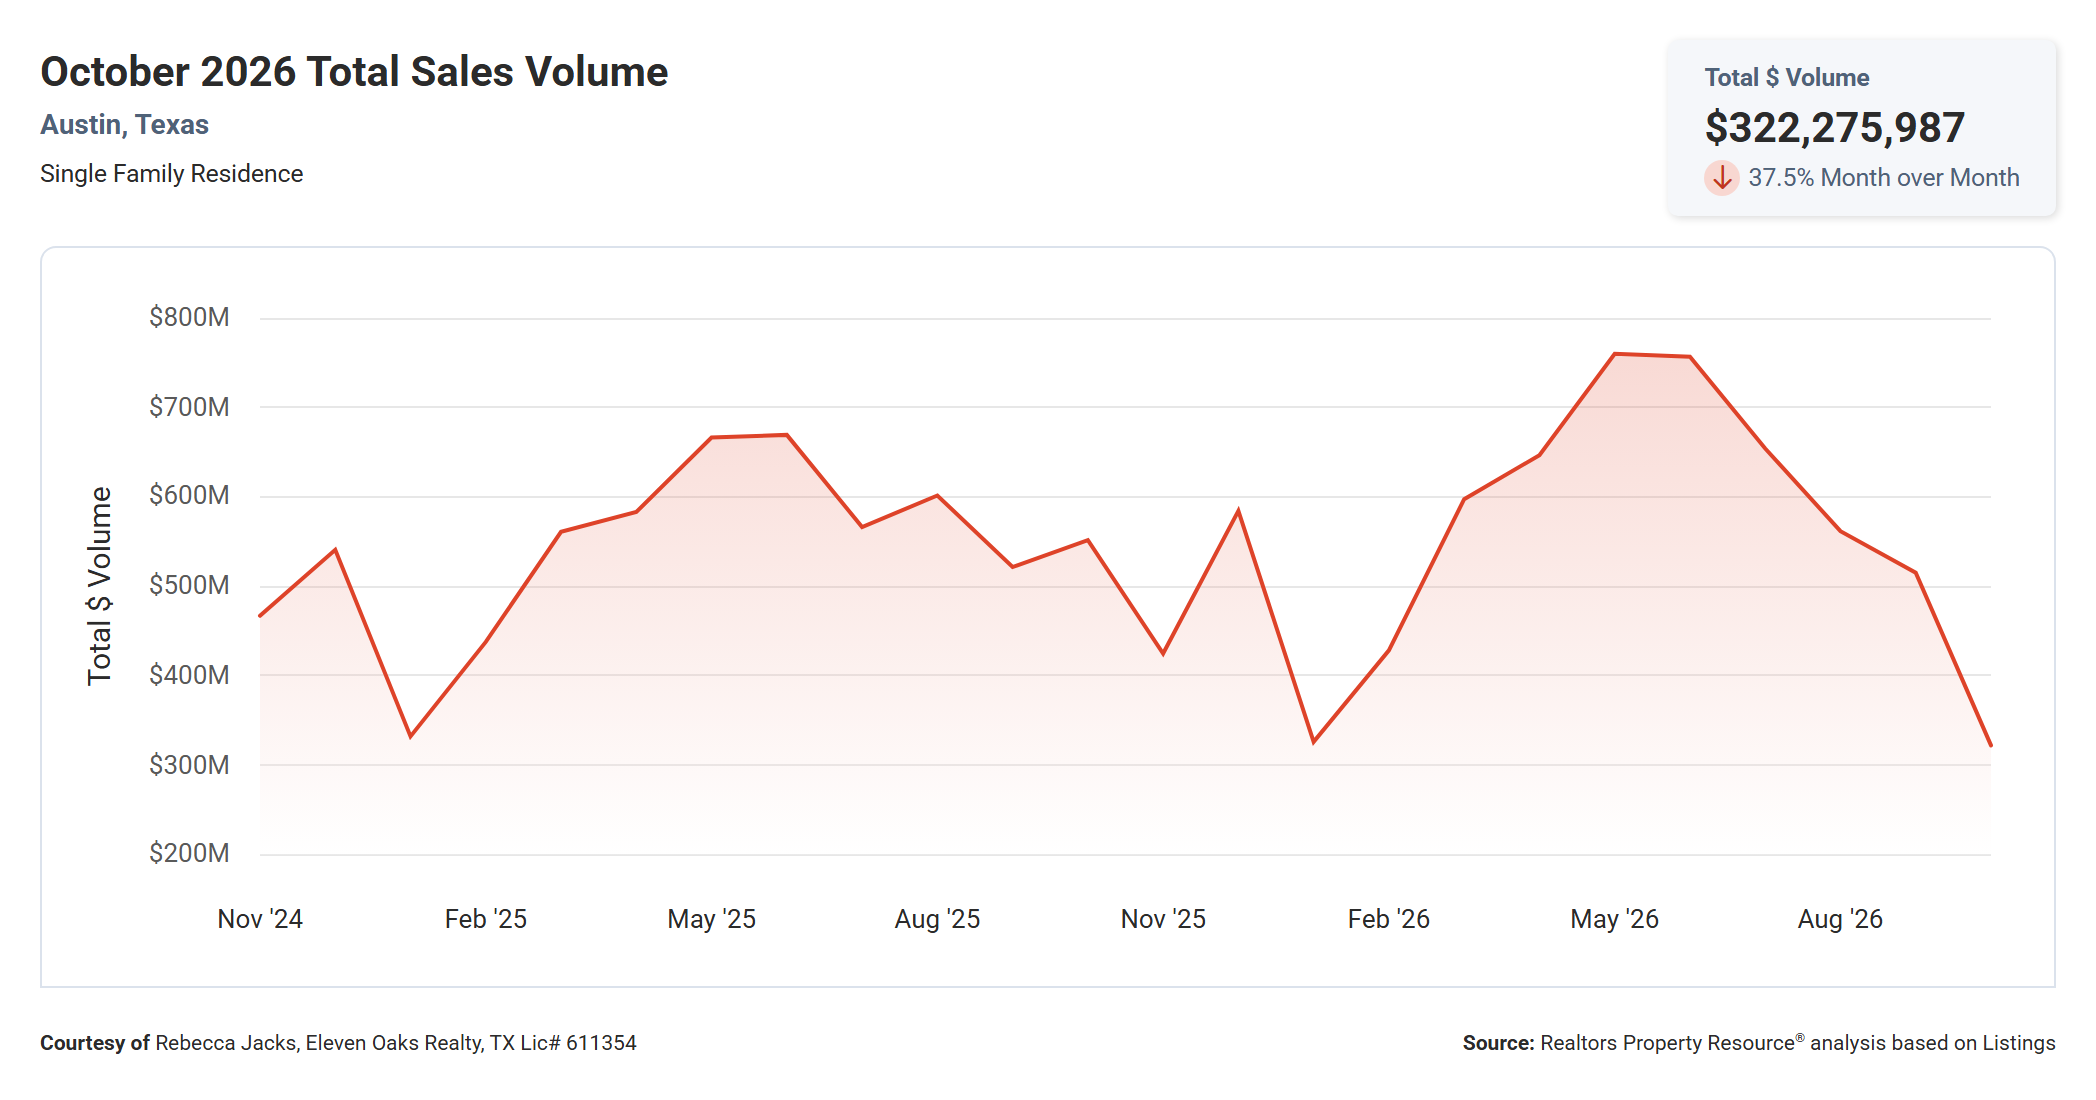
Total sales volume for Austin single-family homes was $473.5 million in October 2026, according to Unlock MLS, down 15.6% from $560.8 million in September and down 18.2% from October 2025.
The RPR graph shows $322,275,987 in total volume, down 37.5% month over month. Because sales volume is the number of sales multiplied by price, the same incomplete sales count that affected RPR’s sold listings figure carries through to this graph.
Sales volume is falling slightly faster than the number of sales, which reflects a lower average sale price. The average sale price in October was $813,593, down 2.2% from a year ago, even as the median rose. That combination tells us there were somewhat fewer high-dollar sales pulling the average up this October.
October 2026 Austin Real Estate by the Numbers
The table below is pulled directly from the Austin Board of REALTORS MLS statistics for October 2026 and covers 596 closed single-family residential transactions in the city of Austin.
| Min | Max | Avg | Median | |
|---|---|---|---|---|
| Beds | 1 | 10 | 4 | 4 |
| Baths | 1 | 10 | 3 | 3 |
| Sq Ft | 460 | 12,365 | 2,308 | 2,098 |
| Lot Sq Ft | -- | 238,709 | 12,127 | 8,130 |
| List Price | $150,000 | $10,995,000 | $846,525 | $599,000 |
| LP/Sq Ft | $93.28 | $1,496.77 | $348.25 | $283.12 |
| Acres | 0.000 | 5.480 | 0.278 | 0.187 |
| Close Price | $170,000 | $10,425,000 | $812,589 | $586,750 |
| CP/Sq Ft | $105.72 | $1,378.60 | $334.60 | $277.17 |
| CP/LP% | 57.00% | 122.00% | 96.56% | 97.00% |
| CP/OLP% | 51.00% | 122.00% | 92.56% | 94.00% |
| ADOM | 0 | 602 | 59 | 39 |
The most expensive home that sold in October 2026 sold for $10,425,000 and the least expensive home sold for $170,000. Homes ranged in size from 460 to 12,365 square feet with an average size of 2,308 square feet. The average price per square foot for a home that sold in Austin in October 2026 was $334.60 with the lowest being $105.72 per square foot and the highest being $1,378.60 per square foot. It took, on average, 59 days to sell a home in Austin and sellers received, on average, 92.56% of their original list prices.
One of the most useful comparisons in this table is the difference between the CP/LP% and CP/OLP% columns. On average, sellers received 96.56% of their final list price but only 92.56% of their original list price. That four-point gap represents price reductions made before a buyer agreed to terms. The medians show a similar pattern at 97% versus 94%, so this is not just a handful of outliers pulling the average down.
Days on market show a similar spread. The average home took 59 days to sell, while the median was 39 days. A small group of homes that sat for months (one for 602 days) pulls the average up, while most homes sold in well under two months. The price range of the market is equally wide, from a $170,000 sale to a $10.4 million estate, which is why the median close price of $586,750 is a better guide to the typical Austin home than the $812,589 average.
Where Buyers Are Shopping: A Look at Price Ranges
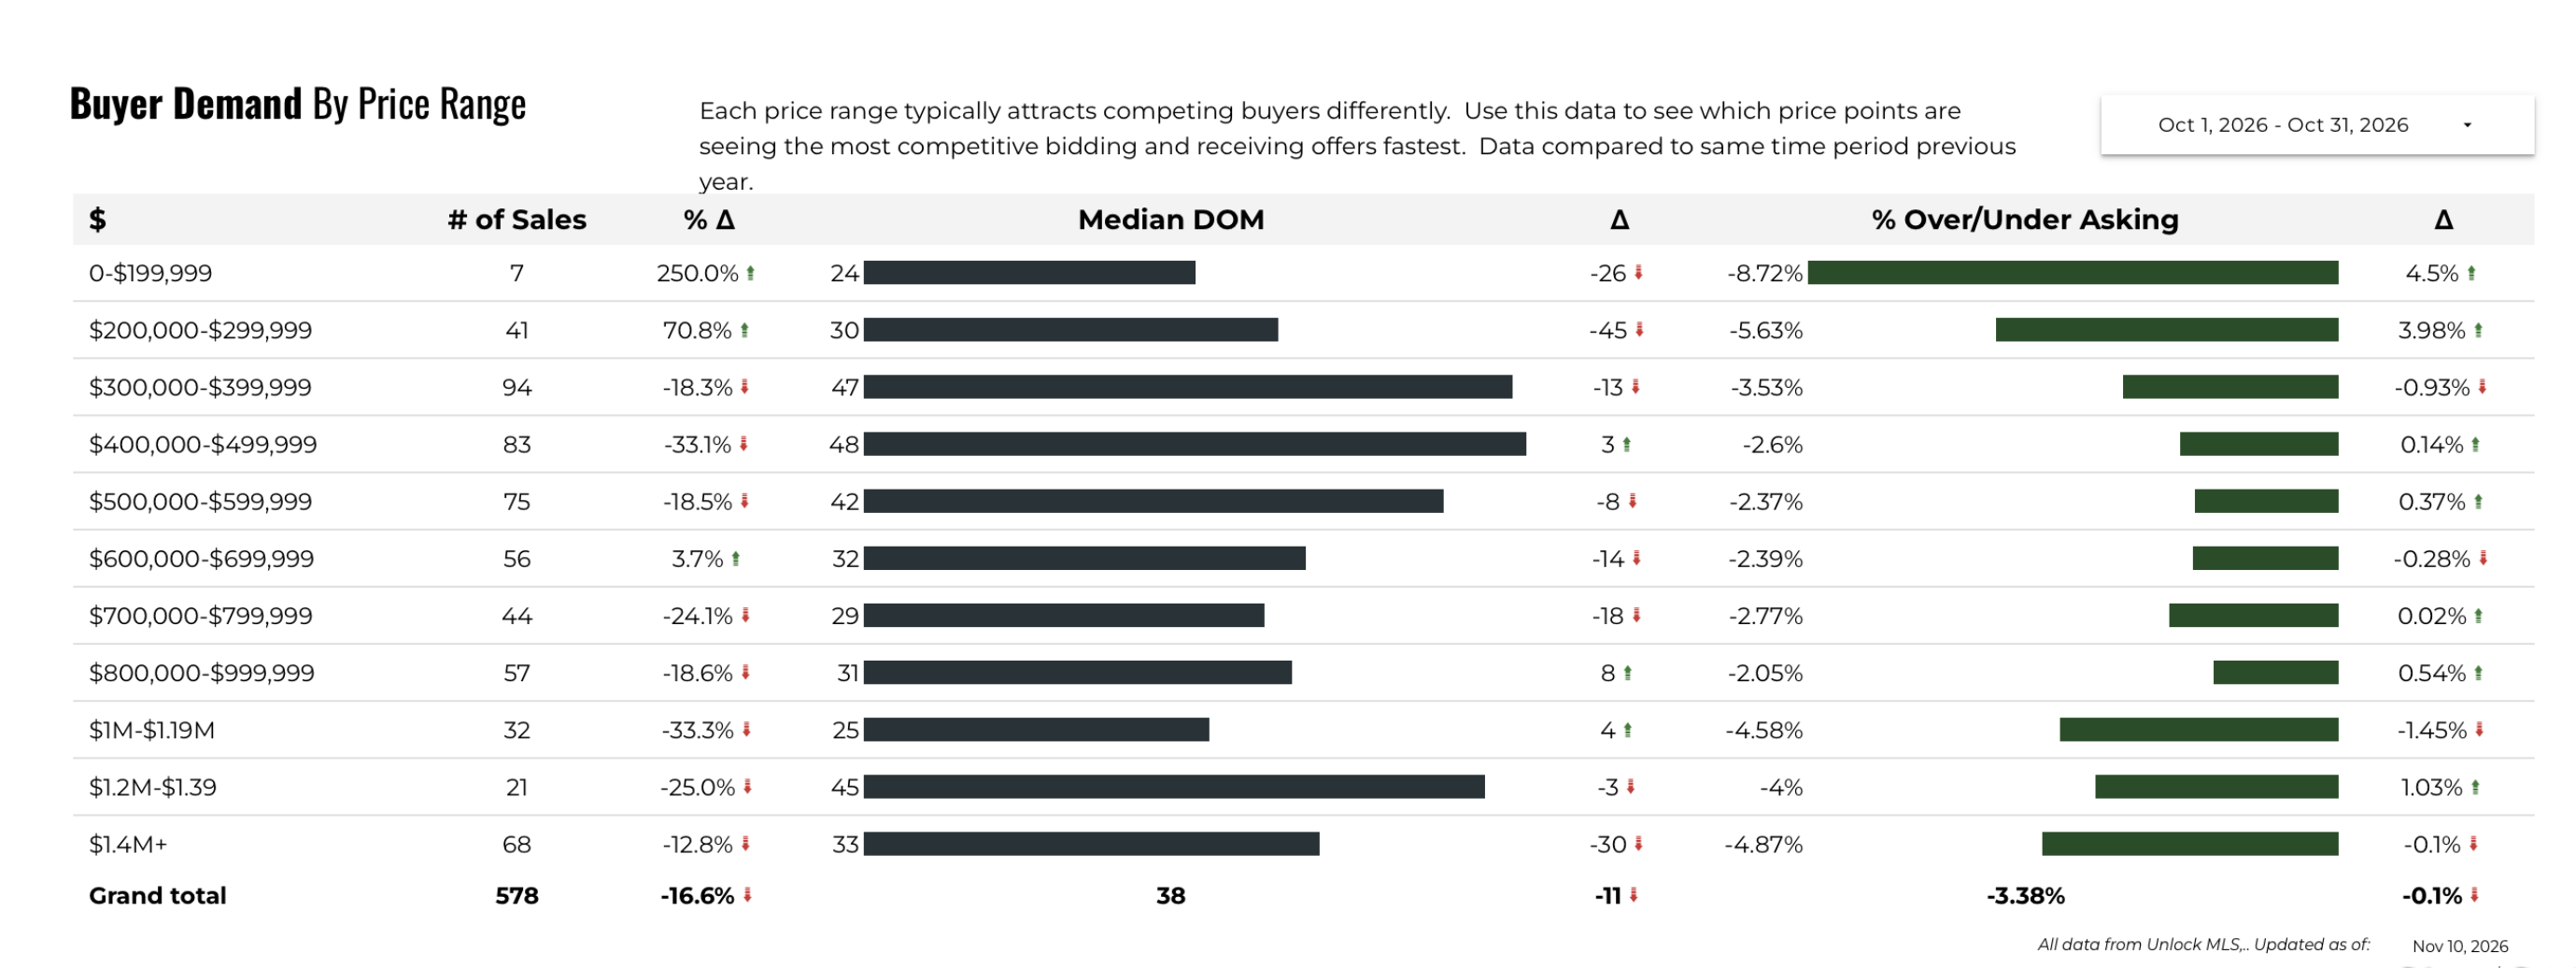
Unlock MLS buyer demand data shows 578 single-family sales in Austin for October 2026, down 16.6% from October 2025, with a median of 38 days on market and homes selling an average of 3.38% below asking.
The three busiest price ranges were $300,000 to $399,999 with 94 sales, $400,000 to $499,999 with 83 sales, and $500,000 to $599,999 with 75 sales. Together, these three brackets accounted for 252 sales, or 43.6% of the month’s activity. All three saw fewer sales than a year ago, with the $400,000 to $499,999 range down the most at 33.1%.
Activity in the middle and upper-middle of the market held up relatively well. The $600,000 to $699,999 range was the only bracket above $300,000 to post a year-over-year gain, with 56 sales, up 3.7%. The $700,000 to $799,999 range recorded 44 sales and the $800,000 to $999,999 range recorded 57. Combined, homes between $600,000 and $999,999 made up 157 sales, or 27.2% of the market.
At the lower end, homes under $300,000 made up only 48 sales, or 8.3% of the total. Both brackets did grow sharply from last year, with sales under $200,000 up 250% (from 2 to 7) and sales between $200,000 and $299,999 up 70.8% to 41. At the upper end, homes priced at $1 million and above made up 121 sales, or 20.9% of the market, and the $1.4 million and up bracket alone accounted for 68 sales, or 11.8%.
Speed varied widely by price range. Homes between $1 million and $1.19 million sold fastest, with a median of 25 days on market, followed by homes under $200,000 at 24 days and the $700,000 to $799,999 range at 29 days. The slowest ranges were $400,000 to $499,999 at 48 days, $300,000 to $399,999 at 47 days, and $1.2 million to $1.39 million at 45 days. The $1.4 million and up bracket saw the biggest improvement, selling 30 days faster than a year ago.
No price range sold above asking on average in October. Homes between $800,000 and $999,999 came closest at 2.05% under asking, followed by the $500,000 to $599,999 range at 2.37% under. Buyers found the most negotiating room under $200,000, where homes sold 8.72% under asking, and in the luxury ranges, where homes above $1.4 million sold 4.87% under asking and homes between $1 million and $1.19 million sold 4.58% under.
If you are shopping in the $300,000 to $499,999 range, you are in the busiest part of the Austin market, but homes there are taking longer to sell than in most other brackets. That gives you time to compare options and negotiate, especially on homes that have been listed for more than a month.
The Listing-to-Close Price Gap: What Sellers Need to Know
The ABoR statistics show that Austin sellers received an average of 96.56% of their final list price in October, but only 92.56% of their original list price. The gap between those two numbers reflects price reductions that happened before a buyer signed a contract. In other words, many homes did not sell until the seller lowered the price, sometimes more than once.
Here is what that gap looks like in dollars. Take the median list price of $599,000. At 92.56% of the original list price, that home would close at about $554,400, roughly $44,600 below where it started. Even using the median CP/OLP of 94%, the same home would close around $563,100, about $35,900 less than the original asking price.
The lesson is simple: the first price you choose matters more than any reduction you make later. Homes that launch at the right price tend to sell faster and closer to asking, while homes that start too high often sit, collect price cuts, and eventually sell for less than they could have at the start.
What This Means for Buyers
Prices are firm but not running away from you. The median sold price is up 3.7% from last year, while price per square foot is down 2.8% to $282. That means you are paying slightly more for the typical home, but you are getting more space for each dollar than you did in October 2025.
Negotiation is still very much part of the process. The average home sold for 96.66% of its final list price and only 92.56% of its original list price, so there is room to negotiate on most homes, especially those that have been on the market for a while. With 4.03 months of supply, you are not competing in a frenzy, though you also do not have the leverage buyers had during last summer’s inventory surge.
The fall and winter months can be a smart time to buy. New contracts held nearly steady from September to October, which shows that serious buyers are still active, but there are fewer of them than in spring. Sellers who list during the holidays are often motivated, and you will face less competition than you would in March or April 2027.
Financing deserves just as much attention as the home itself. Talk with a lender early about rate options, including whether a seller-paid rate buydown makes sense for your situation. With homes selling for several percent below asking, asking the seller to contribute toward closing costs or a rate buydown can be a better use of your negotiating power than a lower price.
What This Means for Sellers
Buyers are still showing up. Unlock MLS recorded 581 new contracts in October, nearly the same as September’s 591, and homes sold in a median of 41 days, 11 days faster than a year ago. Demand slowed with the season, but it did not disappear.
Competition from new listings is lighter than last year. Only 832 new single-family listings came on the market in October, down 20.4% from October 2025, and active inventory is down 17.7% to 2,742 homes. If your home is ready, you are competing against fewer homes than sellers did a year ago.
Pricing discipline is still the deciding factor. Sellers in October received an average of 92.56% of their original list price, which means many started too high and had to reduce. The median active list price of $567,343 is now below the median sold price, so buyers are comparing your home against a large group of well-priced listings.
Overall, the market is functioning well. A sold-to-list ratio near 97% and a median of 41 days on market describe a healthy, predictable market. Homes that are priced correctly and show well are selling.
Market Summary and Outlook
October 2026 was a typical fall month in Austin with a few encouraging twists. Activity slowed with the season, as closings, new listings, and pending sales all declined from September. Prices held steady, homes sold faster than they did in September, and inventory continued to tighten.
Compared to last year, the market is quieter but more balanced. Sales are down 16.4% and new listings are down 20.4%, but the median sold price is up 3.7%, days on market are down by 11 days, and months supply is down 14.4%. Fewer homes are changing hands, but the ones that sell are doing so at stable prices and at a quicker pace.
Supply is the key variable heading into 2027. Inventory has been falling steadily since June, and new listings remain well below last year’s levels. If that trend continues into spring while buyer demand recovers seasonally, Austin could see firmer prices and fewer price reductions next year. If new listings surge in the spring the way they did in 2025, the balance could tilt back toward buyers.
Austin’s long-term fundamentals remain strong. Job growth, population growth, and the region’s continued appeal as a place to live and work continue to support the housing market, even as it settles into a more normal pace after the volatility of the past several years.
Time to Buy? Time to Sell?
For buyers, conditions this fall are reasonable. Prices are stable, negotiation room averages more than 3% off asking, and competition is lighter than it will be in spring. If you find a home that fits your needs and budget, waiting for spring is unlikely to get you a better deal and may mean competing with more buyers.
Sellers face a market that rewards accurate pricing. Inventory is lower than last year, which helps, but buyers are price-sensitive and many homes are still selling only after a reduction. If you need to sell this fall or winter, price your home to match recent sales from the start and expect a buyer within a couple of months.
If you can wait, keep an eye on the next 60 to 90 days. Listing in late January or February 2027 would put your home on the market just ahead of the spring rush, when buyer activity typically picks up and new competition has not yet peaked.
Action Items for Buyers
- Get pre-approved now so you can move quickly when the right home appears, since well-priced homes sold in a median of 41 days in October.
- Focus your negotiation on homes that have been listed for more than 30 days, where sellers are more likely to accept an offer below asking.
- Ask your lender to compare a lower purchase price against a seller-paid rate buydown, because the monthly savings from a buydown can be larger.
- Look closely at the $600,000 to $999,999 range if it fits your budget, since homes there sold quickly but still closed 2% to 3% below asking.
- Use the holiday season to your advantage by touring homes while fewer buyers are competing for them.
- Compare price per square foot rather than just total price, since the typical October buyer paid $282 per square foot, below last year’s $290.
Action Items for Sellers
- Price your home against recent closed sales rather than active listings, since the median list price ($567,343) is now below the median sold price ($583,750).
- Plan your launch price carefully, because sellers in October received an average of 92.56% of their original list price after reductions.
- Make sure your home is in top condition before listing, since buyers have fewer homes to choose from but are still selective.
- Consider listing in late January or February 2027 if your timeline is flexible, ahead of the spring wave of new listings.
- Be prepared to negotiate on closing costs or a rate buydown, which can help a buyer afford your home without lowering your price.
- Review your price after the first two to three weeks if you are not getting showings, rather than waiting a month or more.
Final Word on the Market
October 2026 rewarded preparation and realistic pricing. Buyers who were ready found stable prices and room to negotiate, and sellers who priced correctly sold faster than they would have a year ago.
The numbers tell a consistent story. Austin is a quieter market than it was last fall, with fewer sales and fewer new listings, but it is also a more balanced and predictable one. Prices are up modestly year over year, inventory is tighter, and homes are selling in a reasonable amount of time.
Whether you own a home in Austin or are hoping to buy one, the data is your best guide. Use it to understand where the market stands today, then make the decision that fits your life and your financial situation.
Questions About the October 2026 Austin Real Estate Price Report?
Have questions about what the October 2026 Austin Real Estate Price Report means for your specific situation? We are happy to help. If you are thinking about buying a home in Austin, our Buyers page has resources to help you understand the process and get started. If you are thinking about selling, our Sellers page walks through what to expect in today’s market.
Reach out to Rebecca Jacks and the team at Eleven Oaks Realty. Call or text (512) 827-8323 or email info@11OaksRealty.com. We have been helping buyers and sellers since 1978 and we are here to help you make the best decision for your situation, whatever that looks like.
Data sources: Realtors Property Resource (RPR), Austin Board of REALTORS MLS, Unlock MLS. All figures are for single-family residential properties in the city of Austin. Reported figures reflect October 1, 2026 through October 31, 2026. Some variation between data sources may exist due to differing methodology and timing of data pulls. RPR’s October 2026 counts for sold listings, total sales volume, new listings, and new pending listings appear incomplete; MLS figures are used for those metrics.




Leave a Reply