
Eleven Oaks Realty is proud to present their May 2026 Austin Real Estate Price Report measuring activity in the single family home market.
May 2026 brought a clear acceleration to the Austin housing market. The median sold price climbed to $620,000, up 4% from April, while total sales volume surged to nearly $735 million, up 11.9% month over month, and homes sold increased 8% compared to May 2025. At the same time, active listings rose 6.2% from the prior month but remained 21% below last year’s levels, keeping supply tight enough to tip the market back into Seller’s Market territory. This report covers median sold price, active list price, price per square foot, sold-to-list ratios, time to sell, inventory, pending contracts, new listings, homes sold, total volume, and where buyers are shopping by price range.
All data below covers single-family residential homes in the city of Austin. Data is sourced from Realtors Property Resource (RPR) and the Austin Board of REALTORS MLS. Some metrics may vary slightly between sources due to differing methodology; where differences exist, they are noted.
The Austin Real Estate Market is a Seller's Market
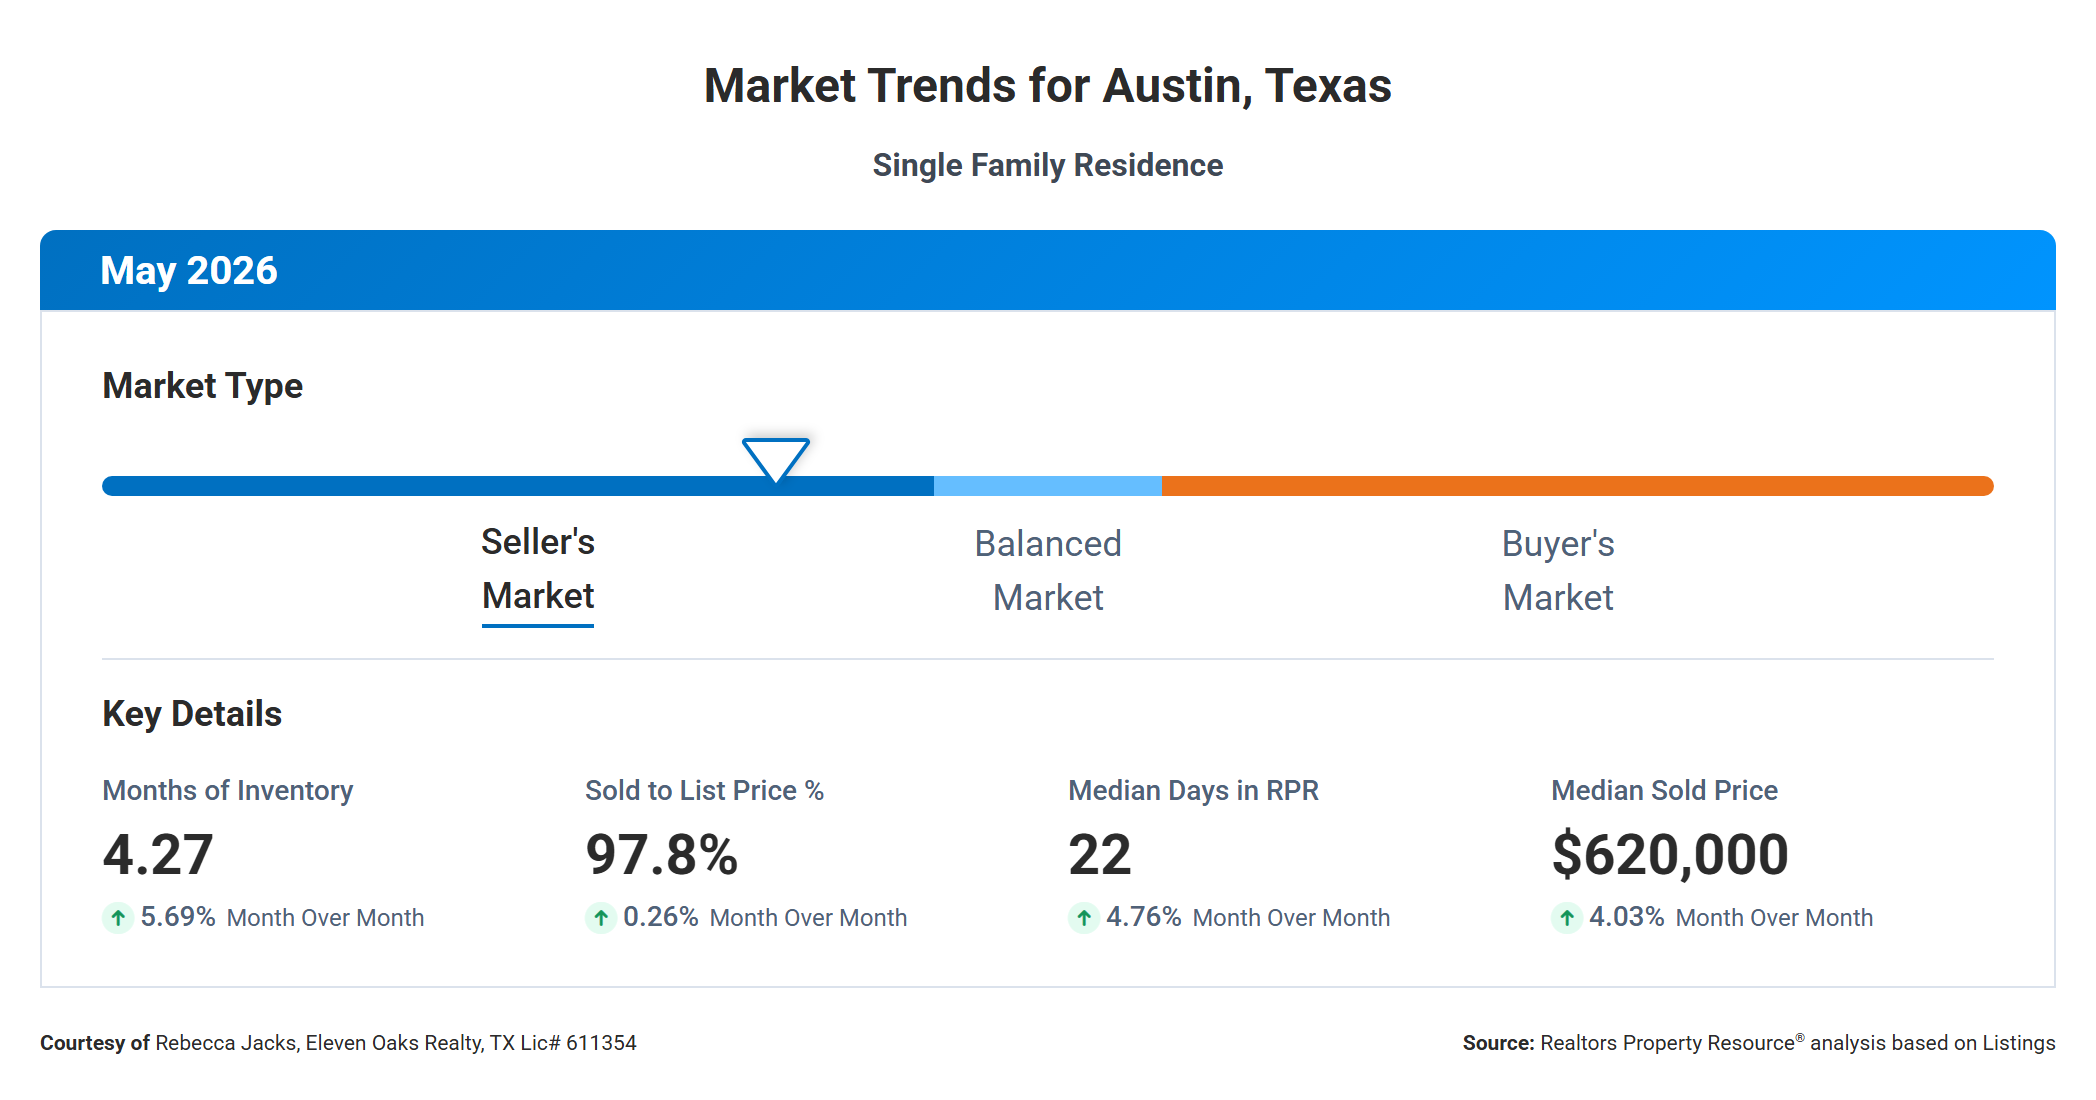
The RPR Market Trends dashboard placed Austin in Seller's Market territory in May 2026, with months of inventory at 4.27. That reading sits above the technical seller's market threshold, but given that inventory is down 27% from this time last year, the supply picture is considerably tighter than the raw number suggests. Buyers are competing in a market where there are fewer options than there were 12 months ago, and sellers are benefiting from that constraint.
The four key indicators on the dashboard each moved in a slightly different direction month over month. Months of inventory rose 5.69% from April's 4.04 reading, meaning more homes came onto the market relative to the pace of sales. The sold-to-list price percentage edged up to 97.8%, a 0.26% improvement over April, indicating buyers are paying slightly closer to asking prices. Median days on market came in at 22, up 4.76% from 21 days in April. Median sold price reached $620,000, up 4.03% from $596,000 in April.
Taken together, these four numbers tell a consistent story: Austin is active, buyers are engaged, and prices are moving in the right direction for sellers entering the market this season.
Median Sold Price Down 1.6% Year Over Year

The median sold price in Austin in May 2026 was $620,000, up 4% from $596,000 in April 2026 and down 1.6% from $630,000 in May 2025.
The two-year chart shows a market that has been cycling through peaks and valleys rather than moving in one clean direction. Prices reached a local high near $630,000 in the summer of 2025 before pulling back through the fall and hitting a low around $565,000 in late 2025 or early 2026. The chart then shows a recovery climbing back through March and April 2026, with May now pushing back toward the upper end of that recent range.
For buyers, the year-over-year decline of 1.6% represents modest relief compared to the prior peak, but the month-over-month jump of $24,000 in a single month signals that window may be closing. For sellers, the spring momentum is real. A $620,000 median is a strong number, and the upward trajectory through the spring selling season is encouraging for anyone considering listing now.
What to watch going forward: if the seasonal pattern holds, summer typically brings higher prices as well as more competition from new listings. How the balance between supply and demand plays out over June and July will determine whether this recovery continues or levels off.
Median Active List Price Down 3.0% Year Over Year
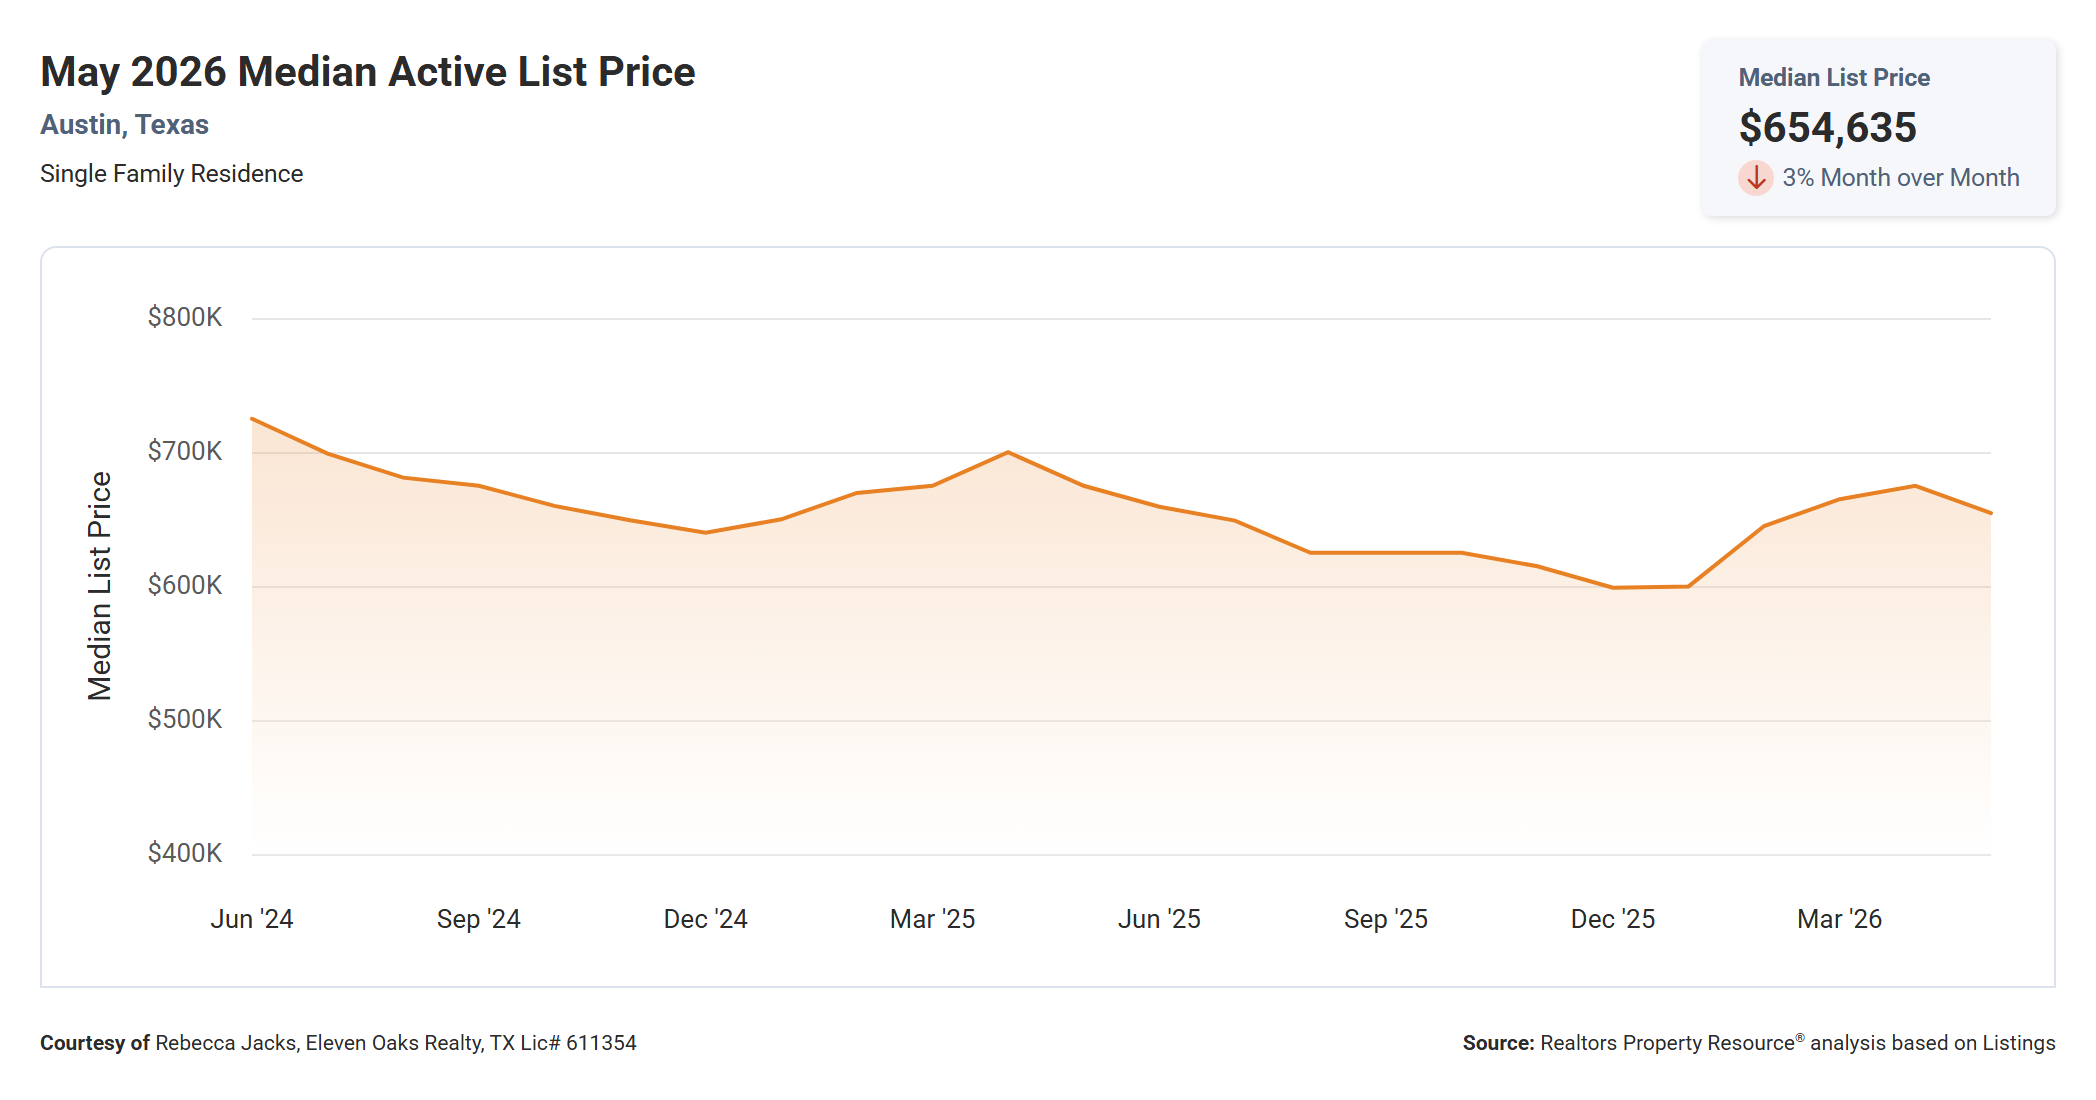
The median active list price in Austin in May 2026 was $654,635, down 3% from $675,000 in April 2026 and down 3.0% from $675,000 in May 2025.
The two-year chart shows that asking prices have generally trended downward from a peak near $730,000 in mid-2024 before stabilizing in a range between roughly $600,000 and $680,000 through 2025 and into 2026. The March 2026 spike back toward the upper end of that range has now moderated, with May pulling back to $654,635.
What this tells you as a buyer: the gap between what sellers are asking and what homes are actually closing at has narrowed over the past year. In May 2026 the median active list price of $654,635 compared to a median close price of around $620,000-$630,000 (depending on the source) represents a spread of roughly $25,000-$35,000. That spread is your negotiating window, though in the most competitive price ranges it tightens considerably.
For sellers, the data suggests that pricing at or slightly below the median active list price is a more effective strategy than reaching above it, particularly given the price drop data discussed later in this report.
Median Price Per Square Foot Essentially Unchanged Year Over Year
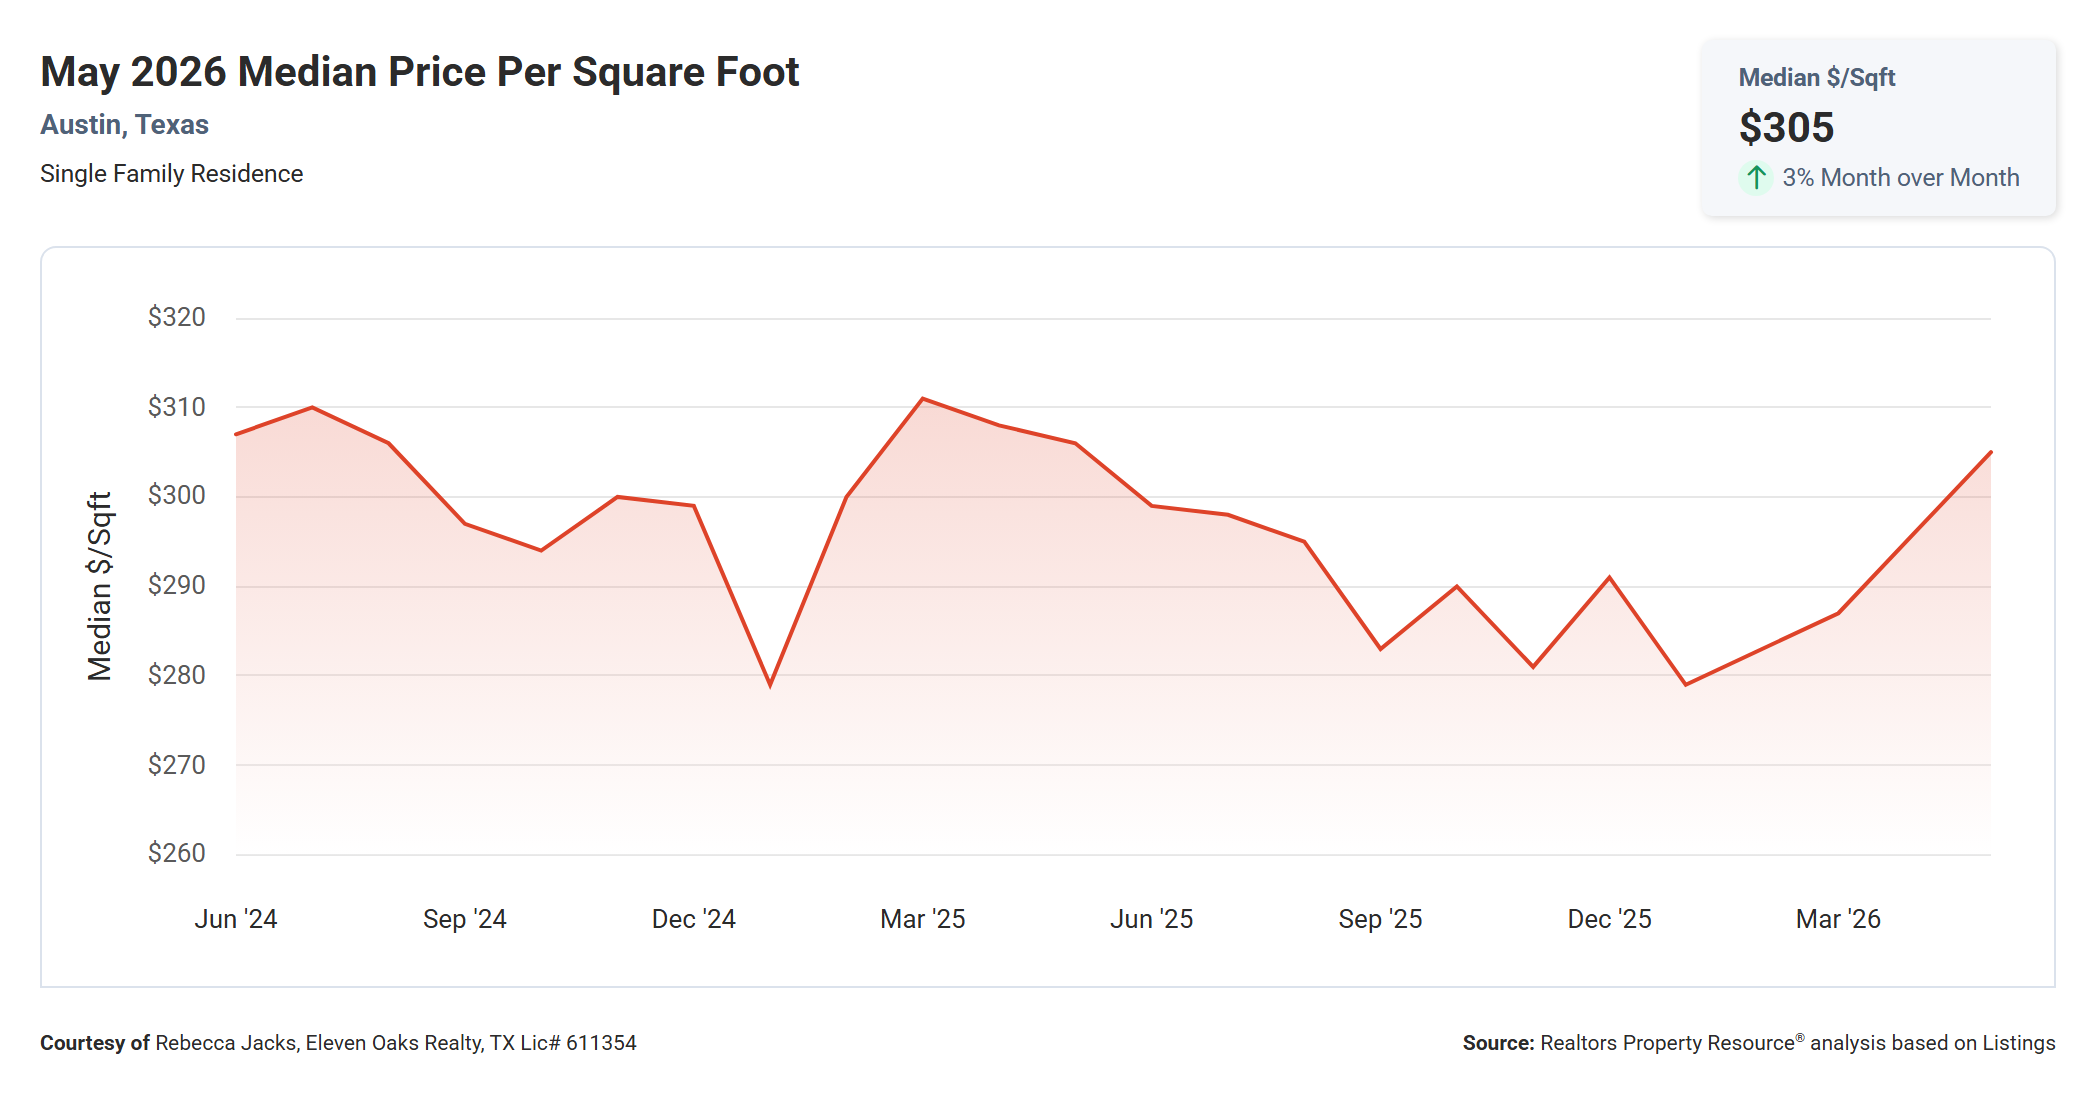
The median price per square foot in Austin in May 2026 was $305, up 3% from $296 in April 2026 and essentially unchanged from $306 in May 2025, a change of less than 1%.
The two-year chart traces a pattern similar to the median sold price: a high near $310 per square foot in mid-2024, a decline through late 2024 and into late 2025 with a low near $278-$280, and then a recovery beginning in early 2026. May's $305 reading puts the per-square-foot metric back near the upper range of where it has traded over the past two years.
The practical takeaway is that the cost to buy square footage in Austin has held relatively stable on a year-over-year basis despite the month-to-month movement. If you purchased a home in May 2025, you paid roughly the same per square foot as someone closing today. For buyers comparing value across price ranges, this metric helps put negotiations in context: $302 per square foot at the close price (ABoR median CP/SqFt) versus $308 at list price indicates only a modest discount from asking on a square footage basis.
The momentum here is worth watching. Three consecutive months of increases in price-per-square-foot signal that buyers are not only showing up but are paying more for what they buy, which tends to be a leading indicator of overall price increases in the months ahead.
Average Sold to List Price Essentially Unchanged Year Over Year
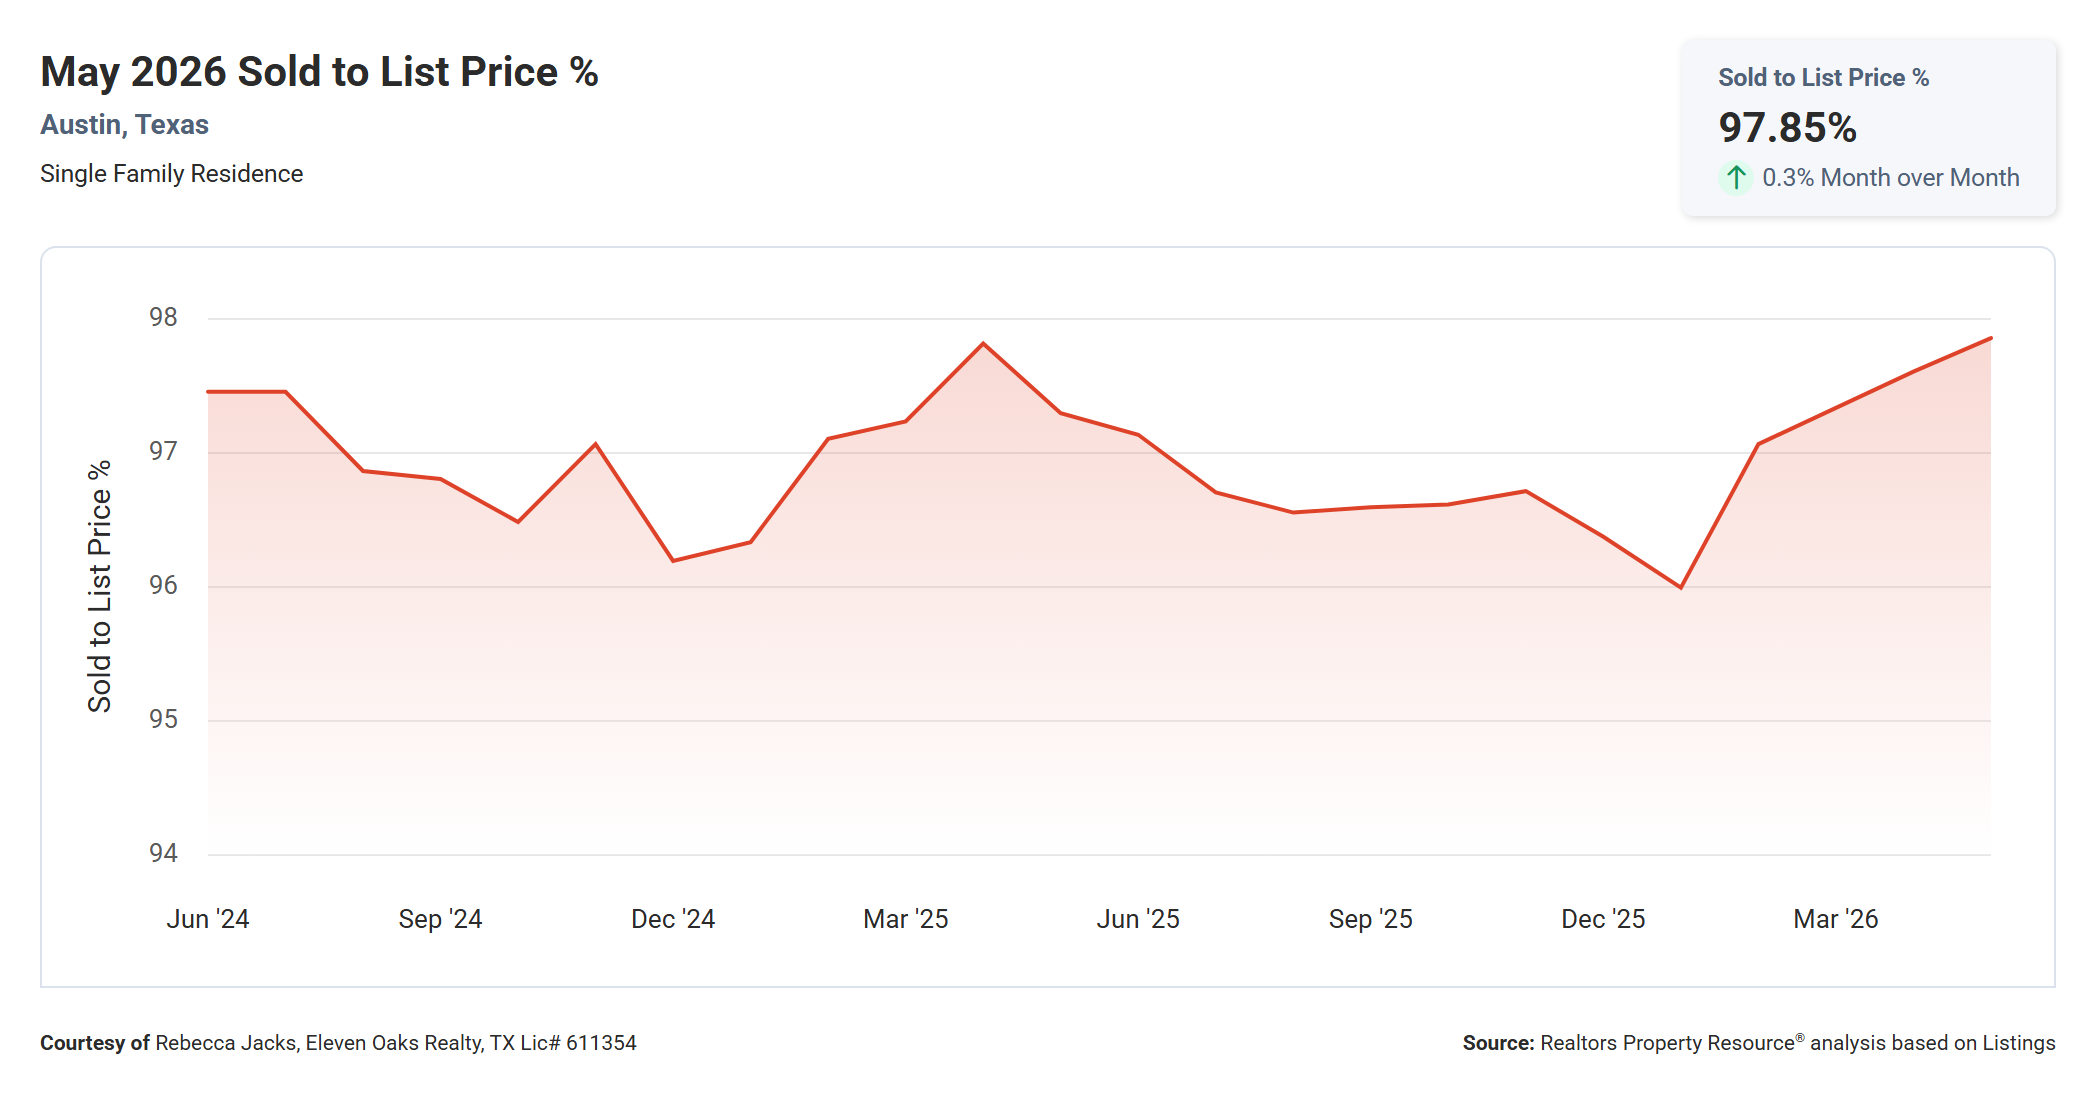
The average sold-to-list price percentage in Austin in May 2026 was 97.85%, up 0.3% from 97.6% in April 2026 and essentially unchanged from 97.29% in May 2025.
The two-year chart shows that this metric has oscillated between roughly 96.1% and 97.9% over the past 24 months, with the low points typically corresponding to slower seasonal periods and the current reading near the top of that range. May 2026's 97.85% is one of the highest readings on the chart, suggesting that buyers in aggregate are paying very close to asking prices right now.
In practical terms, 97.85% means buyers are getting about 2.15% off the most recent list price, which on a $620,000 median sale represents roughly $13,330 in actual savings. However, the ABoR data shows an average CP/LP% of 97.80% and an average CP/OLP% of 95.54%, which means the real discount from original asking prices is larger once you account for price reductions that occurred before the home went under contract. More on that in the Listing-to-Close Price Gap section below.
For buyers, the near-97.85% sold-to-list ratio is a reminder that aggressive low-ball offers are unlikely to succeed in most price ranges. Homes are closing close to where they are priced when they go to market.
Median Time to Sell Up 4.8% Year Over Year
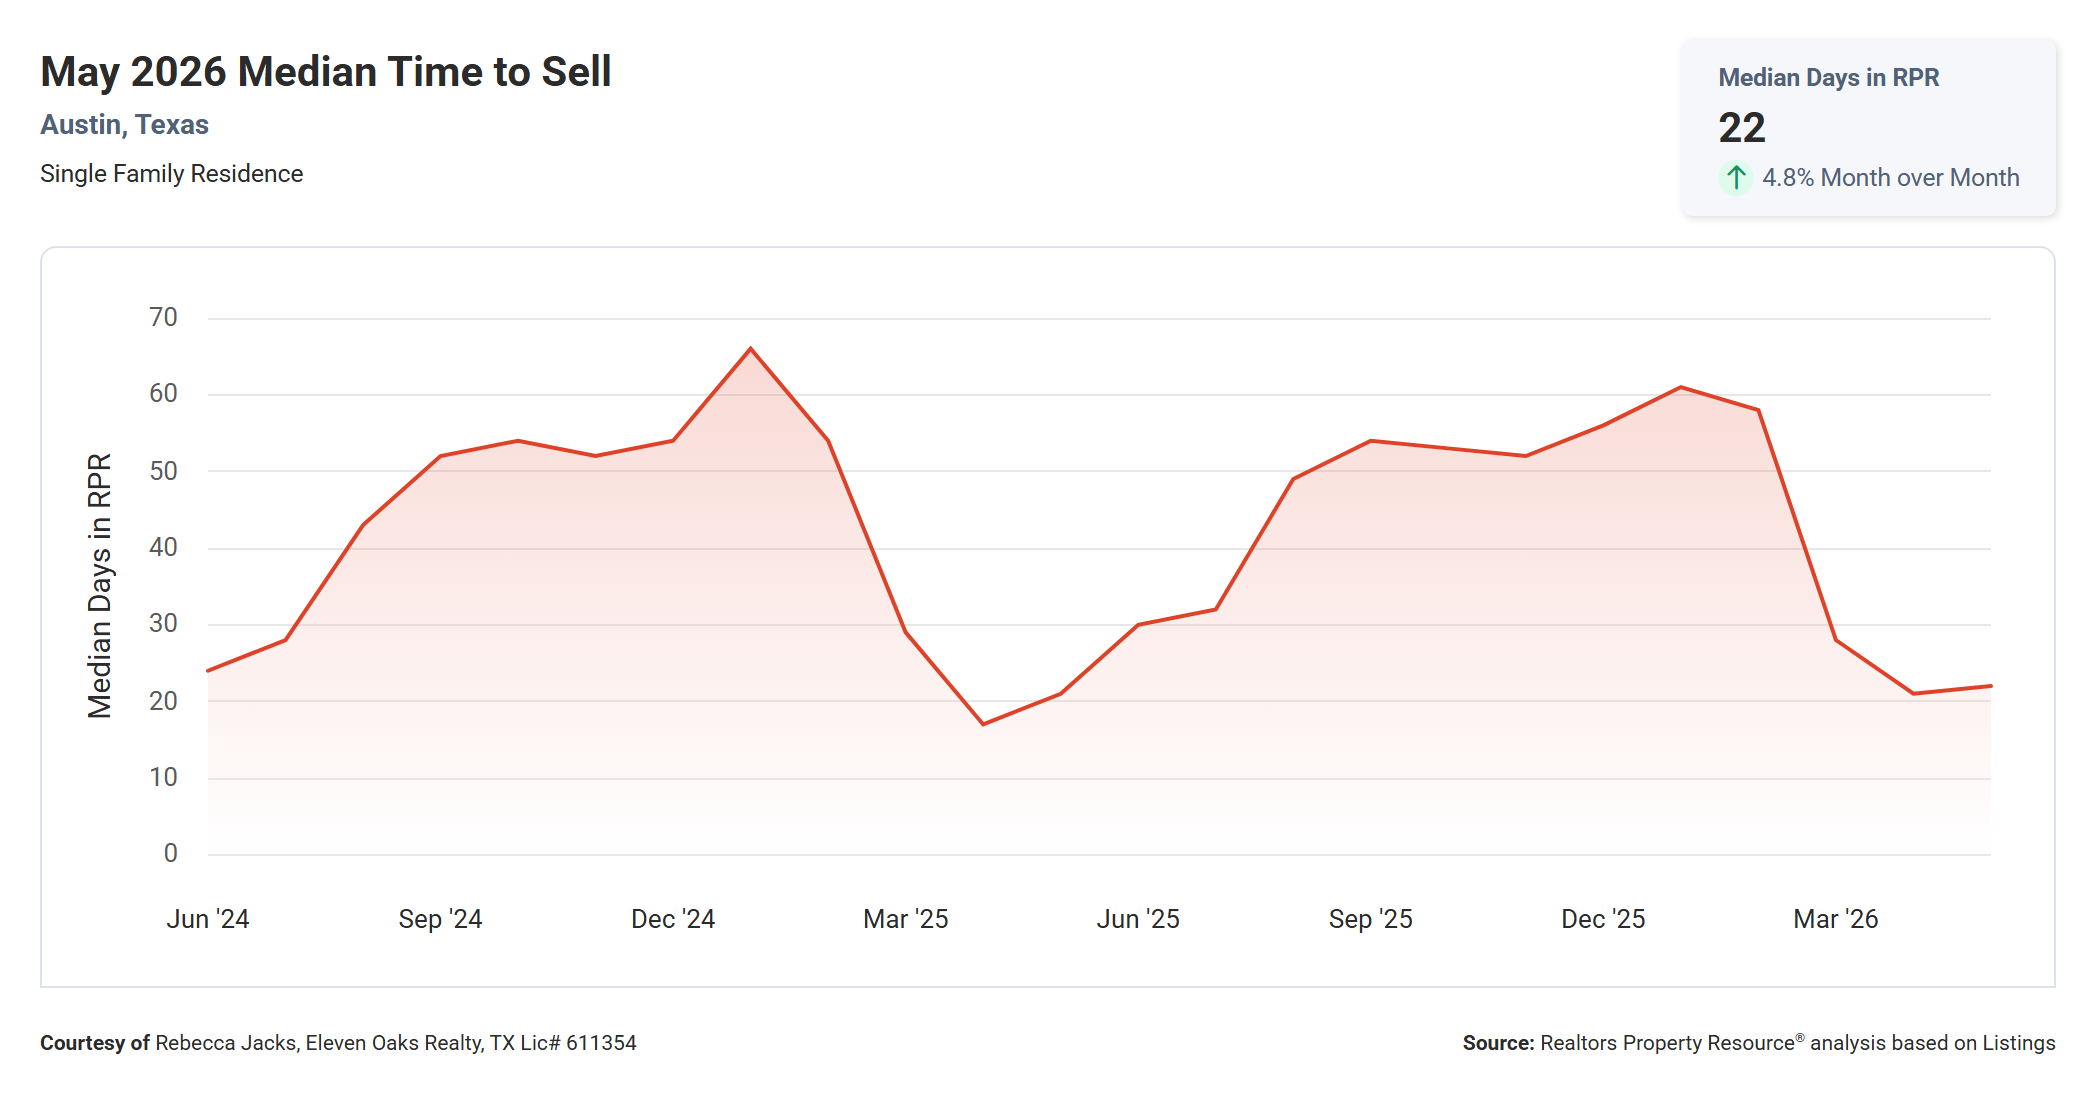
The median time to sell in Austin in May 2026 was 22 days, up 4.8% from 21 days in May 2025 and up from 21 days in April 2026.
The two-year chart is one of the more dramatic in this report. Median days on market spiked to a high near 65 days in the winter of 2024-2025, a clear reflection of the slower market conditions during that period, before collapsing sharply through the spring of 2025 to a low around 17-18 days. After rising again into the fall of 2025 (reaching the upper 50s), the metric dropped sharply again entering 2026 and has now settled at 22 days for May.
A 22-day median is a healthy, active market reading. It means the typical home in Austin is finding a buyer and going under contract in about three weeks. That is enough time for buyers to do their due diligence, but not enough time for the market to feel slow or stagnant.
The year-over-year increase of one day (from 21 to 22) is functionally insignificant. If you are selling, you should not expect your home to sit. If you are buying, you have a narrow window to make decisions once you find something you like.
Months Supply of Inventory Down 27.0% Year Over Year
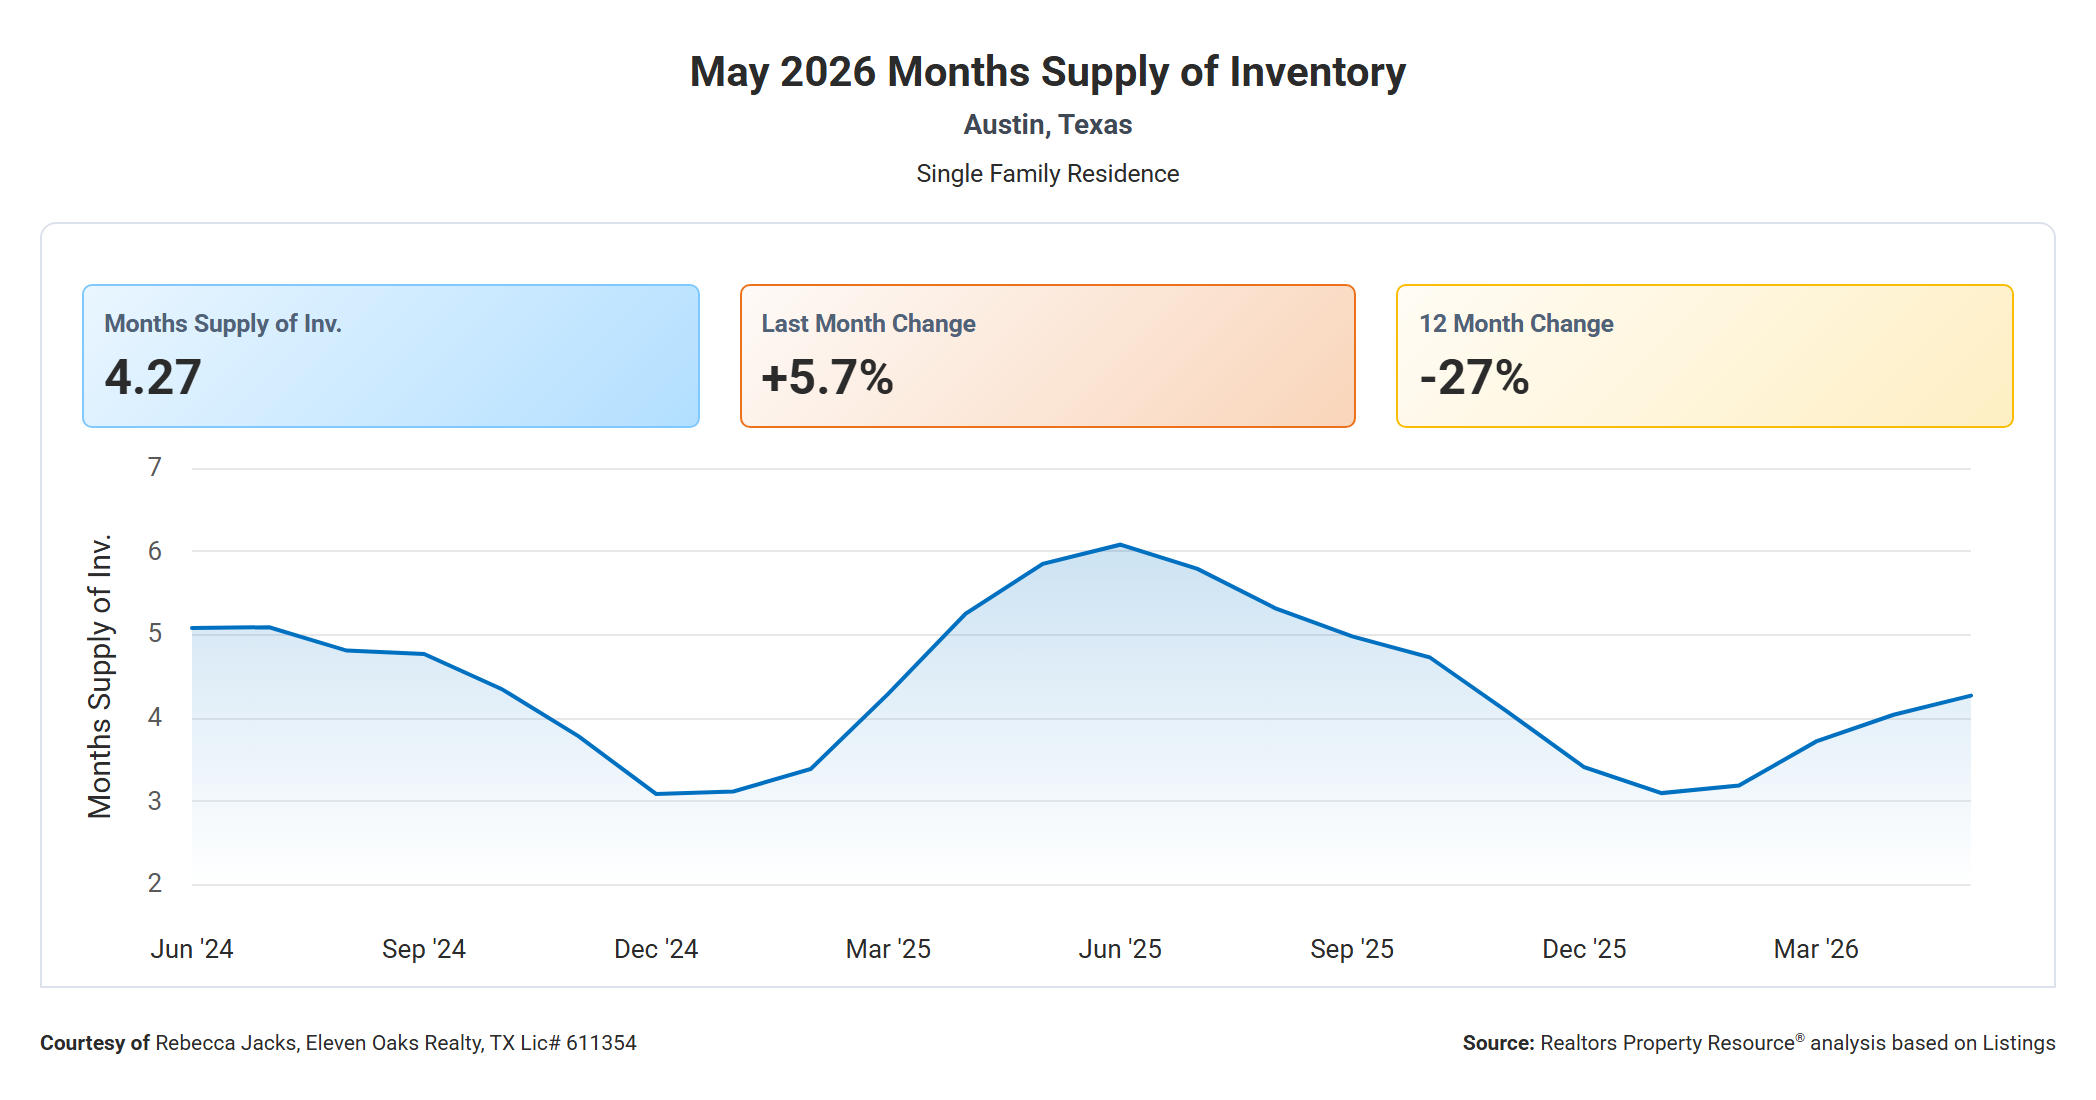
Months supply of inventory in Austin in May 2026 was 4.27, up 5.7% from 4.04 in April 2026 and down 27.0% from 5.85 in May 2025.
The two-year chart shows the dramatic swing in supply that has defined the Austin market over the past two years. Inventory peaked near 5.5-6.0 months in the summer of 2025, which was approaching balanced or even slightly buyer-favoring territory. Since then the trend reversed sharply, with months of supply dropping through the fall and winter of 2025 before stabilizing in the 3.5-4.5 range entering 2026.
The 27% year-over-year decline in months of supply is the single most important metric in this report. A year ago buyers had significantly more options and more time to make decisions. Today, with inventory 27% tighter, those same buyers are operating in a more competitive environment with fewer homes to choose from. Even though supply has ticked up 5.7% month over month, that uptick is coming off a base that is far below last year's level.
For sellers, the inventory picture is genuinely favorable. There are fewer competing sellers, and the homes that are priced and presented well are moving in roughly three weeks. For buyers, low supply means you may encounter multiple-offer situations in the most desirable price ranges, and homes that are priced correctly tend not to linger.
Active Listings Down 21.0% Year Over Year
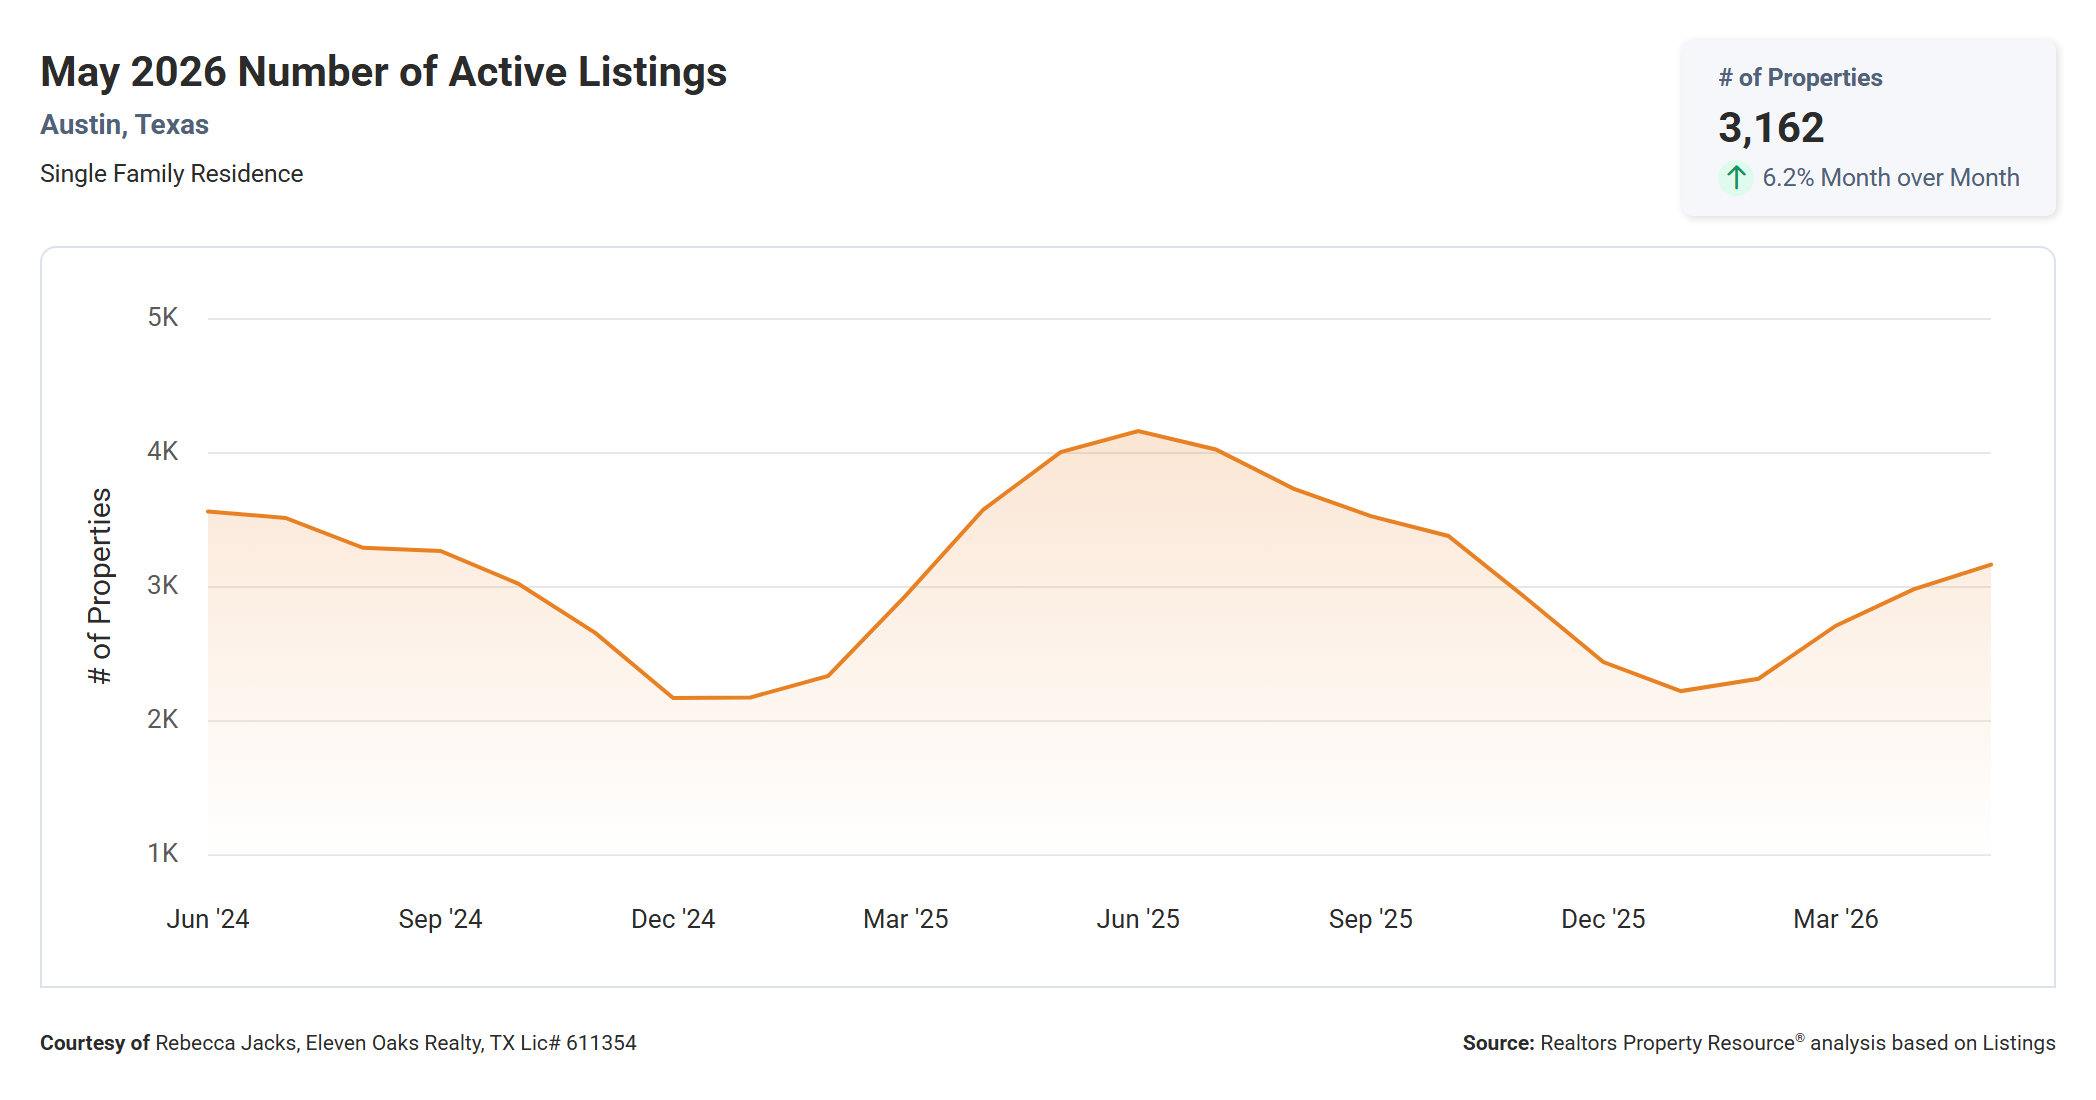
Active listings in Austin in May 2026 totaled 3,162, up 6.2% from 2,980 in April 2026 and down 21.0% from 4,000 in May 2025.
The two-year chart shows active listings peaked near 4,100-4,200 homes in the summer of 2025 before falling steadily through the fall and bottoming near 2,200-2,300 homes entering 2026. The spring of 2026 has brought a steady build back up, with May's 3,162 continuing that recovery.
The 6.2% month-over-month increase in active listings reflects the typical spring pattern where more sellers enter the market. But even with that seasonal increase, supply remains 21% below what buyers were working with a year ago. If you were buying in Austin in May 2025 with 4,000 homes to choose from, today you have about 838 fewer options.
For buyers, the active listing count rising month over month is a modest positive since more choices typically lead to better outcomes. But with supply still well below prior-year levels, the relief is limited. For sellers watching the market, the rise in active listings is worth monitoring. If it continues through the summer, competition among sellers will increase and pricing discipline will matter more.
New Listings Down 16.7% Year Over Year
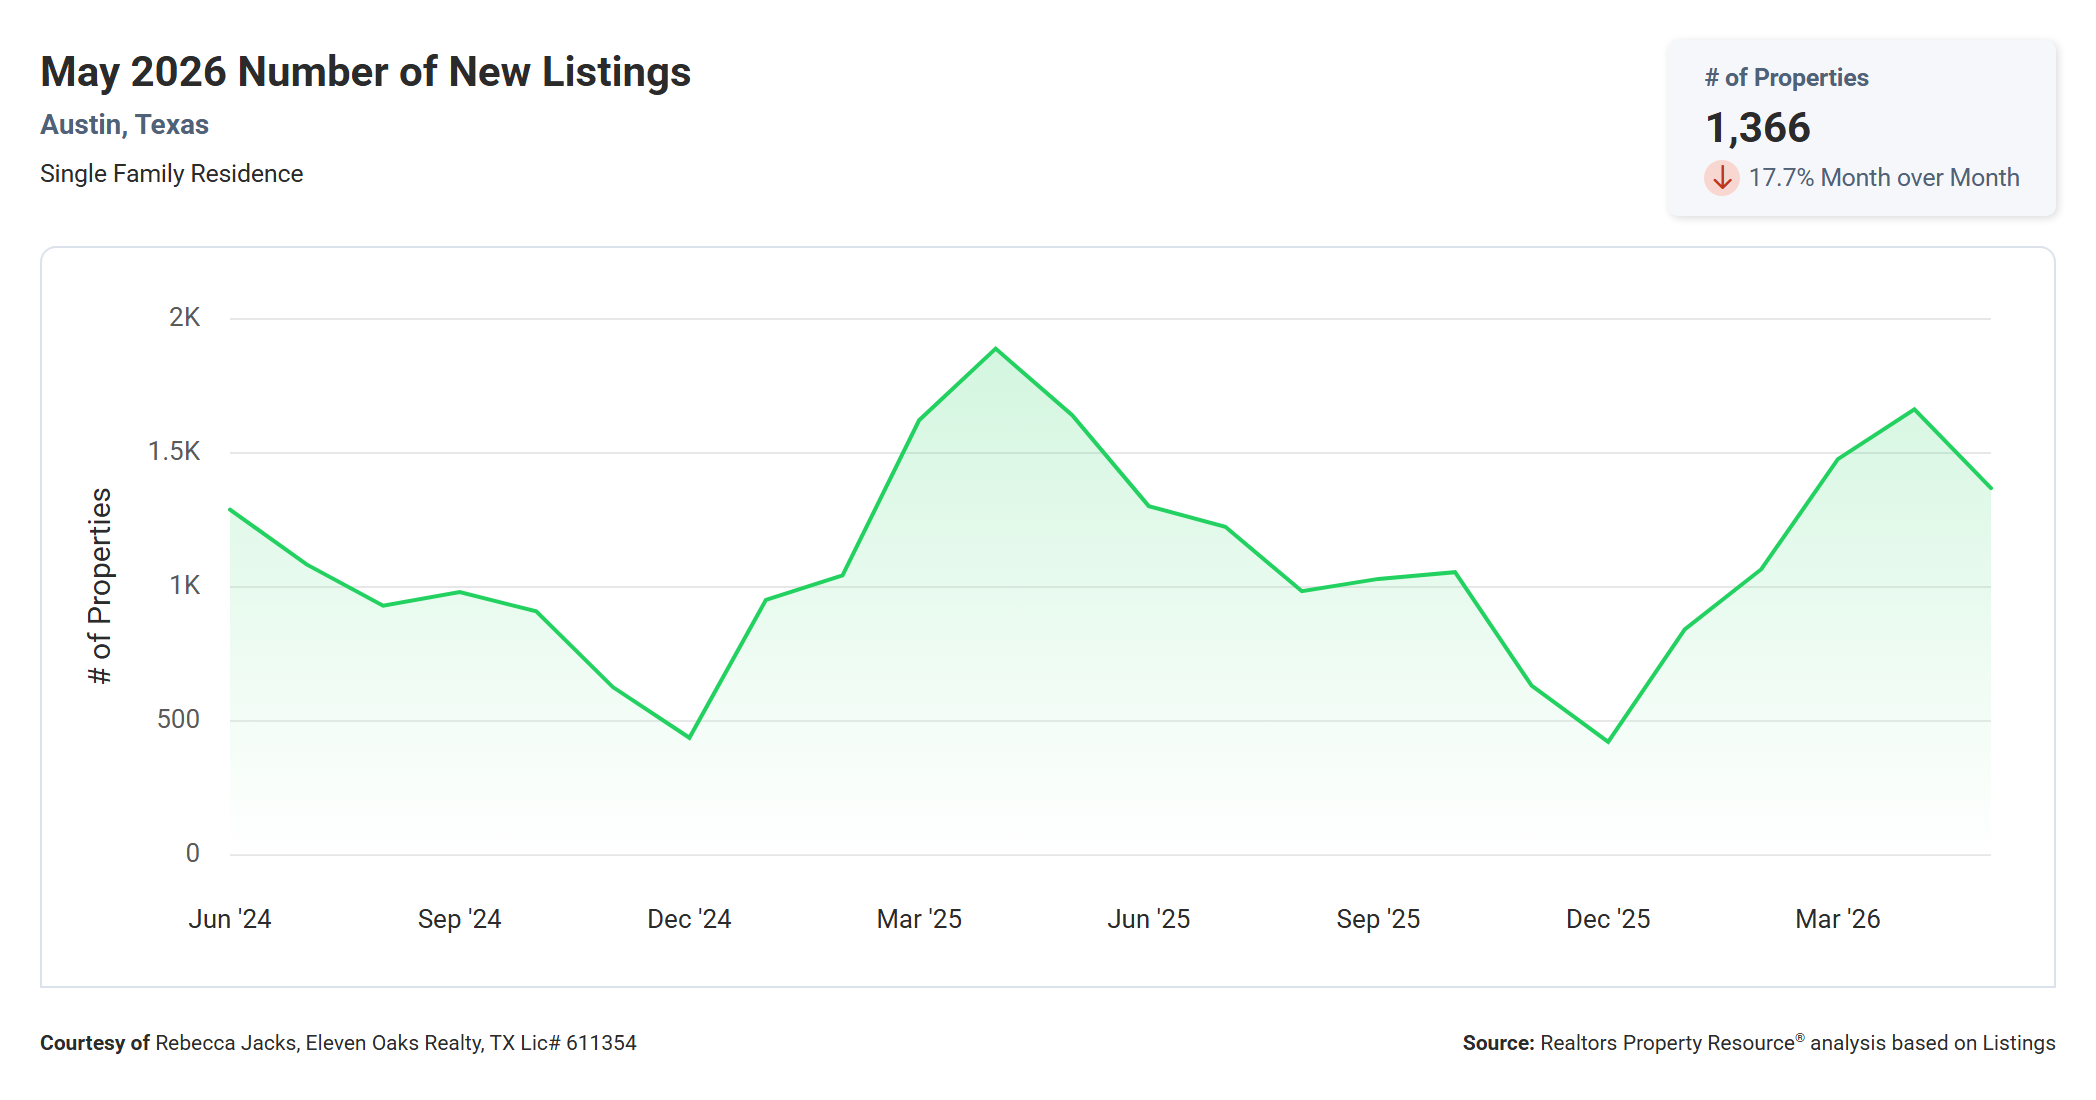
New listings in Austin in May 2026 totaled 1,366, down 17.7% from 1,660 in April 2026 and down 16.7% from 1,640 in May 2025.
The two-year chart shows new listings peaked dramatically in the spring of 2025, spiking near 1,900 homes in a single month before pulling back through the summer and fall. The 2026 spring season started strong, with March and April both showing elevated new listing counts, but May saw a meaningful pullback.
The 16.7% year-over-year decline in new listings is significant because it is the supply side of the equation that will ultimately determine how much relief buyers see in the months ahead. Fewer new listings entering the market means fewer choices and continued upward pressure on prices. Unlock MLS confirms this trend, showing new listings for May 2026 down 19.5% from May 2025.
This also means that well-priced, well-presented homes are entering a market with more buyers than sellers right now. If you have been considering selling, the supply-demand balance currently favors the seller.
New Pending Listings Up 3.7% Year Over Year
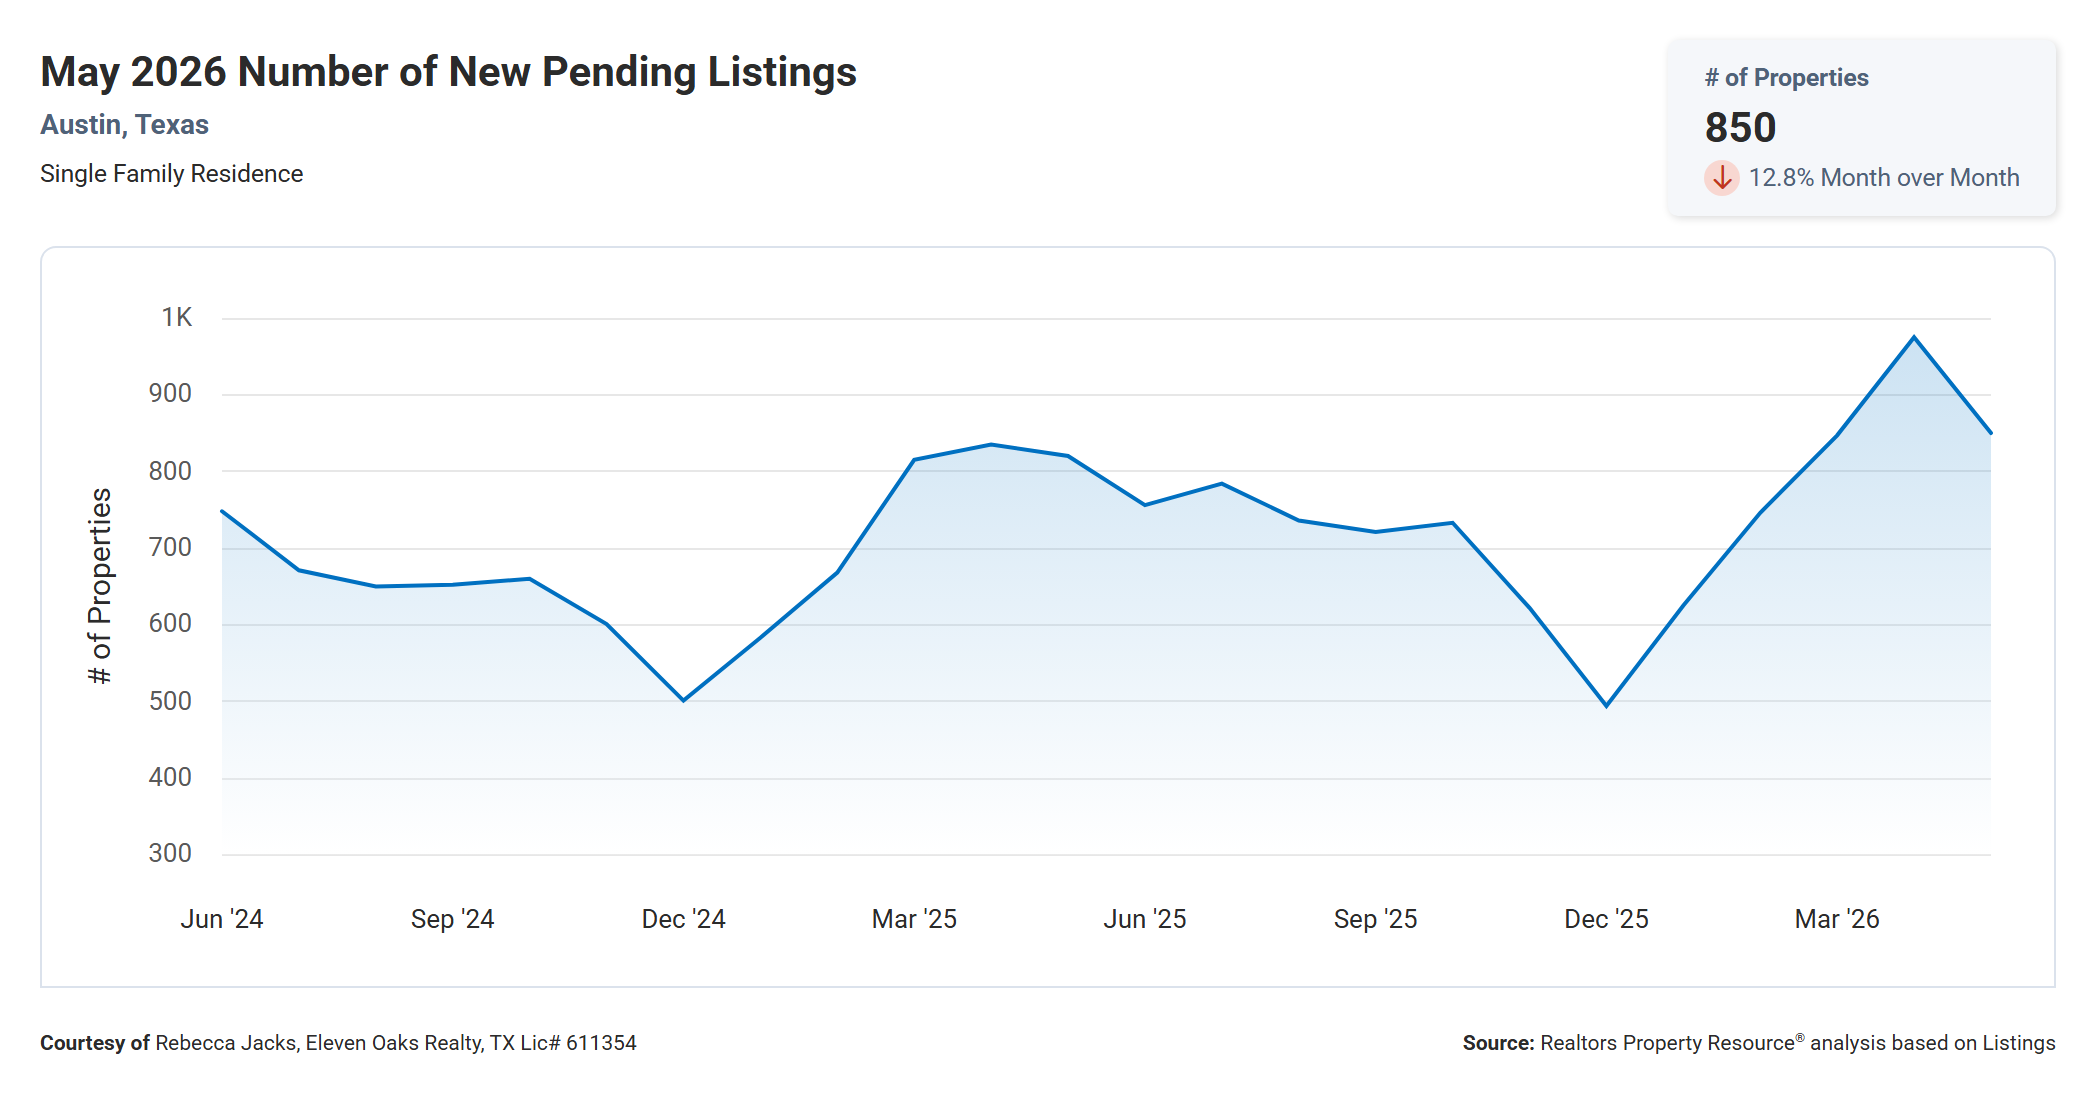
New pending listings in Austin in May 2026 totaled 850, down 12.8% from 975 in April 2026 and up 3.7% from 820 in May 2025.
The two-year chart shows pending listings hit a cyclical low near 500 in the winter of 2024-2025 before recovering strongly through the spring and into a peak near 975 in April 2026. May's pullback to 850 is a normal seasonal pattern after an especially strong April.
The year-over-year increase of 3.7% is a meaningful signal. Despite fewer homes coming to market and tighter inventory, more buyers are going under contract than at this time last year. Unlock MLS confirms strong demand signals, showing new under contracts for May up 13.5% year over year with 906 new contracts written.
For buyers who are still on the sidelines, the pending data is a useful reality check: other buyers are active and making offers. The market is not waiting around. For sellers, a rising pending count signals healthy underlying demand even in months where the headline numbers show some moderation.
Homes Sold Up 9.3% Year Over Year
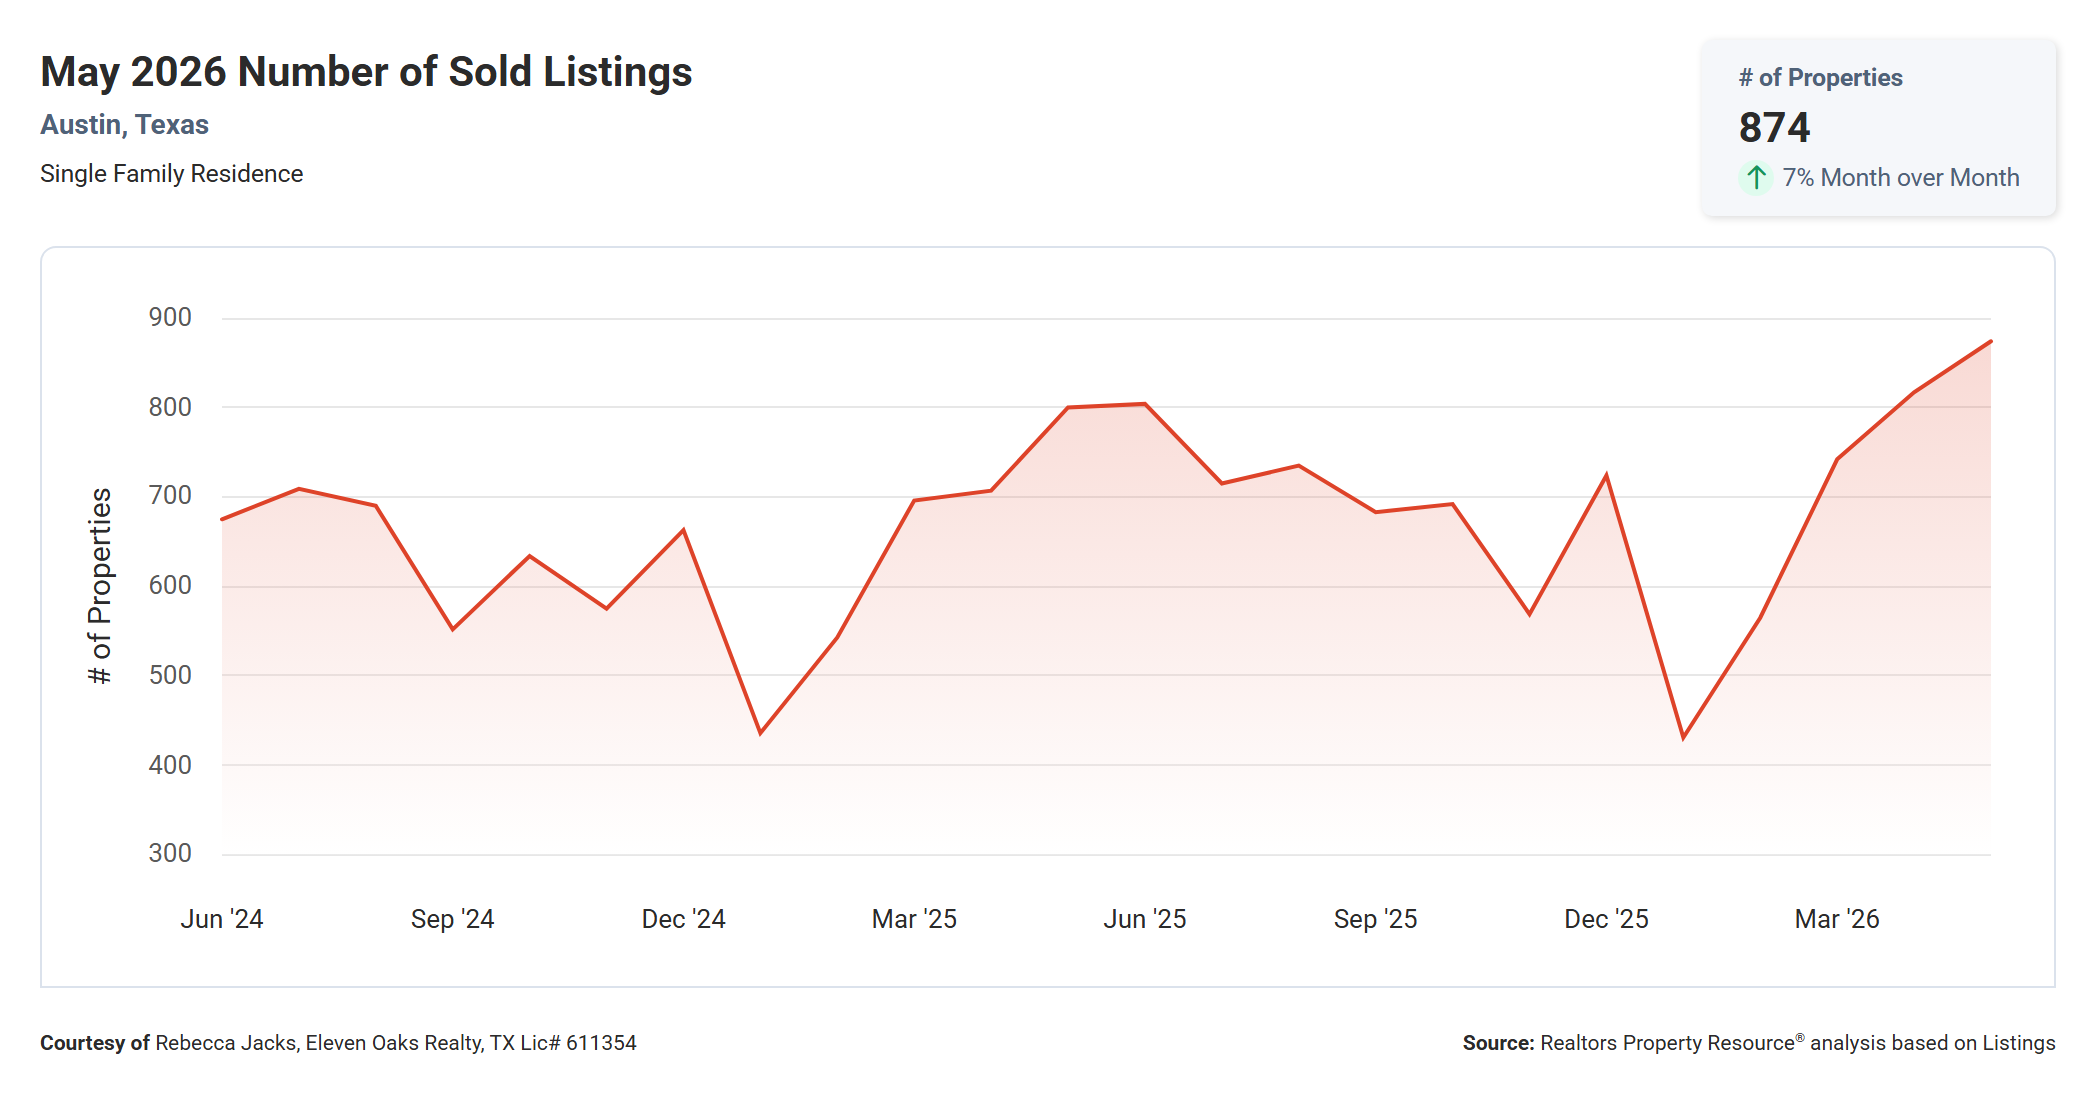
RPR recorded 874 single-family home sales in Austin in May 2026, up 7% from 817 in April 2026 and up 9.3% from 800 in May 2025. The Austin Board of REALTORS MLS recorded 937 closed transactions for the month, and Unlock MLS shows 902, with the differences reflecting slightly different methodology and timing across data sources.
The year-over-year increase in sales is meaningful context for the rest of this report. Prices are down slightly from last year, inventory is much tighter, and yet more homes are closing than at this time last year. That combination points to genuine buyer demand being the driver of the market right now, not distress or desperation selling on either side.
The two-year chart shows May 2026 at its highest point on the chart, surpassing the prior peak from summer 2025 near 800 sales. The market hit a low around 430-440 sales in late 2025 before recovering steadily through early 2026. That recovery arc, combined with the year-over-year gain, confirms that the spring 2026 market is outperforming recent comparable periods.
Total Sales Volume Up 8.9% Year Over Year
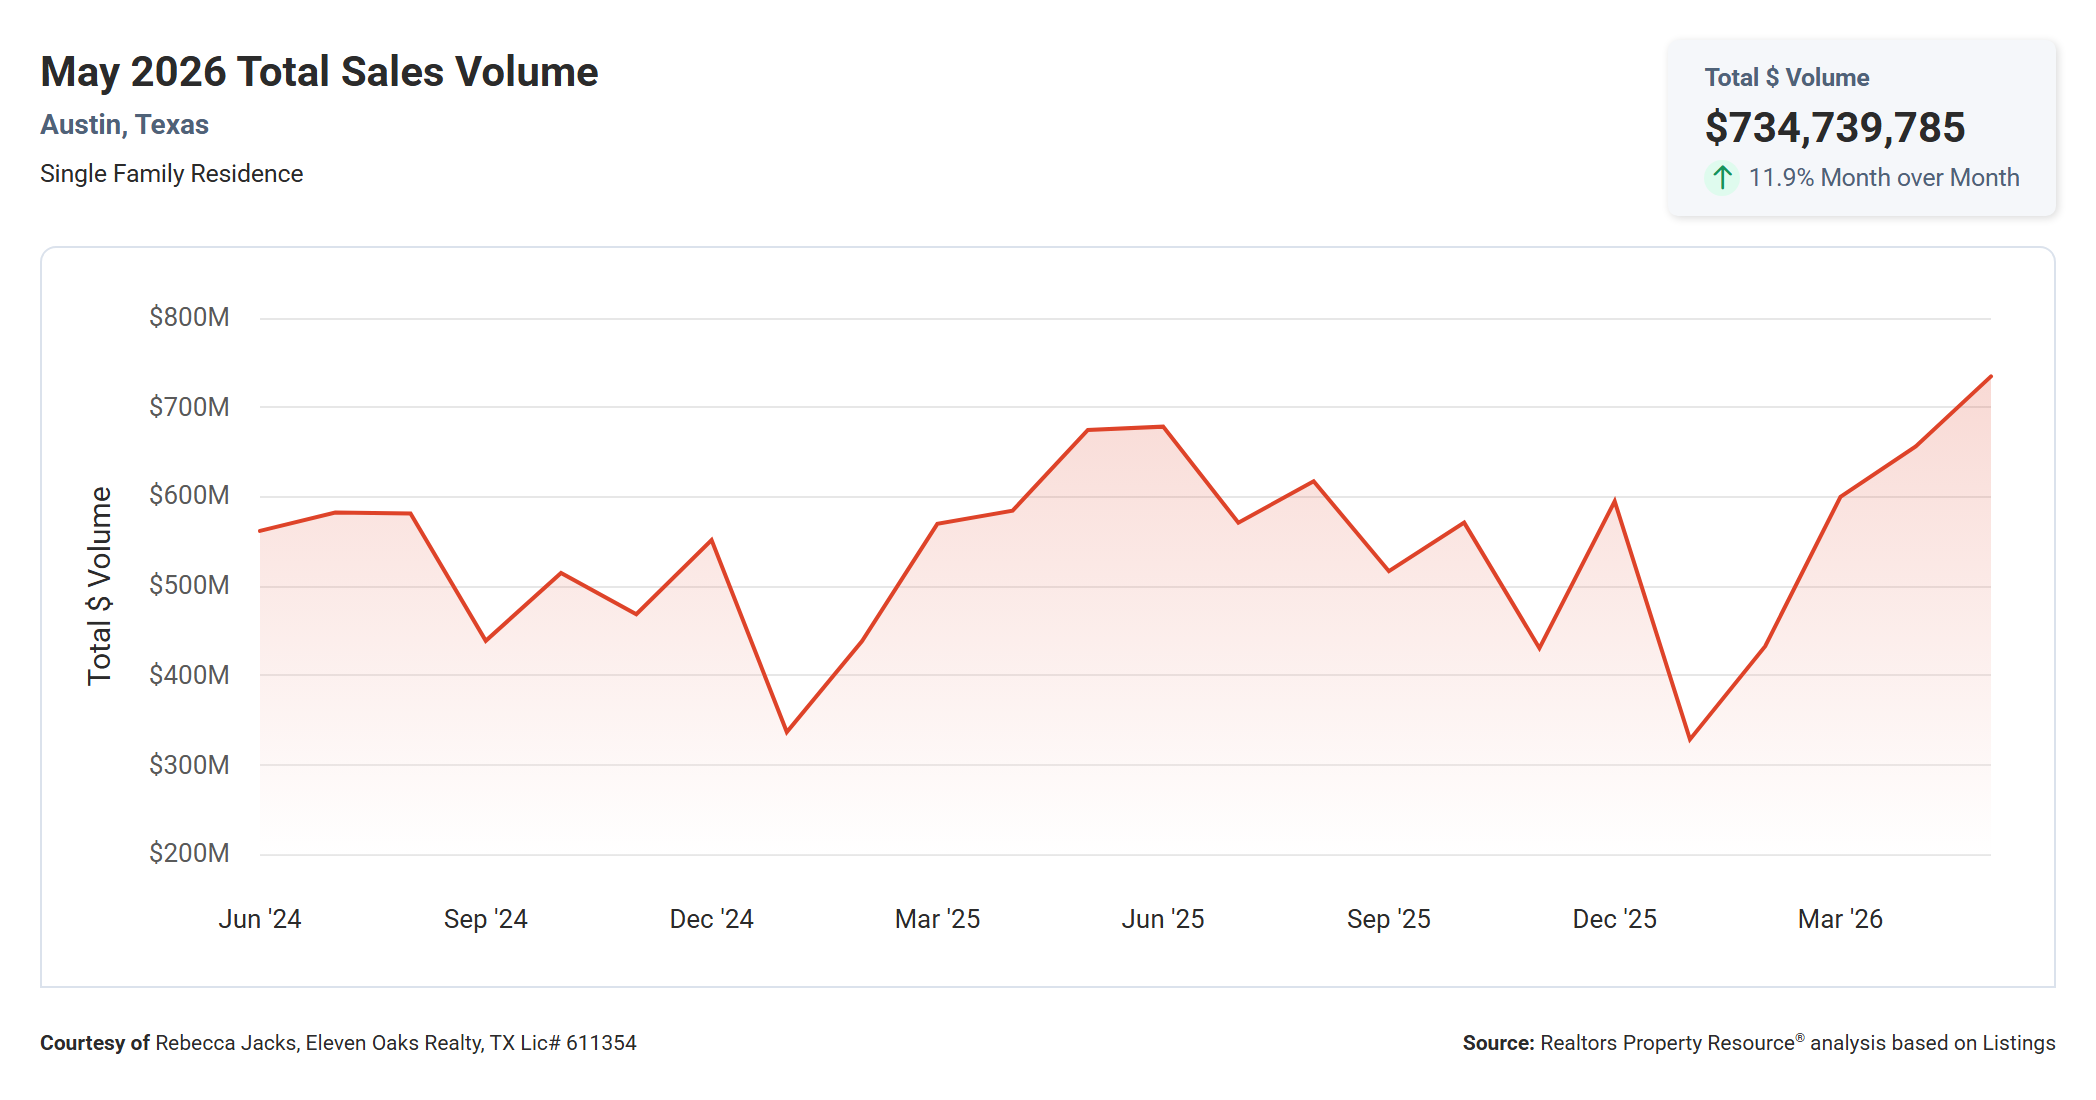
Total sales volume in Austin in May 2026 reached $734,739,785, up 11.9% from $656,330,000 in April 2026 and up 8.9% from $674,920,000 in May 2025.
The two-year chart shows total volume follows a predictable seasonal arc, with lows in the winter months and peaks in the late spring and summer. May 2026's reading is the highest point on the two-year chart, surpassing the prior peak from summer 2025 and establishing May 2026 as a standout month for transaction dollar volume in recent history.
Crossing $734 million in a single month is a significant milestone. It reflects both the volume of transactions and the price level of those transactions. Even with prices modestly below last year, the combination of more buyers and more closings pushed total dollar volume above comparable prior-year periods.
For the broader market, strong total volume is a healthy signal. It indicates that buyers and sellers are meeting, transactions are completing, and capital is flowing through the Austin real estate market. Whatever headwinds have affected this market in recent years, the May 2026 data suggests the market is working well.
May 2026 Austin Real Estate by the Numbers
The table below is pulled directly from the Austin Board of REALTORS MLS statistics for May 2026 and covers 937 closed single-family residential transactions in the city of Austin.
| Min | Max | Avg | Median | |
|---|---|---|---|---|
| Beds | 1 | 8 | 4 | 3 |
| Baths | 1 | 9 | 3 | 3 |
| Sq Ft | 686 | 10,991 | 2,353 | 2,158 |
| Lot Sq Ft | -- | 114,301,440 | 135,219 | 8,494 |
| List Price | $154,900 | $6,500,000 | $870,450 | $635,000 |
| LP/Sq Ft | $112.80 | $1,674.64 | $359.57 | $308.20 |
| Acres | 0.000 | 2,624.000 | 3.104 | 0.195 |
| Close Price | $165,000 | $6,400,000 | $845,855 | $630,000 |
| CP/Sq Ft | $112.80 | $1,858.67 | $350.48 | $302.23 |
| CP/LP% | 75.00% | 185.00% | 97.80% | 98.00% |
| CP/OLP% | 57.00% | 273.00% | 95.54% | 97.00% |
| ADOM | 0 | 669 | 44 | 19 |
The most expensive home that sold in May 2026 sold for $6,400,000 and the least expensive home sold for $165,000. Homes ranged in size from 686 to 10,991 square feet with an average size of 2,353 square feet. The average price per square foot for a home that sold in Austin in May 2026 was $350.48 with the lowest being $112.80 per square foot and the highest being $1,858.67 per square foot. It took, on average, 44 days to sell a home in Austin and sellers received, on average, 95.54% of their original list prices.
The CP/LP% of 97.80% average compared to the CP/OLP% of 95.54% average tells you something important about how pricing plays out. The 2.26 percentage point gap between those two figures means that on average, sellers made a price reduction before going under contract. Buyers are ultimately paying 97.8% of the final list price, but only 95.5% of what the seller originally asked. On a home listed at $635,000, that difference from original list price to close amounts to roughly $28,300.
The ADOM spread is equally revealing. The average of 44 days versus the median of 19 days indicates that most homes sell quickly, but a group of outliers that stayed on the market much longer pulled the average up considerably. If your home is priced correctly and in good condition, you should expect to be in the median group, not the average group. Homes that linger well past 30 days are almost always telling you something about price.
Where Buyers Are Shopping: A Look at Price Ranges
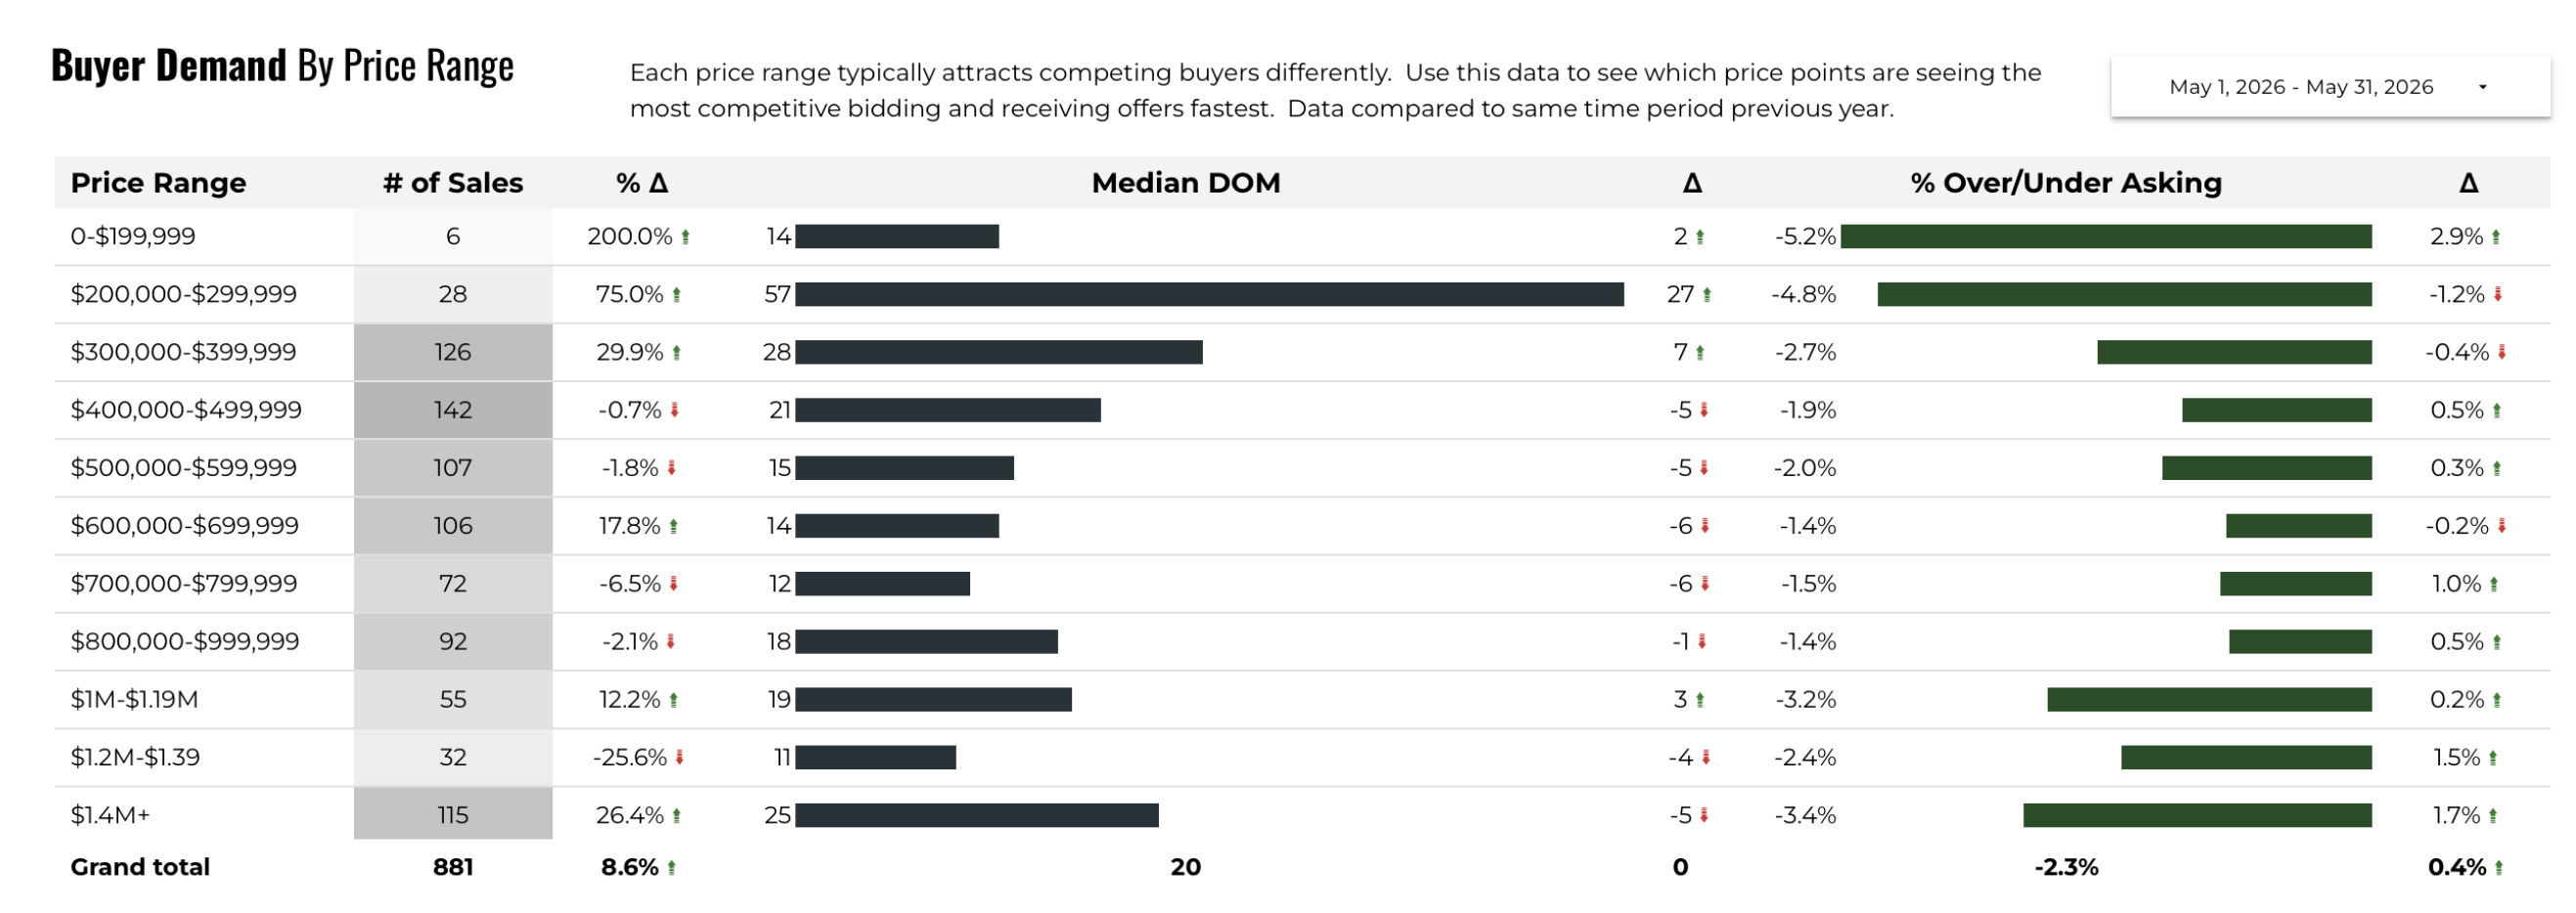
Unlock MLS tracked 881 buyer demand data points across 11 price brackets for the Austin single-family market in May 2026.
The $400,000-$499,999 bracket led all price ranges with 142 sales, followed closely by $300,000-$399,999 at 126 sales and $500,000-$599,999 at 107 sales. Those three brackets combined accounted for 375 transactions, or roughly 42.6% of all buyer activity in May. This concentration in the mid-range confirms that buyer purchasing power in Austin is broadly centered between $300,000 and $600,000, and the homes in those price ranges are facing the most consistent competition from other buyers.
The middle and upper-middle brackets from $600,000 to $999,999 generated solid activity as well. The $600,000-$699,999 range had 106 sales, up 17.8% from May 2025, while $700,000-$799,999 had 72 sales and $800,000-$999,999 had 92 sales. Taken together, that $600K-$999K tier accounted for 270 transactions, or about 30.6% of May's volume. The 17.8% year-over-year increase in the $600K-$699K range suggests buyers are stretching into that price point as prices in the lower brackets become more competitive.
At the lower end of the market, the sub-$200,000 bracket saw only 6 sales, reflecting the reality that very few homes in Austin close below that threshold. The $200,000-$299,999 bracket had 28 sales, with a year-over-year increase of 75.0%, though the absolute number is still modest. Together, homes under $300,000 represented less than 4% of May's sales activity.
The luxury segment was notably active. The $1.4M+ bracket had 115 sales, up 26.4% year over year, making it one of the top three brackets by sales volume. Adding the $1M-$1.19M (55 sales) and $1.2M-$1.39M (32 sales) brackets, the combined luxury segment above $1 million accounted for 202 transactions, or nearly 23% of all sales in May.
For buyers active in the luxury segment, property taxes vary significantly by area and can meaningfully affect monthly costs. See our guide to Austin luxury home property taxes for 2025 area-by-area rates across West Austin, Lakeway, Bee Cave, Dripping Springs, Spicewood, and more.
On days on market, the faster-moving price ranges were $700,000-$799,999 (12 days), $500,000-$599,999 (15 days), and $600,000-$699,999 (14 days). The $200,000-$299,999 bracket stood out for the opposite reason, with a median of 57 days, reflecting either limited inventory, condition issues, or both at that price point. For buyers targeting the $500K-$700K range, 22 days or less is a reasonable expectation for how quickly well-priced homes disappear.
On the over/under asking metric, every price range came in below asking, ranging from -1.4% in the $700K-$799K range to -5.2% in the sub-$200K bracket. The grand total of -2.3% is consistent with the RPR sold-to-list data. For buyers in the most active mid-range brackets ($400K-$599K), you can generally expect to pay within 2% of the list price on a home priced correctly.
The Listing-to-Close Price Gap: What Sellers Need to Know
The ABoR statistics reveal a meaningful gap between two different sold-to-list metrics. The average CP/LP% of 97.80% measures how close buyers paid to the final list price when they wrote their offer. The average CP/OLP% of 95.54% measures how close they paid to the original asking price before any reductions. The 2.26 percentage point difference between those two numbers represents the price reductions that happened in between.
On a home originally listed at the May 2026 median list price of $635,000, a 4.46% reduction from original list to close represents approximately $28,300 that leaves the table before a buyer ever makes an offer. The Unlock MLS price drop data reinforces this: 54% of active listings have taken at least one price reduction, with an average reduction of 8% from the original asking price. Listings that reduced their price went under contract a median of 15 days after the reduction.
The takeaway for anyone entering the market as a seller is clear. Pricing your home accurately from the start is more effective than listing high and reducing later. Homes that are overpriced at launch spend more time on market, often sell for less than they would have at the correct opening price, and give buyers and their agents a negotiating foothold. The data shows that homes priced correctly are selling in about 19 days (median ADOM) while the market-wide average is pulled up to 44 days by the outlier homes that struggled.
What This Means for Buyers
Prices are down 1.6% year over year on a median basis, and when you factor in the price-per-square-foot data (essentially flat at $305), you are buying Austin real estate at a modest discount compared to the peak of the 2024-2025 cycle. The median close price of $620,000-$630,000 (depending on the data source) is $10,000-$30,000 below the 2022 peak, representing real dollar savings for buyers who waited.
The negotiating environment is more nuanced than the headlines suggest. Yes, sold-to-list ratios are high at 97.85%, which means most homes close close to their list price. But the CP/OLP% of 95.54% shows that sellers on average give back 4.5% from their original ask. The strategy that works is identifying homes that have already taken price reductions, where you can negotiate from a lower baseline, or being quick on well-priced new listings before they attract competition.
Pending contracts are rising (up 3.7% year over year) and the spring market is active, which means competition will likely increase, not decrease, over the coming weeks. If you are in a position to buy and have been waiting for prices to drop further, the 22-day median time to sell suggests the window for leisurely decision-making is narrower than it has been in recent months.
Interest rates remain a critical variable in your purchasing decision. With prices relatively stable year over year, the rate environment matters as much as the list price for your total monthly payment. Talk to your lender now about rate options, buydowns, and what your purchasing power looks like at current rates versus waiting six months for a potential shift.
What This Means for Sellers
The demand signal in May 2026 is real. Sales are up 8% year over year, total dollar volume hit a two-year high at nearly $735 million, and pending contracts are 3.7% above May 2025 levels. Buyers are active and they are closing. If your home has been on the sidelines while you waited for the right moment, May's data suggests conditions are favorable for listing.
The competition landscape is improving for sellers, but it is not without complexity. New listings are down 16.7% year over year, which means fewer competing sellers, but active listings are rising month over month as more sellers enter the spring market. The window where inventory is lean and demand is strong does not stay open indefinitely, and the summer months typically bring more competing listings.
The price discipline data from Unlock MLS is the most important thing for sellers to internalize before choosing their list price. With 54% of active listings having taken at least one price reduction and an average drop of 8%, overpriced homes are being corrected by the market regardless of what sellers want. The homes that avoid price reductions are the ones priced at or slightly below market from day one. Those homes sell in 19 days or fewer and net the seller the highest percentage of their original asking price.
The sold-to-list ratio of 97.85% is a healthy market reading, and the median sold price climbing back to $620,000 in May after a slower winter confirms that buyer demand at this price level is stable. Sellers who price accurately, present their home well, and enter the market now rather than waiting until midsummer are likely to see the best outcomes.
Market Summary and Outlook
May 2026 was the strongest month of the year for the Austin real estate market across nearly every metric. Median sold price climbed to $620,000, total sales volume hit a two-year high at nearly $735 million, homes sold increased 8% year over year, and the market held Seller's Market status according to RPR's gauge. The combination of rising prices, increasing sales volume, and tightening inventory sent a clear signal that the market correction of 2024-2025 has largely worked itself through.
Year-over-year comparisons paint a picture of a market that is modestly lower in price (down 1.6% on median sold price) but significantly higher in transaction activity and lower in supply. That is an unusual combination that typically resolves in favor of prices moving higher, not lower. Sellers have fewer competing listings than they did a year ago, and buyers are competing for a smaller pool of options while spending more money in total. Both of those dynamics support price stability or modest appreciation in the months ahead.
The key variable to watch is the pace at which new listings enter the market. May's new listing count of 1,366 was 16.7% below last year, which has been a primary driver of the supply tightness that is pushing inventory down and prices up. If new listings accelerate meaningfully in June and July, the balance could shift toward buyers. If sellers remain cautious, the current supply constraints will persist.
Austin's fundamentals support continued demand from people relocating to the area for employment and lifestyle reasons. The city's diverse economy, continued job growth, and relative affordability compared to coastal markets remain compelling pull factors. The market data for May 2026 suggests those fundamentals are translating into real buyer activity right now.
Time to Buy? Time to Sell?
For buyers, the timing argument leans toward acting in the near term rather than waiting. Prices are modestly below last year, inventory is tighter than it has been in months, and the pending data shows competition is increasing. Waiting for prices to fall further assumes supply will increase substantially, which the new listing data does not support. Buyers who are financially ready and have found the right home should give serious weight to the risk of waiting, not just the risk of buying.
For sellers, the case for listing now is supported by the data in nearly every section of this report. Demand is up, supply is tight, prices are rising month over month, and homes priced correctly are selling in three weeks. The spring market is active, and buyer demand typically peaks between now and late summer before moderating in the fall. A seller who waits until fall is not waiting for better conditions; they are waiting for conditions that are historically less favorable.
For sellers who feel they need more time to prepare, use the next 30-60 days wisely. The data from the Price Drops section shows that overpriced homes eventually sell for less, not more. The best investment of preparation time is an honest pricing conversation with your agent before listing, not after.
Action Items for Buyers
- Get fully pre-approved now, not pre-qualified, because with 22-day median time to sell, you need to be able to move quickly when the right home comes available and a full pre-approval letter carries more weight with sellers.
- Focus your search in the $400,000-$599,999 range strategically, knowing this is where competition is highest, and consider whether stretching slightly into the $600,000-$699,999 range (where days on market are also short at 14 days) gives you access to less-competed inventory.
- Look specifically for homes that have already taken at least one price reduction, as the Unlock MLS data shows these homes sell about 15 days after the reduction, meaning you have a brief window to act while sellers are motivated and the negotiating baseline is lower.
- Request the CP/OLP% data on any home you are considering. Knowing that sellers on average net 95.54% of original asking means you have context for your offer, particularly on homes that have been on the market more than 30 days without a price drop.
- Talk to your lender about rate buydown options now. With prices relatively stable year over year, a temporary rate buydown might lower your monthly payment more meaningfully than waiting for a price reduction that the current supply-demand balance suggests may not come.
- Set up automated search alerts for new listings in your target neighborhoods because homes priced correctly are going under contract in roughly three weeks, and you cannot afford to find out about the right property five days after it listed.
Action Items for Sellers
- Price your home at or slightly below the current market, because the Unlock MLS data shows 54% of active listings have taken price reductions averaging 8%, and homes that reduce eventually sell for less than well-priced homes that did not need to reduce.
- Prepare your home for market with the assumption that buyers in the most active price ranges ($300K-$600K) are comparing your home to several others and will choose the one that is in the best condition at the fairest price.
- List now rather than waiting for fall, because buyer demand peaks in spring and early summer, pending contracts are up 3.7% year over year, and the seasonal window of high competition among buyers typically closes by late August.
- Review the buyer demand data for your price range before setting your list price, because the median days on market, over/under asking percentage, and year-over-year sales change in your specific bracket give you a clearer picture of what buyers in that range are doing than any general market statement.
- Account for the listing-to-close gap in your net proceeds calculation, because if you set your price expecting to net 97.80% of list, you should also factor in that buyers will compare your home to the CP/OLP% data and expect some cushion from your original asking price.
- Move quickly on offers that come in within the first two weeks of listing, as the ADOM data shows the typical sold home closes within 19 days, and offers that arrive early in a listing period are more likely to be from serious, motivated buyers who have done their research.
Final Word on the Market
May 2026 rewarded sellers who priced correctly and buyers who acted decisively. The market is not easy for either side, but it is functioning well. Homes are selling, prices are stable to slightly improving, and the supply-demand balance has tipped back toward Seller's Market territory for the first time in several months. That does not mean every home sells instantly or that every seller gets their original asking price. It means the market is healthy, active, and driven by genuine buyer demand rather than speculation or distress.
The numbers in this report tell a consistent story: Austin real estate in May 2026 is a market where preparation matters more than timing. Sellers who price accurately from the start net more. Buyers who come to the table ready to move get the homes they want. The agents and clients who understand the data are in a stronger position than those who are reacting to headlines.
For homeowners thinking about their next move, and buyers still figuring out whether now is the right time, the data is your guide. Make the decision that fits your life and your financial situation, not the one that tries to perfectly time a market that no one can predict with certainty.
Questions About the May 2026 Austin Real Estate Price Report?
Have questions about what the May 2026 Austin Real Estate Price Report means for your specific situation? We are happy to help. If you are thinking about buying a home in Austin, our Buyers page has resources to help you understand the process and get started. If you are thinking about selling, our Sellers page walks through what to expect in today's market.
Reach out to Rebecca Jacks and the team at Eleven Oaks Realty. Call or text (512) 827-8323 or email info@11OaksRealty.com. We have been helping buyers and sellers since 1978 and we are here to help you make the best decision for your situation, whatever that looks like.
Data sources: Realtors Property Resource (RPR), Austin Board of REALTORS MLS, Unlock MLS. All figures are for single-family residential properties in the city of Austin. Reported figures reflect May 1, 2026 through May 31, 2026. Some variation between data sources may exist due to differing methodology and timing of data pulls.




Leave a Reply