
Eleven Oaks Realty is proud to present their October 2025 Austin Luxury Real Estate Price Report measuring market activity in the Austin area single family home market priced at $1 million or over. Our October 2025 Austin Luxury Real Estate Price Report covers the luxury market in the following Austin metro area counties: Travis, Williamson and Hays.
Overview
The Austin luxury real estate market ($1M+) is demonstrating renewed momentum after a slower start to the year. As of October 2025, high-end buyers have re-entered the market, driving up sales activity while prices remain steady or slightly softened. The current data reveals a market that is active but segmented—competitive in the $1M–$1.3M range and more negotiable above $1.4M.
Market Highlights
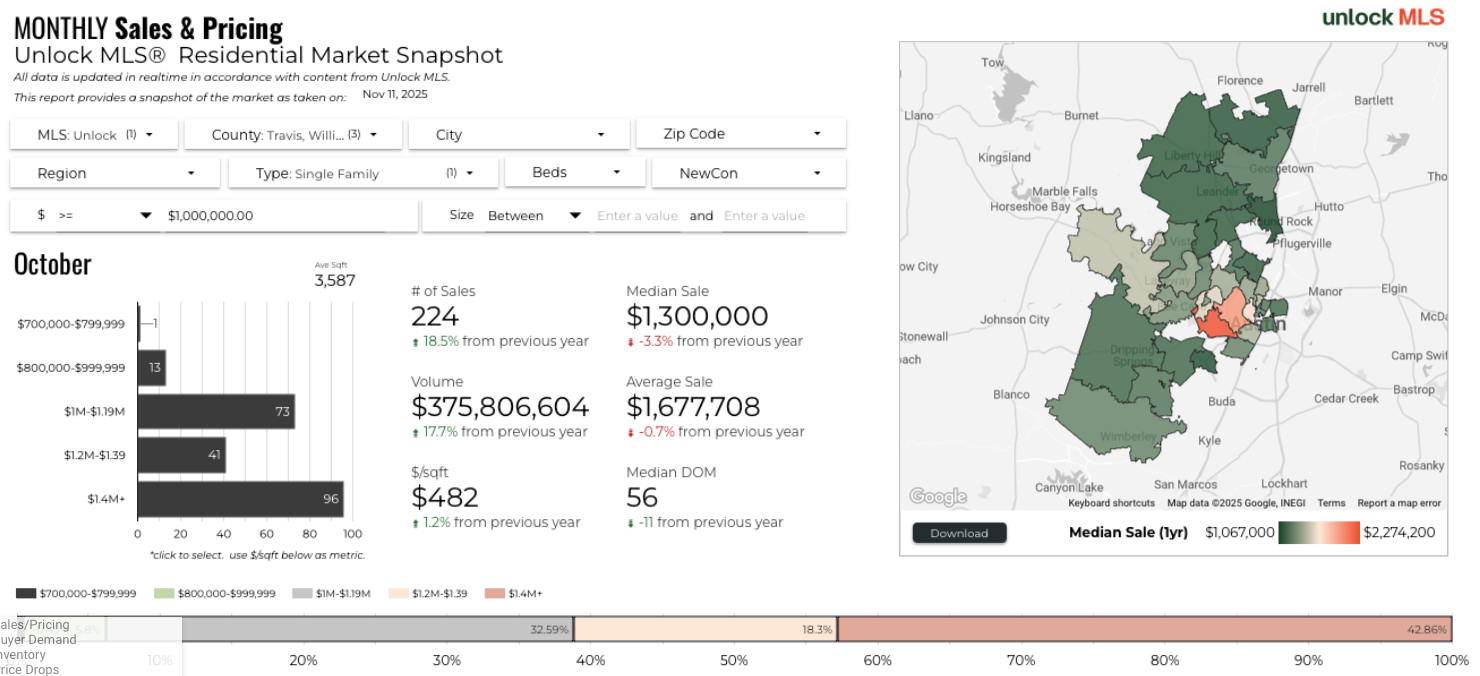
- Luxury sales: 224 in October 2025 (+18.5% YoY)
- Median price: $1.3M (-3.3% YoY)
- Average price: $1.68M (-0.7% YoY)
- Average price/sq ft: $482 (+1.2% YoY)
- Sales volume: $375.8M (+17.7% YoY)
- Median days on market: 56 (down ~12 days YoY)
- Active listings: 1,326 luxury homes
- Months of inventory: 5.9 – balanced overall
County Breakdown
- Travis County: 178 luxury sales, median ~$1.37M, steady demand and lower DOM
- Williamson County: 23 sales, value-oriented segment with deeper discounts
- Hays County: 23 sales, slower absorption but growing interest in Dripping Springs & Wimberley
Market Dynamics
Balanced but Stratified
Austin’s luxury market shows a clear split:
- $1M–$1.19M: 3.8 months of supply – Seller-leaning
- $1.2M–$1.39M: 4.3 months – Balanced
- $1.4M+: 8.4 months – Buyer’s market
This segmentation means pricing strategy is critical. The sweet spot ($1M–$1.3M) remains in high demand due to relocation buyers, downsizers, and move-up local buyers. Homes above $1.4M face longer marketing periods and higher negotiation pressure.
Price & Negotiation Trends
- Average discount: 5% off list price
- Price reductions: Common among listings that start too high, averaging ~9% before sale
- Buyer mindset: Value-driven; willing to act quickly on competitively priced listings
Homes that launch at market value typically receive strong interest within the first two weeks, while those priced 5–10% above comps risk sitting for 60+ days before adjusting.
Neighborhood Performance
Top-performing luxury zip codes include 78738, 78746, and 78704, which continue to see robust buyer demand and quick sales. Classic prestige neighborhoods like 78703 show softening prices, while 78732 and 78613 offer opportunities for negotiation.
Hot Areas:
- Westlake Hills (78746)
- Lake Travis / Bee Cave (78738)
- Zilker / Bouldin / Travis Heights (78704)
Emerging Value Areas:
- Cedar Park (78613)
- Northwest Austin (78732)
- Dripping Springs & Driftwood luxury acreage (Hays County)
4% Decrease in Median Sold Price
In October 2025, the median home price of a luxury home in Austin was $1,325,000 compared to $1,380,095 in October 2024, showing a 4% decrease in year over year numbers. Last month the median home price of a luxury home in Austin was $1,350,000 showing a 1.9% decrease in month over month comparisons.
23.3% Increase in the Number of Austin Luxury Home Sales
In October 2025, there were 217 luxury homes that sold in Austin compared to 176 luxury homes in October 2024, showing a 23.3% increase in year over year numbers. Last month there were 189 luxury homes that sold, showing a 14.8% increase in month over month comparisons.
26.9% Decrease in Median Time to Sell
In October 2025 the median time to sell a luxury home in Austin was 49 days compared to 67 days in October 2024, showing a 26.9% decrease in year over year numbers. Last month the median time to sell a luxury home in Austin was 60 days, showing a 18.3% decrease in month over month comparisons.
October 2025 Austin Luxury Market Sales Breakdown
In October 2025, 14 (6.26%) of the 224 luxury homes that sold that were priced at $1,000,000 or higher at the time of contract sold for less than $1MM. 73 (32.59%) sold for between $1MM-$1.19MM. 41 (18.3%) sold for $1.2MM-$1.39MM. 96 (42.86%) sold for $1.4MM or more.You’ll see a heat map of median sale pricing where you see the most expensive luxury homes sold in Central and West Austin, a trend we see every month.
Luxury Market Pricing – Median Sold Price Over 3 Years
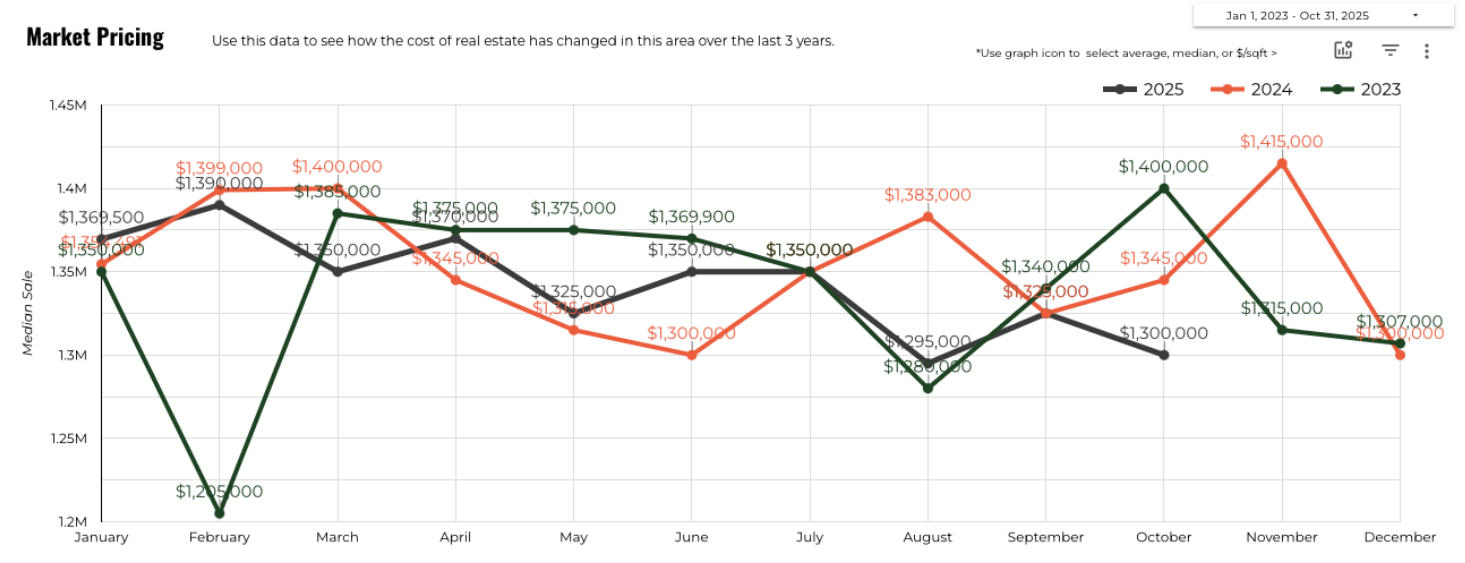
This chart shows the median sales price for Austin luxury homes over the last three years.
Austin Luxury Median & Average Sale Price and $/SqFt By Year
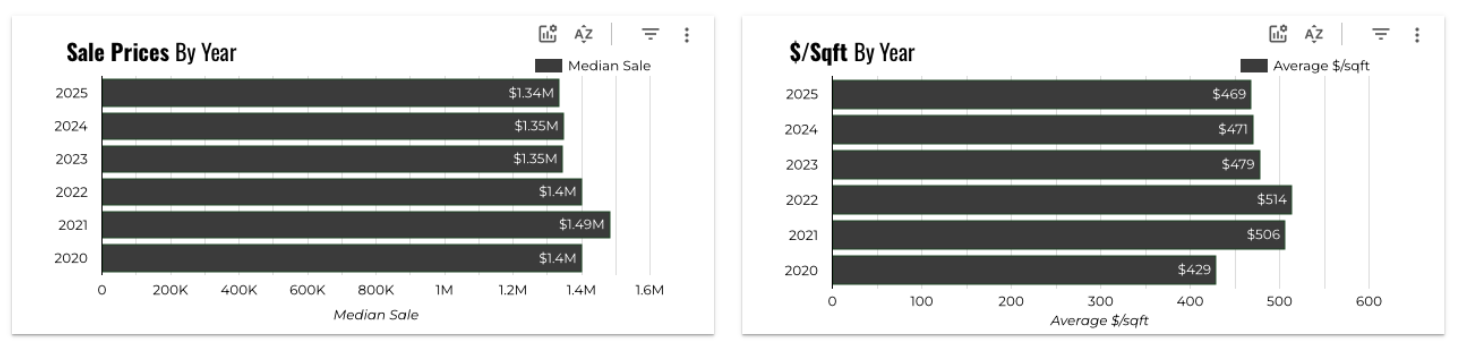
Here is a five year look back on the Austin luxury market with median and average sale price on the left graph and median and average $/sqft by year on the right graph both broken down by year.
Austin Luxury Market Activity
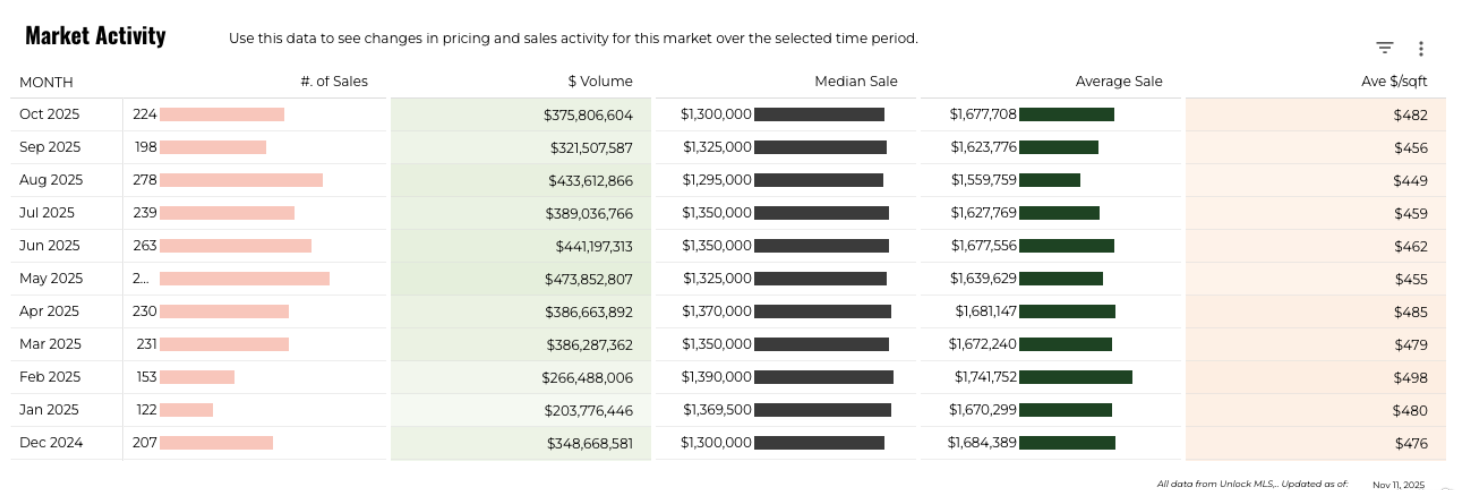
Here is an 11 month look at the number of sales, total sales volume, median price, average price and average price per square foot in the Austin luxury market.
Austin Luxury Buyer Demand
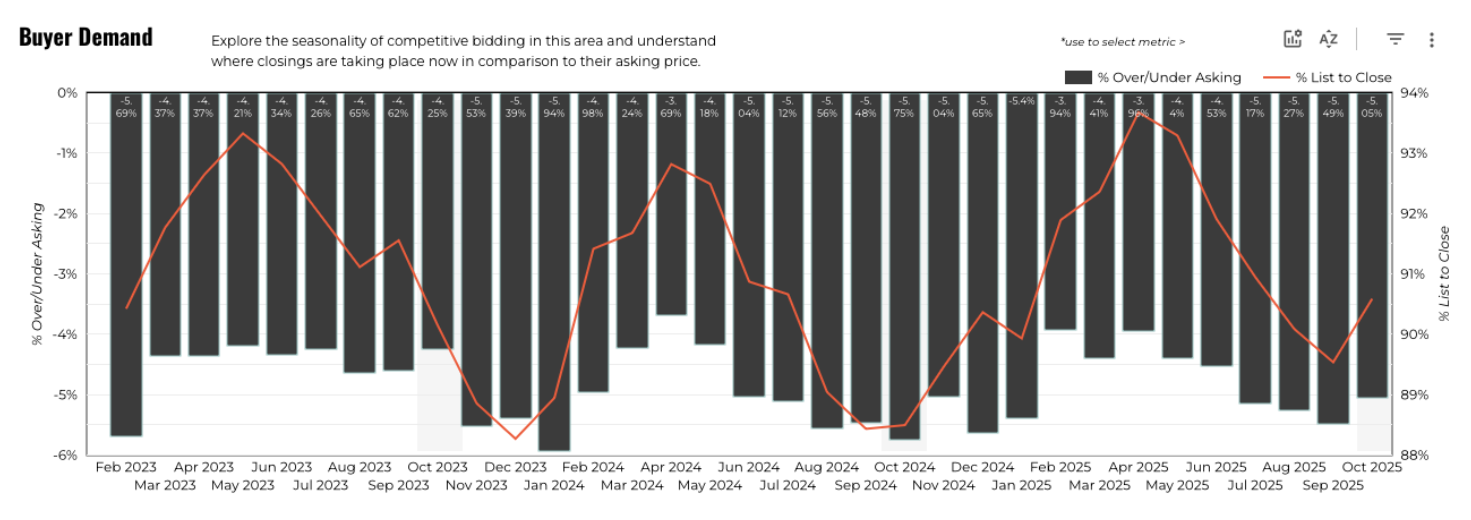
This chart compares a three year look back on % list to close rates and %over/under asking price for Austin luxury homes. As the close rate increases, the % under asking decreases, which is what we would expect.
Austin Luxury Days on Market – Median vs Average
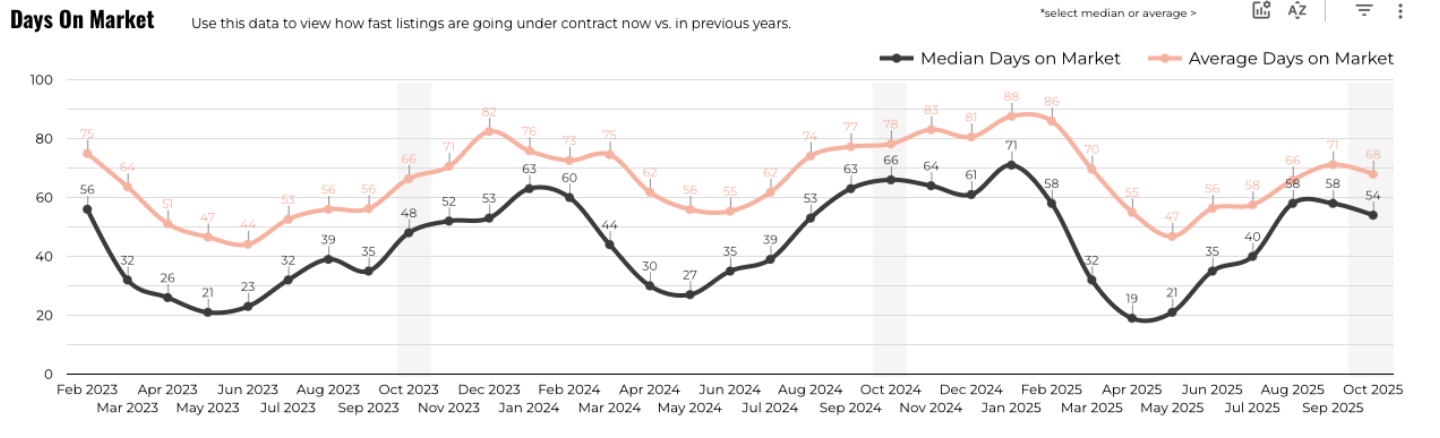
This chart shows how fast listings go under contract compared to previous years. This year is an interesting trend as we are heading into Q4 where we typically see days on market trend up and this year we are seeing in trend down. It will be interesting to see what the next few months show. Last year the average days on market was 66 compared to 54 days this year and the median was 78 compared to 68 this year, so a definite decrease in year over year numbers.
Luxury Buyer Demand by Price Range
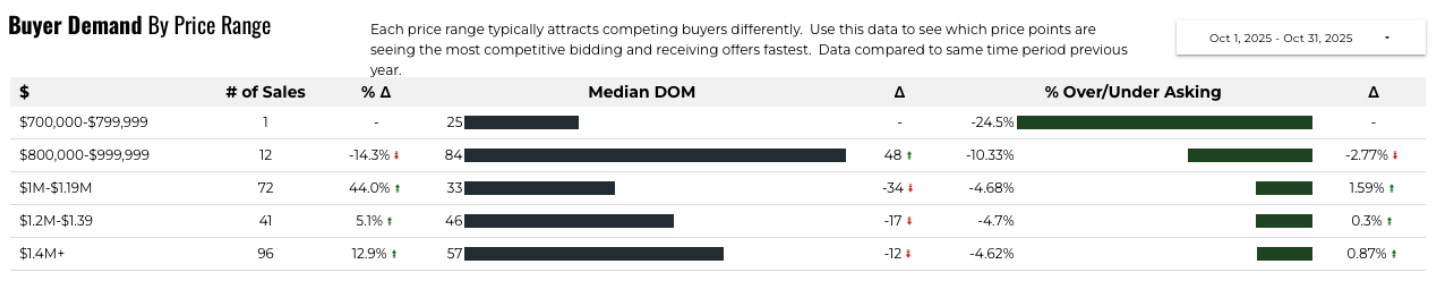
This chart looks at buyer demand by price range. The $800k-$999k sector is only included because those homes were listed at $1MM or more when they sold. This is not the full picture of that segment of the market. Those had the largest segment under asking, but those numbers are a little skewed as they only factored in homes that were listed at $1MM or above.
This month the $1MM-$1.19MM segment was the fastest moving segment of the luxury market with a median time to sell of 33 days. The next most active segment was the $1.2MM-$1.39MM segment with a median time to sell of 46 days followed by the $1.4MM+ segment with a median time to sell of 57 days. Buyers for luxury homes in the $1MM-$1.19MM segment were able to negotiate an average 4.68% off list price. Buyers for luxury homes in the $1.2MM-$1.39MM segment were able to negotiate an average 4.7% off list price and buyers in the $1.4MM+ segment were able to negotiate an average 4.62% off list price.
Austin Luxury Monthly Inventory
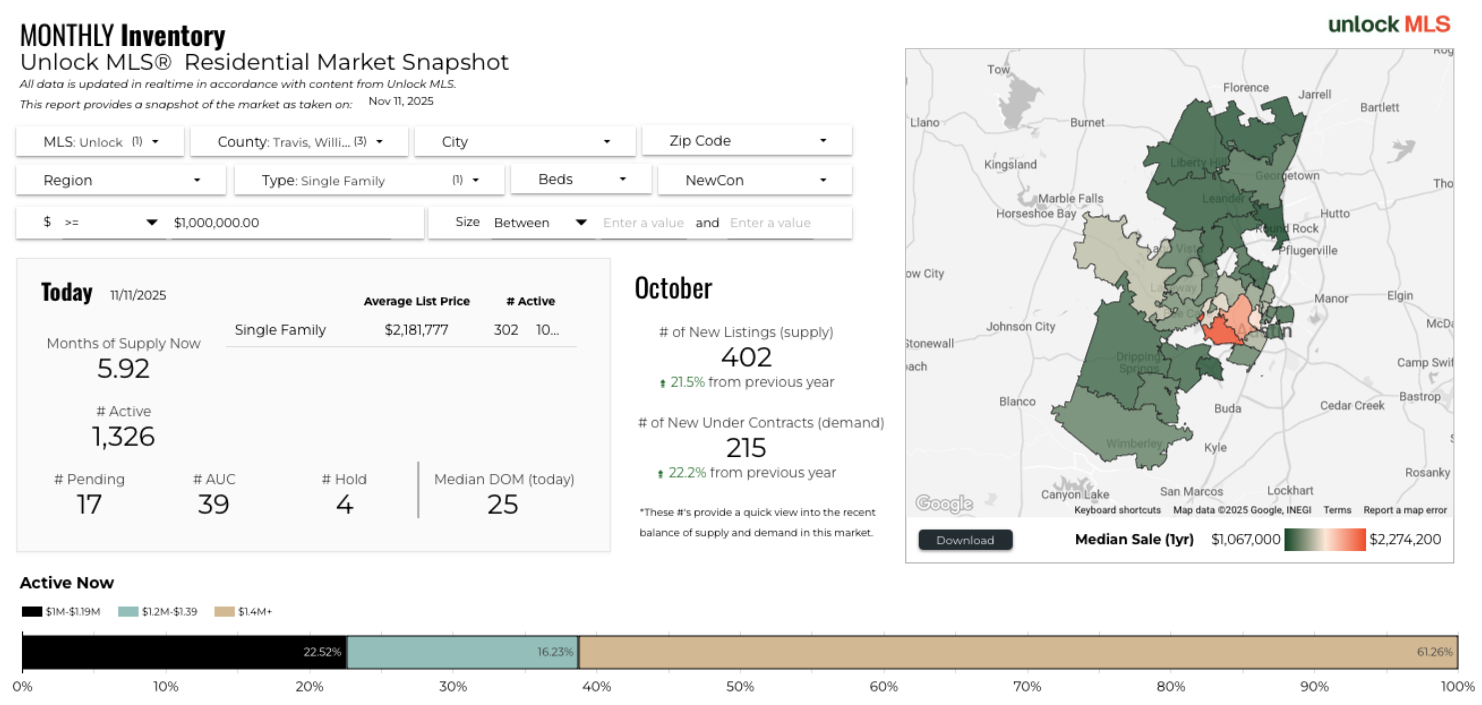
In October 2025, there were 402 new luxury listings, up 21.5% from the previous year. There were 215 luxury homes that accepted a contract, up 22.2% from the previous year. There are currently 5.92 months supply of inventory on the luxury market and 1,326 active luxury homes. 22.52% are priced from $1MM-$1.19MM, 16.23% are priced between $1.2MM-$1.39MM and 61.26% are priced at $1.4MM or more. This October has been a much more active October than we’ve seen in years past. It will be interesting to see if this winter continues that trend.
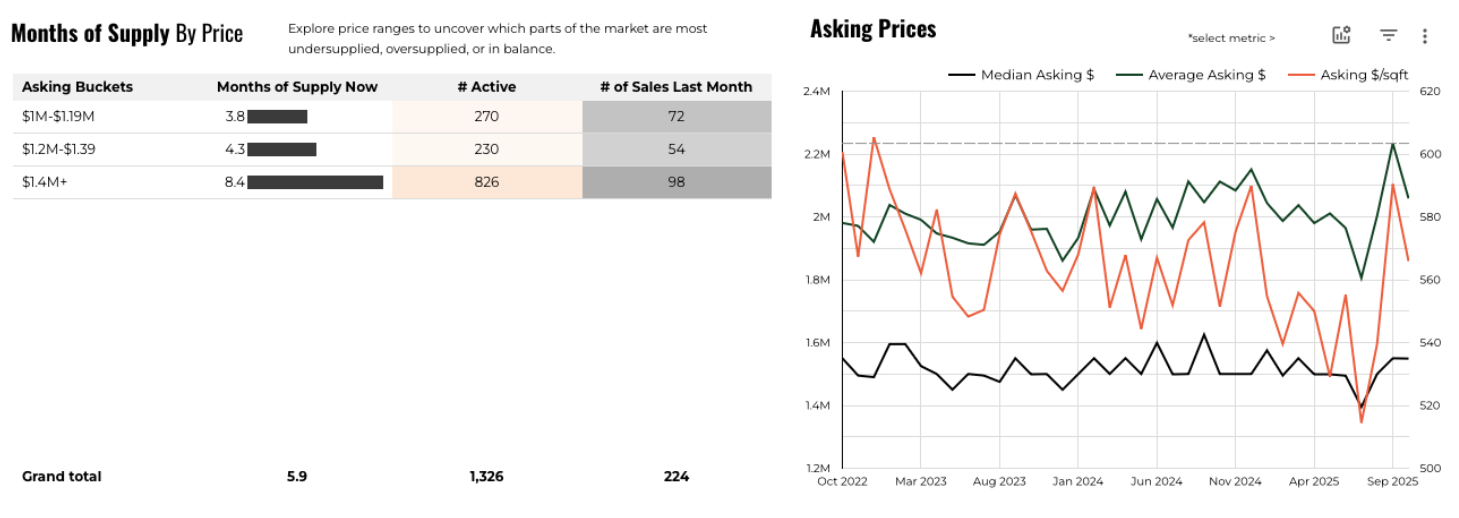
Months Supply of Luxury Inventory by Price and Asking Price
This chart breaks down the months supply of inventory by segment. This month we saw the leanest segment of the market in the $1MM-$1.19MM segment with 3.8 months of inventory, which is classified as a sellers market. Next, came the $1.2MM-$1.39MM segment with 4.3 months of inventory, which is also classified as a sellers market. Finally the $1.4MM and above segment had 8.4 months of inventory, which is classified as a buyer’s market. The chart on the right plots median parking price, average asking price and asking $/sqft.
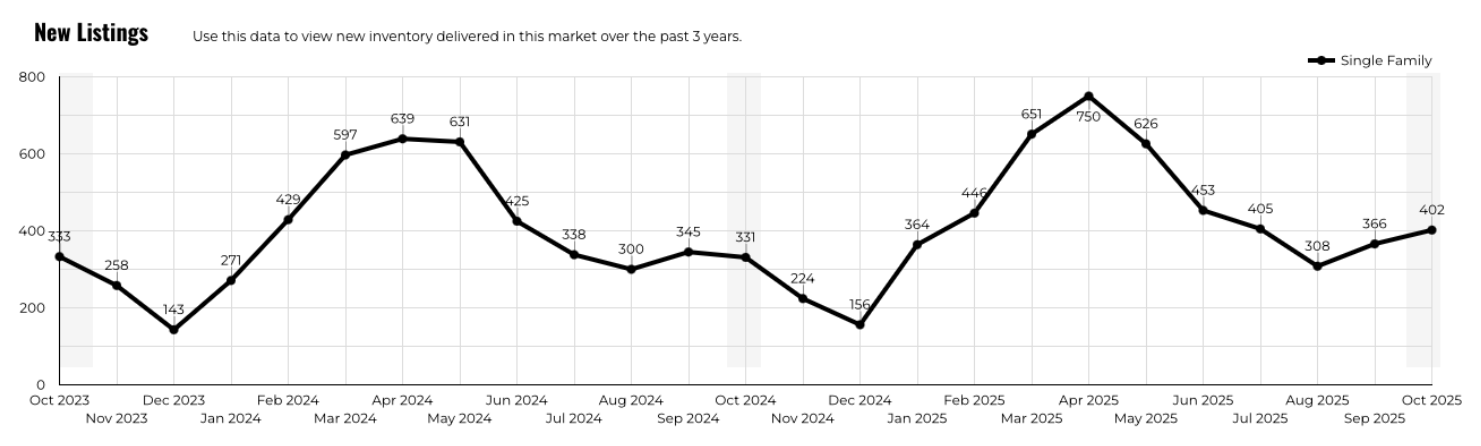
New Austin Luxury Listings
This chart maps the new listings by month over the past 3 years. April 2025 was the highest number of new luxury listings we have seen introduced to the market in the last 3 years. This month we had 402 luxury homes introduced to the market compared to 331 in October 2024 and 333 in October 2025, showing again another increase in luxury market activity this year.
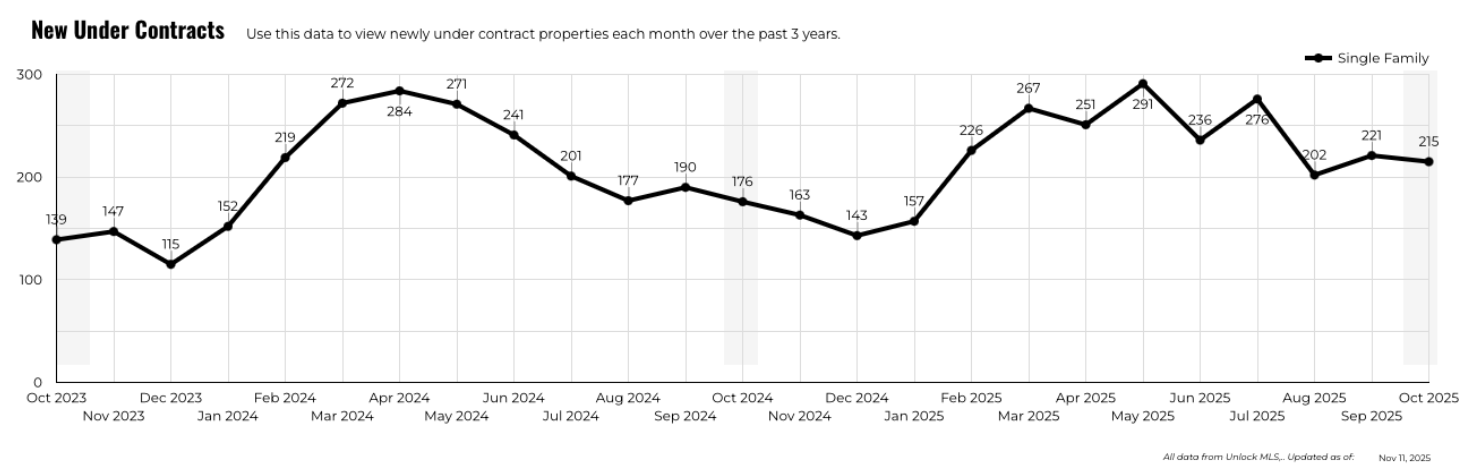
Number of Luxury Listings that Accepted a Contract
In October 2025 there were 215 luxury homes that accepted a contract compared to 176 in October 2024 and 139 in October 2023. 2025 numbers were a 22.2% increase from 2024 and a 54.7% increase from 2023. Fall 2025 is definitely a more active fall that the past two.
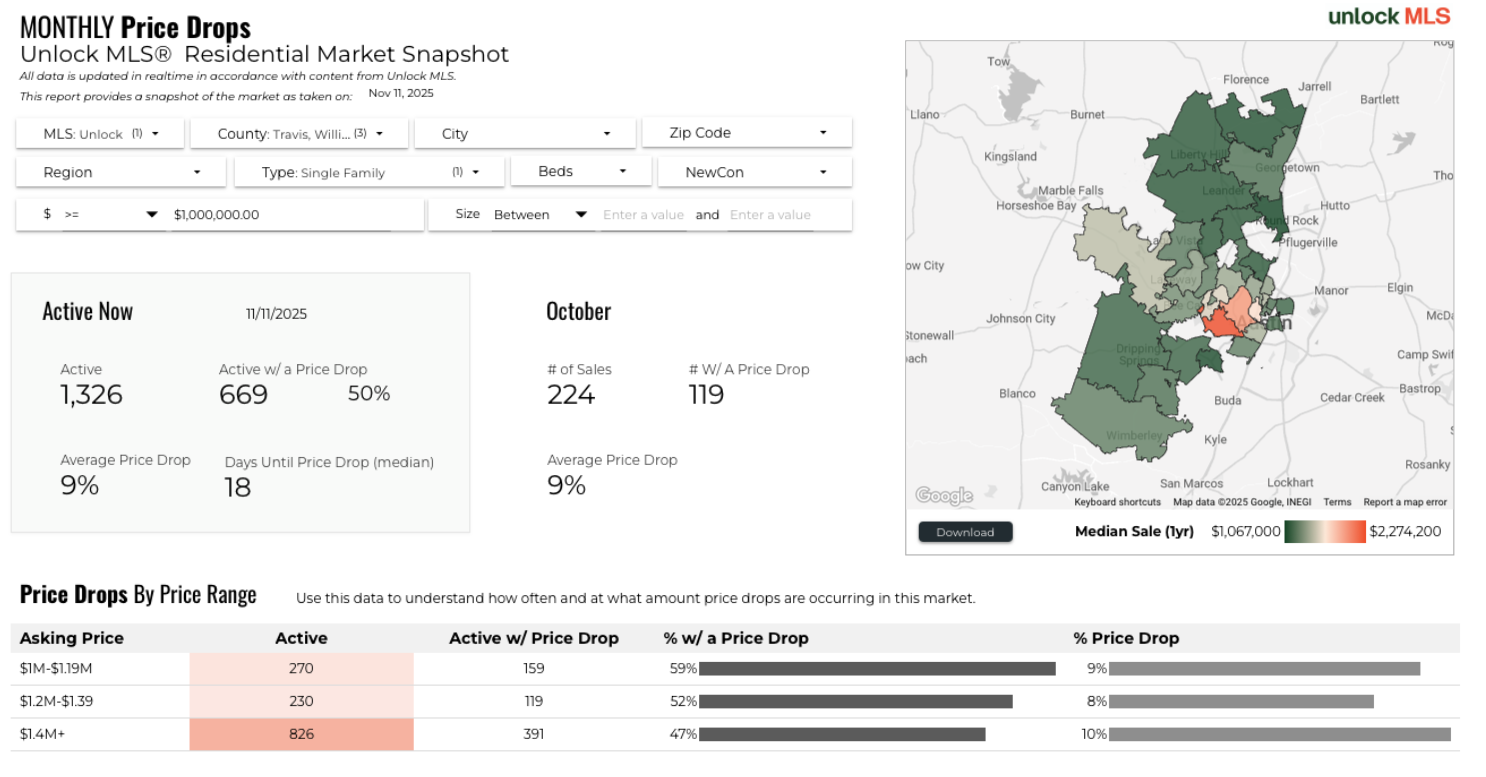
October 2025 Active Price Drop Info
As of November 11, 2025, there were 1,326 luxury homes actively listed for sale. Of those 669 (50%) of them had a price drop. The average price drop was 9% and it took a median of 18 days for sellers to drop the price. Of the 224 October 2025 sales, 119 of them had a price drop with an average of 9%. If you break it down by price tier, homes priced from $1MM-$1.19MM had 270 luxury homes actively listed, 159 (59%) of which had a price drop. The average price drop for homes in this luxury segment was 9%. In the $1.2MM-$1.39MM category, there were 230 homes actively listed for sale and 119 (52%) of them had an 8%, on average, price drop. In the $1.4MM+ segment, there were 826 actively listed luxury homes. Of those, 391 (47%) had a 10%, on average, price drop.
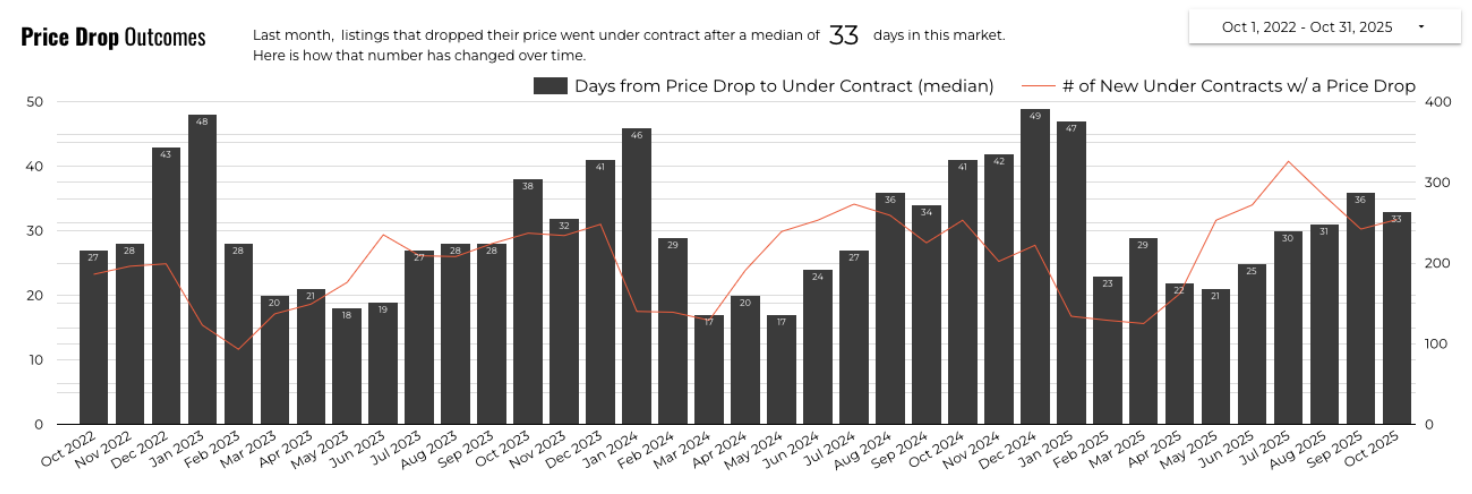
October 2025 Price Drop Outcomes
In October there were 254 luxury homes that accepted a contract after having a price reduction. Homes that went under contract after a price reduction, took a median of 33 days after the price drop to find a buyer.
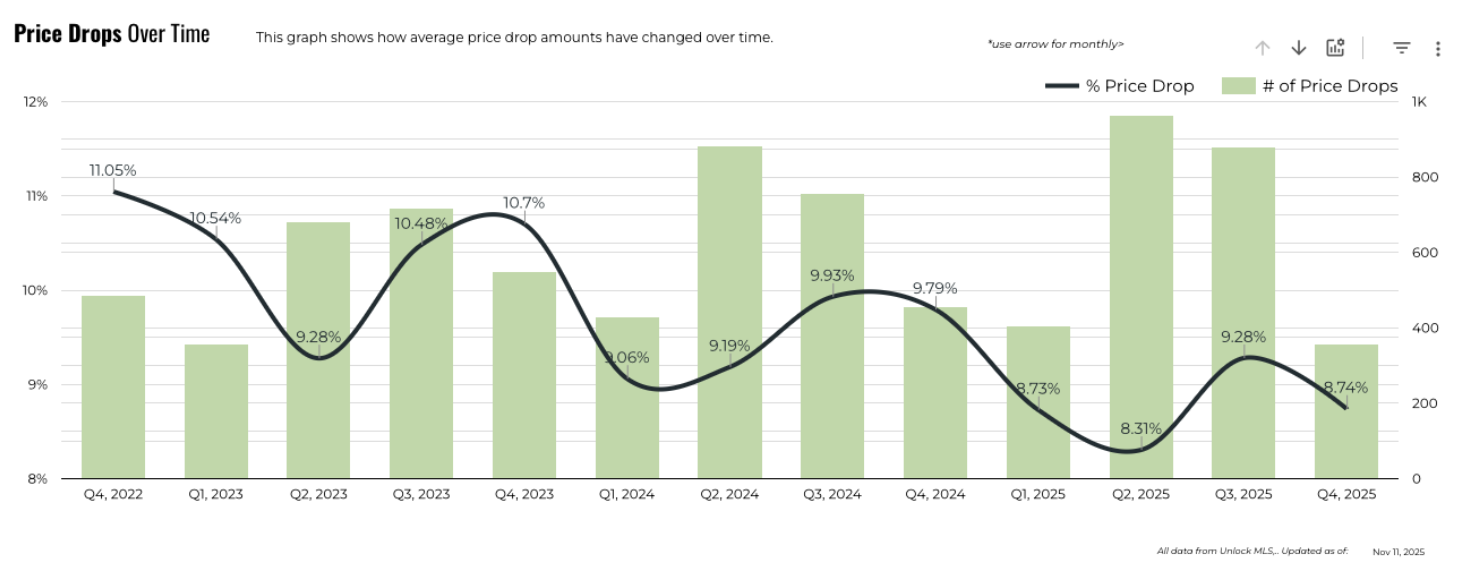
Austin Luxury Home Price Drops Over Time
This quarter (Q4 2025) we have seen 358 price drops so far with an average price drop of 8.74%. This year we are seeing them have to make less of a reduction to get a sale though we are seeing more reductions overall.
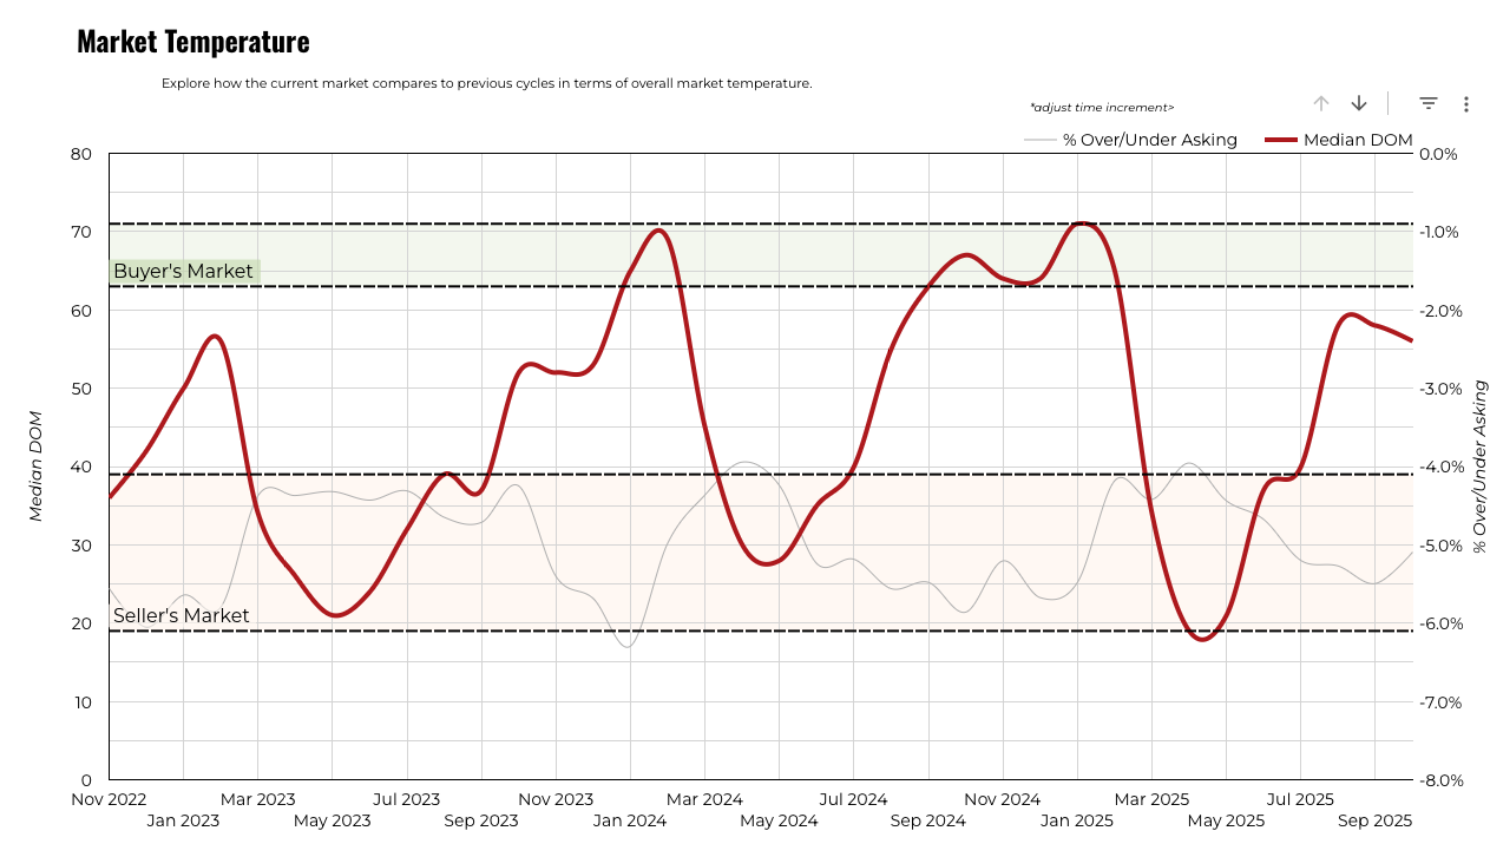
October 2025 Austin Luxury Market Temperature
In October 2025, the median days on market, 56 days fell into balanced market territory. Sellers received, on average, 5.1% less than their list prices.
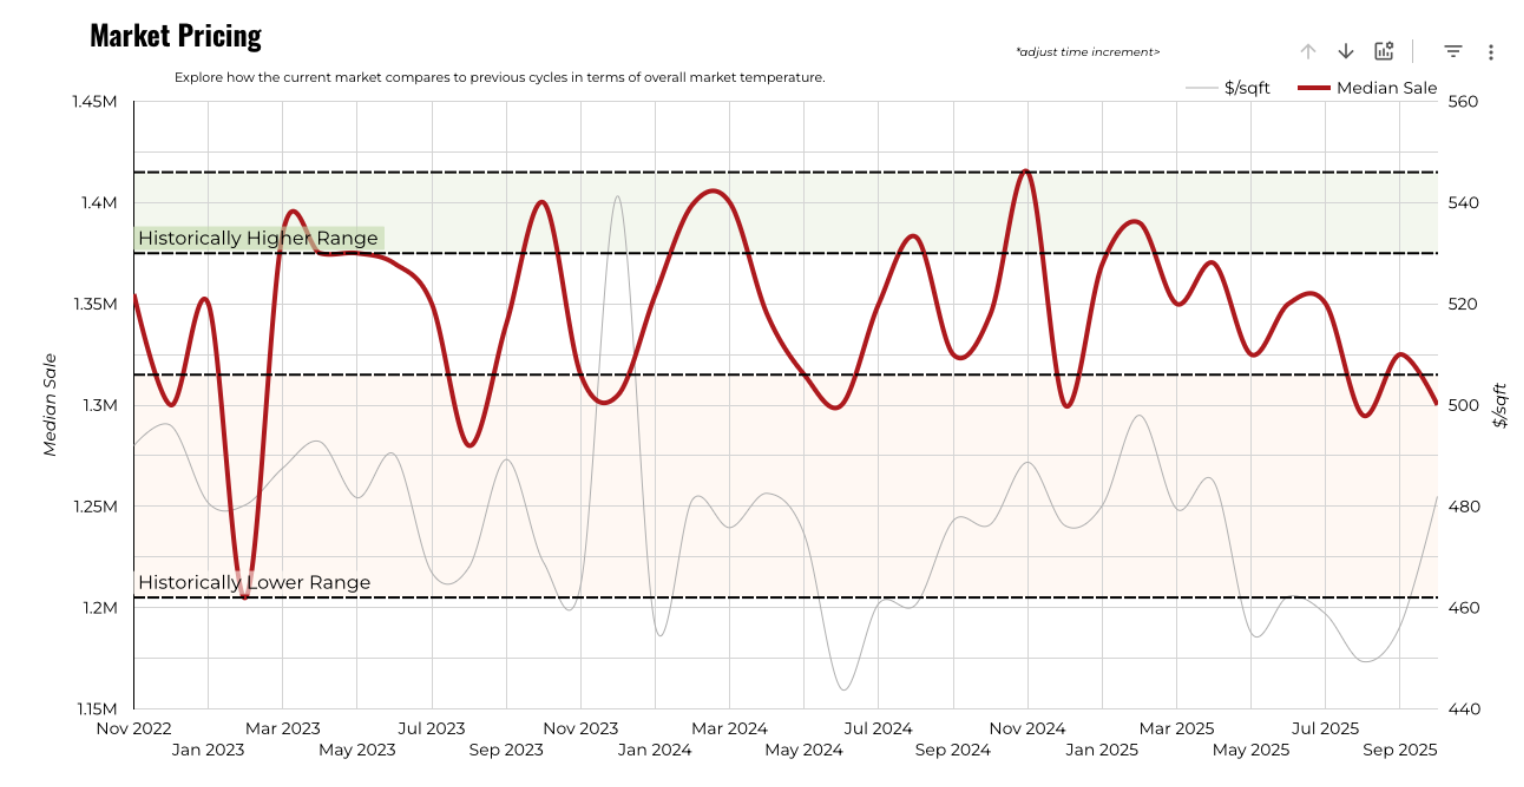
Austin Luxury Market Pricing
In October 2025 we dipped into historically lower pricing of Austin luxury homes, which might explain the increase in activity for buyers recognizing the deals to be had.
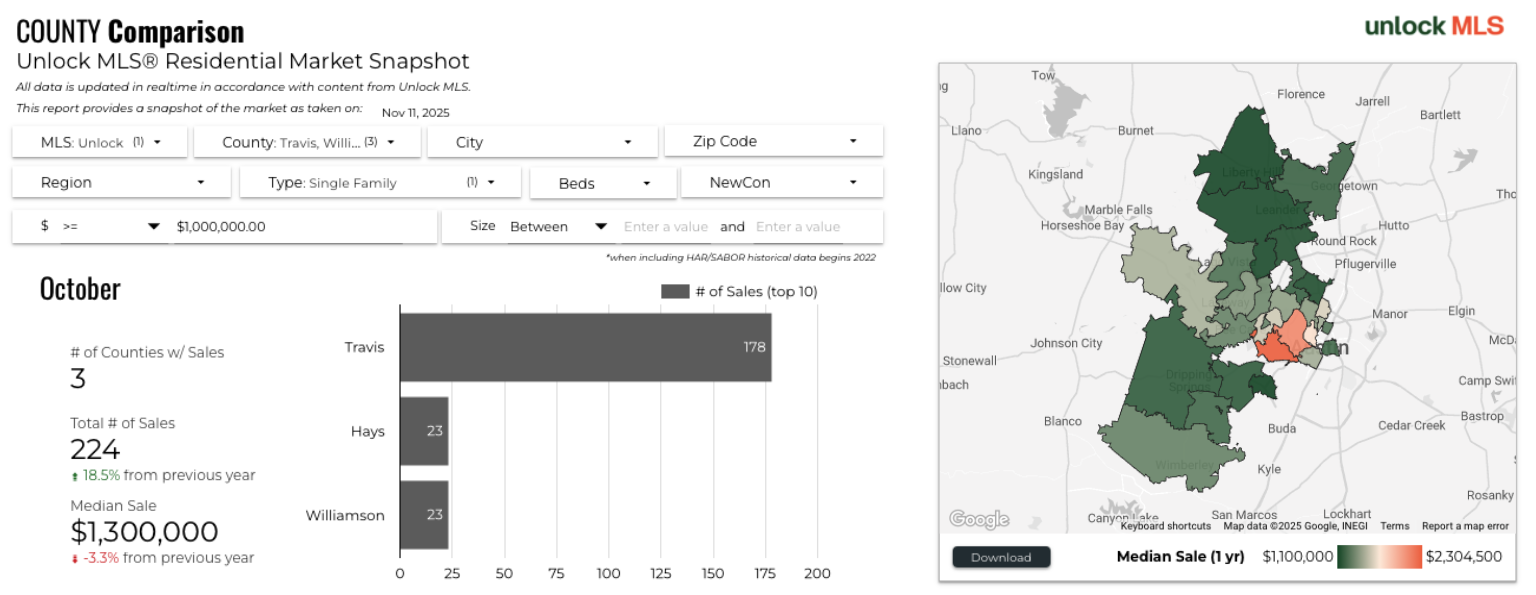
October 2025 Austin Luxury Market County Comparison
In October 2025, there were 178 homes in Travis County that sold, 23 in Williamson County and 23 in Hays County. The map to the right shows the head map of median sold prices. The darker the color the closer to $1MM the median sold price and the lighter tree is closer to $2MM. The orange is circling around $2.2MM-$2.3MM.
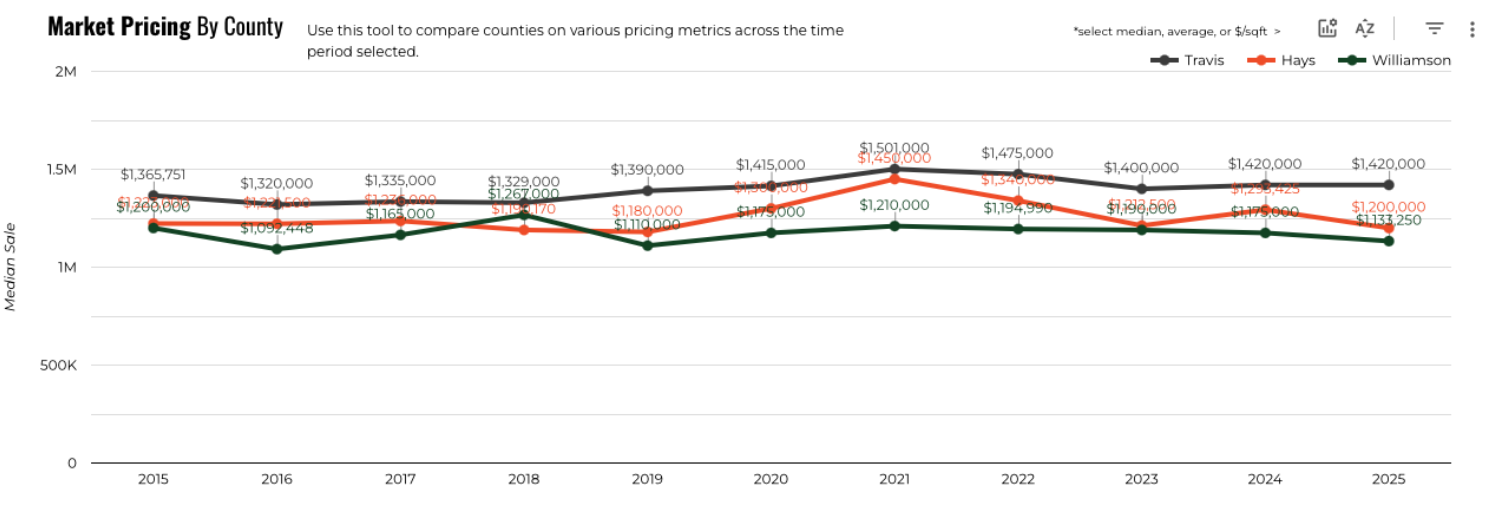
Median Pricing by County
Here is a 10 year history of the median price of luxury homes separated by County. Travis County is the dark grey line, which is on top. Hays is the orange line and Williamson County is the dark green line (bottom of the chart).
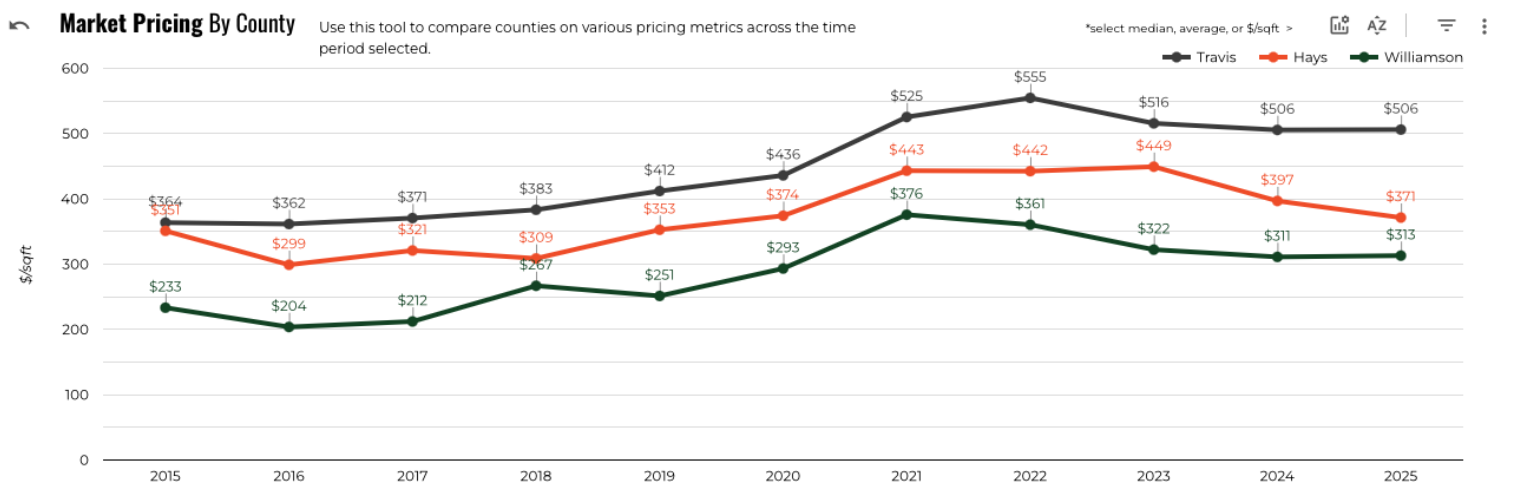
Luxury Average Price Per Square Foot
This chart compared the average price per square foot of a luxury home separated by county from 2015 to 2025.
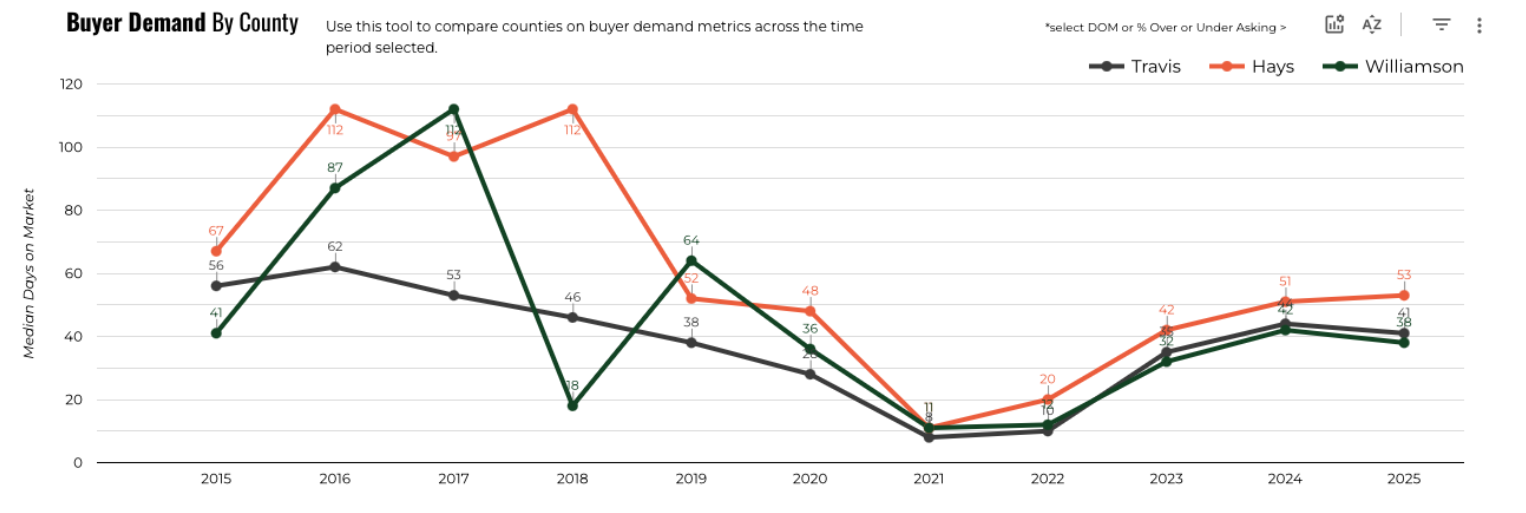
Austin Luxury Median Days on Market by County
Here is a chart of the median days on market by county from 2015 to 2025. We are seeing median days on market come down a bit from the increase in 2023 and 2024. 2021 and 2022 were considered the peak of the Austin market, which coincides with the lowest median time to sell we’ve seen.
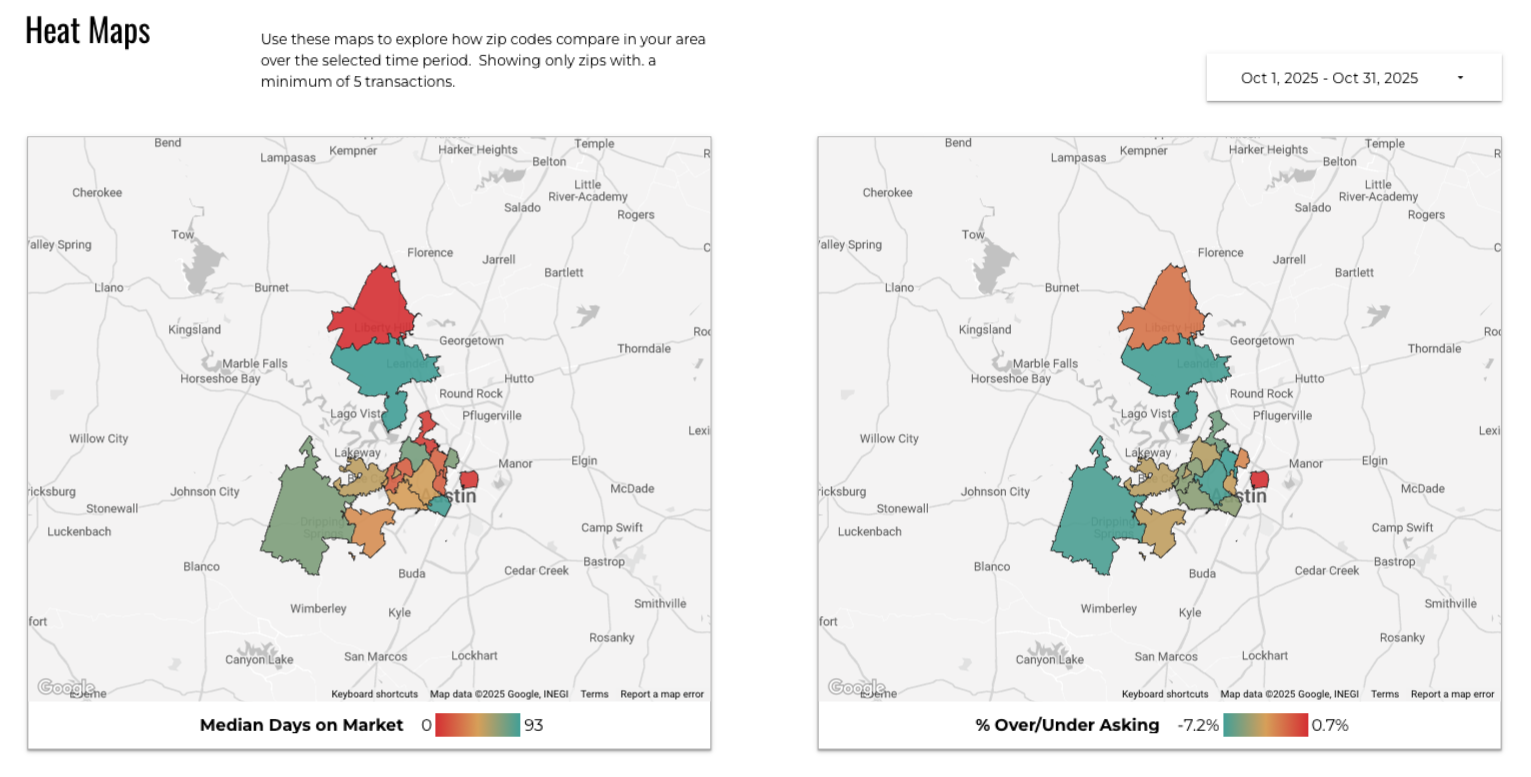
Heat Maps – Luxury Median Days on Market and $Over/Under Asking
This first set of maps shows the median days on market by area. The blue is the longest days on market and the red is the shortest median days on market. The chart to the right shows the % under asking (nothing sold over asking). The blue shows a higher discount negotiated by buyers and red shows the least discount negotiated by buyers.
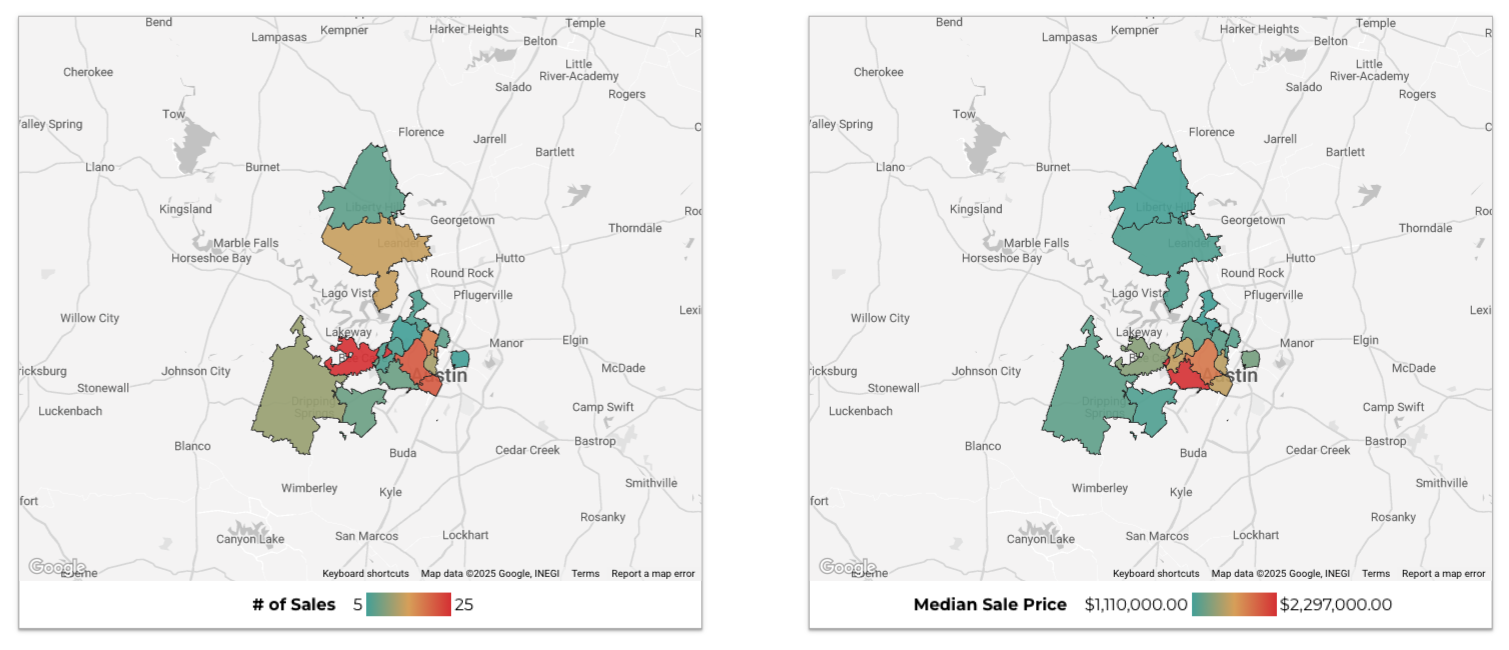
Number of Sales and Median Sale Price
These charts show the concentration of luxury home sales (the greatest number of luxury sales is located in Central and West Austin) and the median sales price. The highest median sales prices for luxury homes are again found in Central and West Austin.
Austin Luxury Home Sales October 2025
Here is some additional data on the 217 luxury homes that sold in Travis, Williamson and Hays Counties in October 2025. These 217 homes sold for $1 million or more.
- 1 luxury home that sold was a Foreclosure (Bank Owned)
- 6 luxury homes were Waterfront
- 93 luxury homes were in the Austin ISD
- 19 luxury homes were in the Dripping Springs ISD
- 26 luxury homes were in the Eanes ISD
- 4 luxury homes were in the Georgetown ISD
- 0 luxury homes were in the Hays ISD
- 30 luxury homes were in the Lake Travis ISD
- 24 luxury homes were in the Leander ISD
- 7 luxury homes were in the Round Rock ISD
- 0 luxury homes were in the San Marcos ISD
- 3 luxury home was in the Wimberley ISD
- 28 luxury homes were in Gated Communities
- 108 luxury homes were in HOA’s
- 108 luxury homes had Pools
- 70 luxury homes were on Septic Systems
- 174 luxury homes that sold were located in Travis County
- 21 luxury homes that sold were located in Williamson County
- 22 luxury home that sold were located in Hays County
Source: ACTRIS, Home Sales in Travis, Williamson and Hays County Over $1 Million in October 2025
October 2025 Austin Luxury Home Sales Map
All of the Austin luxury single family homes that sold in October 2025 were west of 130 (with the exception of 3), south of 138 and north of 150 (with the exception of 3). Here is a map of the 217 luxury homes that sold in Austin in October 2025.
October 2025 Luxury Real Estate Price Report – Strictly Numbers
For those of you who prefer to see the actual numbers, we’ve listed the figures for October 2025 Austin area luxury home sales below. The most expensive luxury home that sold in October 2025 sold for $7,000,000 and the least expensive luxury home sold for $1,000,000. Austin luxury homes ranged in size from 1,287 sqft – 8,790 sqft with an average size of 3,592 sqft. The average price per square foot for a luxury home that sold in Austin in October 2025 was $493.73 with the lowest being $156.64/sqft and the highest being $2,077.15/sqft. It took, on average, 70 days to sell a luxury home in Austin and sellers received, on average, 91.24% of their original list prices.
| | Beds | Baths | SqFt | List Price | LP/SqFt | Sold Price | SP/SqFt | SP/LP | SP/OLP | ADOM |
|---|---|---|---|---|---|---|---|---|---|---|
| Min | 2 | 2 | 1,287 | $900,000 | $188.53 | $1,000,000 | $156.64 | 70% | 59% | 0 |
| Max | 15 | 13 | 8,790 | $7,950,000 | $2,967.36 | $7,000,000 | $2,077.15 | 116% | 111% | 412 |
| Avg | 4 | 4 | 3,592 | $1,817,402 | $521.15 | $1,721,816 | $493.73 | 95.49% | 91.24% | 70 |
| Med | 4 | 4 | 3,432 | $1,389,950 | $476.08 | $1,312,500 | $453.44 | 96% | 93% | 49 |
| Search Criteria | |||
|---|---|---|---|
| Status | Sold | Sold Date | October 2025 |
| Property Type | Single Family Homes $1MM+ | Number Sold | 217 |
| Source: | ABoR Sales Data | Area | Travis, Hays, Williamson Counties |
Tips for Buyers
- Target the $1.4M+ tier for best negotiation. Inventory is high, and sellers are more flexible.
- Leverage data in offers. With average sales 5% below list, structure offers confidently with market-backed logic.
- Act fast in the $1M–$1.3M band. Well-priced listings move quickly—expect multiple interested parties.
- Compare across counties. Williamson and Hays often offer more square footage or land for the same price as central Travis.
- Monitor fresh price reductions. These listings often indicate motivated sellers open to negotiation.
Tips for Sellers
- Price for today’s market. Start within 1–2% of true market value to capture attention early.
- Know your competition. $1.4M+ listings face 8+ months of supply—be prepared to stand out on either price or presentation.
- Optimize the first 30 days. The best exposure window is early—use professional photography, staging, and strategic pricing.
- Adjust decisively. If no traction in 2–3 weeks, make a meaningful price correction rather than small reductions.
- Market hyper-locally. Emphasize neighborhood-specific amenities, schools, and commute advantages.
The Bottom Line
Austin’s luxury market remains healthy but data-driven. Buyers are active and willing to pay for quality and location, but they expect realism on pricing. For sellers, presentation and precision pricing are key to capitalizing on motivated high-end demand. For buyers, the opportunity lies in the upper price brackets and in neighborhoods where supply exceeds seasonal demand.
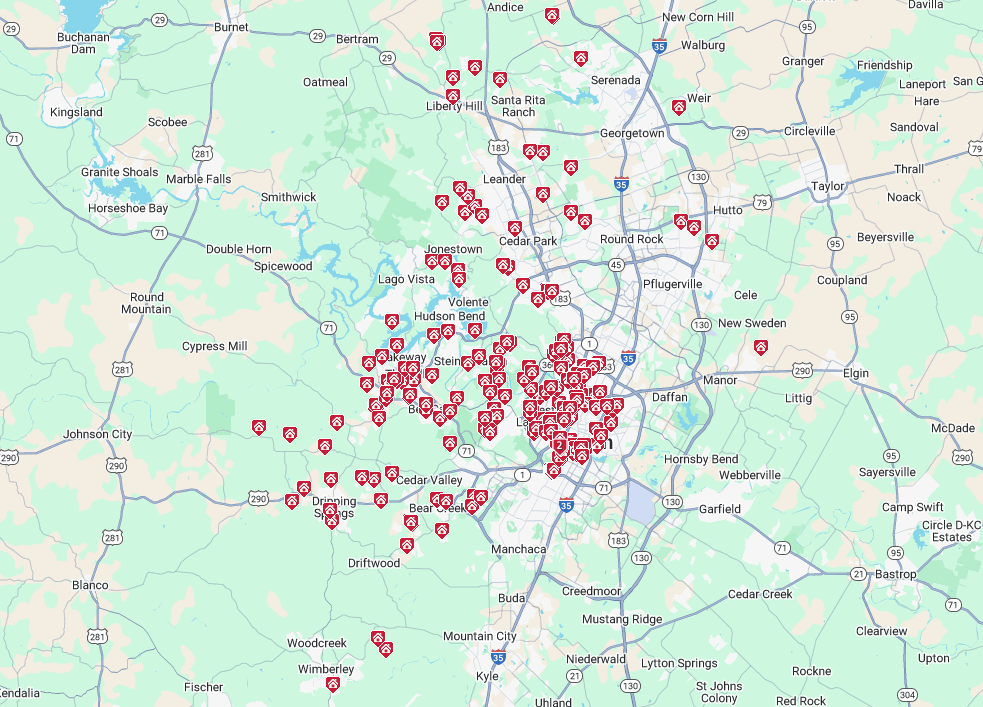
Luxury Homes for Sale Around Austin
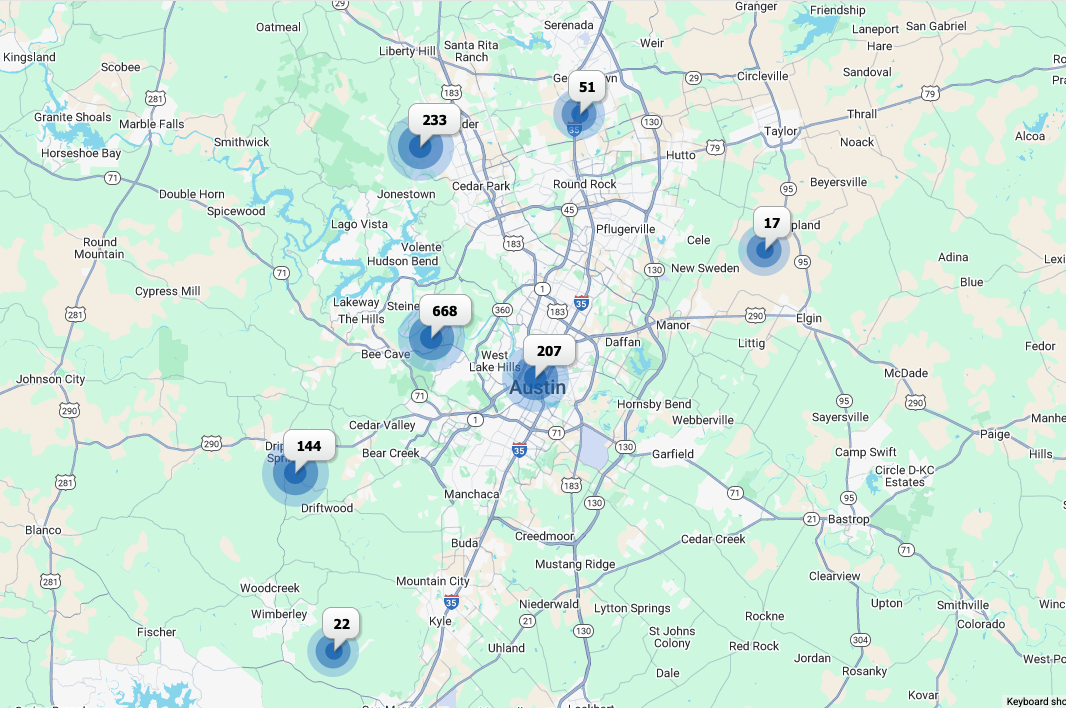
Here is a map of the 1,374 luxury homes for sale in the Austin area as of November 11, 2025. 1,038 are located in Travis County, 192 in Williamson County and 144 in Hays County. Here is a map.
Considering Buying or Selling a Luxury Home in Austin?
Our team of Austin luxury real estate market specialists know the market well and can help you get the best deal possible. For more info about our team and how we work, check out our Austin Home Buyers and our Austin Home Sellers sections. Then, call us at (512) 872-8323 or email us at info@11OaksRealty.com to schedule a consultation.
Questions About the October 2025 Austin Luxury Real Estate Price Report?
Do you have questions about the October 2025 Austin Luxury Real Estate Price Report? Call us at (512) 827-8323 or email us at info@11OaksRealty.com and we’ll help you in any way we can.




Leave a Reply