
Eleven Oaks Realty is proud to present their May 2026 Austin Luxury Real Estate Price Report measuring activity in the luxury home market across Travis, Williamson, and Hays Counties. For this report, luxury is defined as any home that sold for $1,000,000 or more.
May 2026 was a strong month for Austin luxury real estate across the board. The median sold price rose to $1,420,125, up 7.2% from May 2025 and up 6.0% from April 2026. Sales volume surged as well, with 312 luxury homes closing during the month, a 10.2% increase year over year and a 15.1% jump from the prior month. The one area that moved in the other direction was time on market: the median days to sell climbed to 25 days, up from 20 days in May 2025. This report covers pricing, sales activity, inventory, buyer demand, and negotiation trends across the Austin luxury market for May 2026.
May 2026 Austin Luxury Real Estate Market Highlights
- The median sold price for Austin luxury homes in May 2026 was $1,420,125, up 7.2% from May 2025 and the highest monthly median recorded in the past three years.
- 312 luxury homes closed in May 2026, up 10.2% year over year and up 15.1% from April 2026, reflecting a meaningful pickup in buyer activity heading into summer.
- The median days on market was 25 in May 2026, up from 20 days in May 2025, indicating that while demand is rising, buyers are still taking more time to make decisions than they did a year ago.
- Sellers received an average of 93.4% of their original list price in May, meaning the typical luxury home sold with a gap of about 6.6% from its initial asking price.
- Travis County continued to dominate, accounting for 249 of the 312 closings, or about 79.8% of all luxury sales in the tri-county area.
May 2026 Austin Luxury Real Estate Market Overview
May 2026 told a story of rising prices, rising sales, and slightly rising time on market. All three movements together point to a market that is gaining momentum on the demand side while still giving buyers more time and room to negotiate than they had at the peak of the seller's market in 2021 and 2022. The combination of a 7.2% year-over-year price gain and a 10.2% gain in the number of closings signals genuine buyer interest at the high end of the Austin market, not just a statistical blip.
The fact that median days on market ticked up 25% year over year, even as sales and prices climbed, reflects the elevated inventory levels still present in the Austin luxury market. With 5.2 months of supply as of June 2026, buyers have meaningful choices, and sellers who price aggressively from the start tend to perform better than those who test the market and reduce later. The average seller who started at a high price ultimately received just 93.4% of their original list price, compared to 96.3% for those pricing closer to current market value from the start.
A note on data sources: this report draws from two sources, Rebecca's direct Unlock MLS pull and the CentralTX aggregated platform, which may show slightly different transaction counts due to timing and methodology. Body text and narratives in this report reflect 312 sales from the direct MLS pull; chart images may reflect 303 sales from the aggregated platform. Both sources confirm the same overall market direction: prices up, sales up, and homes taking a little longer to sell than a year ago.
May 2026 Austin Luxury Real Estate Price and Negotiation Trends
Luxury buyers in May 2026 were negotiating, but not by a wide margin. The median luxury home sold for 97% of its final list price and 95% of its original list price. On average, homes sold for 96.3% of their final list price and 93.4% of their original asking price. The gap between original list price and close price, about 6.6 percentage points on average, reflects the reality that a meaningful portion of sellers started too high and had to reduce before going under contract.
Of the 303 luxury homes tracked by the CentralTX platform, 108, or about 13%, had a price reduction before closing. Those that did reduce sold at a median of 14 days after dropping their price, which is a relatively short turnaround and suggests that correctly priced reductions attract buyers quickly. The 49% of currently active listings that carry a price reduction as of June 12 are a clear signal that overpricing remains a challenge in the luxury segment, even as overall prices trend upward.
For buyers, this environment offers real negotiating leverage, especially in the $1.4 million-plus price range, where inventory is deepest at 5.9 months of supply. Sellers in the entry-level luxury tier, homes priced between $1 million and $1.19 million, are seeing tighter conditions with just 4.4 months of supply and a median of 25 days on market before going under contract. Knowing where your target price range sits on the supply spectrum can meaningfully shape your offer strategy.
Median Sold Price Up 7.2% Year Over Year
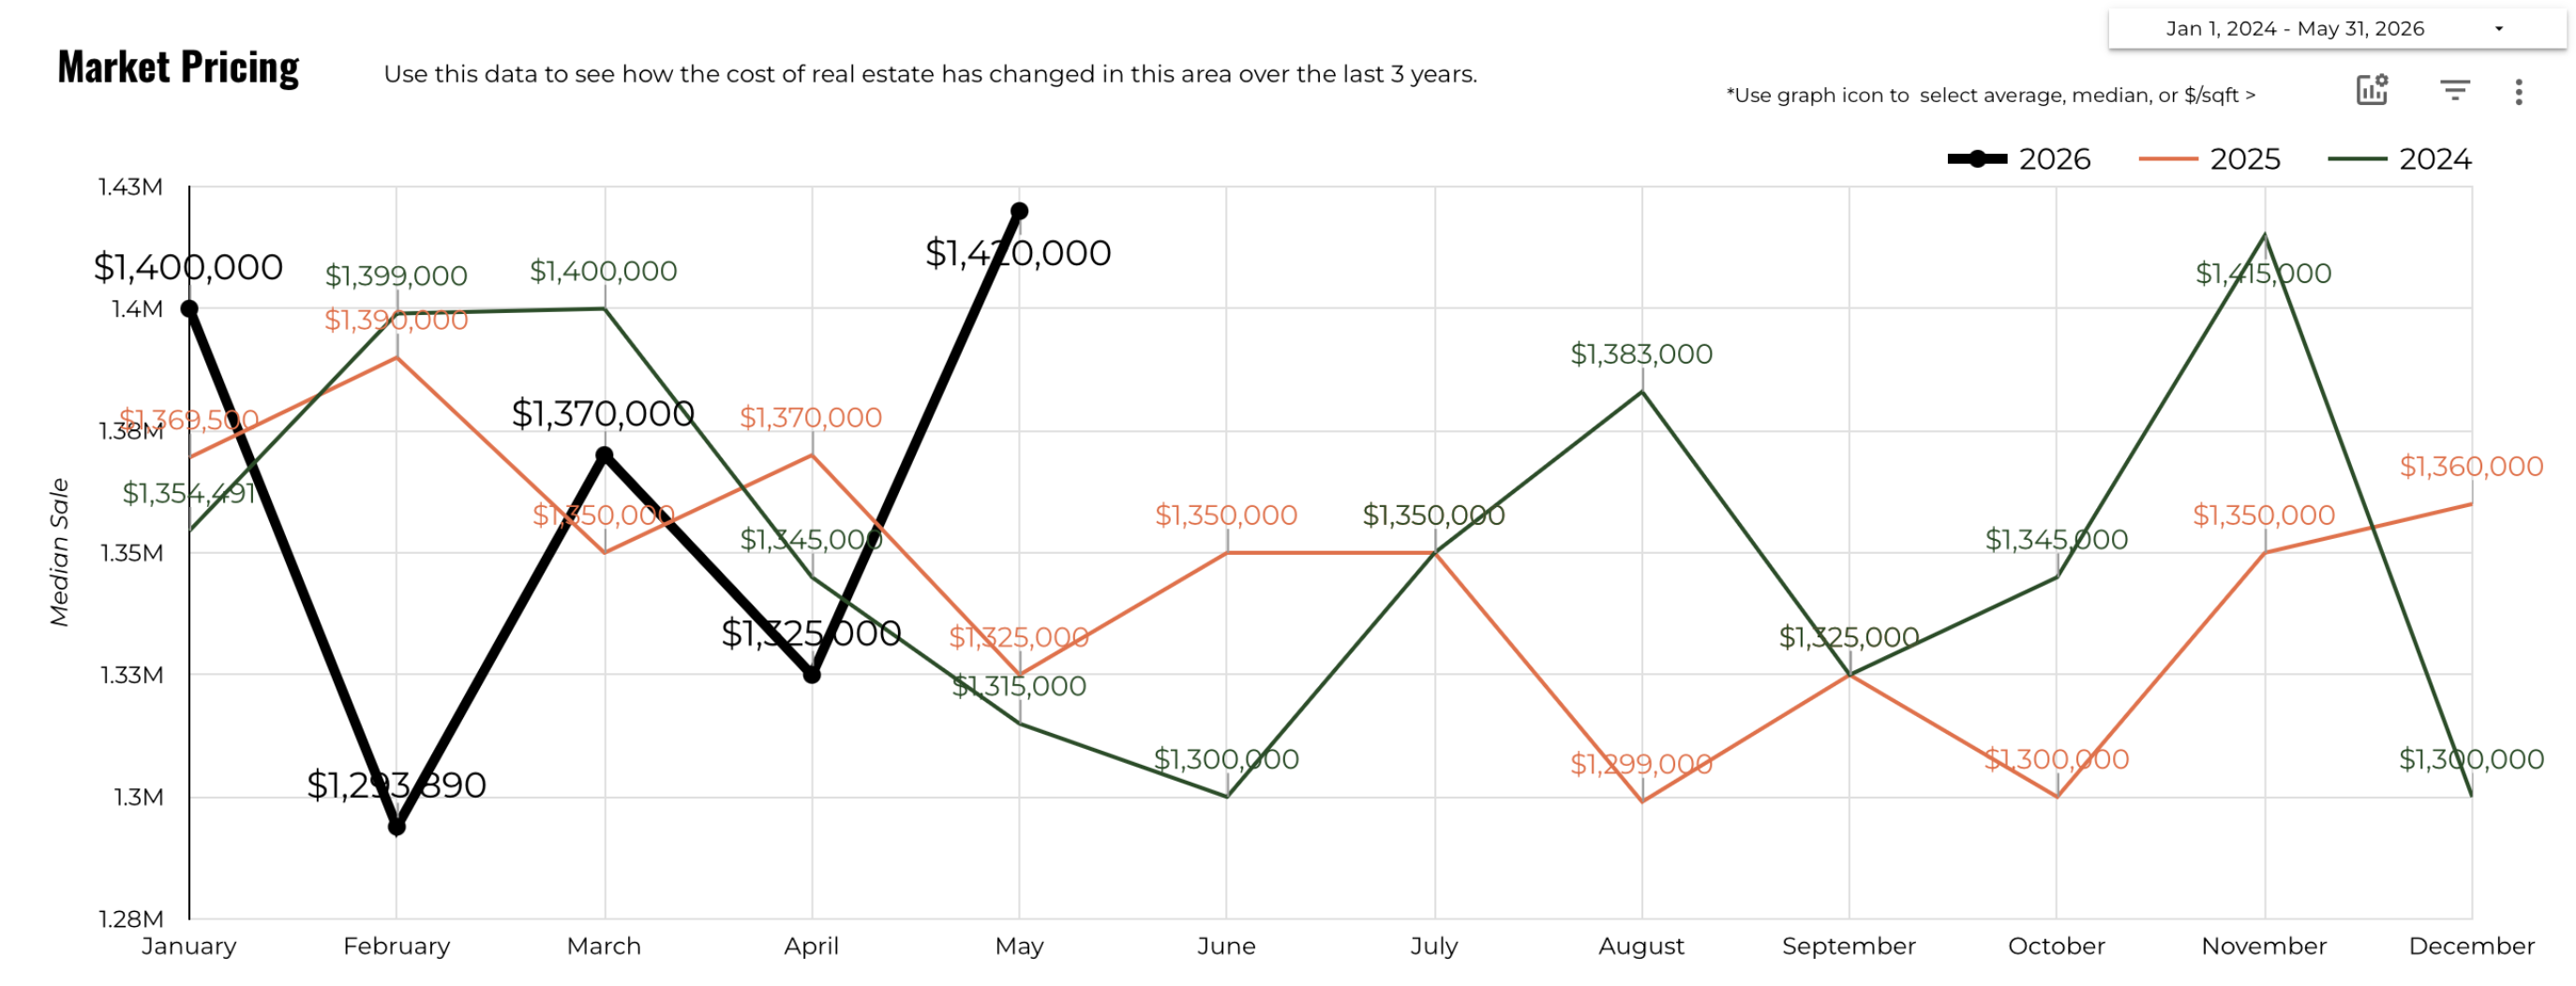
The median sold price for Austin luxury homes in May 2026 was $1,420,125, up 7.2% from $1,325,000 in May 2025 and up 6.0% from $1,340,000 in April 2026. This is the highest monthly median recorded in the past three years of data and represents a meaningful acceleration from where the market started 2026.
The three-year price history chart shows that May has historically been a strong month for Austin luxury pricing, and 2026 is following that seasonal pattern in a pronounced way. Where the 2025 line shows May at roughly $1,325,000, the 2026 line jumps clearly above it, a sign that the demand driving this spring season is stronger than what the market saw in 2025. The 2024 data shows a similar seasonal uptick, though it peaked lower than where 2026 is currently sitting.
For buyers, the price trend is worth watching closely. If May continues to set the tone for summer, prices in the $1.4 million to $1.5 million range may face additional upward pressure. For sellers with well-positioned homes, May 2026 results suggest that the market will support strong pricing as long as the property is priced accurately relative to recent comparable sales.
Number of Luxury Home Sales Up 10.2% Year Over Year
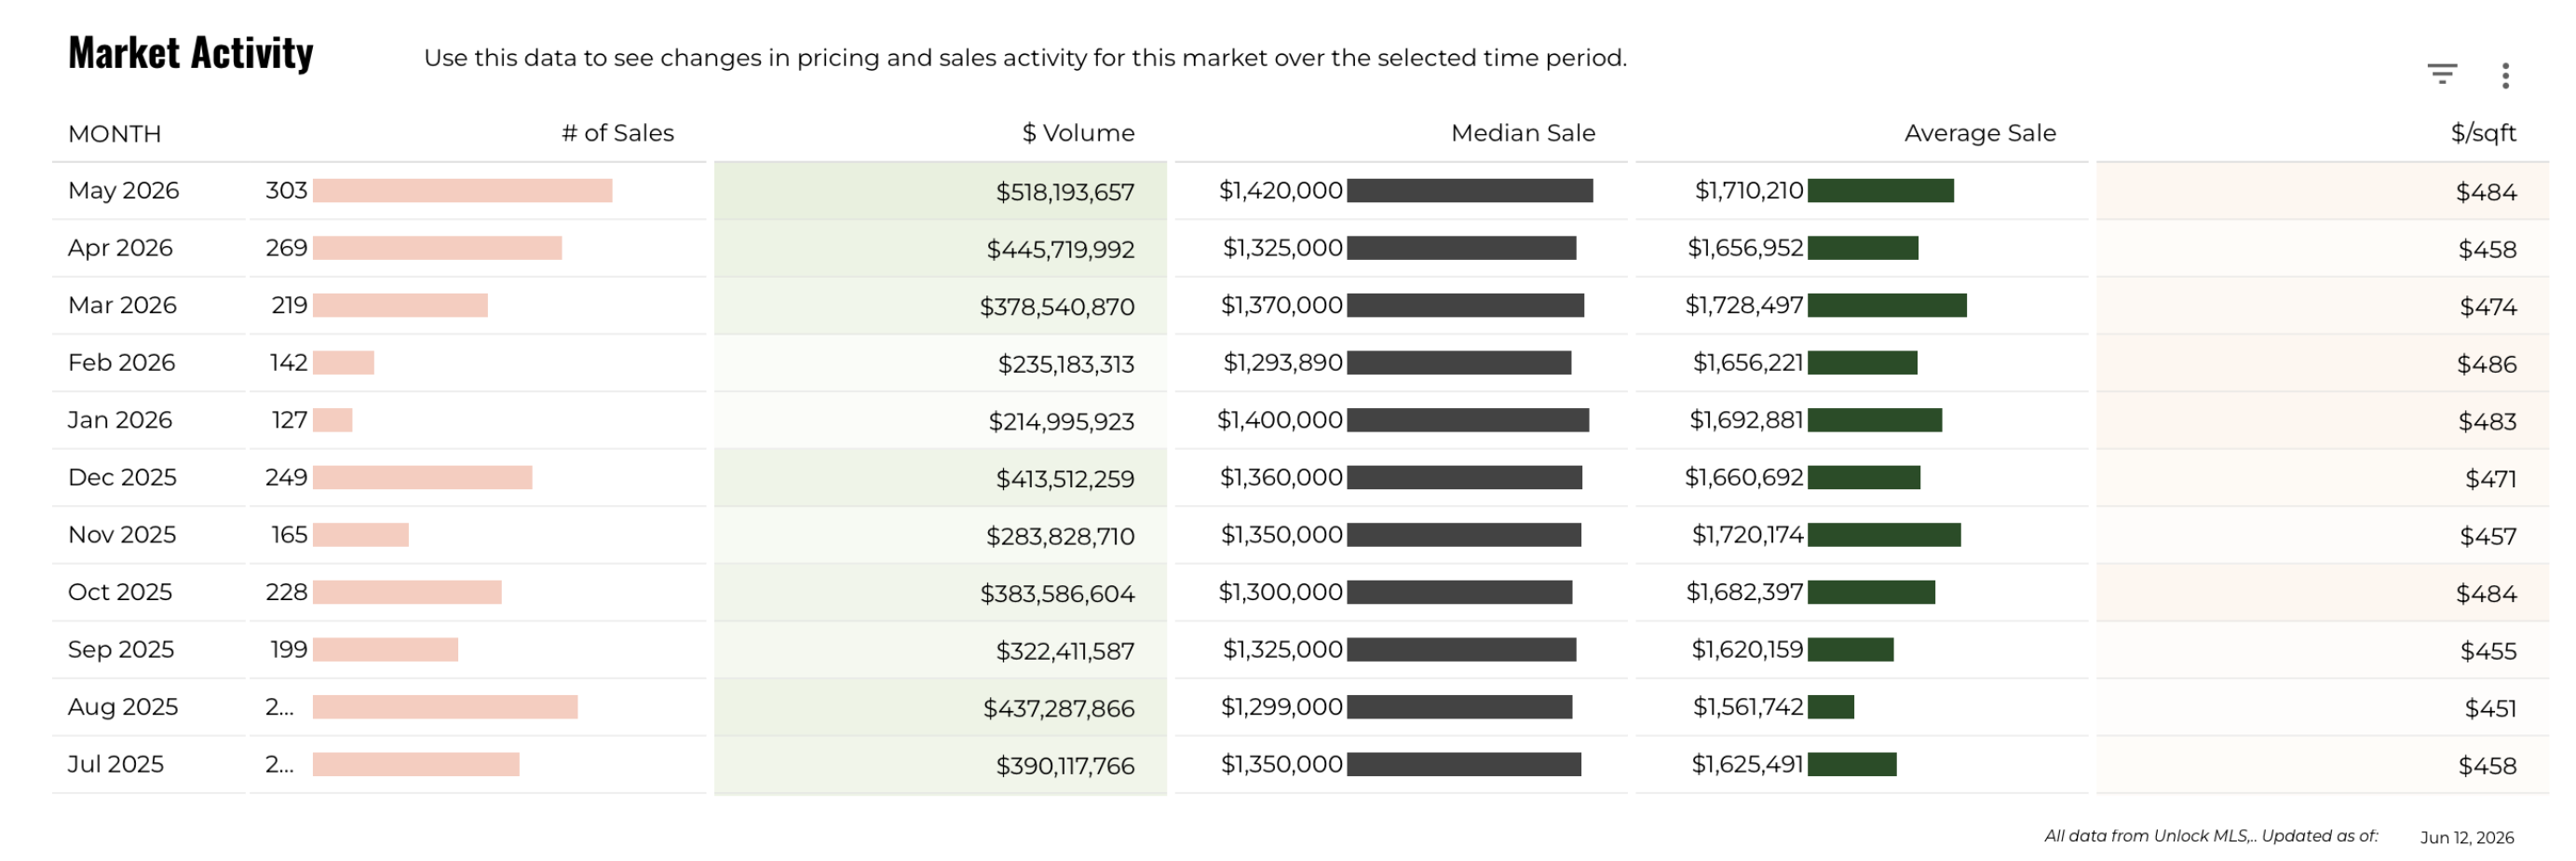
312 luxury homes closed in May 2026, up 10.2% from 283 closings in May 2025 and up 15.1% from 271 closings in April 2026. Total sales volume reached approximately $518 million for the month, reflecting both the higher number of transactions and the higher price points driving each one.
The month-over-month jump of 15.1% is particularly notable. April and March of 2026 showed softer volumes relative to 2025 comparisons, making the May rebound a meaningful turning point. This acceleration is consistent with the seasonal patterns visible in the market activity chart, which shows that the Austin luxury market typically builds steam in late spring. What makes May 2026 different from prior years is the combination of volume AND price growth happening simultaneously.
The average sale price for a luxury home in May 2026 was $1,710,210, which is notably higher than the median of $1,420,125. That spread between average and median reflects the influence of higher-end transactions, including homes in the $3 million-plus range, pulling the average upward. For most buyers and sellers operating in the $1 million to $2 million range, the median is the more relevant benchmark.
Median Time to Sell Up 25.0% Year Over Year
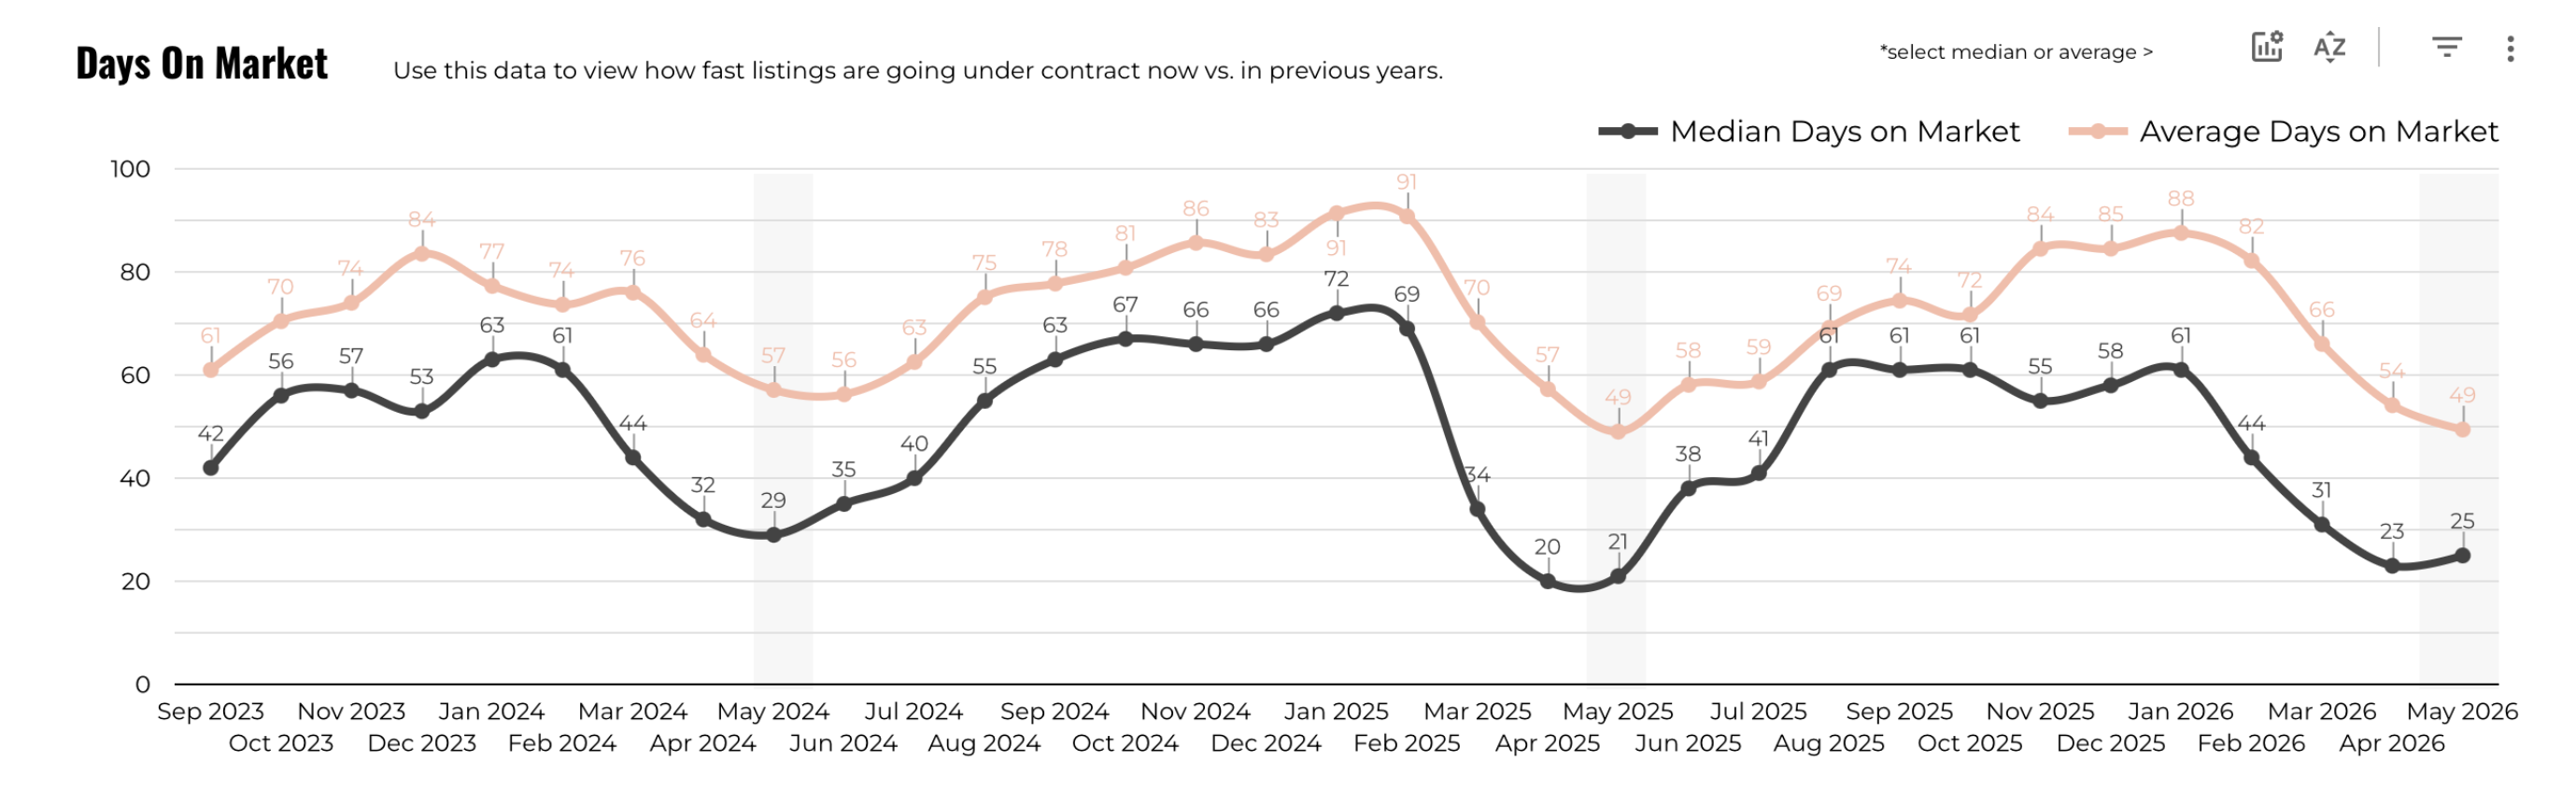
The median time to sell a luxury home in May 2026 was 25 days, up 25.0% from 20 days in May 2025 and up 38.9% from 18 days in April 2026. While a 25-day median is still relatively brisk by historical standards, the year-over-year increase reflects the modestly elevated inventory that has been a feature of the Austin luxury market throughout 2025 and into 2026.
The three-year days on market chart puts this in context. The 2021 and early 2022 period saw median DOM drop to historic lows, often under 15 days, before reversing sharply as inventory built and rates rose. The 2023 to 2024 period saw median DOM push well above 50 days in some months. The current reading of 25 days represents a significant improvement from that slower period, even if it is a step back from the very fast pace of early 2026.
For sellers, this number means your home should be priced to attract serious buyers within the first two to three weeks on market. Homes that sit beyond 30 to 45 days tend to face increased buyer skepticism and negotiating pressure. For buyers, a 25-day median means that well-priced homes are still moving with purpose, and waiting for a price drop on a desirable property is a risky strategy.
The $1.4 Million-Plus Segment Led May Luxury Sales with 151 Homes Closed
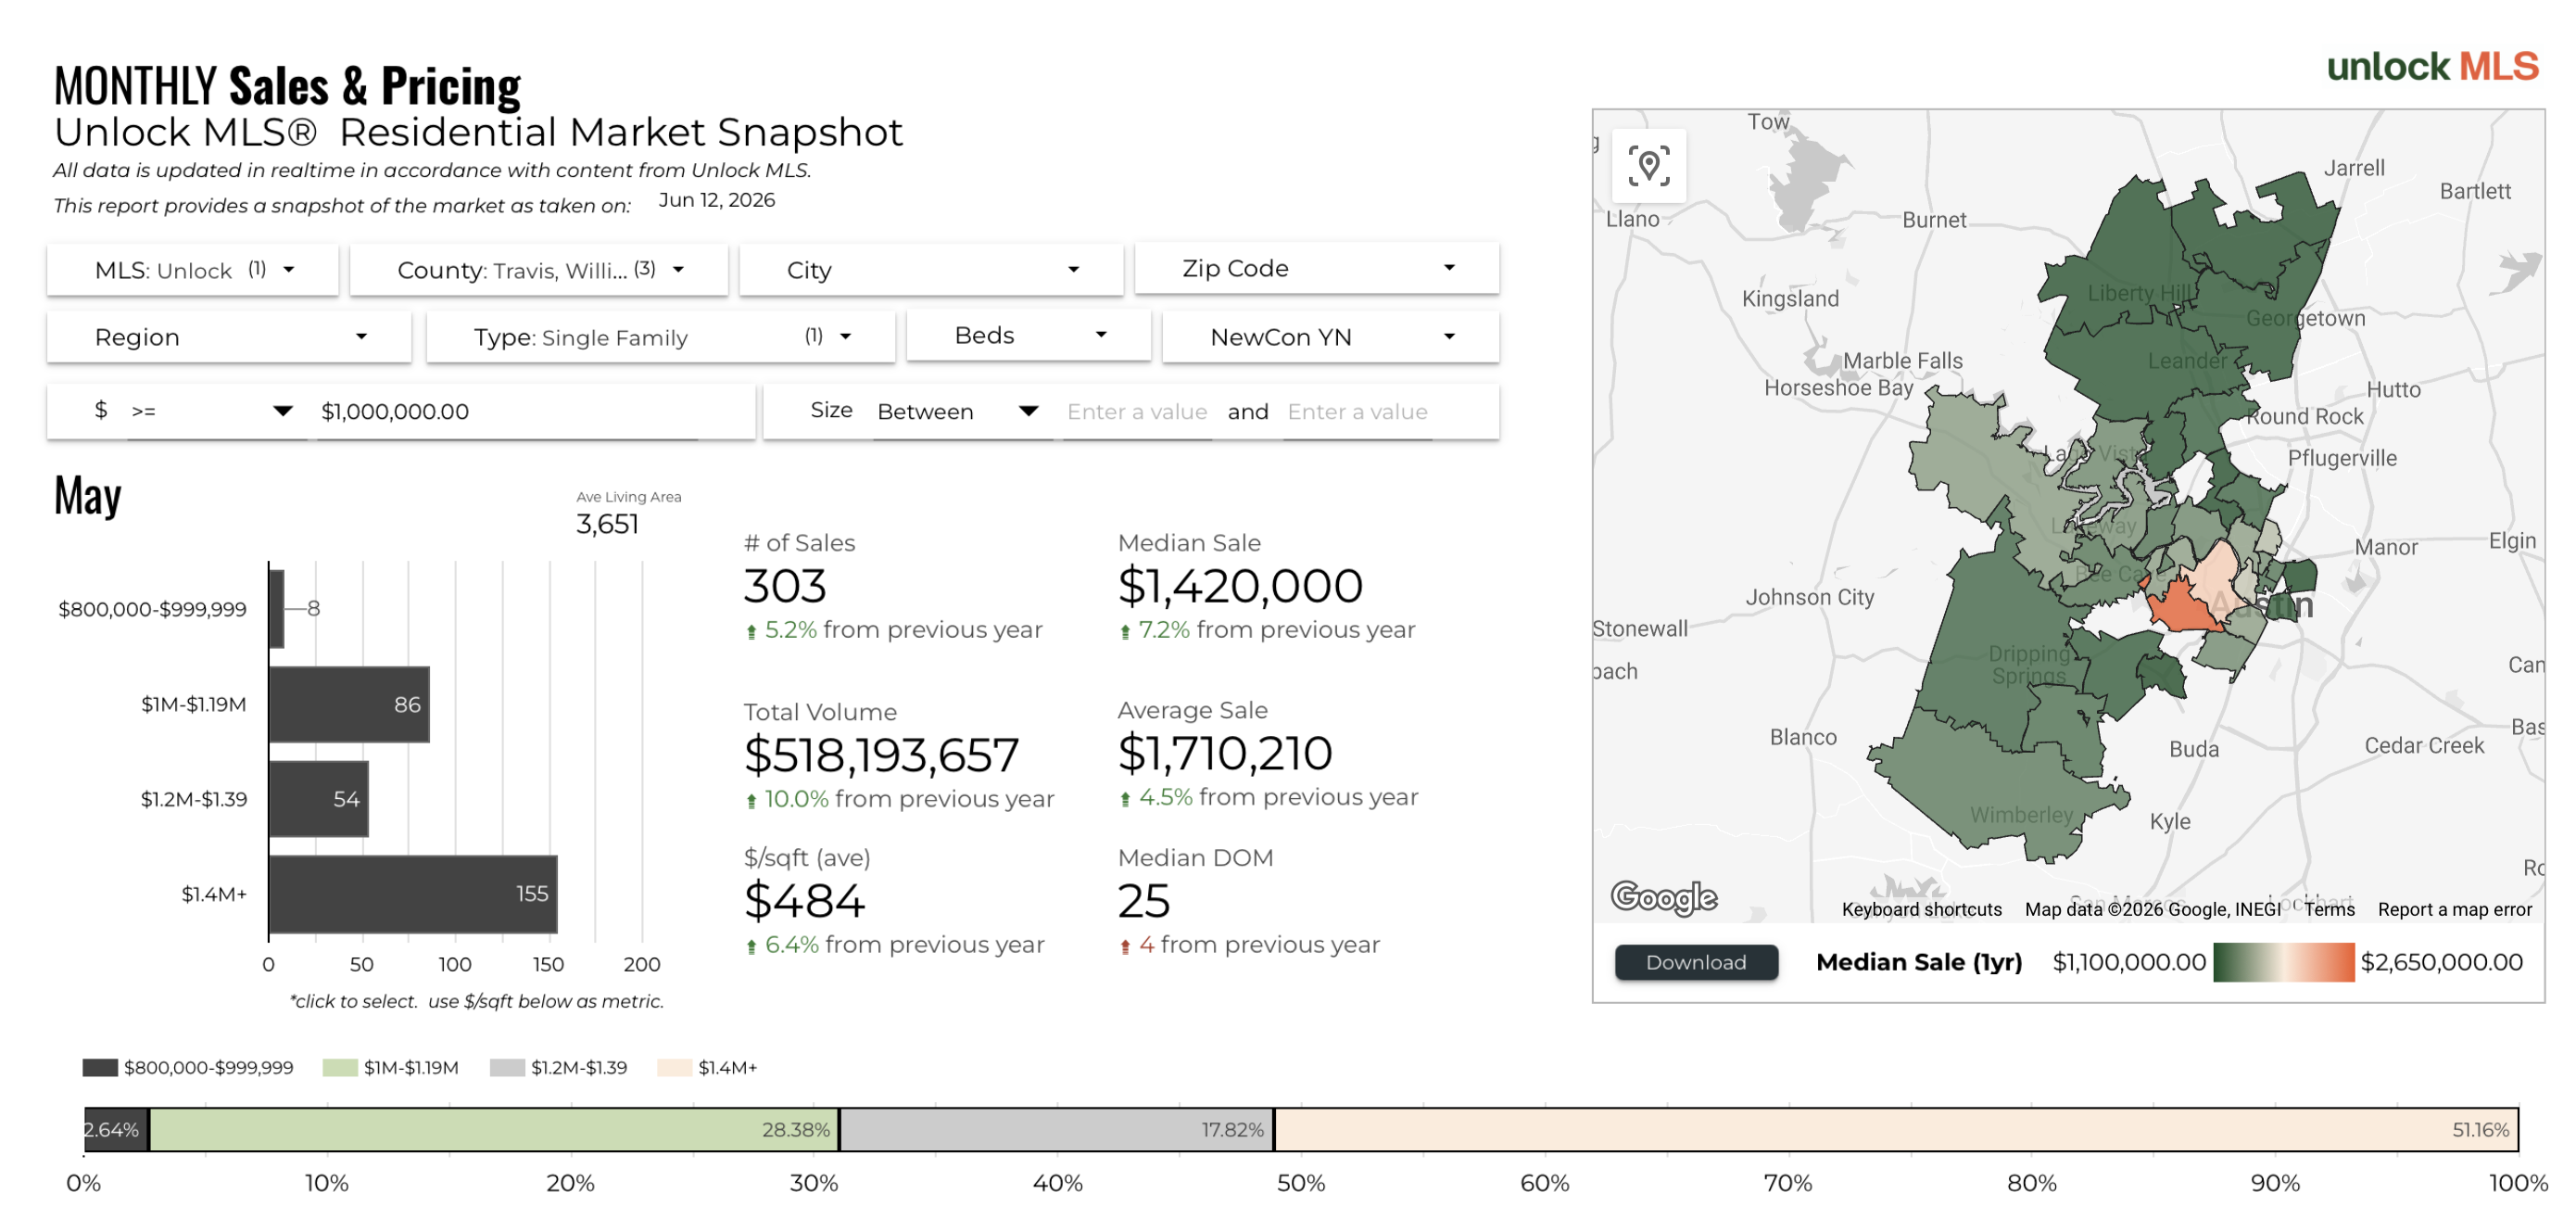
Breaking down May 2026 closings by price range, the $1.4 million-plus segment was the most active tier with 151 sales, up 26.9% year over year. The $1 million to $1.19 million segment came in second with 79 closings, up 6.8% from May 2025, while the $1.2 million to $1.39 million range saw 51 closings, down 28.2% year over year. The bifurcation between the entry-level luxury range and the top of the market is one of the more interesting storylines in the May data.
The sharp drop in the $1.2 million to $1.39 million range is a signal that sellers in that price tier should pay close attention to. Buyers who can afford $1.2 million may be stretching to the $1.4 million range, where inventory gives them more options, while buyers targeting the sub-$1.2 million entry luxury range are competing in a more constrained market. If you are selling in the $1.2 million to $1.39 million bracket, understanding the competitive dynamics of your specific price range is critical to setting the right strategy.
Travis County Captured 79.8% of All Austin Luxury Sales in May 2026
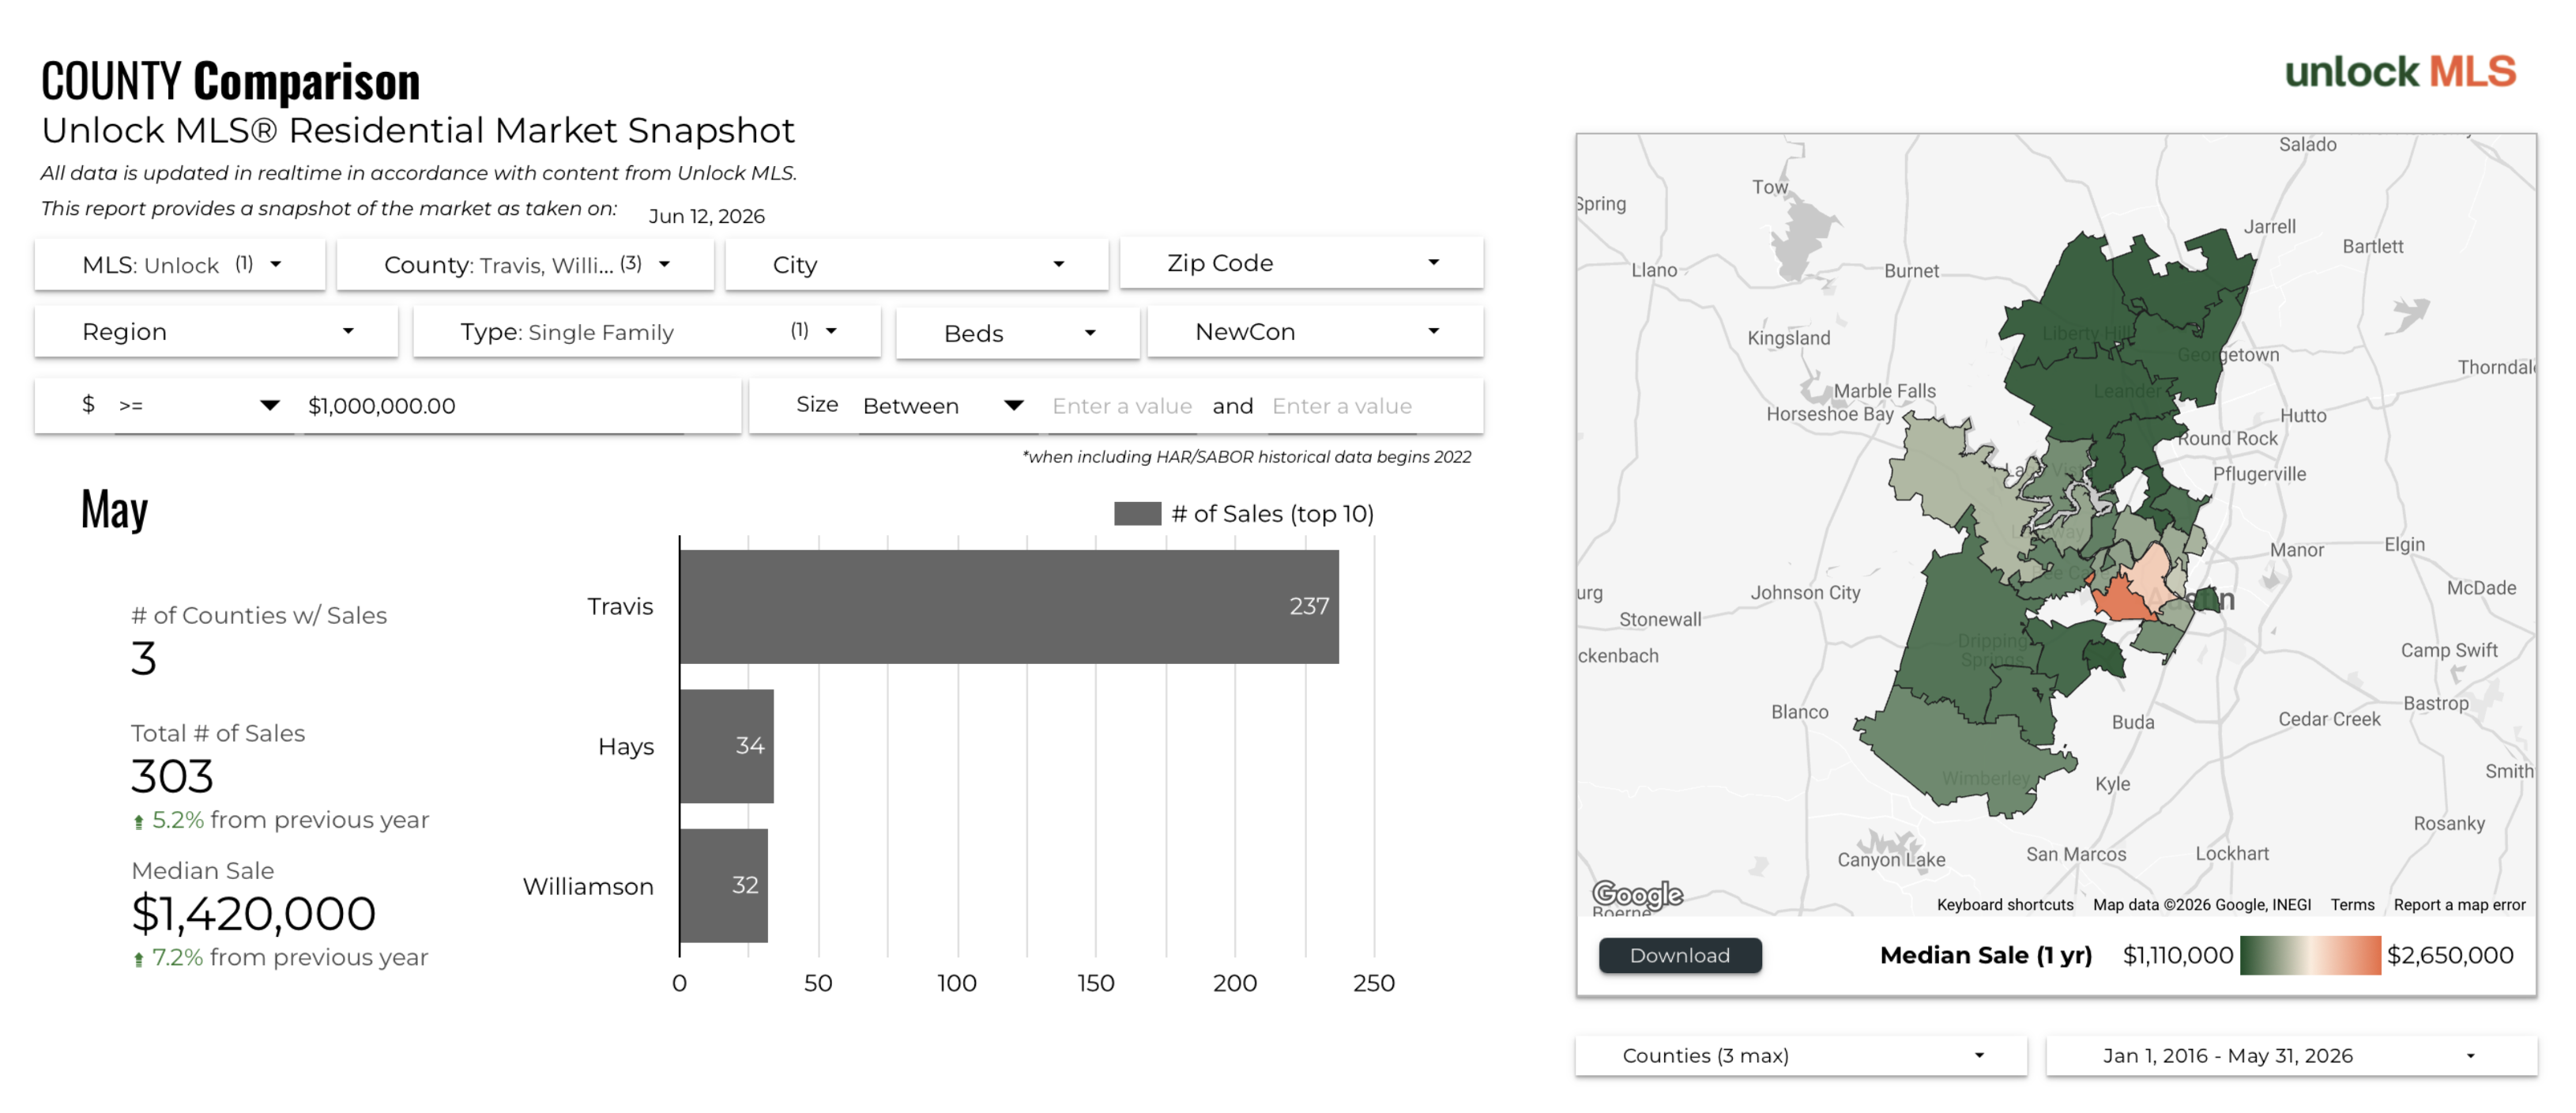
Travis County dominated May 2026 luxury closings with 249 sales, representing 79.8% of the tri-county total of 312. Hays County came in second with 32 closings, followed closely by Williamson County with 31. While Travis County's share is consistent with prior months, both Hays and Williamson continue to attract meaningful luxury activity, particularly at the lower end of the $1 million-plus threshold.
The county comparison also shows a median sale price of $1,420,000 for the tri-county area, though price levels vary considerably by county. Travis County commands the highest medians, driven by established luxury neighborhoods in West Austin, Westlake, and central Austin zip codes. Hays and Williamson County luxury homes typically sell at lower price points within the luxury threshold, which affects the overall county-level medians significantly.
Austin Luxury Median Sold Price at Three-Year High in May 2026
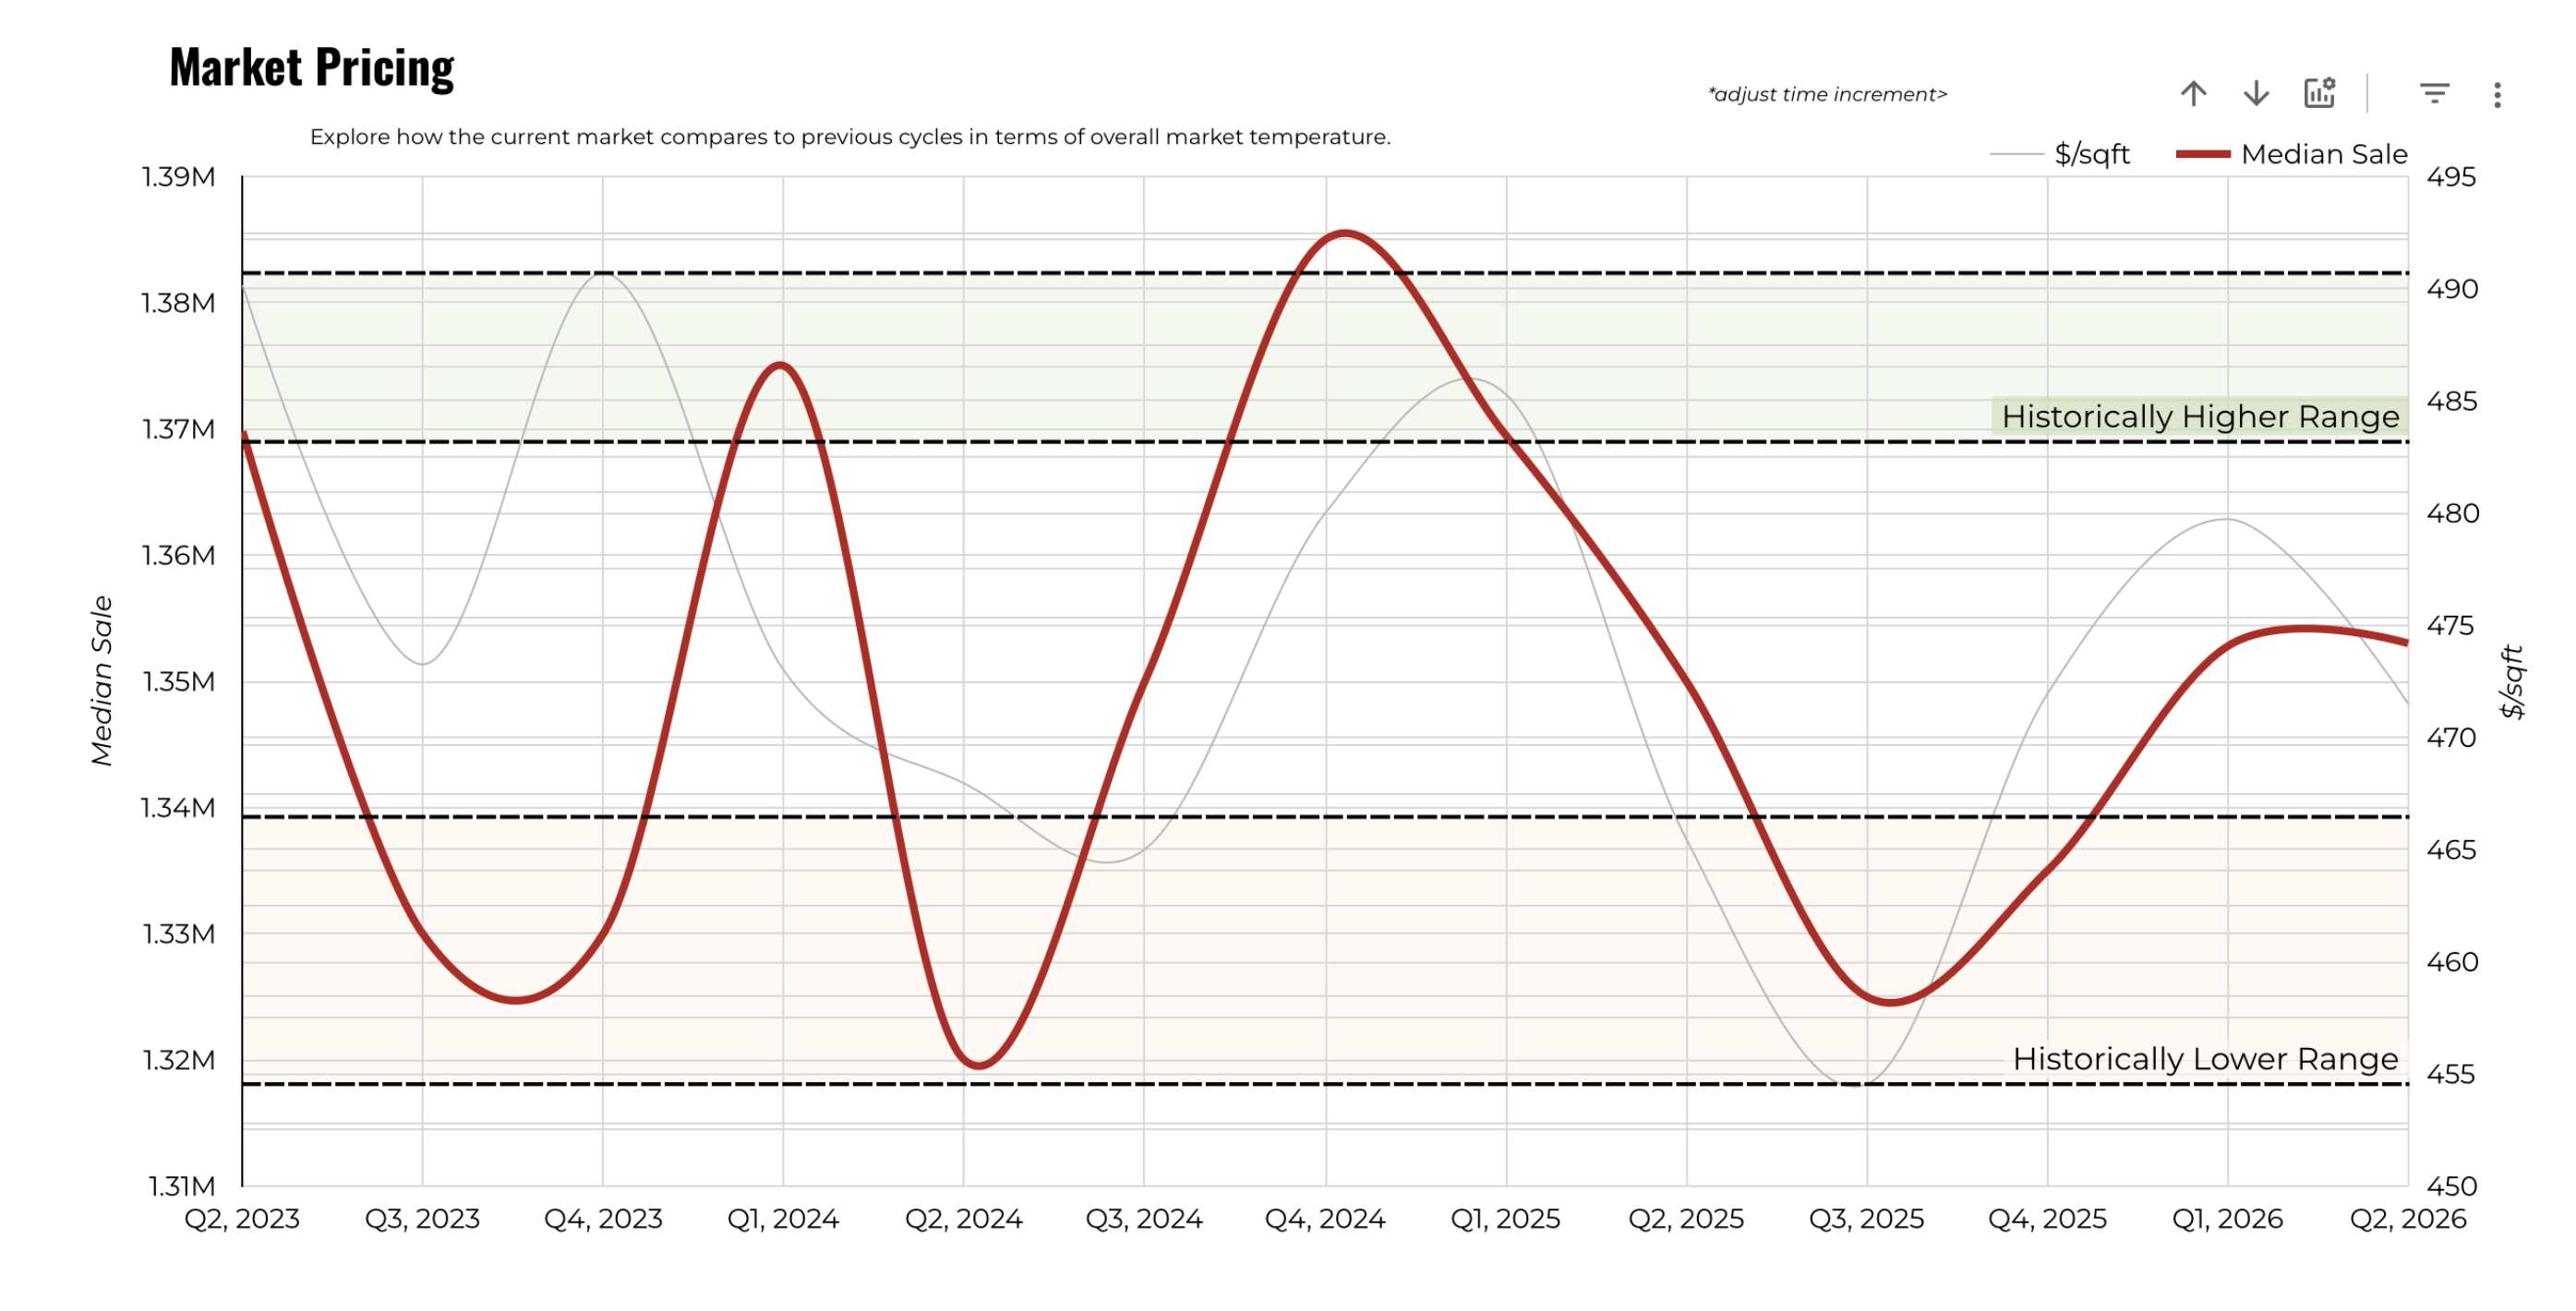
The market pricing cycle chart tracks how the current market compares to prior cycles in terms of the median sale price trend. As of May 2026, the 2026 line has moved into and above the historically higher range threshold, which represents the upper band of normal cyclical pricing going back several years. This is the first time in the current cycle that the median has pushed convincingly into that upper zone.
The chart shows that the 2024 and 2025 lines spent much of the year bouncing between the lower and mid ranges of the pricing cycle, reflecting the inventory and rate headwinds that defined those years. The 2026 trajectory, particularly the sharp May uptick, suggests the market has moved past the flat period and into a more clearly upward trend. Whether this holds through summer will depend on whether new listing supply outpaces the demand driving closings.
May Luxury Sales Volume Hits $518 Million, Up 15% Month Over Month
The market activity table for May 2026 shows 303 sales (per the CentralTX platform), a total volume of $518,193,657, a median sale of $1,420,000, and an average sale of $1,710,210 at $484 per square foot. Comparing May to April 2026, which showed 269 sales, $445 million in volume, and a $1,325,000 median, the month-over-month improvement across every metric is clear and consistent.
Looking further back in the activity table, May 2026 stands out as the strongest month in the trailing 12-month window both in total closings and in total sales volume. The previous peak over the past year was the October 2025 period, which showed 228 closings and $437 million in volume. May 2026 meaningfully exceeded that on both measures, which points to a genuine strengthening of buyer demand rather than a seasonal adjustment alone.
Austin Luxury Market Carries 5.2 Months of Supply as of June 2026
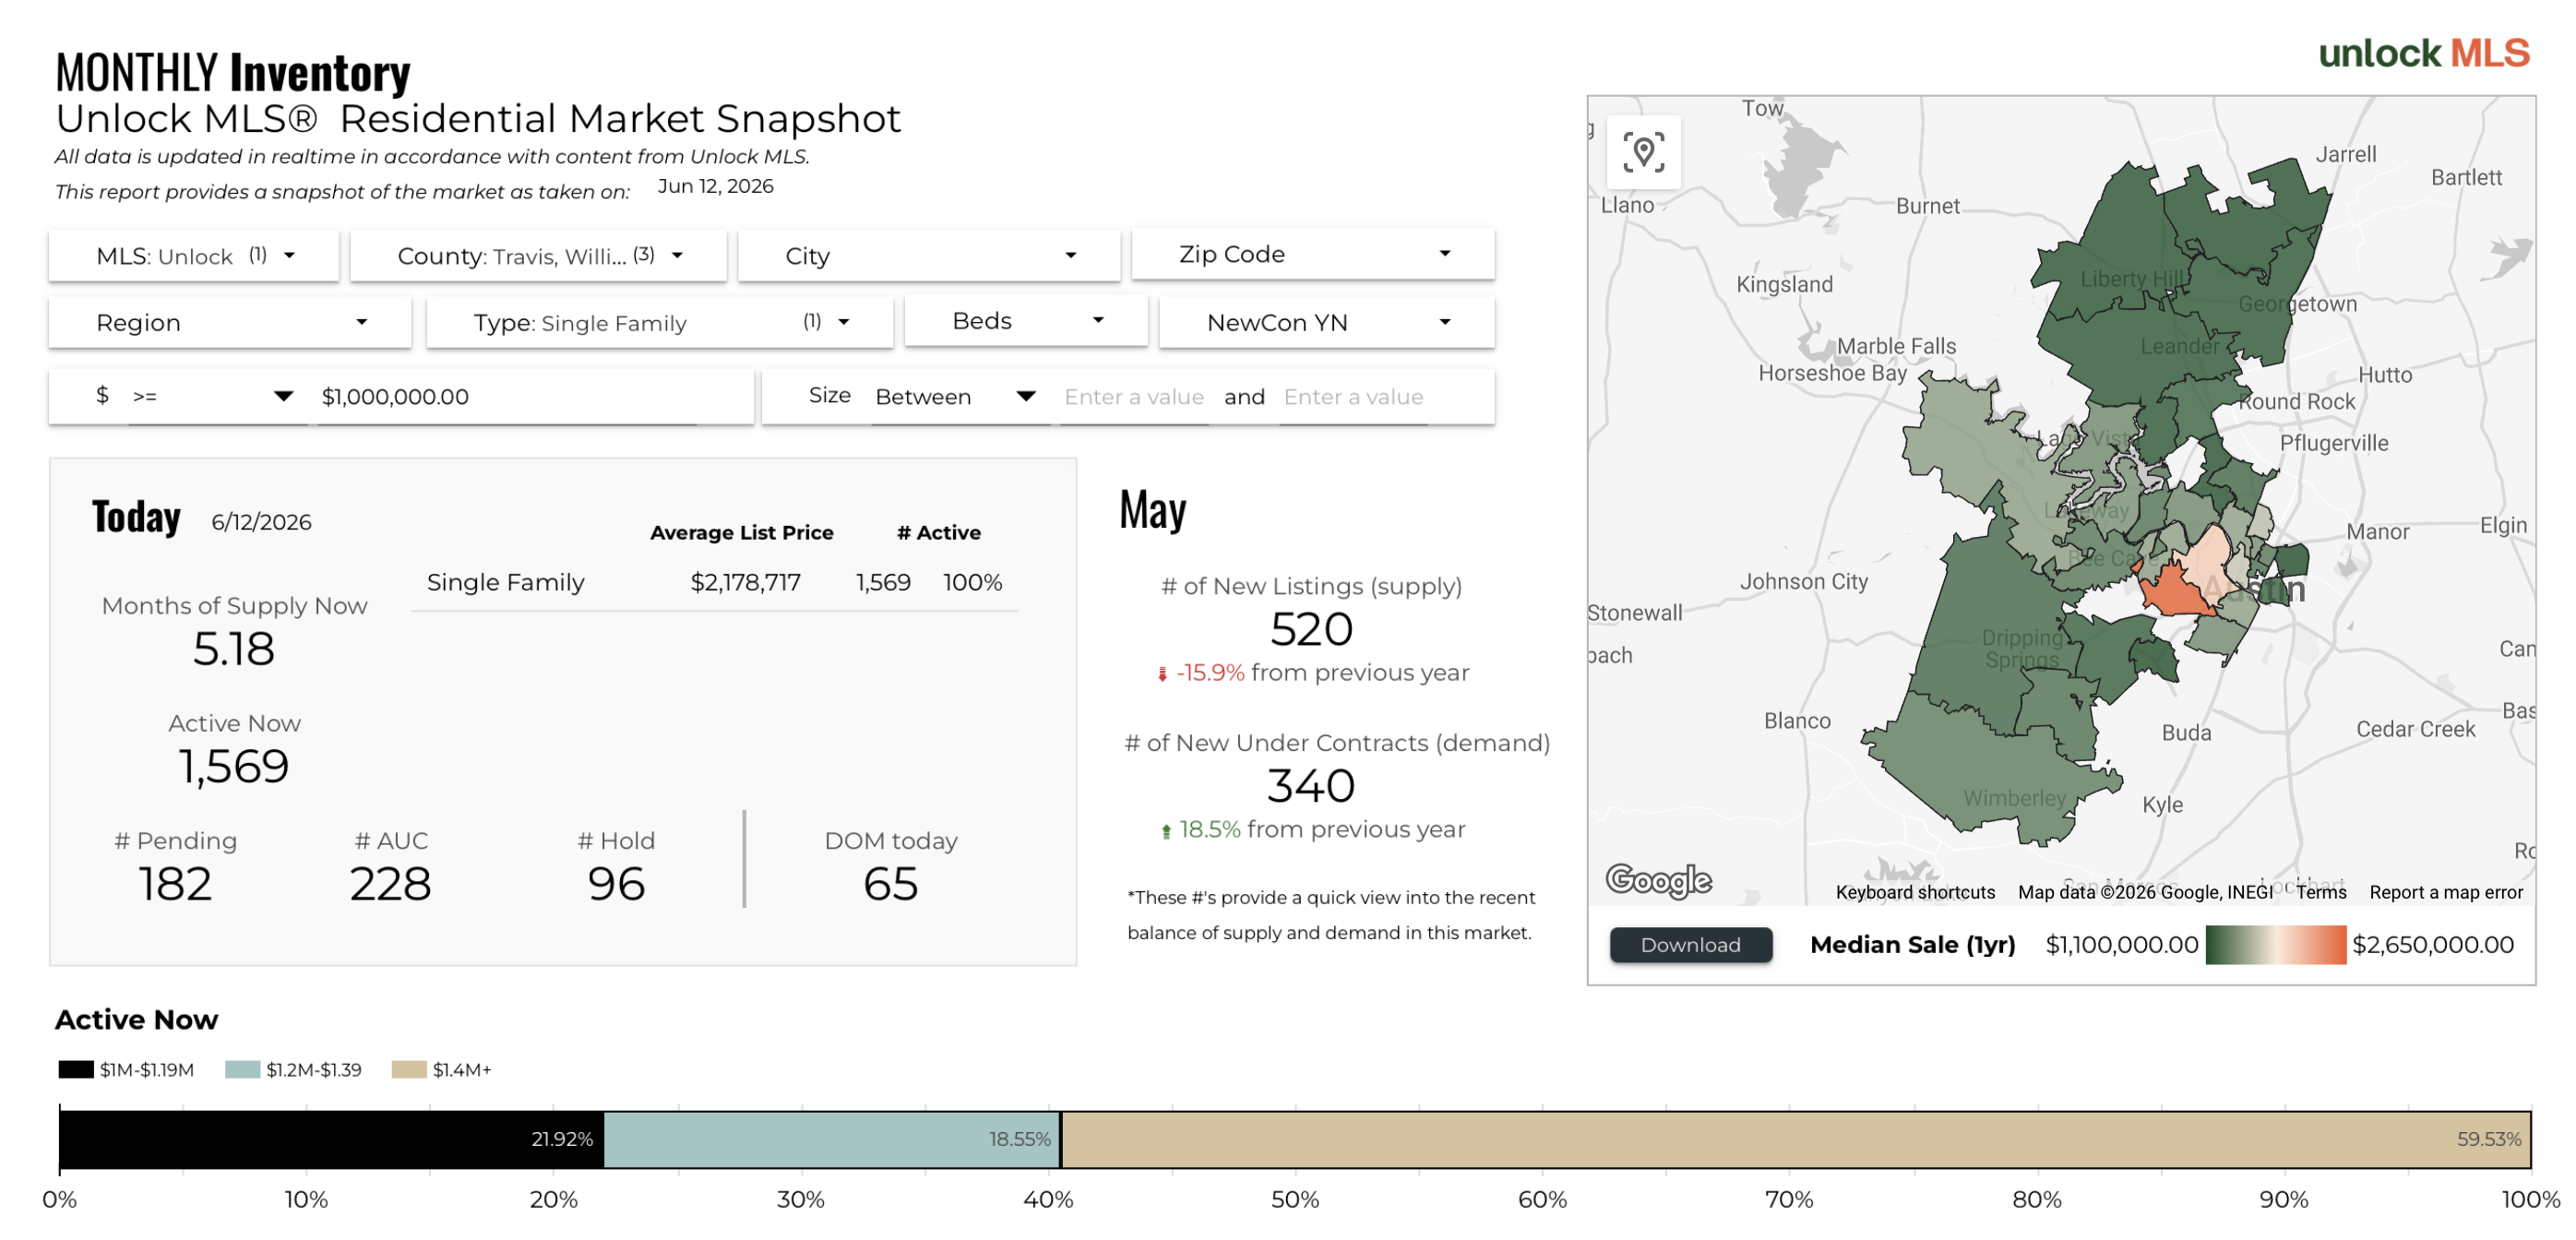
As of June 12, 2026, the Austin luxury market has 1,569 active listings and 5.2 months of supply based on the May 2026 sales pace. With 182 homes pending and 228 under contract, there is a meaningful pipeline of deals working through the system. The average list price for active luxury inventory is $2,178,773, which sits well above the May median sold price of $1,420,125, a gap that reflects the concentration of higher-priced listings in active inventory relative to what is actually closing.
New listings in the most recent 90-day window total 1,686, down 10.3% from the same period a year ago. New under contracts total 956 in the same 90-day window, up 13.4% year over year. When demand (under contracts) is rising while supply (new listings) is falling, the result is gradual compression of inventory and, over time, upward pressure on prices. The May 2026 data is starting to reflect exactly that dynamic.
Inventory by Price Range: The $1.4M-Plus Segment Carries the Most Supply
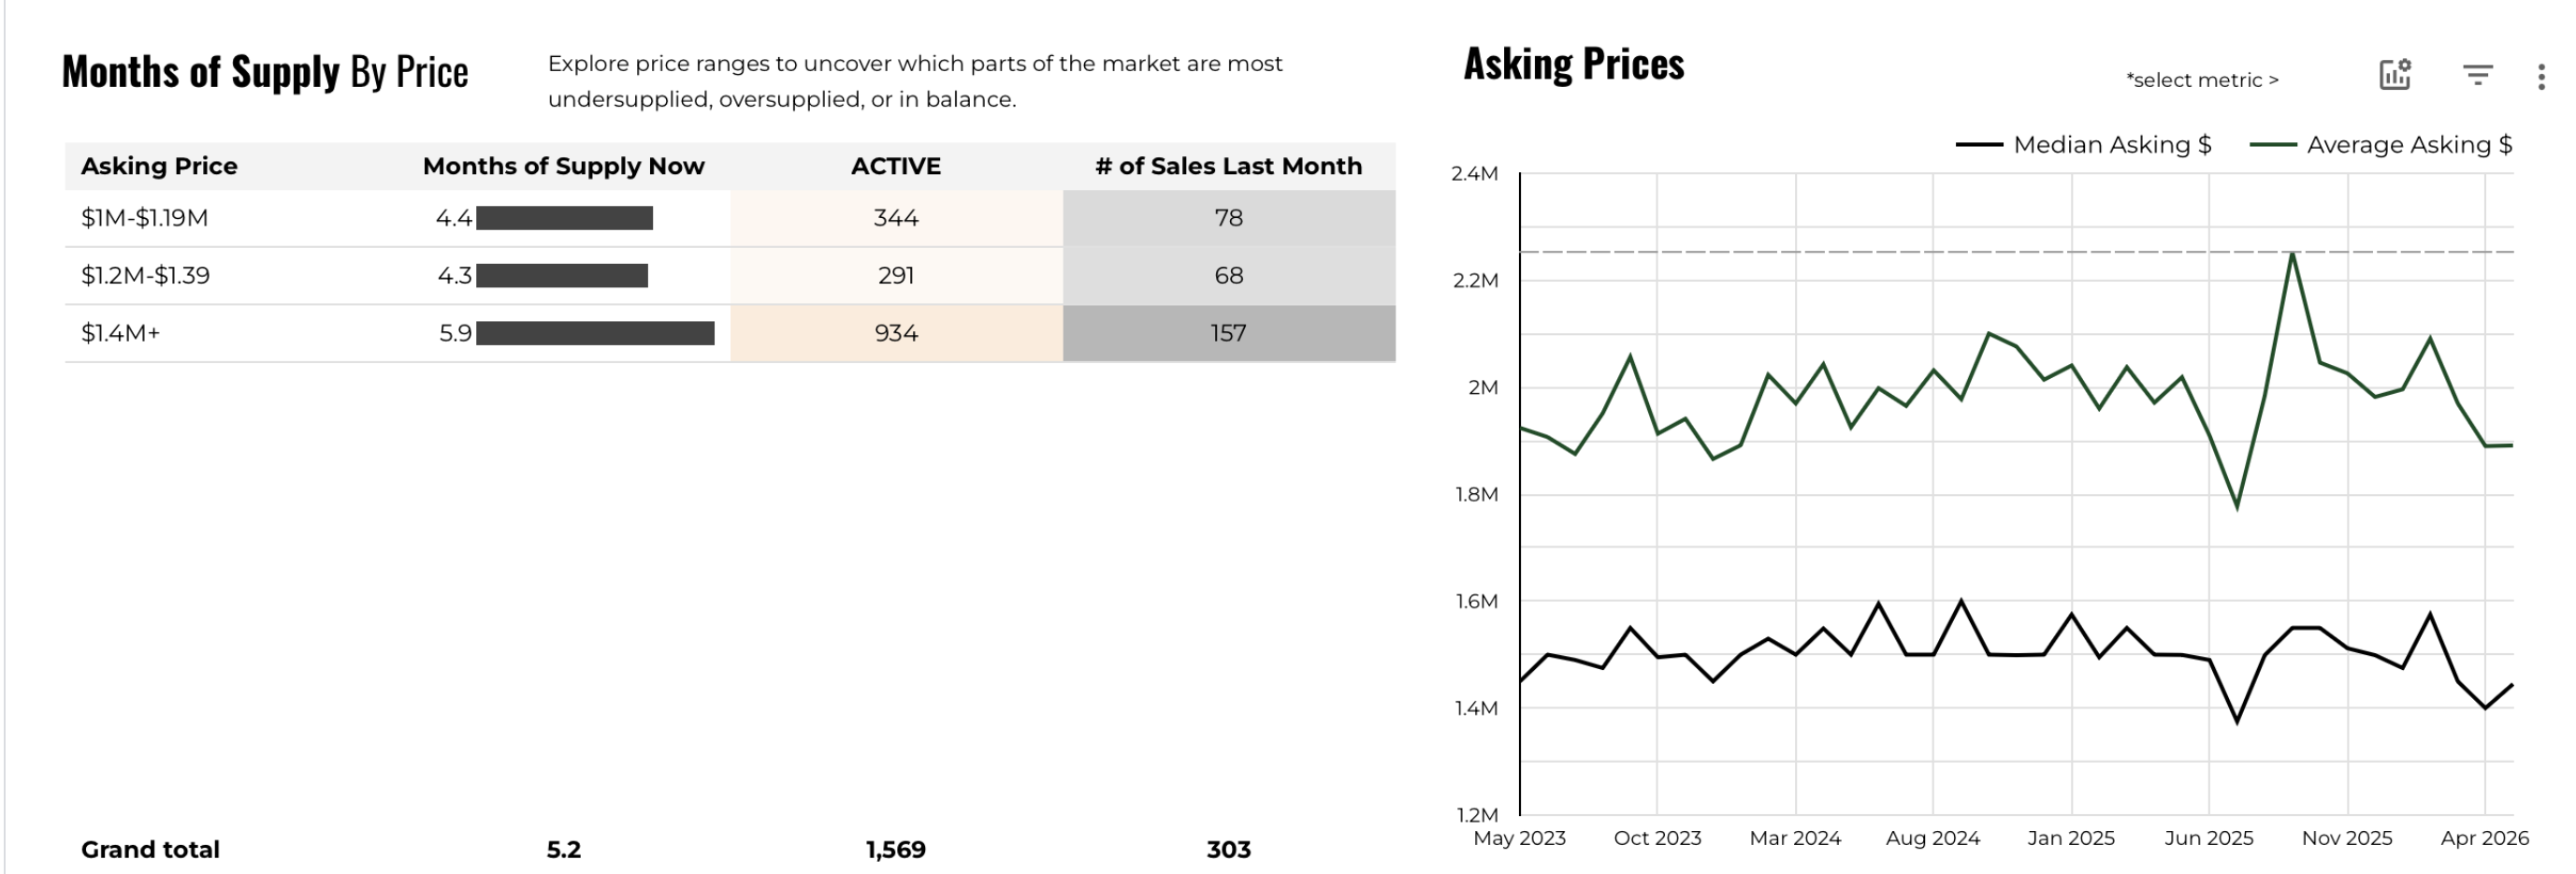
Breaking inventory down by price range reveals important differences across the luxury spectrum. The $1 million to $1.19 million range has 4.4 months of supply with 344 active listings and 78 sales in the prior month. The $1.2 million to $1.39 million range carries 4.3 months of supply with 291 active and 68 recent sales. The $1.4 million-plus segment has the deepest inventory at 5.9 months of supply, with 934 active listings and 157 recent sales.
The median and average asking price chart on the right side of this visual shows that the average asking price for active luxury listings has been running between $2 million and $2.4 million for much of the past two years, with the median asking price staying in a lower band around $1.6 million to $1.7 million. The spread between those two lines reflects the skewing effect of ultra-high-end listings pulling the average up. Buyers and sellers in the core $1 million to $2 million range should focus on the median asking price as a more representative benchmark.
Average Luxury Price Per Square Foot Reaches $484 in May 2026
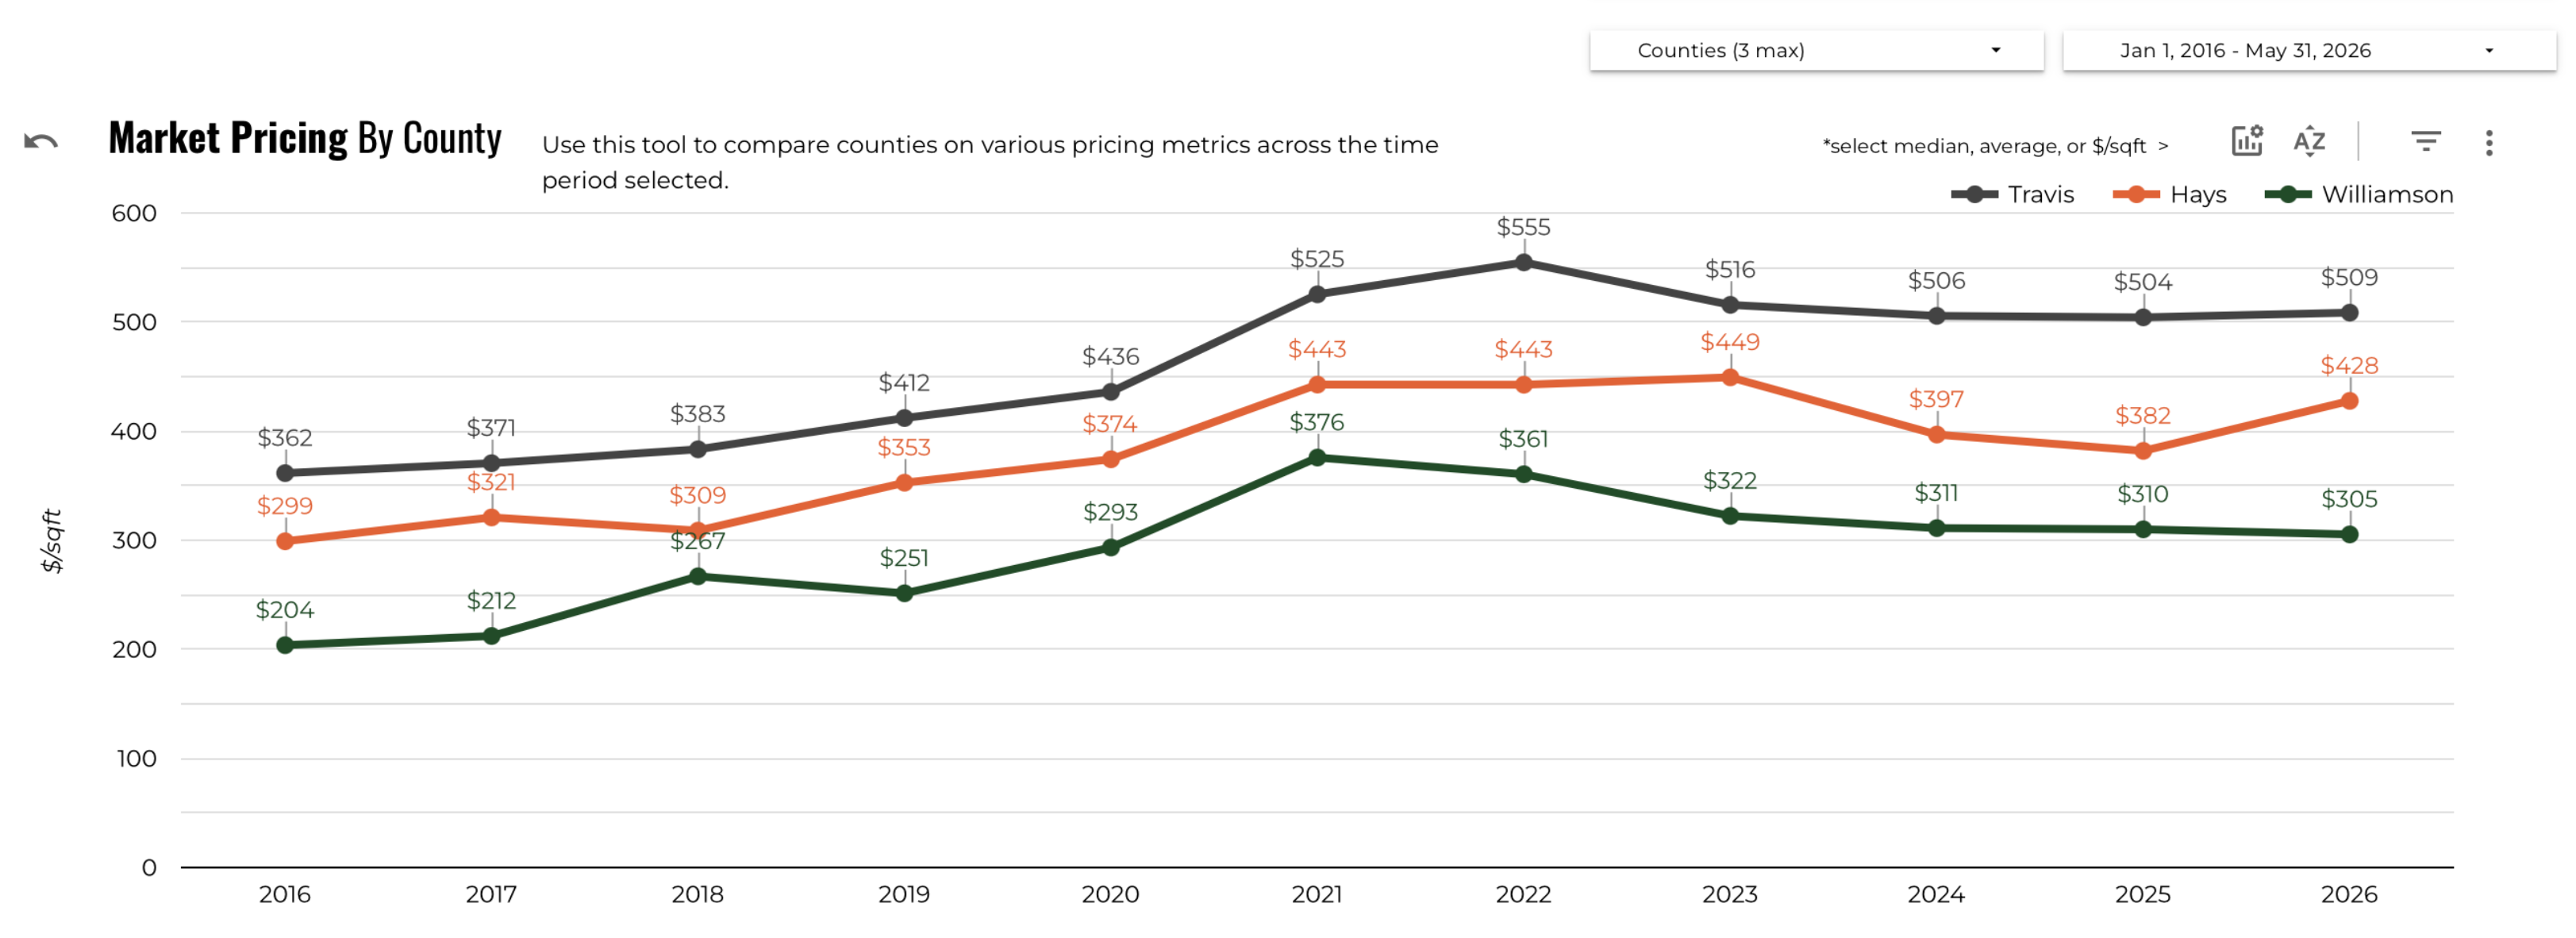
The average close price per square foot for Austin luxury homes sold in May 2026 was $484.22, with a median of $438.01. The 10-year price per square foot chart shows how dramatically this metric has moved since 2016, when Travis County luxury homes were averaging around $362 per square foot. The current level reflects cumulative appreciation even after the 2022 to 2024 correction period worked through the market.
From a buyer's perspective, price per square foot is a useful but imperfect comparison tool in the luxury segment, where finishes, lot size, location, and view premiums can create wide legitimate variation. A home at $300 per square foot in a gated Hays County community and a home at $700 per square foot in Tarrytown are both priced "correctly" for their respective contexts. That said, understanding where a home falls relative to comparable properties on a price-per-square-foot basis gives you a strong starting point for negotiations.
Travis County Commands $509 Per Square Foot, Williamson County at $305
The county-level price per square foot data for 2026 shows Travis County at $509, Hays County at $428, and Williamson County at $305. These figures reflect the differing land values, neighborhood profiles, and home characteristics across the three counties. Travis County's premium per square foot is driven by the concentration of urban and near-urban luxury neighborhoods, while Williamson County's lower per-square-foot figure reflects larger homes on larger lots in more suburban and rural settings.
All three counties have seen their price-per-square-foot figures rise from their 2016 baselines, though the pace of growth has varied. Travis County has grown from $362 to $509 over 10 years, a gain of 40.6%. Hays County grew from $299 to $428, a 43.1% increase. Williamson County went from $204 to $305, up 49.5%. The relatively faster percentage growth in Williamson and Hays reflects the draw of those markets for buyers seeking lower entry prices within the luxury threshold.
New Luxury Listings Total 1,686 in the Past 90 Days, Down 10.3% Year Over Year
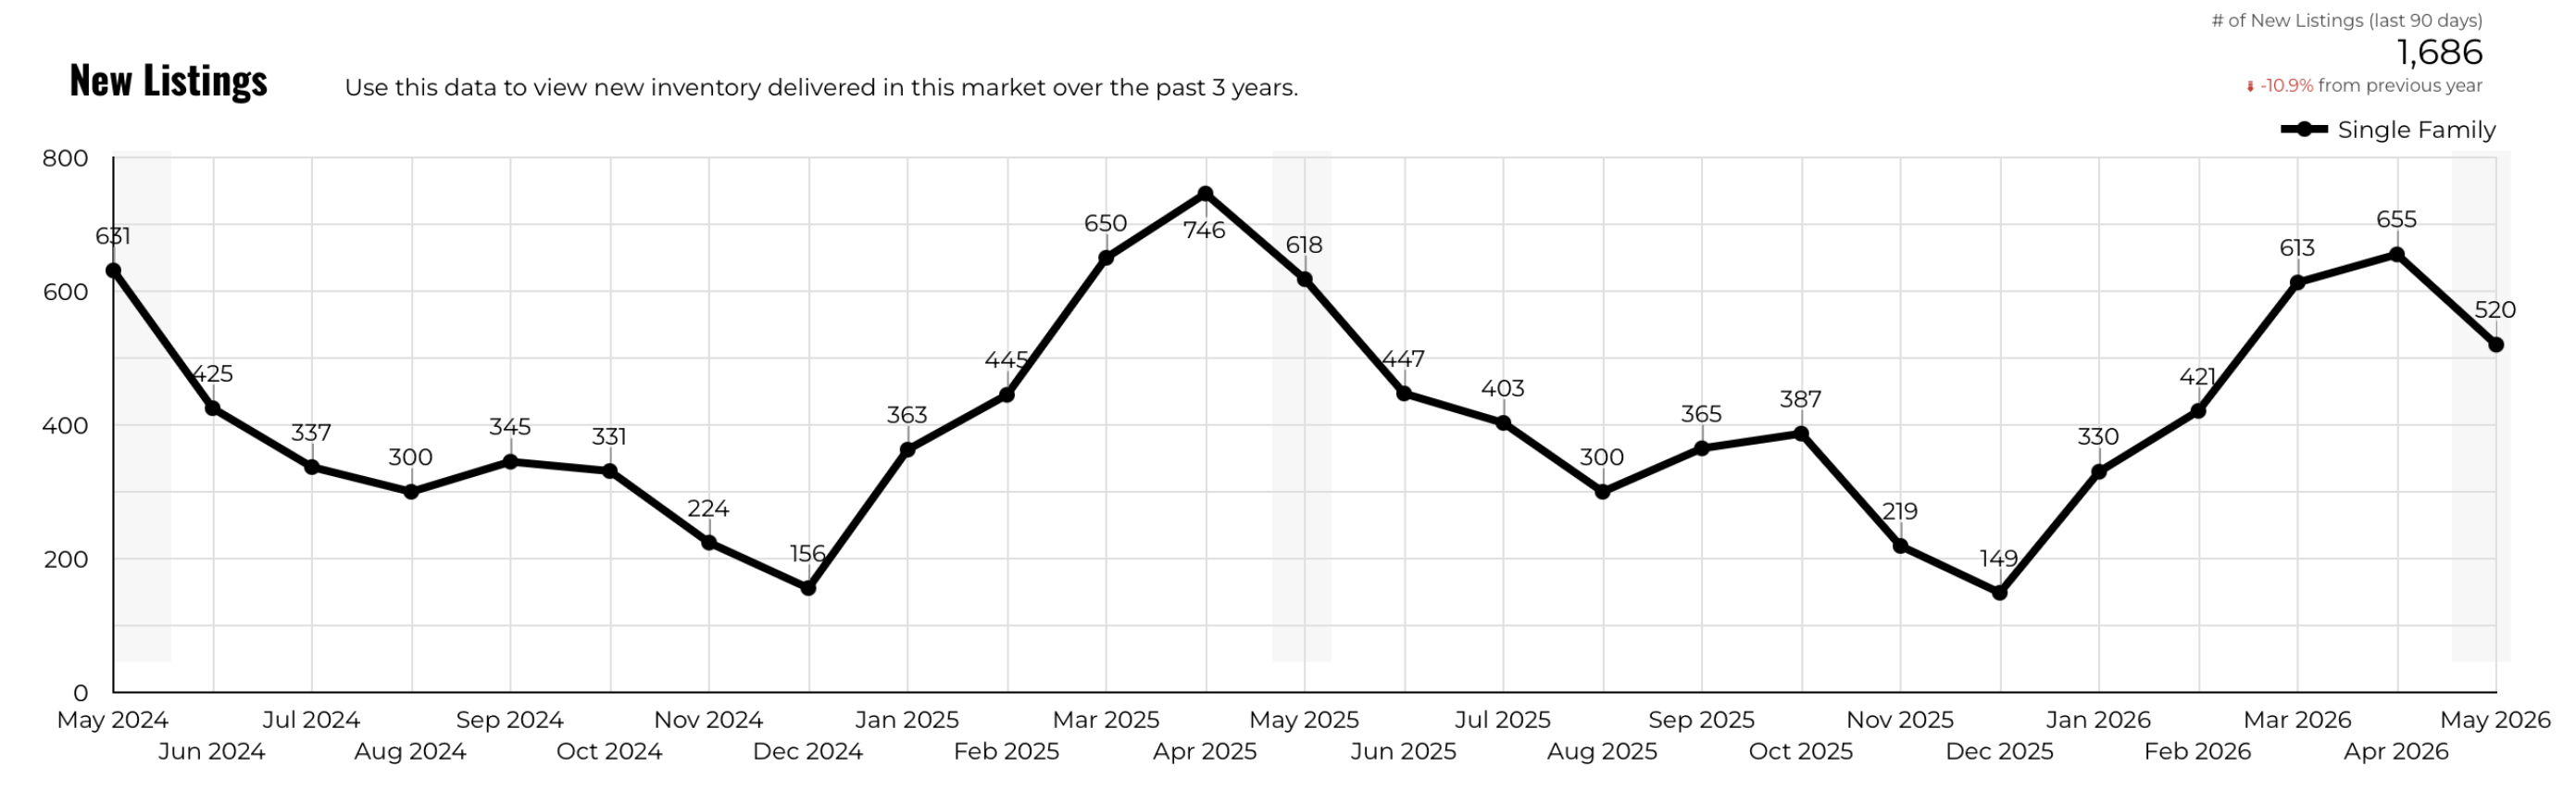
New luxury listings over the trailing 90-day window total 1,686, down 10.3% from the same period in 2025. The monthly new listings chart shows that May 2026 came in at approximately 520 new listings, following a spring surge in March and April when listings topped 600 per month. The pullback in new supply is a meaningful development: fewer new listings entering the market while sales are accelerating creates tightening conditions that tend to support prices.
Looking at the three-year pattern, new listings typically peak in March through May before tapering in summer and falling sharply in November and December. If the 2026 pattern holds, expect new listing supply to moderate through June and July, which could keep competition for well-priced homes relatively high heading into the second half of the year. Sellers who list this summer may face fewer direct competitors than those who waited to list in spring.
New Luxury Under Contracts Up 13.4% Year Over Year with 340 Homes Going Pending
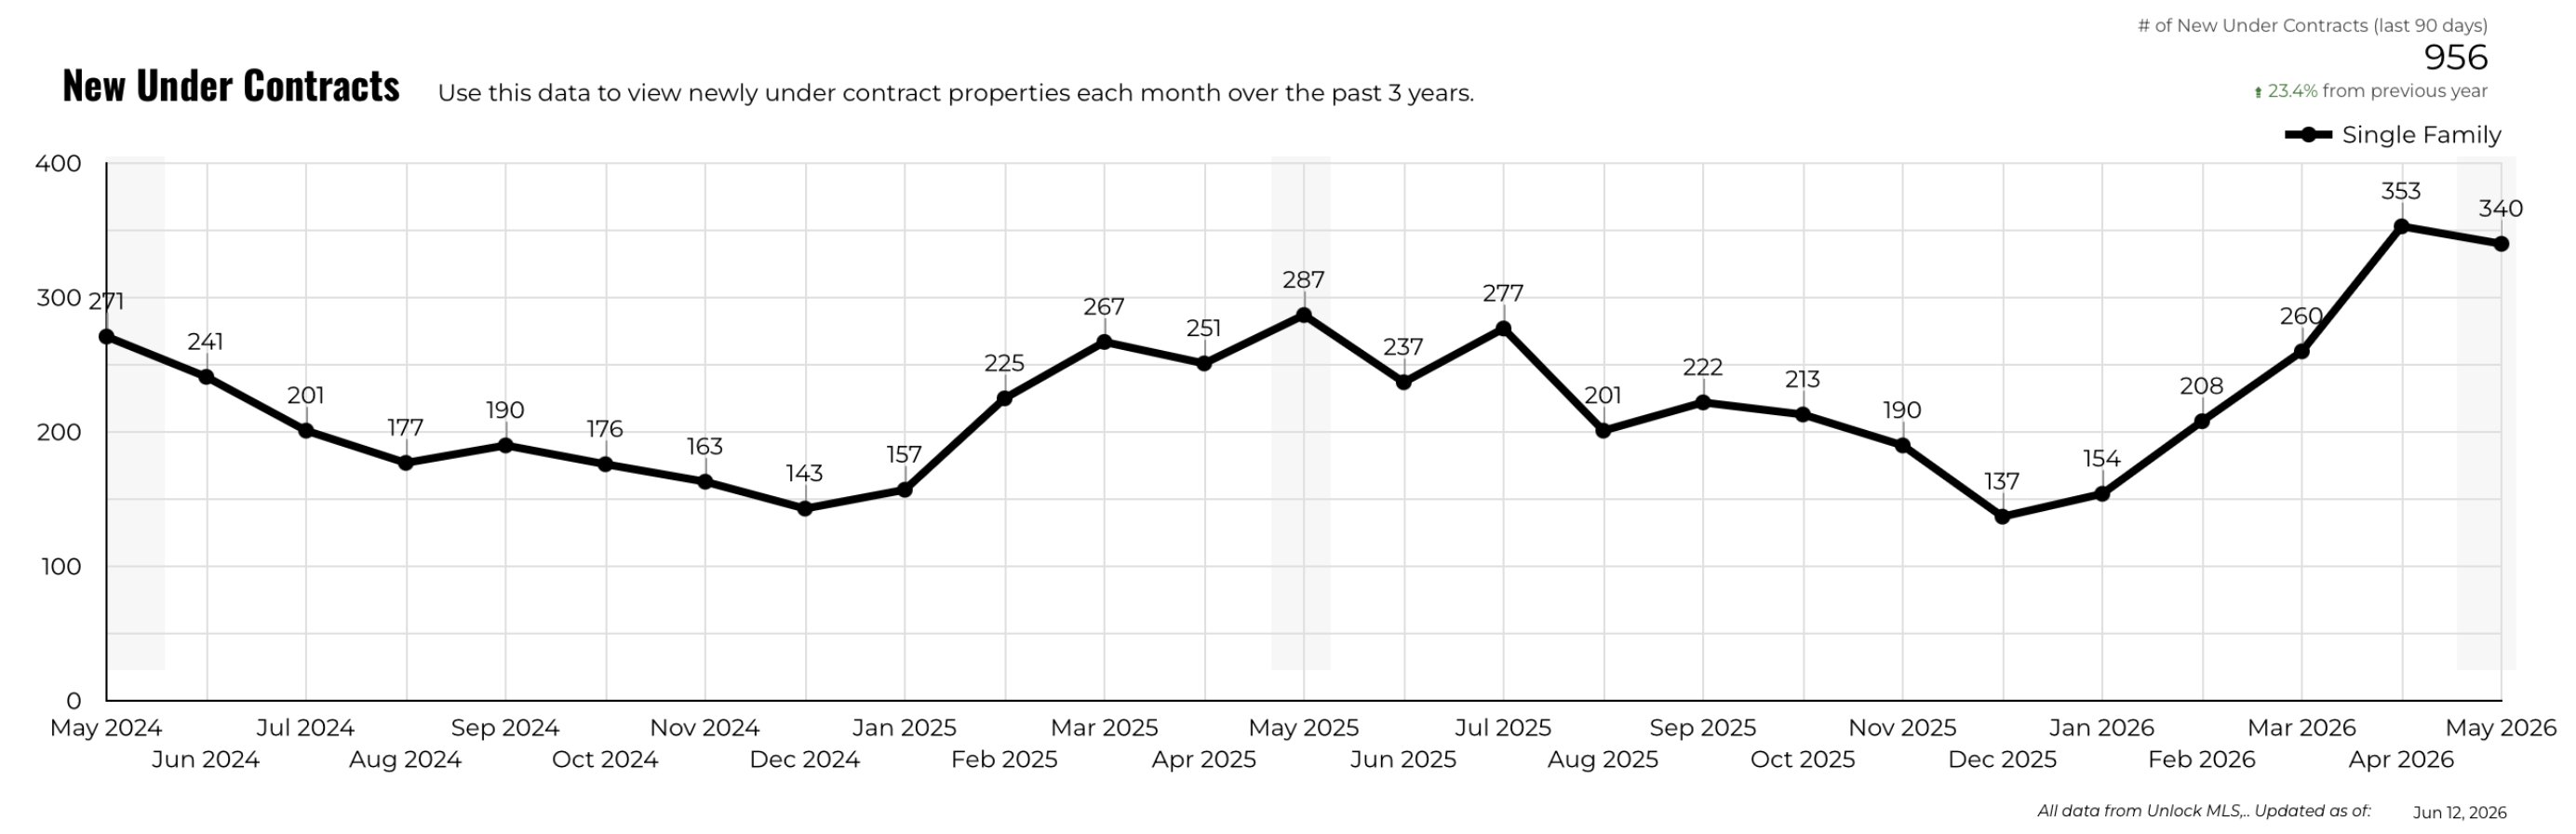
New under contracts in the trailing 90-day window total 956, up 13.4% from the same window a year ago. May 2026 specifically saw approximately 340 new contracts written on luxury homes. This is one of the stronger demand readings in the past two years. Comparing the 2026 line on the under contracts chart to 2025 and 2024, May 2026 sits noticeably higher, which reinforces the story told by the closed sales data: buyer engagement in the Austin luxury market is genuinely increasing.
The divergence between falling new listings and rising new contracts is the key signal in the May data. When these two lines move in opposite directions, inventory tends to compress over the following one to three months. That compression typically shows up first in days on market, then in price. Buyers who are actively searching now may be working in a more competitive environment than the headline inventory numbers suggest.
49% of Active Luxury Listings Have Taken a Price Reduction
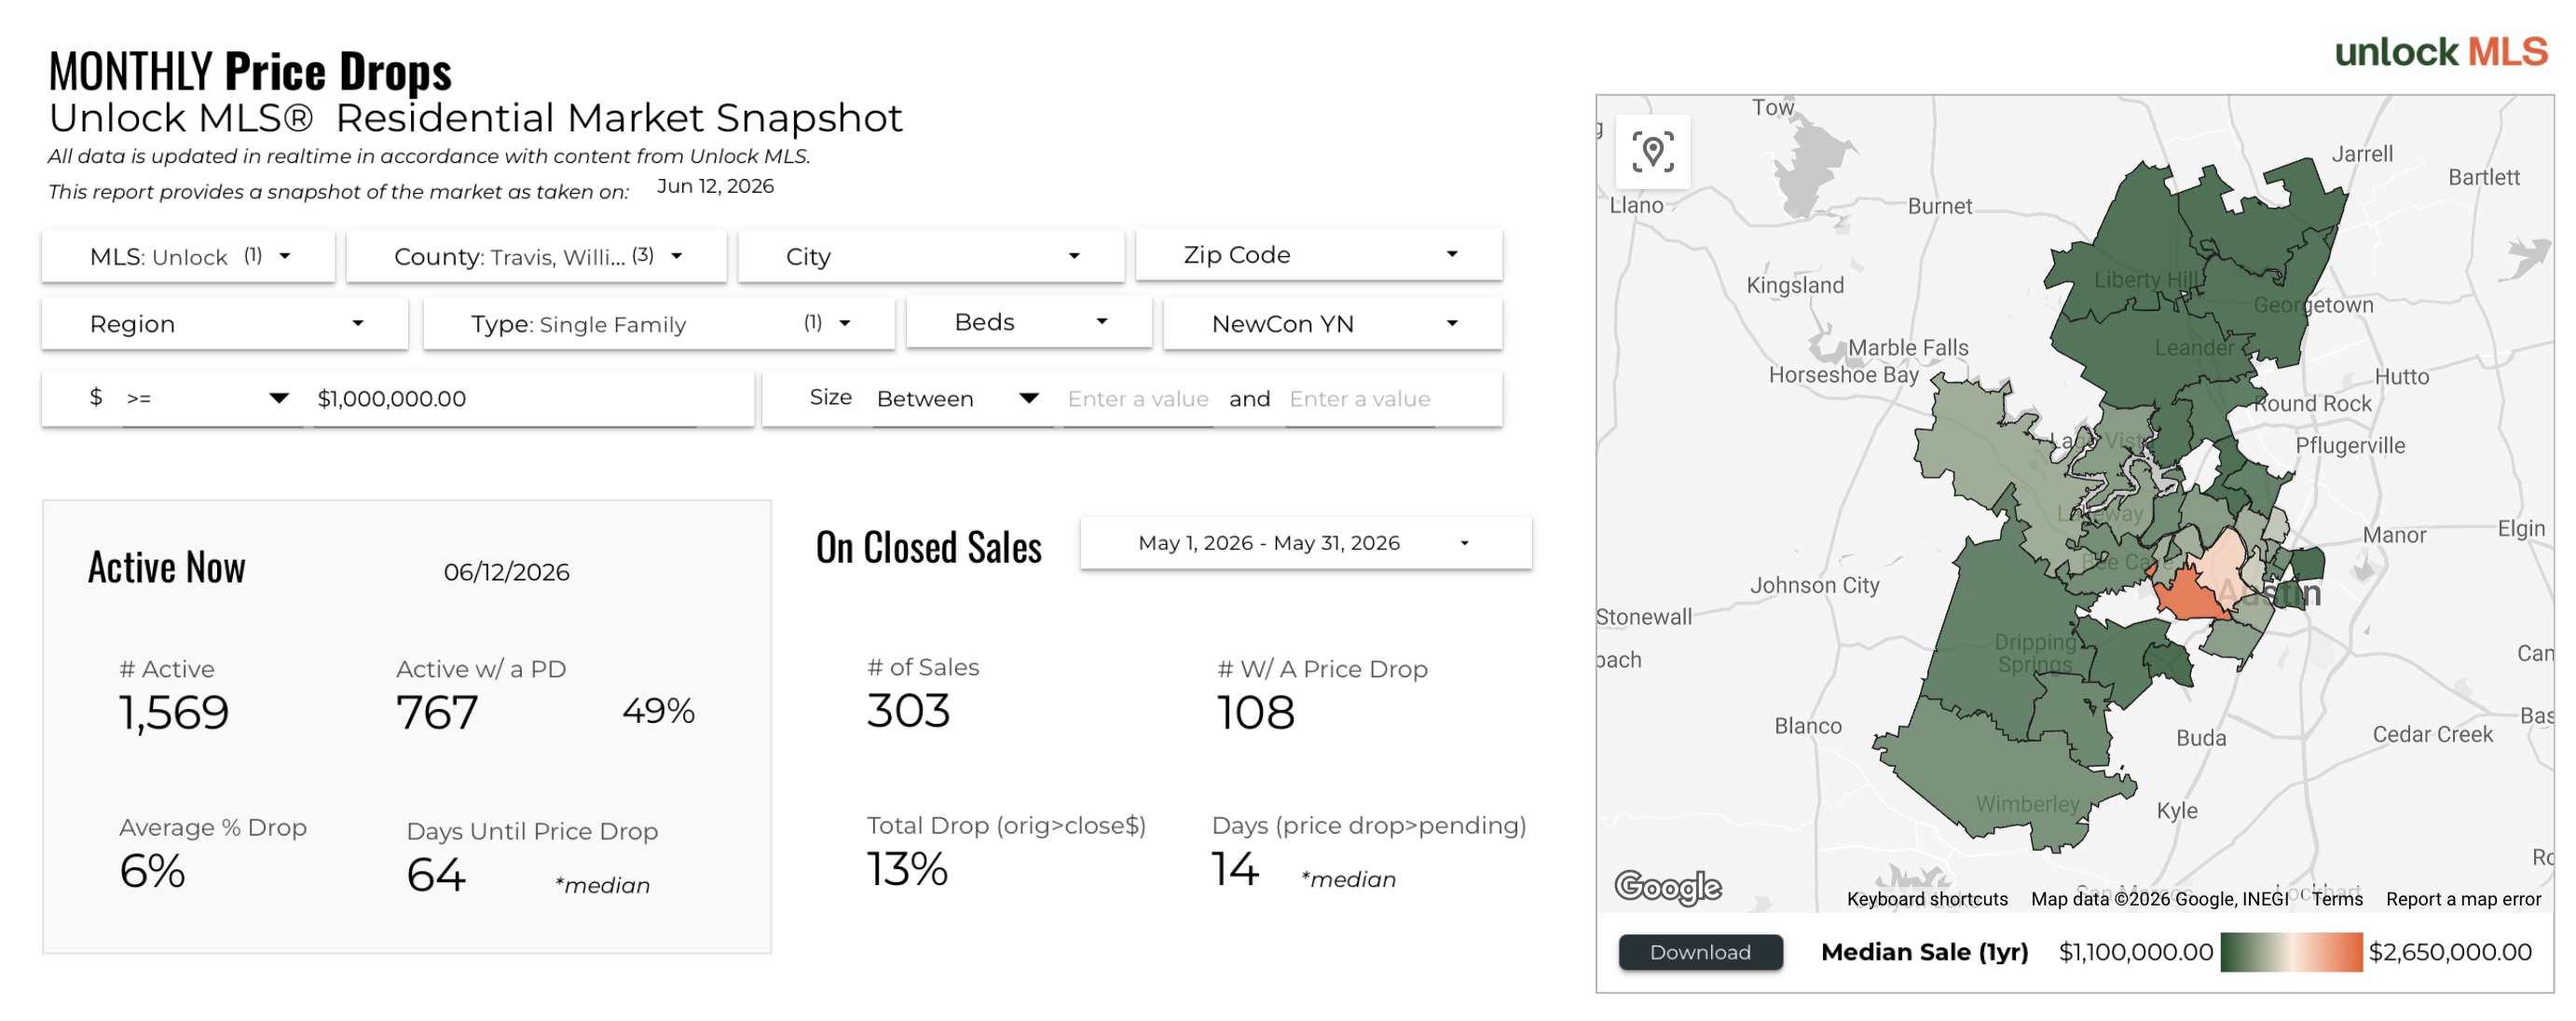
As of June 12, 2026, 767 of the 1,569 active luxury listings, or 49%, have had at least one price reduction. The average price drop across those listings is 6%, and the median time from listing to first price reduction is 64 days. Among the 303 luxury homes that closed in May 2026 via the CentralTX platform, 108 (about 13%) had a price reduction before going under contract, and those price-reduced homes went under contract in a median of just 14 days after the drop.
For buyers, the active price drop data is a useful hunting ground. Nearly half of all active luxury listings have already corrected their price at least once, which means sellers in that group have demonstrated a willingness to adjust. For sellers, the message is that overpricing early and reducing later does work eventually, but it costs an average of 64 days and results in a lower ultimate sale price than properties that are priced correctly from the start. The 6% average drop means a home originally listed at $2,000,000 is typically reducing by $120,000 before selling.
Price Drops Settle at 8% in May, Moderating from Recent Highs
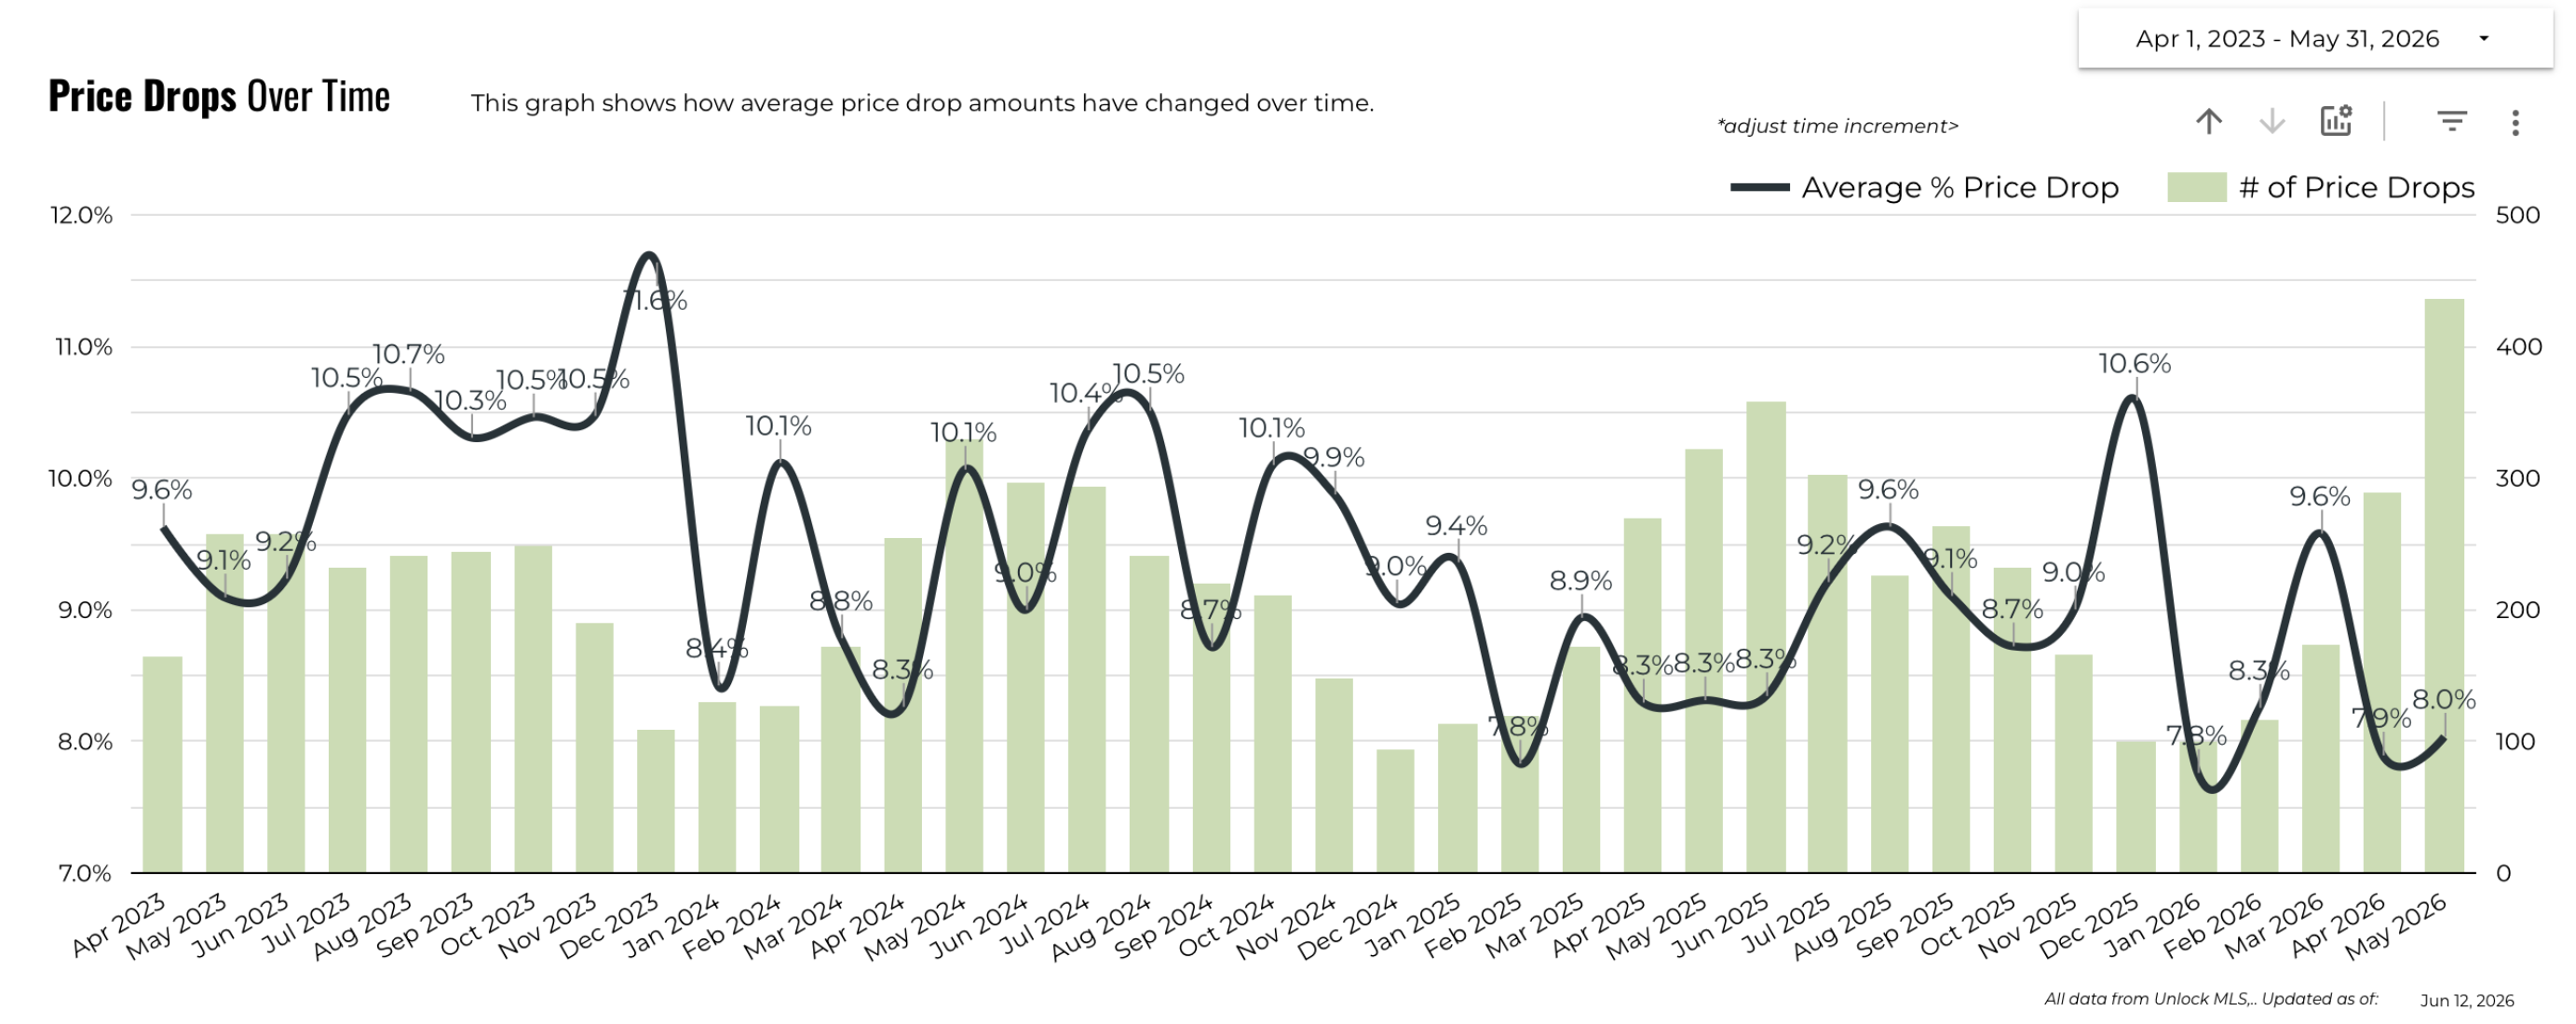
The average price drop percentage for May 2026 came in at 8.0%, continuing a gradual moderation from the 10% to 10.7% levels seen through much of 2023 and early 2024. While 8% is still a meaningful discount from asking, the trend toward lower average drop percentages over the past 12 months suggests that sellers are either pricing more accurately from the start or that buyer offers are landing closer to asking price.
The number of price drops (shown as bars in the chart) has followed a seasonal pattern, with more reductions occurring in spring when new listings flood the market and competition for buyers increases. The May 2026 bar reflects a moderate number of price drops relative to recent months, which aligns with the improving demand picture. As the market absorbs more inventory through closings, the pressure on remaining sellers to reduce should ease gradually through the summer.
Price-Reduced Homes Went Under Contract in a Median of 14 Days
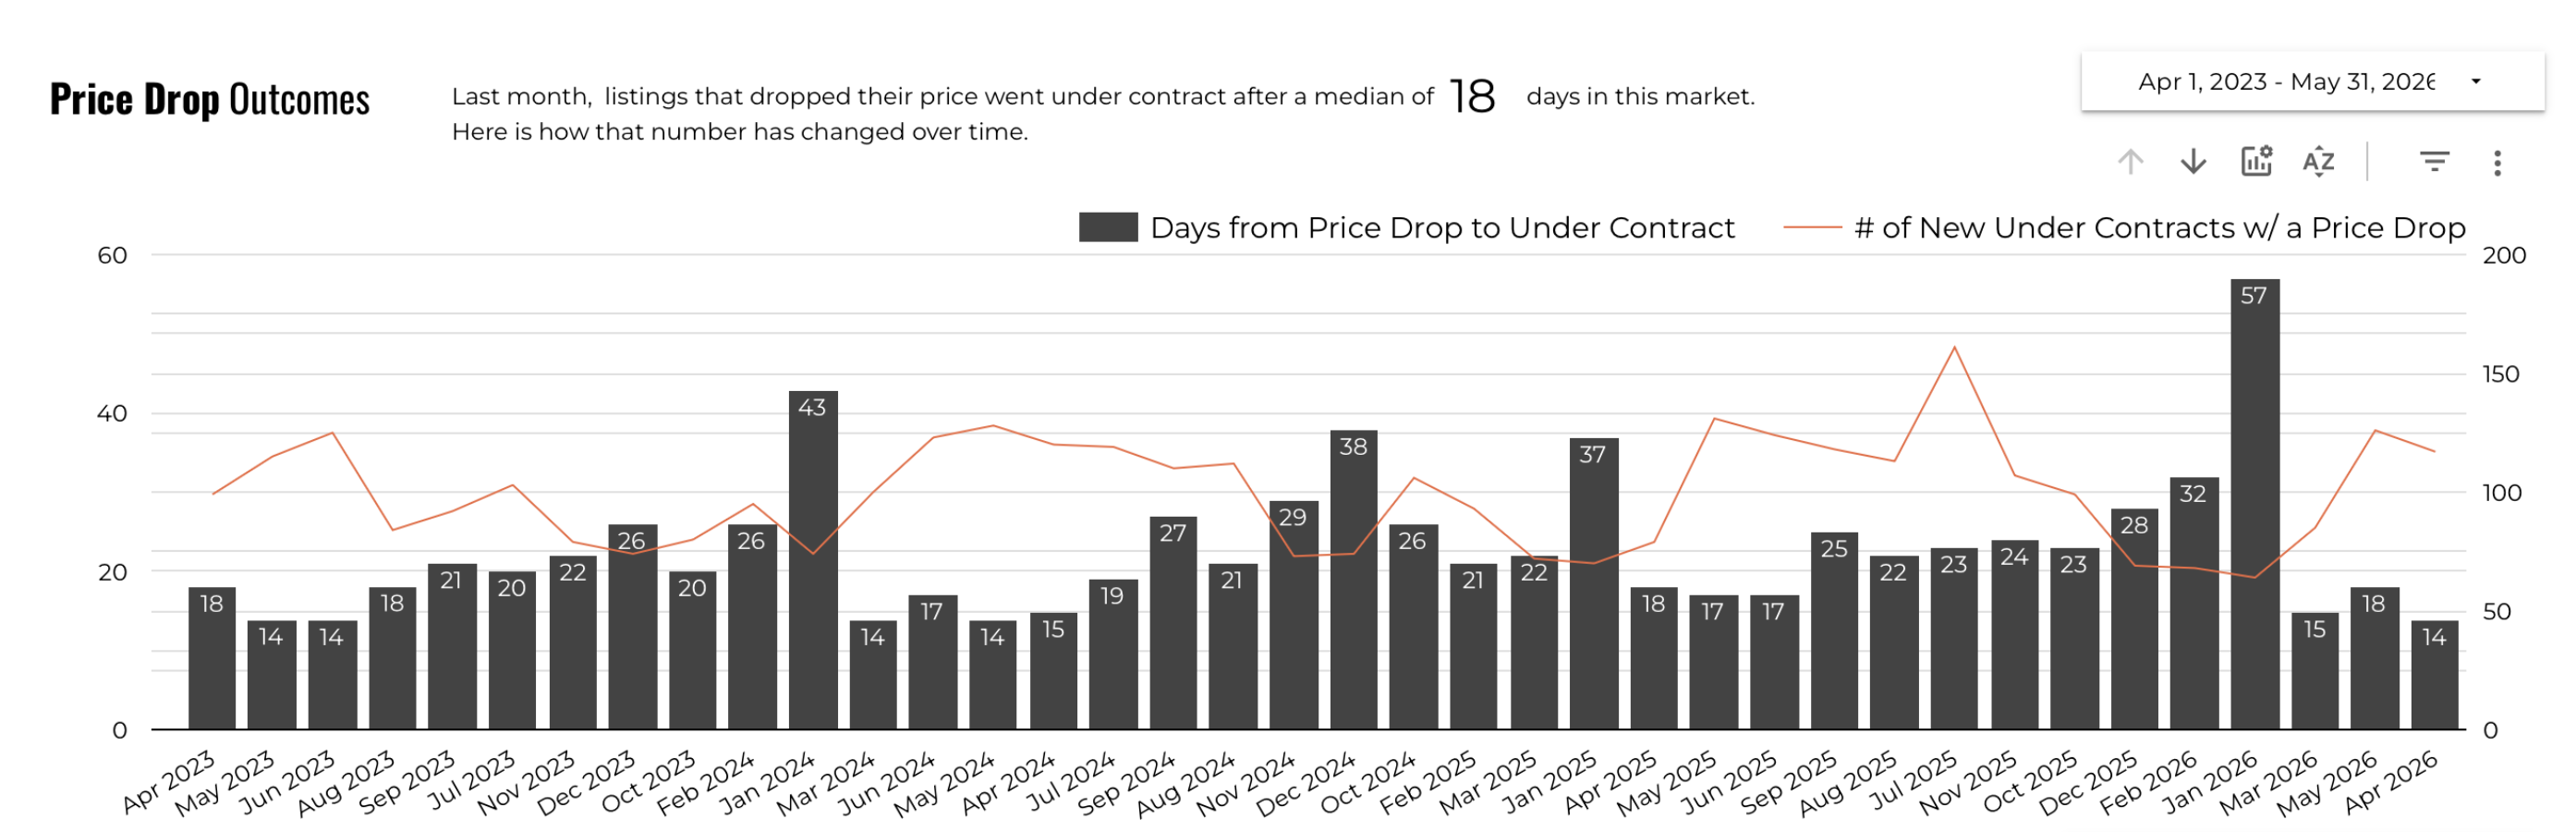
The price drop outcomes chart tracks how many days it took for price-reduced listings to go under contract after their reduction, and how many new under contracts in any given month involved a price-reduced home. For May 2026, the median was 14 days from price drop to under contract, a relatively fast turnaround that shows that well-executed price reductions are being met with buyer response quickly.
Looking at the historical pattern, the days from price drop to under contract has bounced between roughly 14 and 43 days over the past three years. The current reading at 14 days is at the lower end of that range, suggesting that buyers are attentive and willing to move when they see a price correction that brings a home into reasonable value territory. Sellers who are considering a price reduction should not expect to sit at the reduced price for months; if the reduction is meaningful and the home is otherwise well-presented, the market is responding within two to three weeks.
Sellers Received 96.3% of List Price and 93.4% of Original List on Average
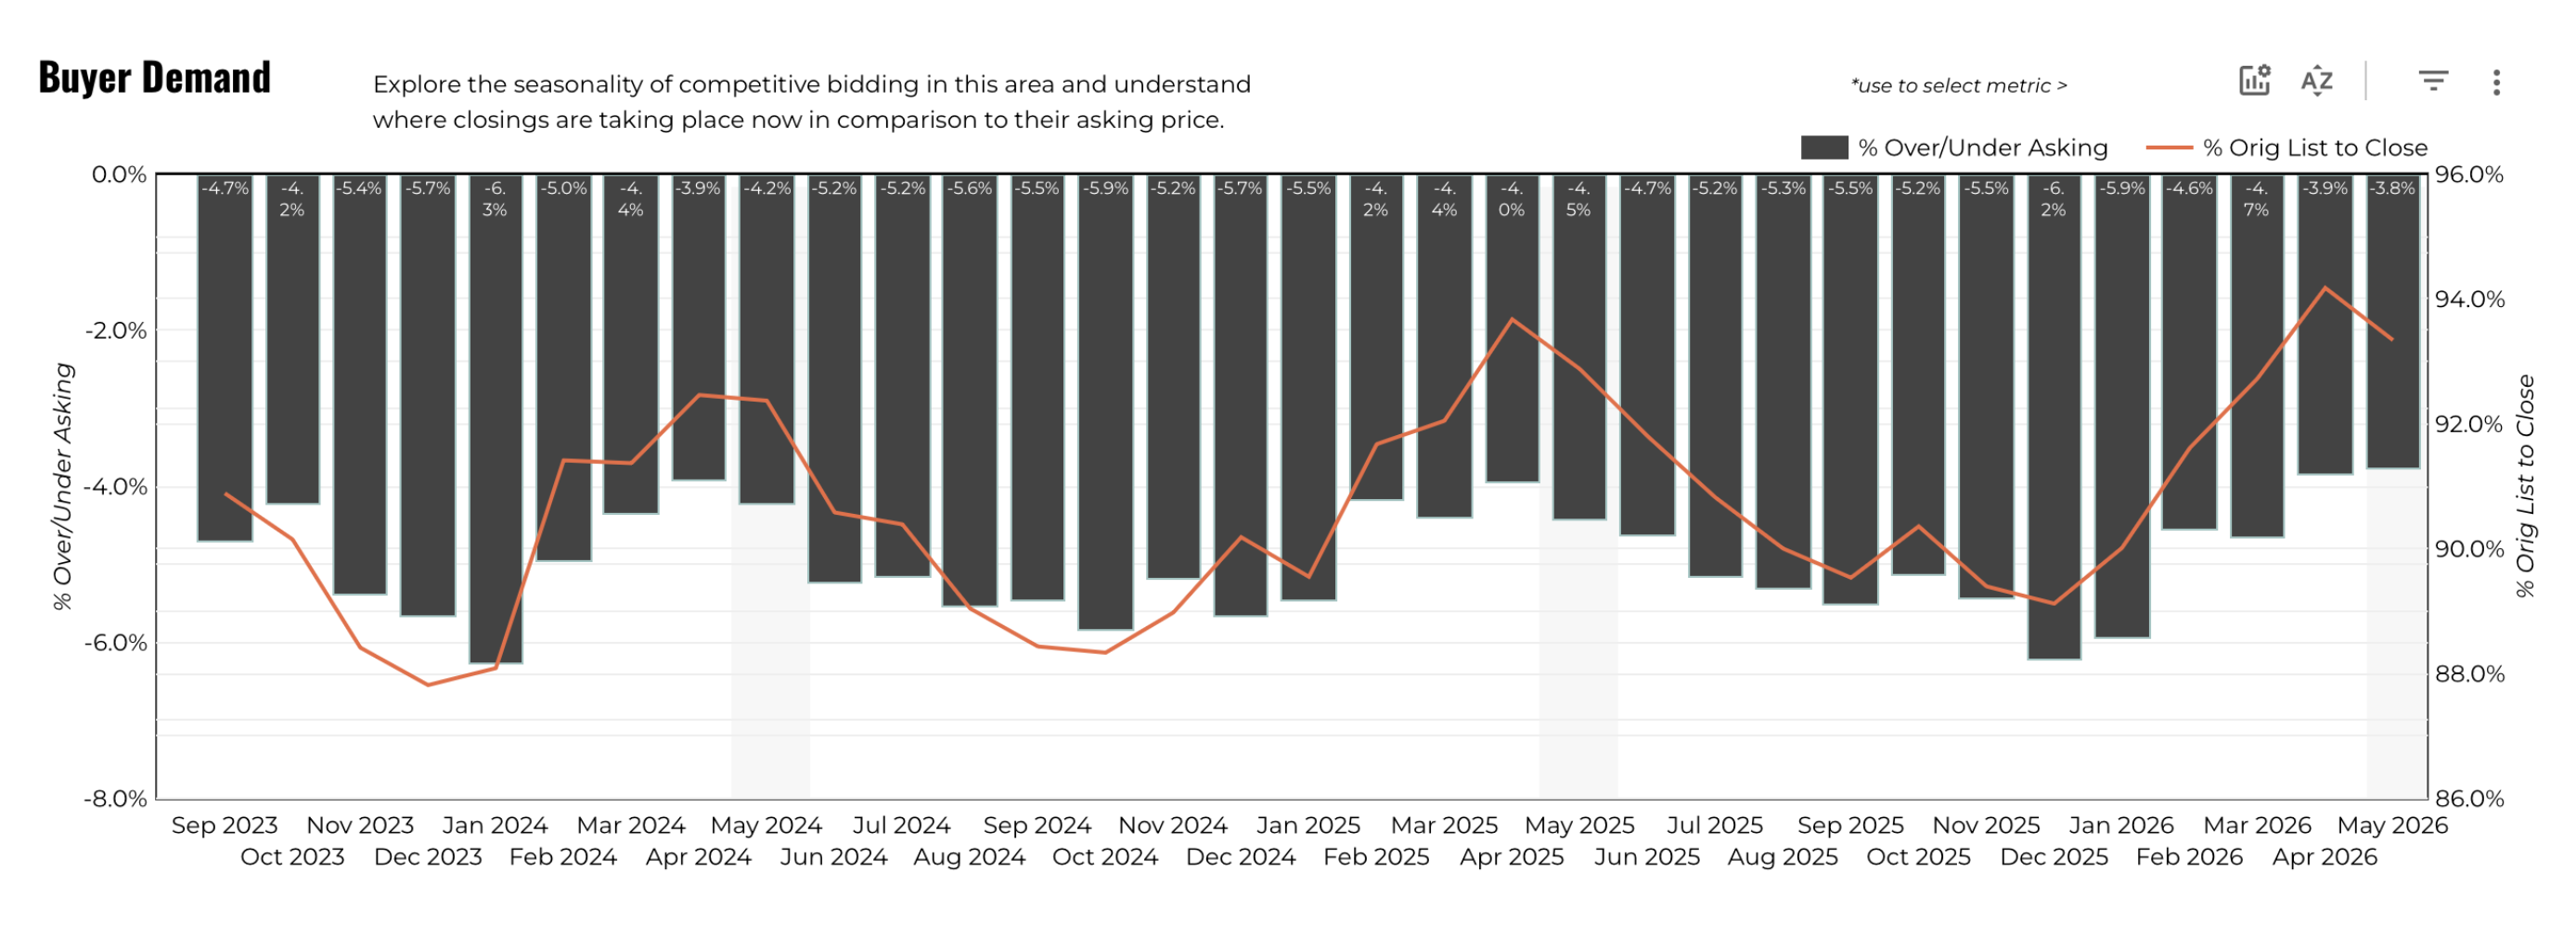
The buyer demand chart tracks two key negotiation metrics over time: the percentage of final list price received (CP/LP%) and the percentage of original list price received (CP/OLP%). In May 2026, luxury sellers received an average of 96.3% of their final list price, meaning buyers were typically negotiating about 3.7% below the asking price at time of contract. Against the original list price, sellers received 93.4% on average, a larger gap that captures the cumulative effect of price reductions before going under contract.
The trend line over the past three years shows these metrics bottoming out in 2023 and 2024, when sellers were receiving as little as 90% to 91% of original list price in some months, and gradually recovering toward the current 93% to 94% range. The direction of travel is positive for sellers, but there is still meaningful room between where the market sat at its 2021 peak, when many luxury homes were selling at or above list, and where it sits today. Buyers currently have more leverage than the sales volume and price headlines alone would suggest.
Buyer Demand by Price Range: The $1.4M-Plus Segment Grew 26.9% Year Over Year
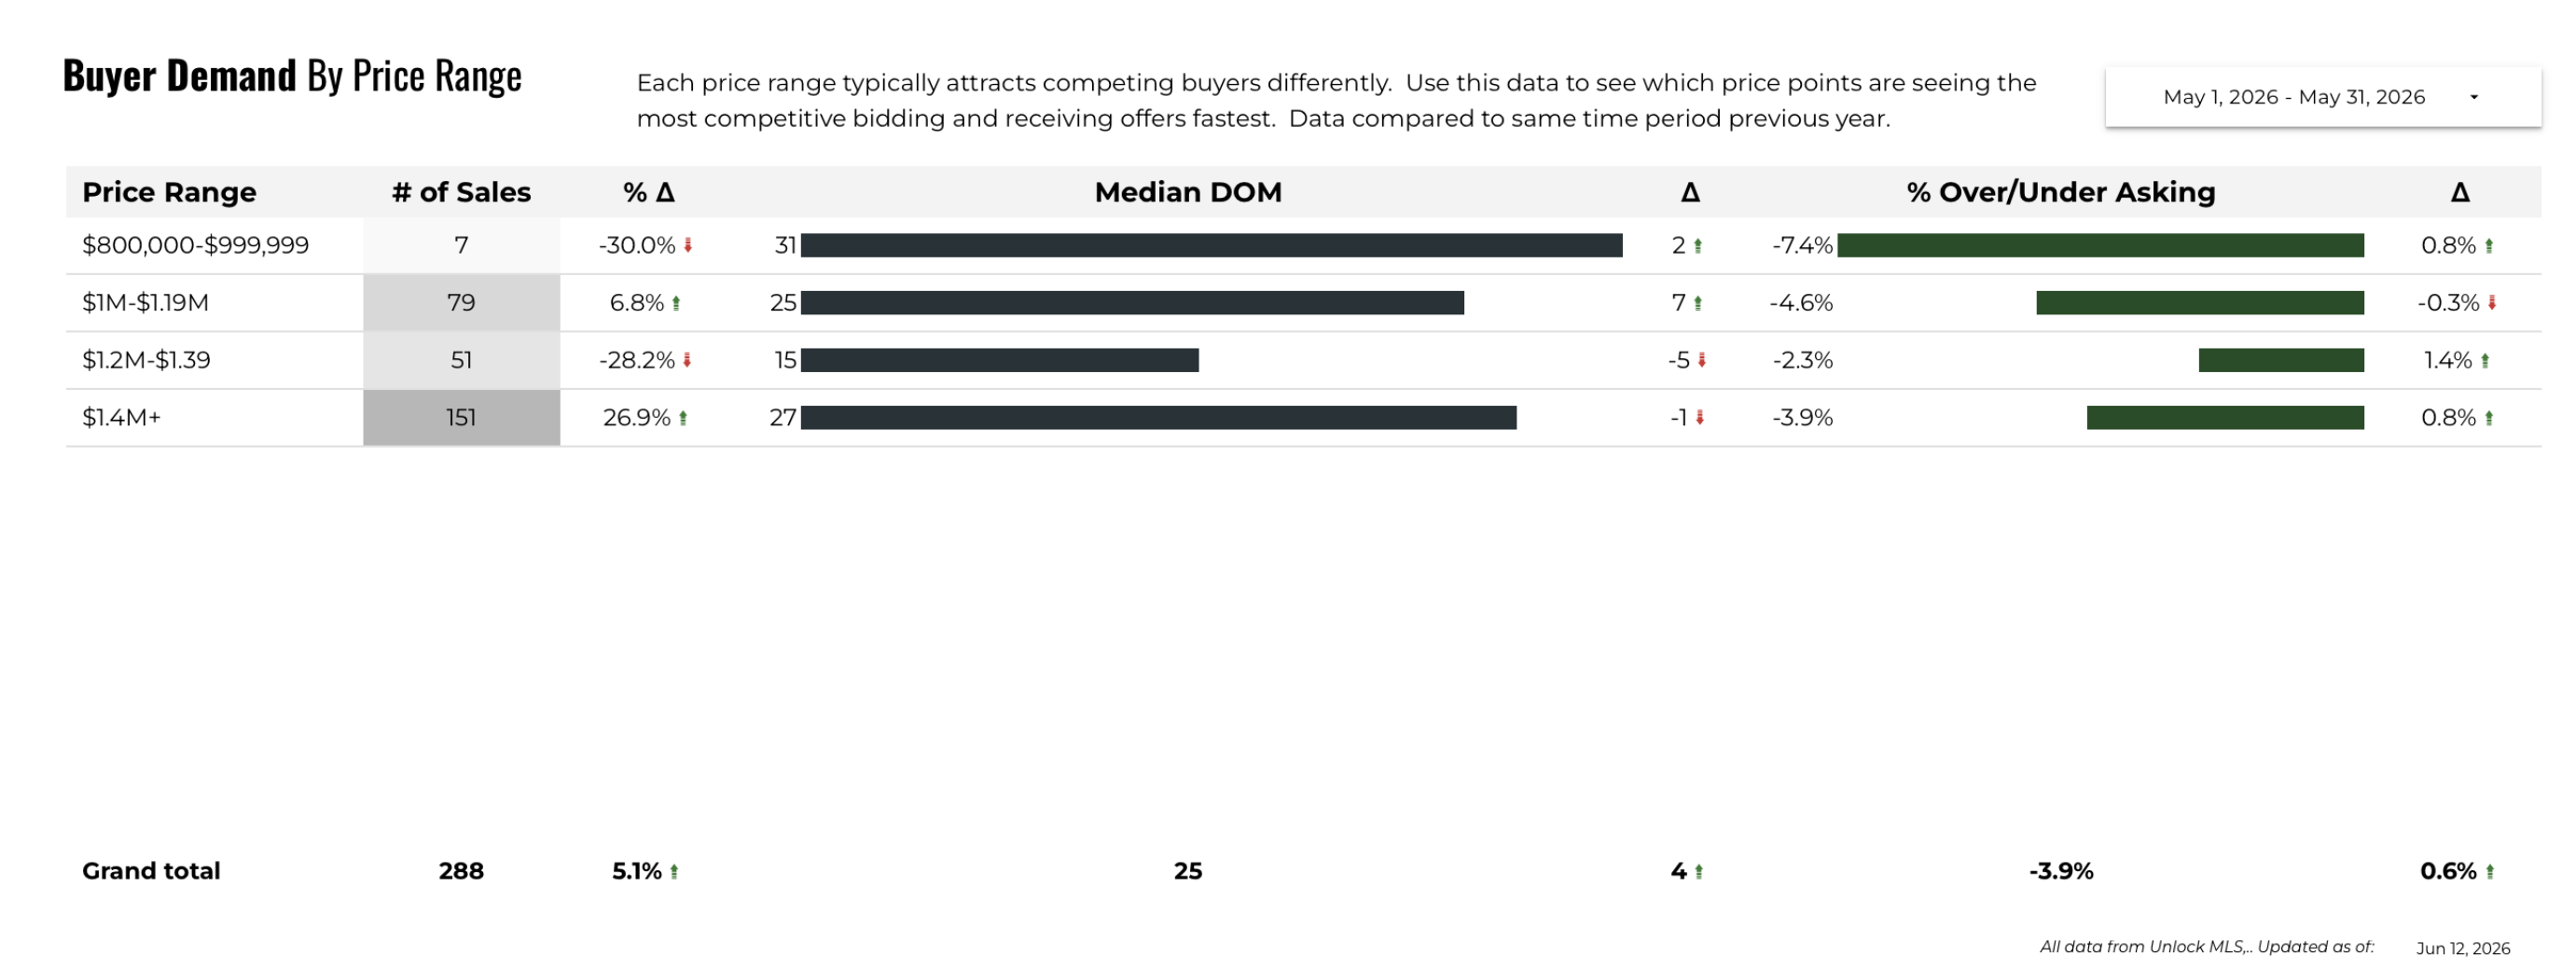
Breaking buyer demand down by price range highlights sharply different stories across the luxury spectrum. The $1.4 million-plus segment saw a 26.9% year-over-year increase in sales, with 151 closings and a median DOM of 27 days. Buyers in that range are selling an average of 3.9% under asking price. At the entry end of luxury, the $1 million to $1.19 million range saw 6.8% more sales year over year with a 25-day median DOM and homes closing at 4.6% under asking on average.
The middle of the luxury market, $1.2 million to $1.39 million, is the clear soft spot in May 2026, with a 28.2% year-over-year decline in sales despite having the lowest median DOM of any price range at just 15 days. That combination of fewer sales but faster time on market may reflect a supply issue rather than a demand issue: if homes in this range are selling quickly but there are fewer of them, constrained inventory, not weak buyer interest, is the likely explanation.
All Three Counties Sit in Buyer's Market Territory with Homes Selling Under Asking
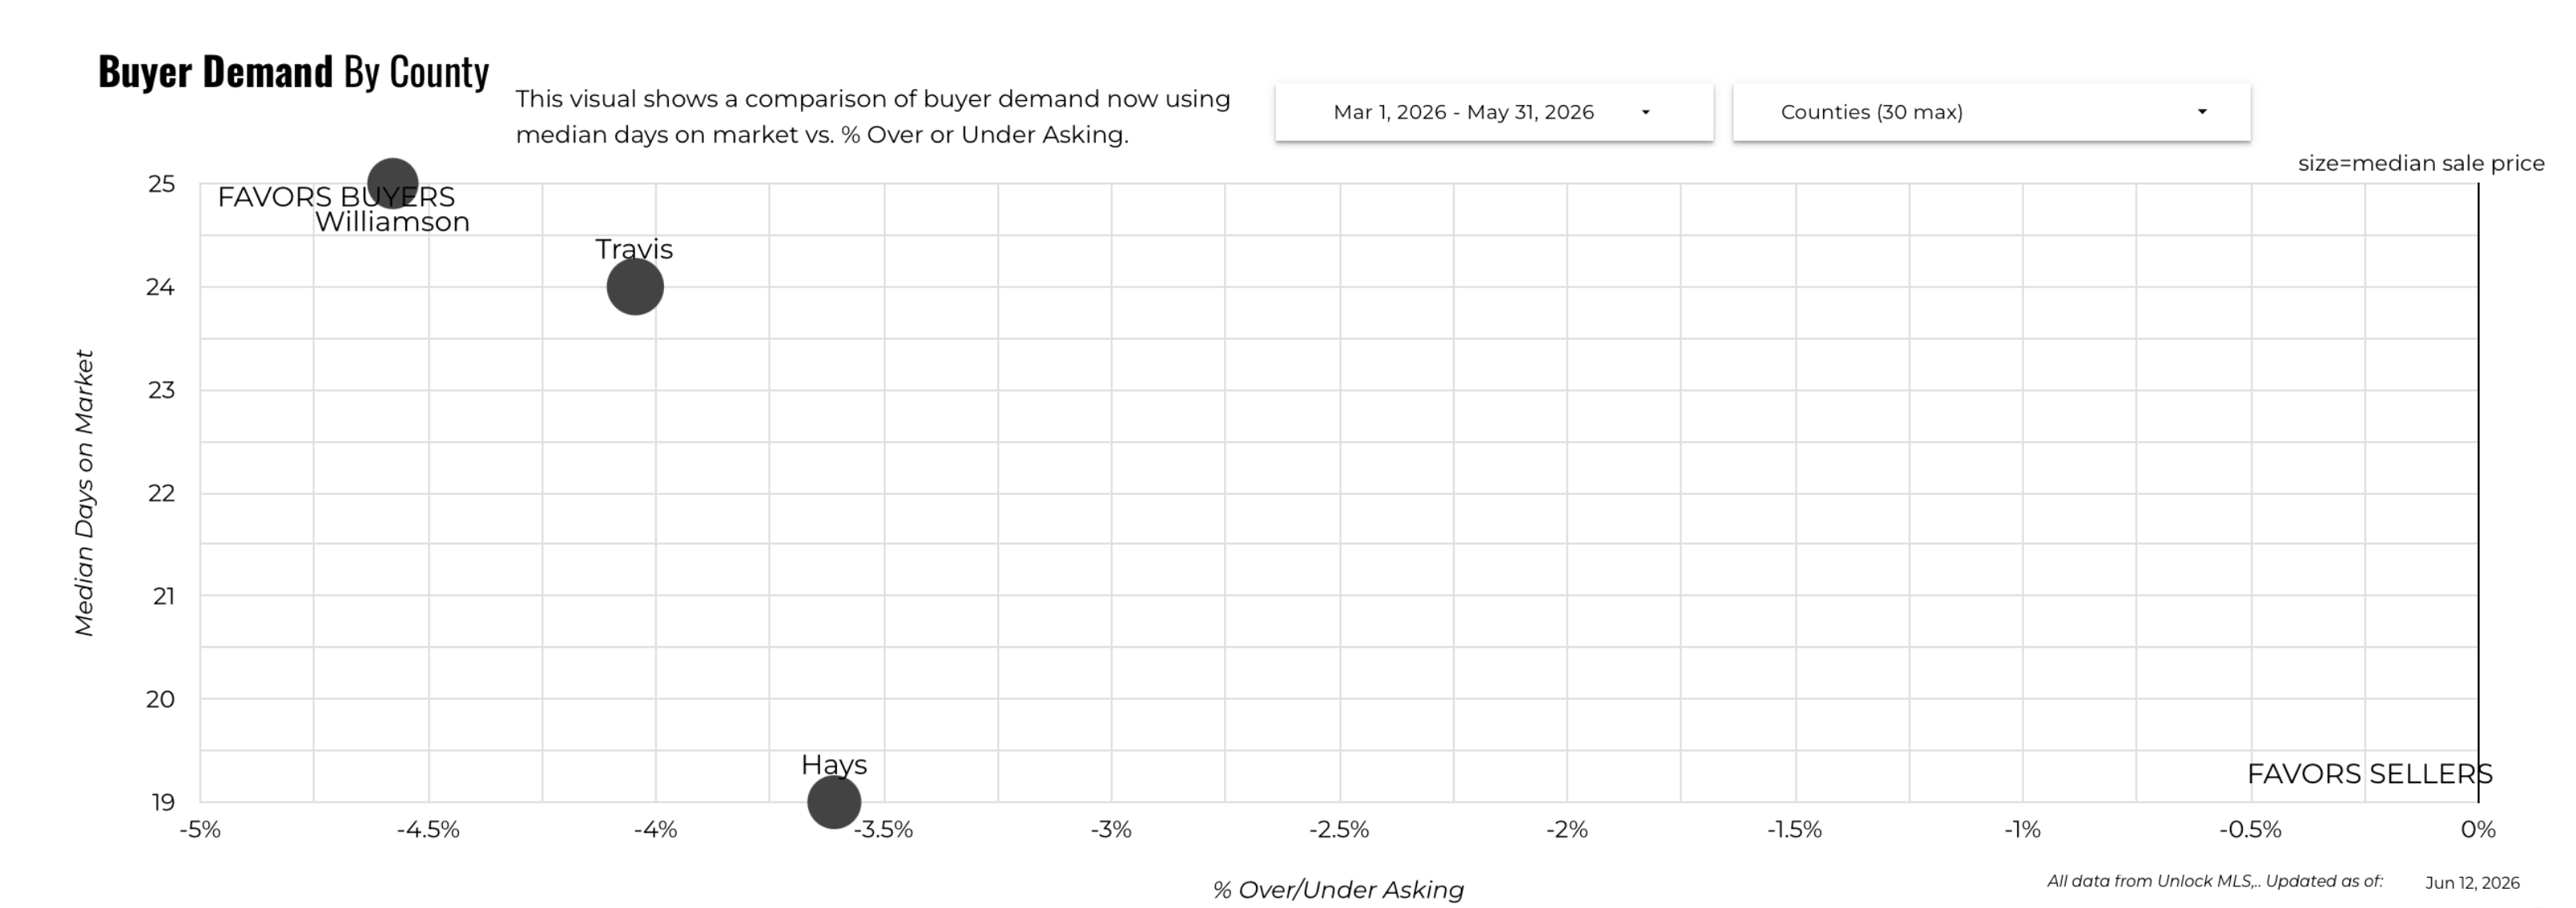
The buyer demand by county scatter plot, covering March through May 2026, places all three counties in the upper-left quadrant of the chart, the zone that favors buyers. Travis County shows a median DOM of approximately 24 days and homes selling about 4.0% under asking. Williamson County sits at roughly 25 days and 4.5% under asking. Hays County shows the tightest conditions of the three at approximately 19 days median DOM and 3.6% under asking, meaning sellers in Hays are giving up a slightly smaller discount and moving homes a bit faster.
For buyers, this county-level comparison is useful when weighing where to focus your search. If your goal is maximum negotiating leverage, Williamson County currently offers the most room relative to asking price. If your goal is a faster, more competitive process, Hays County's tighter conditions mean you should be prepared to move quickly. Travis County sits between the two in terms of negotiation dynamics, though zip code and neighborhood variation within Travis can be dramatic.
Market Temperature Trends Toward Equilibrium as Median DOM Drops to 25 Days
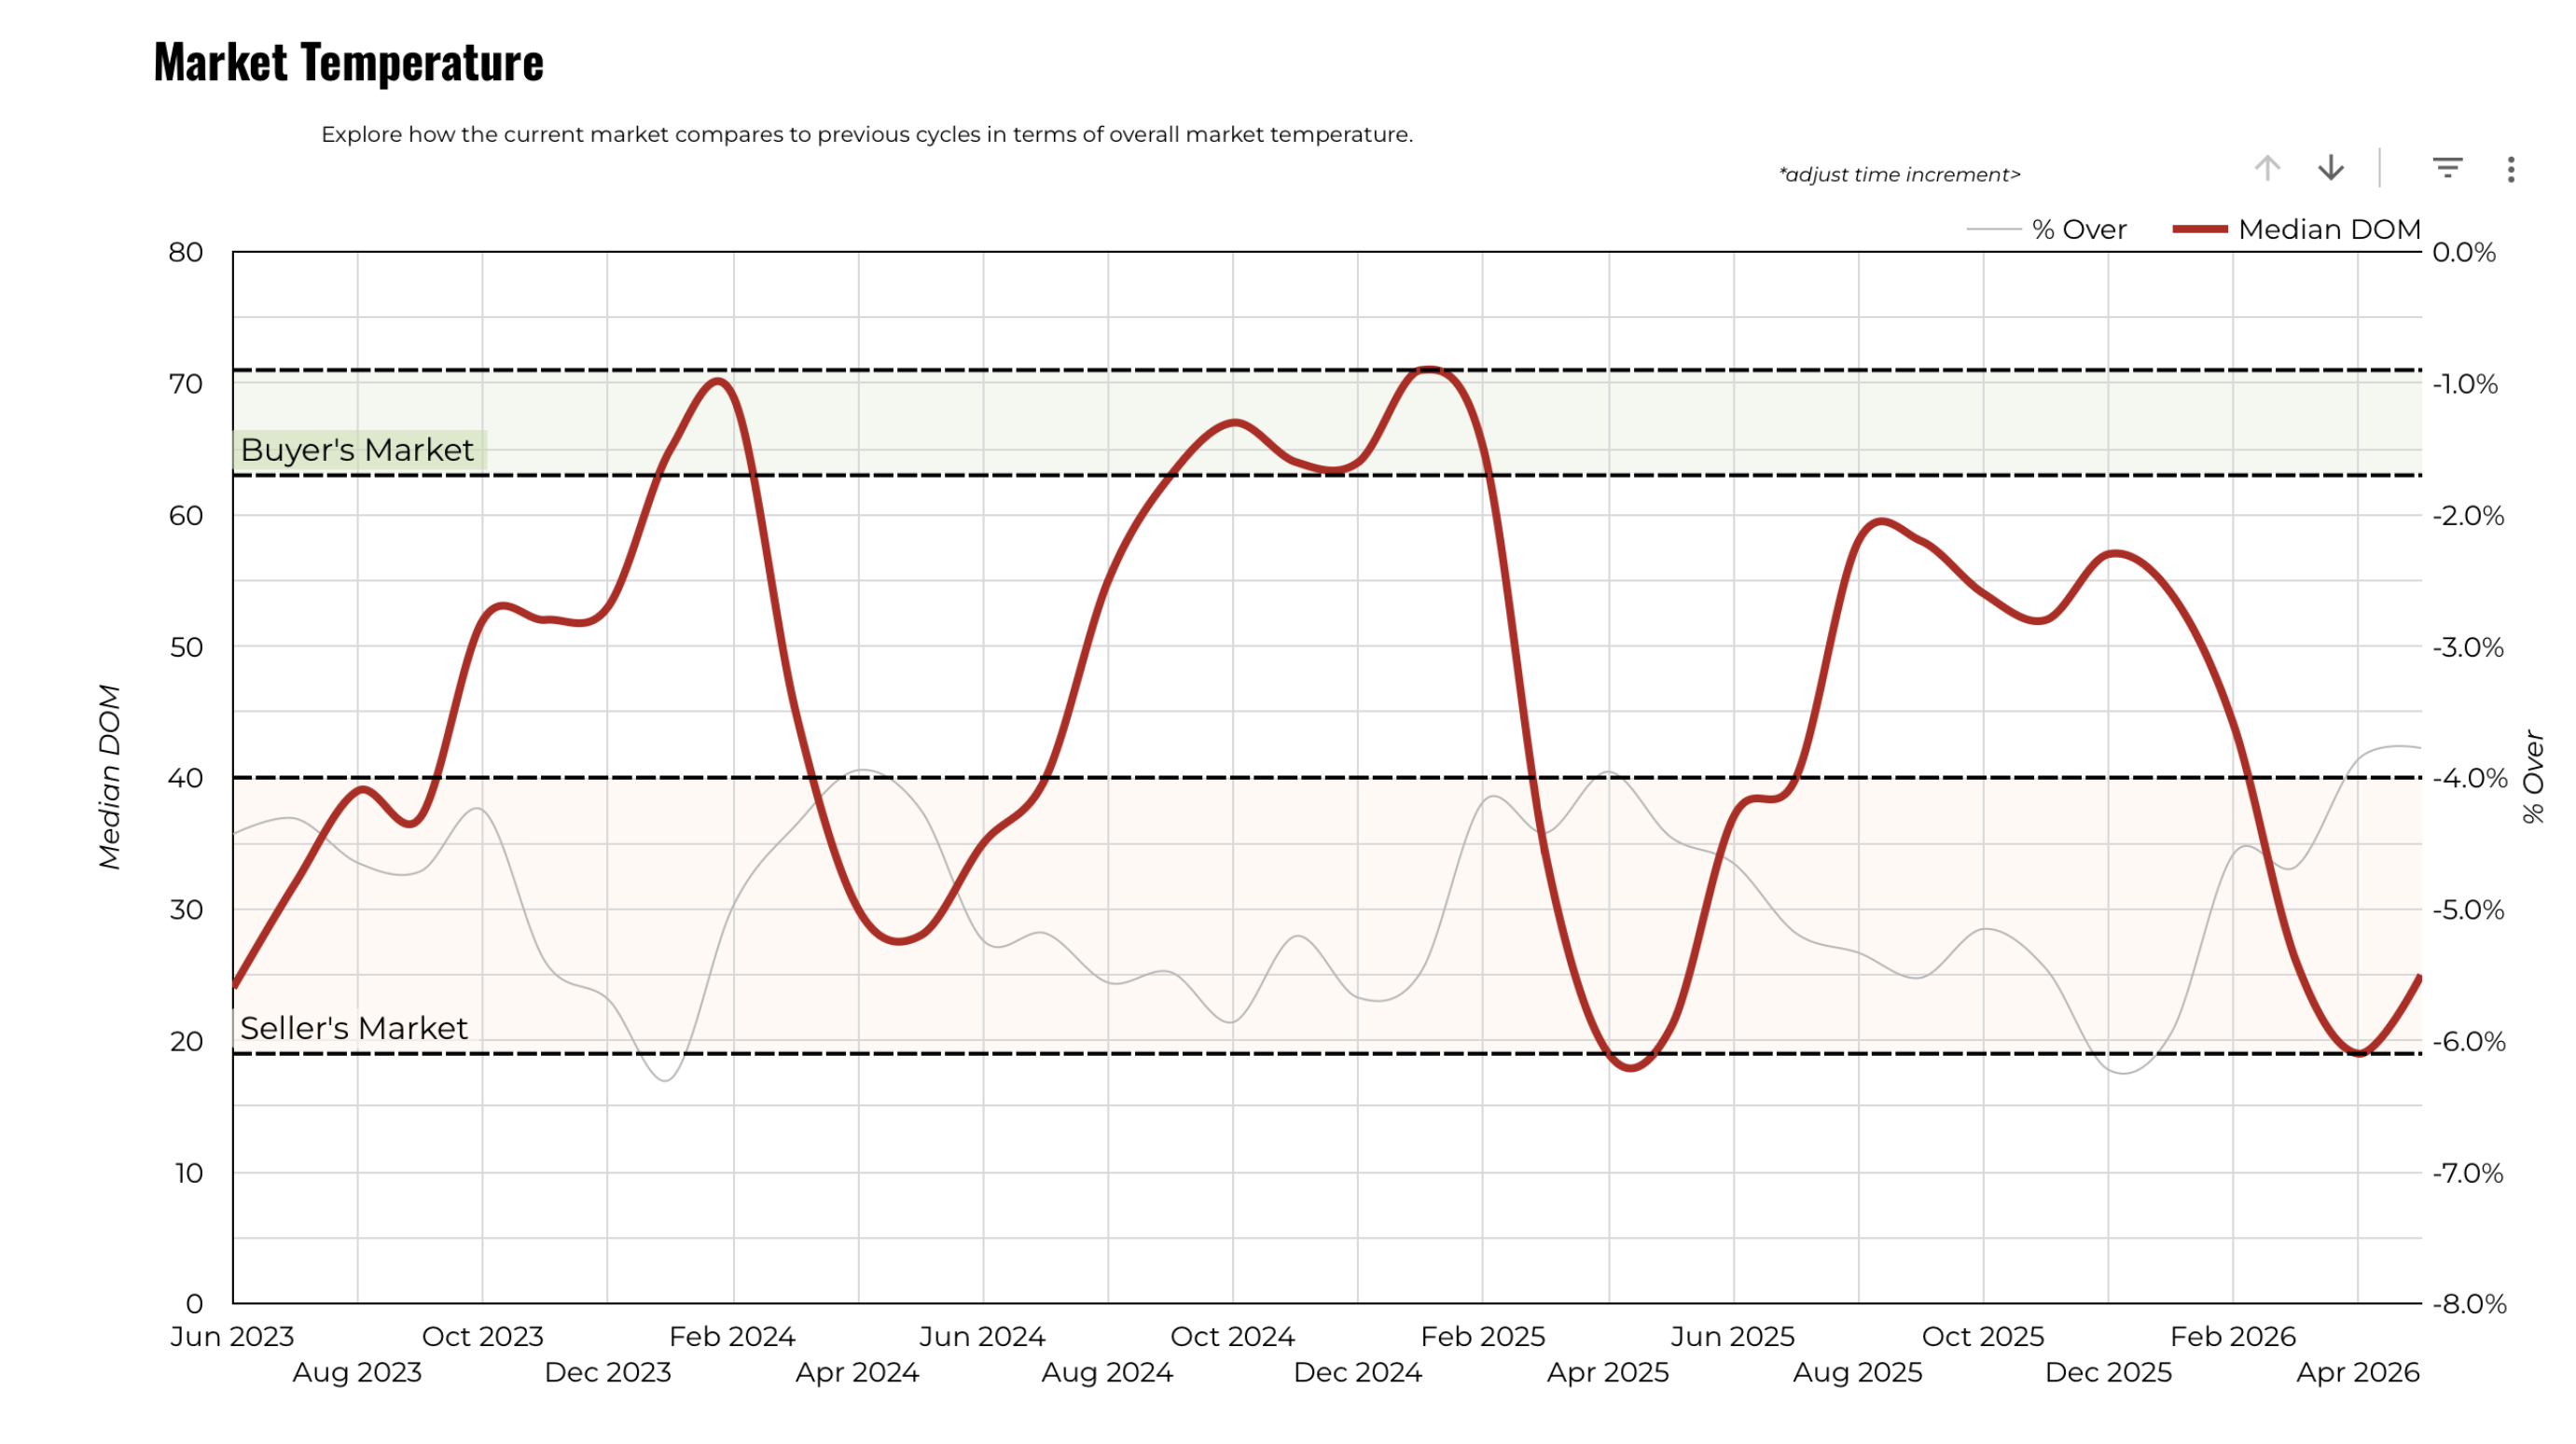
The market temperature chart plots median days on market against the percentage over or under asking price to show whether overall conditions favor buyers or sellers. As of May 2026, the market sits at a median DOM of 25 days and approximately 3.9% under asking, placing it clearly in buyer's market territory but trending toward the middle of the chart. The direction of movement over the past 12 months has been consistently downward in DOM and upward in the over/under asking percentage, both signals that the balance is slowly shifting back toward sellers.
Comparing this to the 2023 and early 2024 period, when median DOM was pushing 60 to 70 days, the improvement is substantial. The market is not yet at the seller's market threshold (generally defined as under 20 days and homes selling at or above asking), but the trajectory suggests that continued demand strength and moderating new listing supply could push it toward that zone in the coming months if current trends hold.
Where Luxury Homes Are Selling: Sales Volume and Median Price by Zip Code
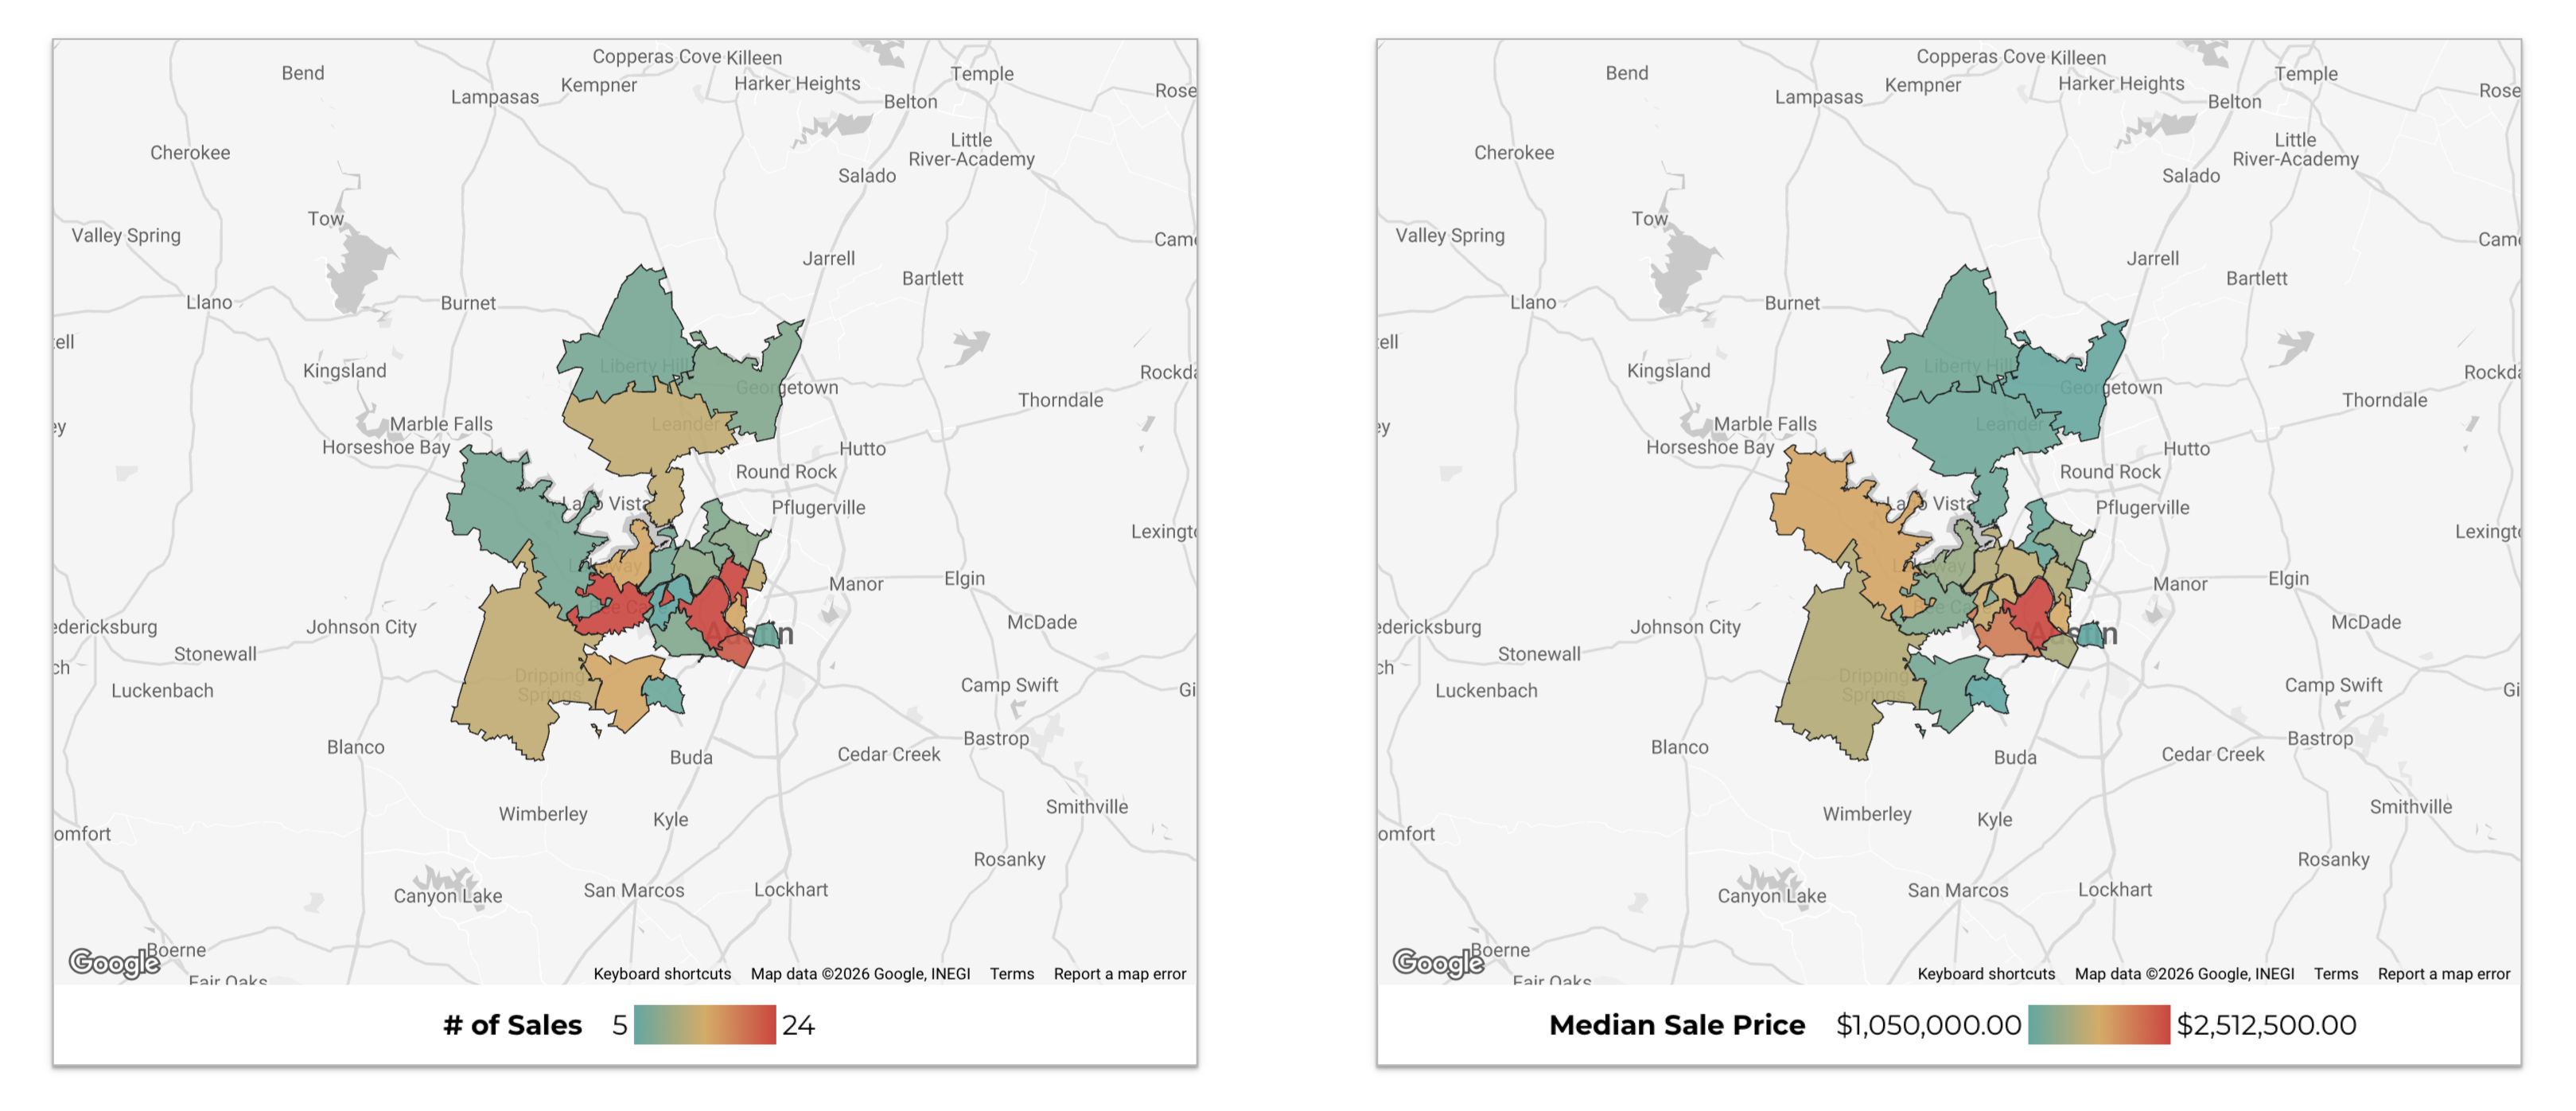
The zip code heat maps show the geographic concentration of Austin luxury sales in May 2026. On the sales volume side, the highest transaction counts, ranging from 5 to 24 or more closings per zip code, are concentrated in the central and west Austin areas, with notable activity in the Westlake/Bee Cave corridor, the north Austin zip codes near Round Rock and Cedar Park, and pockets of south Austin and Dripping Springs. Zip codes with fewer than 5 transactions are excluded to protect privacy.
The median sale price heat map tells a complementary story. The highest median prices, in the $2 million to $2.5 million-plus range, cluster in the established luxury corridors of central and west Travis County. Williamson and Hays County zip codes show lower median price levels but meaningful transaction counts, reflecting how buyers seeking more acreage, newer construction, or lower price-per-square-foot values are driving activity outside the urban core.
Median Days on Market and Negotiation Power Vary Sharply by Zip Code
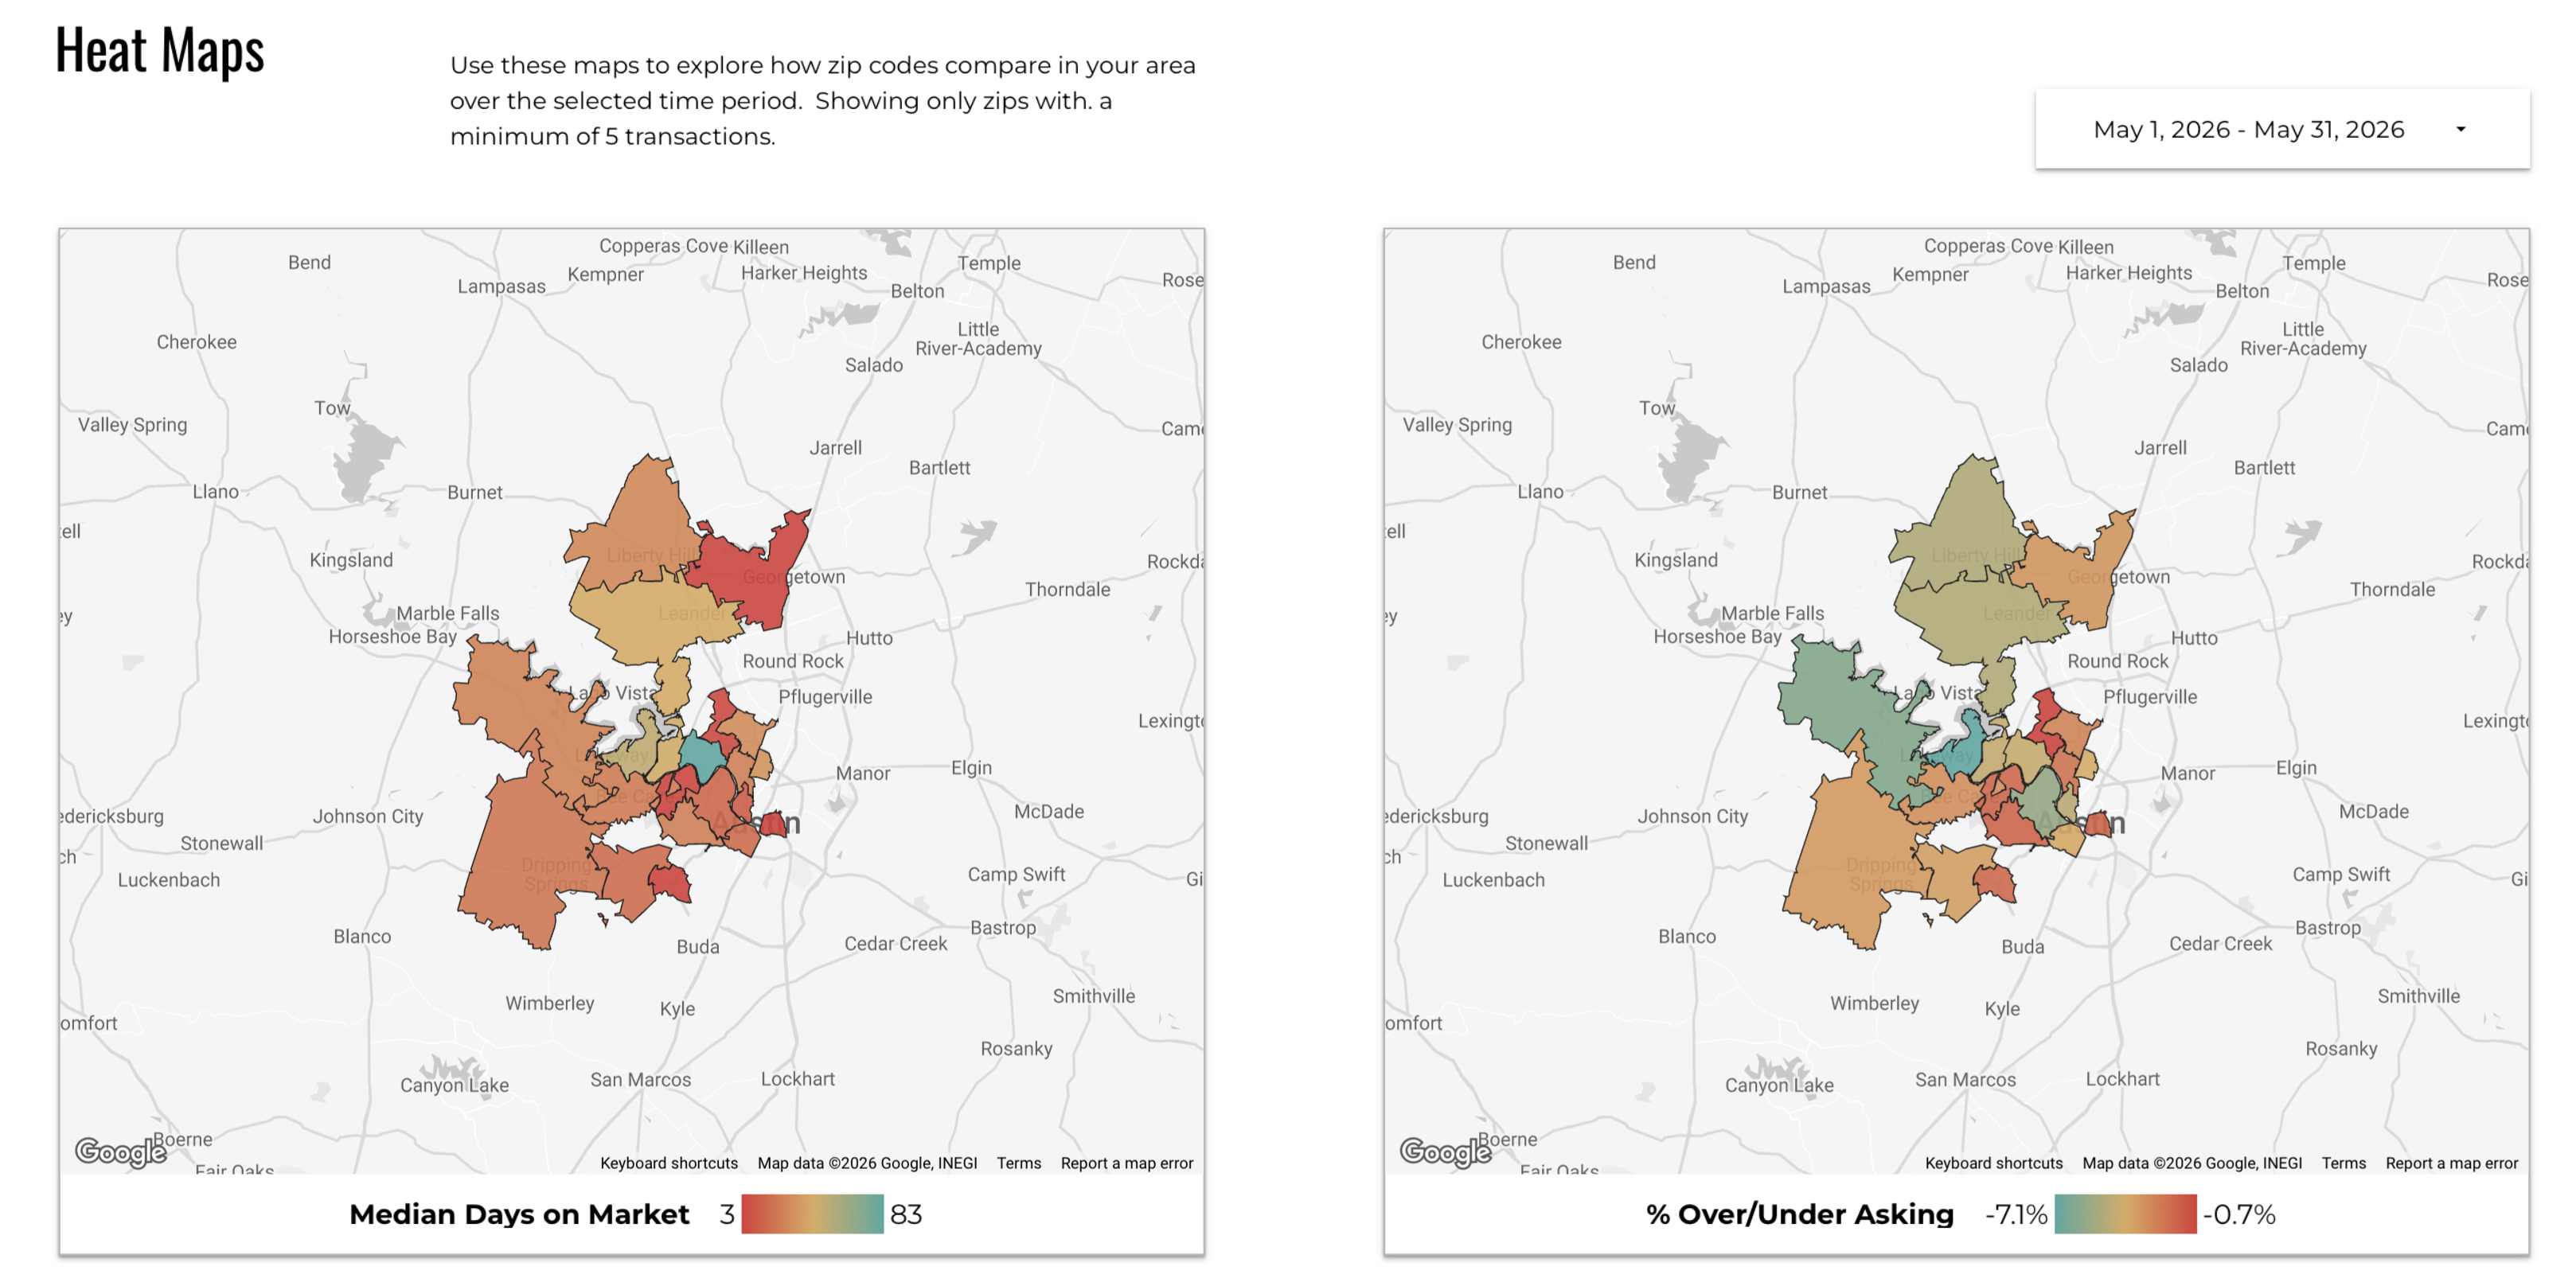
The days on market heat map shows that speed of sale varies considerably across the Austin luxury market. Some zip codes, primarily in the stronger demand corridors of Travis County, show median DOM as low as 1 to 10 days. Others, particularly in more suburban or outlying areas, show medians of 50 to 83 days. This zip-code level variation reinforces the importance of looking at hyperlocal data rather than metro-wide averages when planning a purchase or sale.
The over/under asking percentage map shows a similar range, from as much as 7.3% under asking in some zip codes to as little as 0.7% under in others. The zip codes where homes are selling closest to asking price tend to overlap with those showing the lowest days on market, which is the expected pattern in a healthy market. If you are targeting a specific zip code, understanding where it sits on both the DOM and negotiation maps will give you a clearer picture of what to expect from the process.
Travis County Luxury Homes Command a $1,445,000 Median Sale Price in 2026
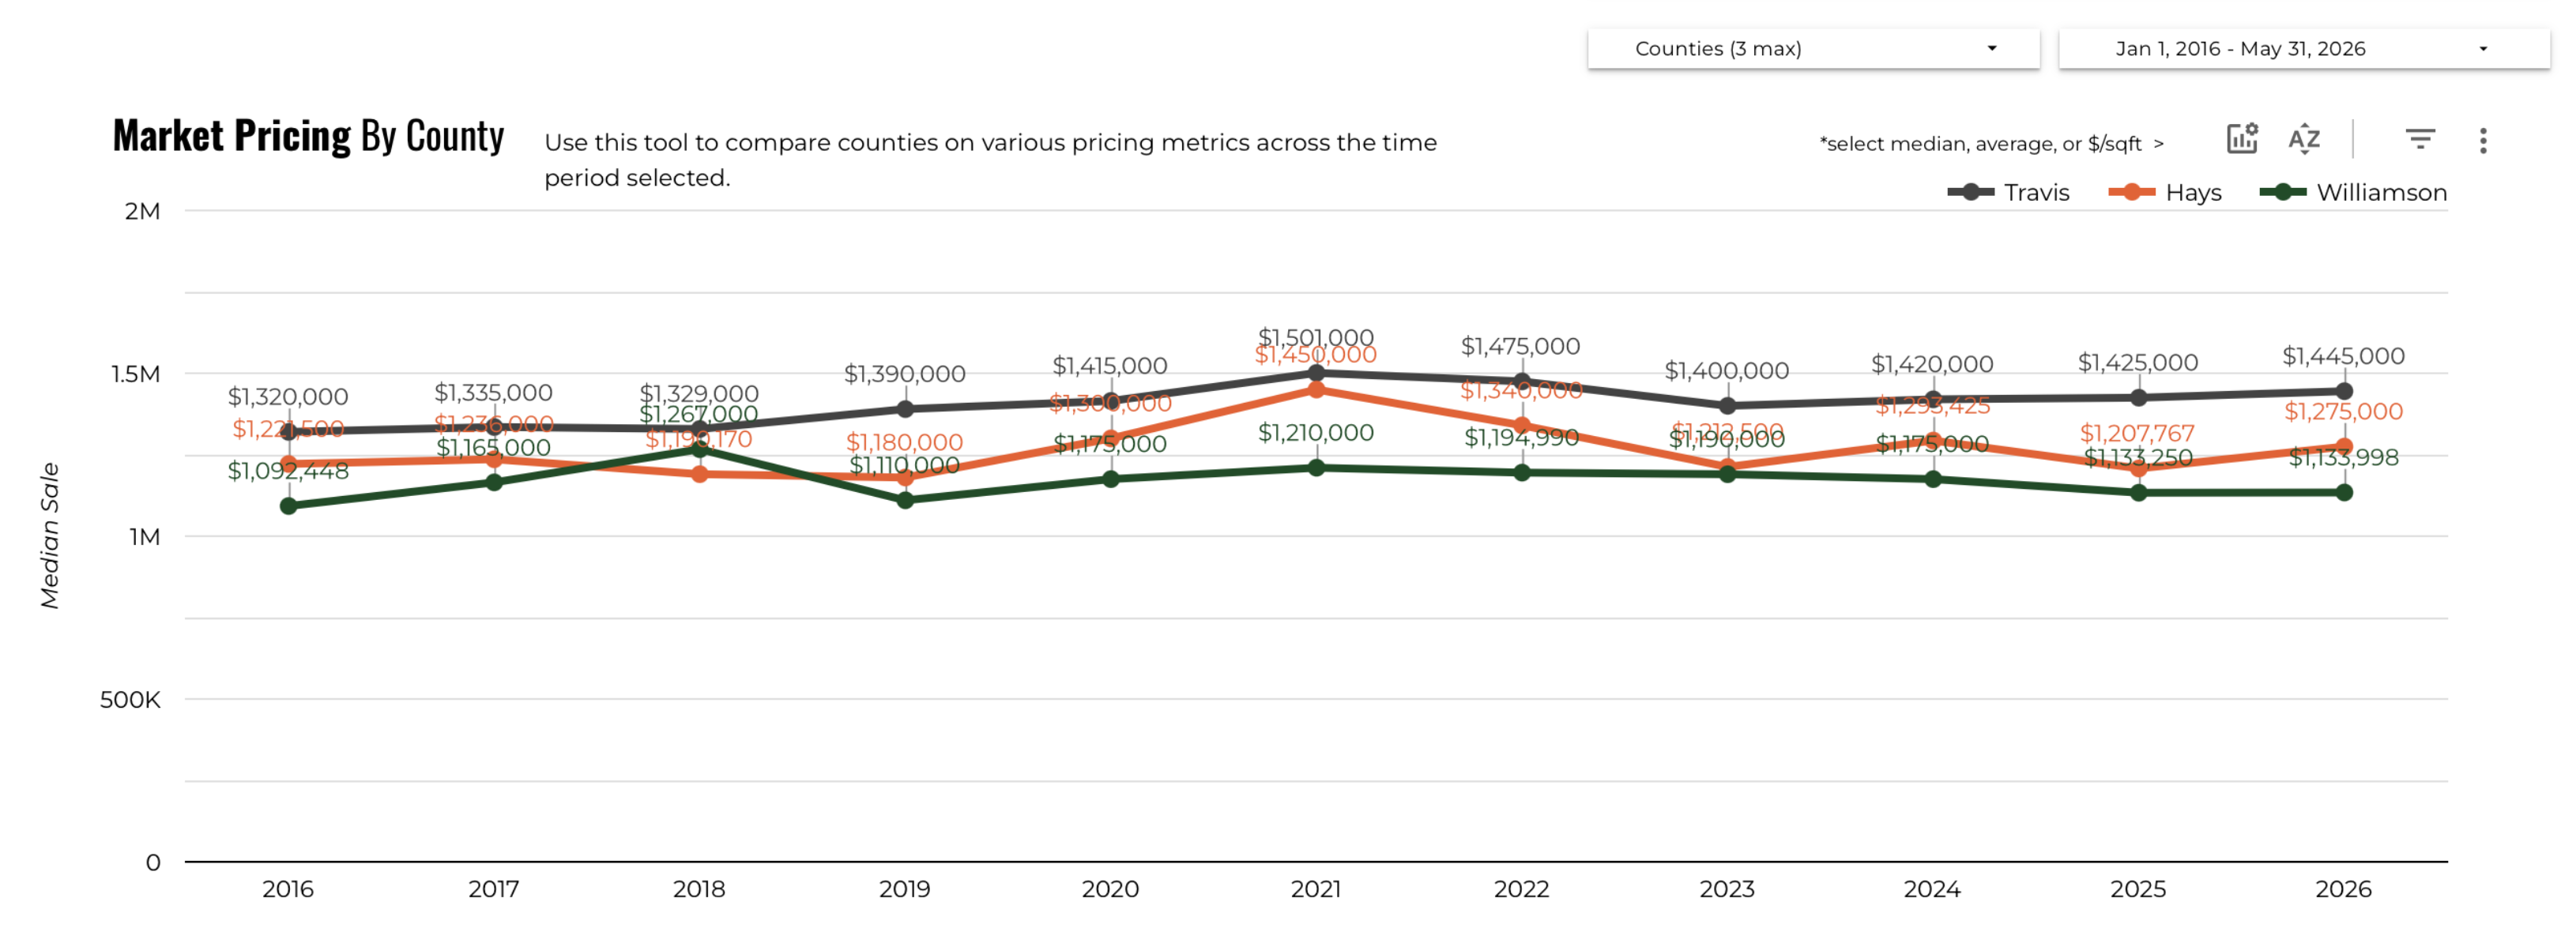
The 10-year county-level median price chart shows how each county has tracked since 2016. Travis County's 2026 median sale price for luxury homes is approximately $1,445,000, up from $1,320,000 in 2016. Hays County's 2026 median is approximately $1,275,000, up from $1,092,448 in 2016. Williamson County comes in at approximately $1,152,998 in 2026, reflecting both its lower baseline in 2016 and the nature of luxury inventory in that market, which tends toward newer construction on larger lots rather than the infill urban luxury product that drives Travis County's higher medians.
All three counties have grown their luxury medians over the 10-year window, though the path has not been linear. The 2021 to 2022 peak pushed medians in all three counties to their highest levels before pulling back in 2023 and 2024. The 2026 data for Travis County shows a recovery past those prior peaks, while Hays and Williamson remain slightly below their respective 2021 to 2022 highs. Whether this gap closes depends on how the demand driving Travis County luxury sales spreads outward over the coming months.
Travis County Median Days on Market Drops to 28 Days, Approaching Multi-Year Lows
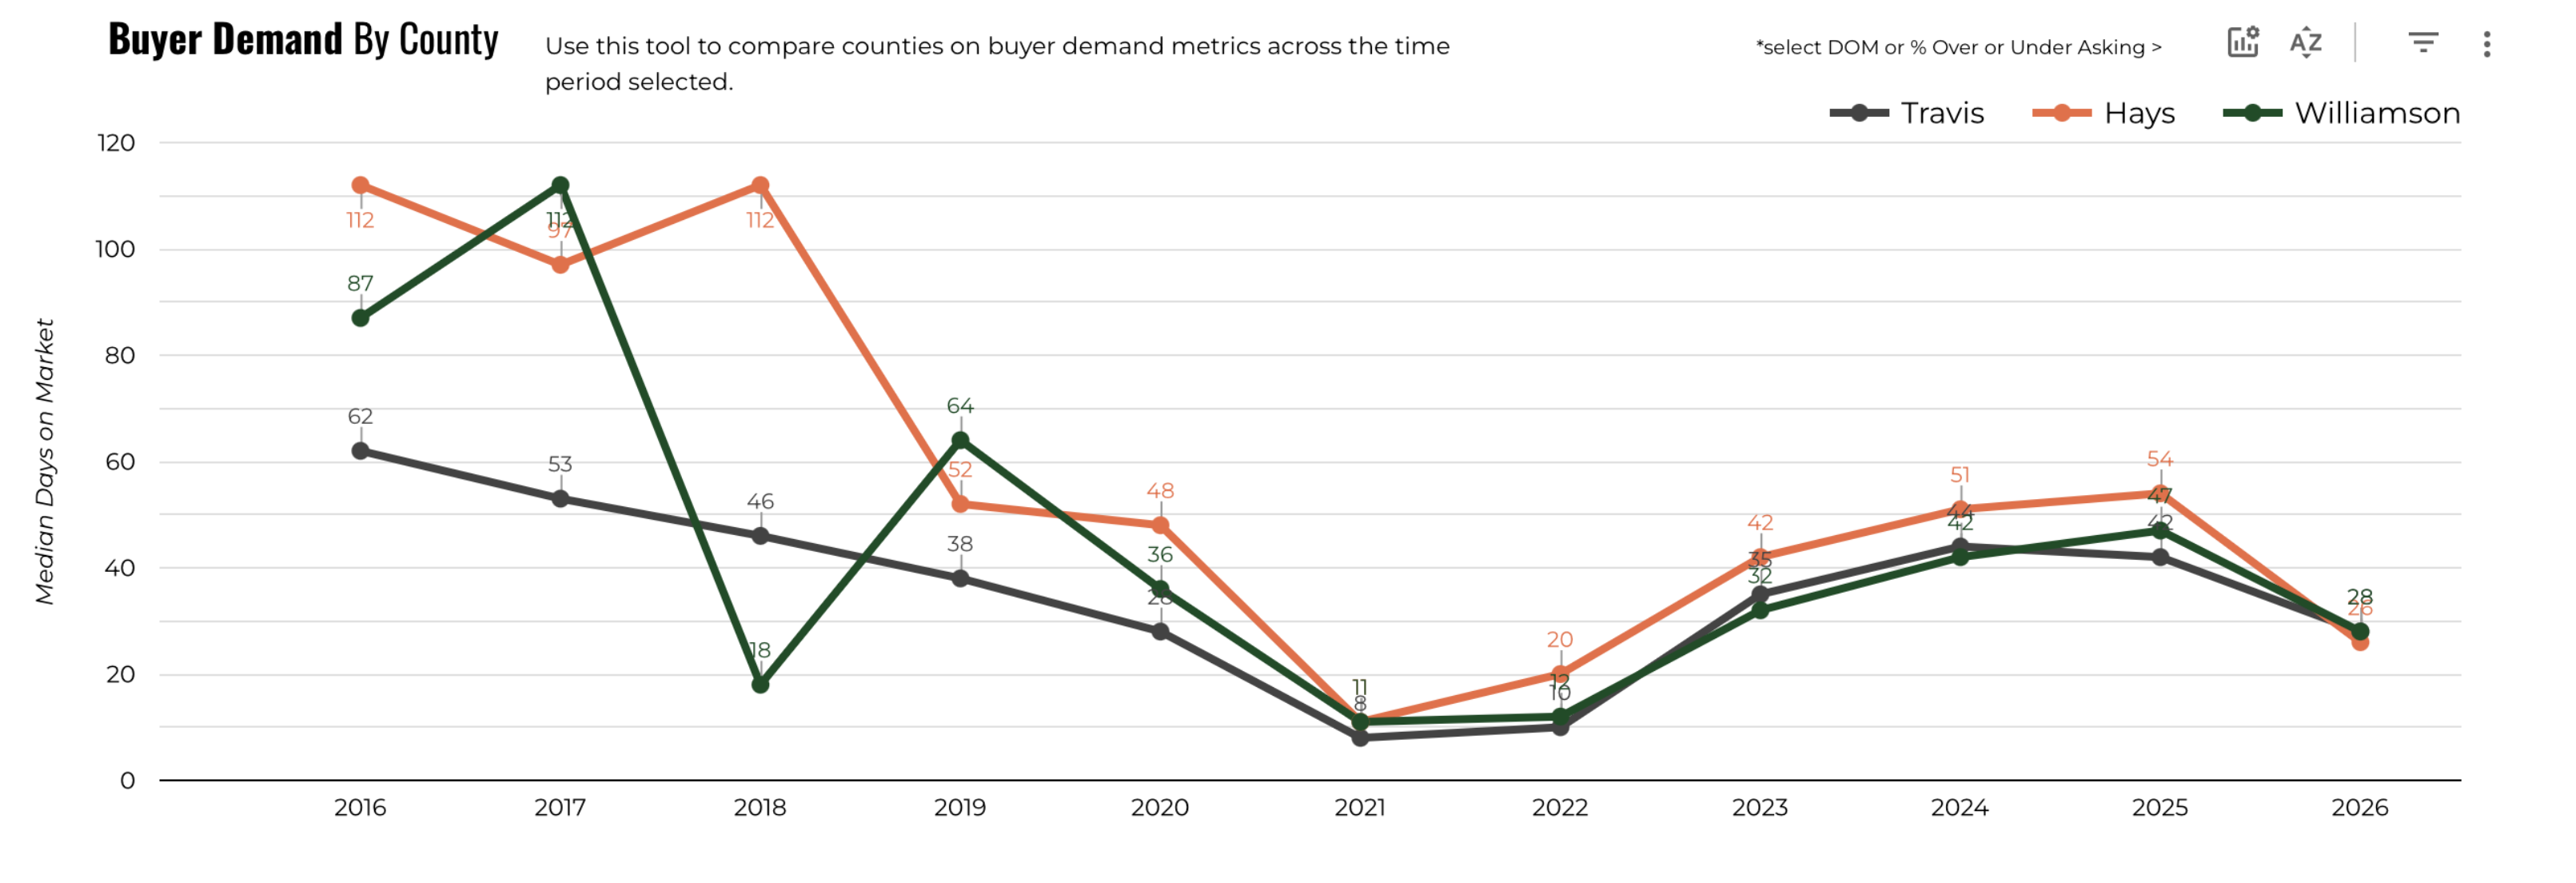
The county-level median days on market chart shows a dramatic improvement from the 2023 to 2024 peaks across all three counties. Travis County's 2026 reading sits at approximately 28 days, down sharply from a peak of 87 days in 2016 and from the elevated levels of 50-plus days seen in 2023 and 2024. Hays County and Williamson County have followed a similar trajectory, with both showing meaningful improvements in time-to-sale as buyer demand has strengthened through late 2025 and into 2026.
The long-term chart illustrates that the Austin luxury market has gone through several full cycles since 2016. Each cycle has featured a rapid tightening phase (DOM collapsing), a peak seller's market, a correction phase (DOM expanding), and a recovery. The current position, with DOM falling but not yet at the 2021 lows, places the market in the early-to-middle stage of what could be the next tightening cycle if macro conditions remain supportive.
2026 Luxury Median Outpaces 2025 and 2024 with $1.35 Million Median Sale Price
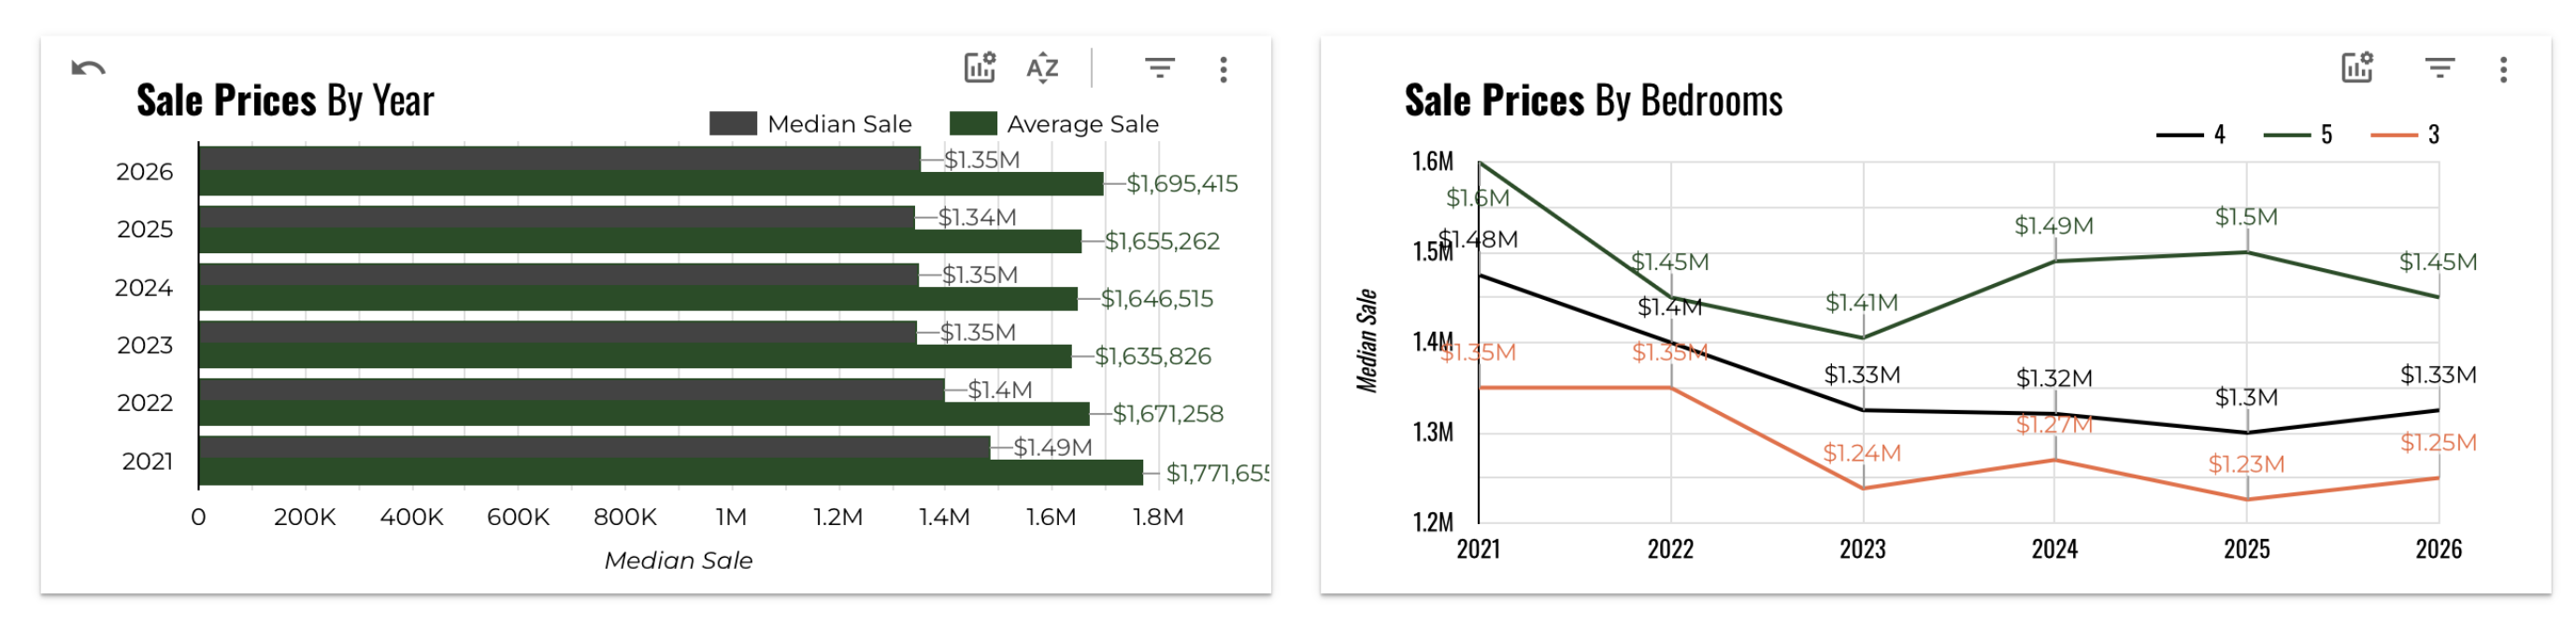
The five-year sale price comparison shows that 2026 is on track to match or exceed 2025 and 2024 on both median and average metrics. The 2026 annual median sale price is running at approximately $1.35 million, in line with 2025, while the average sale price of $1,695,415 is the highest in the five-year window. The by-bedroom breakdown shows that 4-bedroom luxury homes are the dominant segment, with a 2026 median around $1.46 million, while 5-bedroom homes are tracking near $1.5 million and 3-bedroom luxury homes sit around $1.25 million.
For buyers, the bedroom breakdown is a practical planning tool. If your search is focused on 4-bedroom homes in the $1.4 million to $1.5 million range, the data confirms that is where the market's center of gravity sits. If you are flexible on bedroom count and are targeting value within the luxury threshold, 3-bedroom luxury homes are currently pricing below the overall median, which may offer more negotiating room depending on the specific property and location.
Austin Luxury Home Sales in May 2026
Here is a breakdown of luxury home sales in May 2026:
- 1 luxury home that sold in May 2026 was a foreclosure
- 16 were waterfront homes
- 131 were in the Austin Independent School District
- 23 were in the Dripping Springs Independent School District
- 31 were in the Eanes Independent School District
- 10 were in the Georgetown Independent School District
- 3 were in the Hays Consolidated Independent School District
- 48 were in the Lake Travis Independent School District
- 34 were in the Leander Independent School District
- 13 were in the Round Rock Independent School District
- 1 was in the San Marcos Consolidated Independent School District
- 3 were in the Wimberley Independent School District
- 56 were in gated communities
- 173 had a homeowners association
- 169 had a pool
- 81 had a septic system
- 249 were in Travis County
- 31 were in Williamson County
- 32 were in Hays County
Where Did Luxury Homes Sell in May 2026?
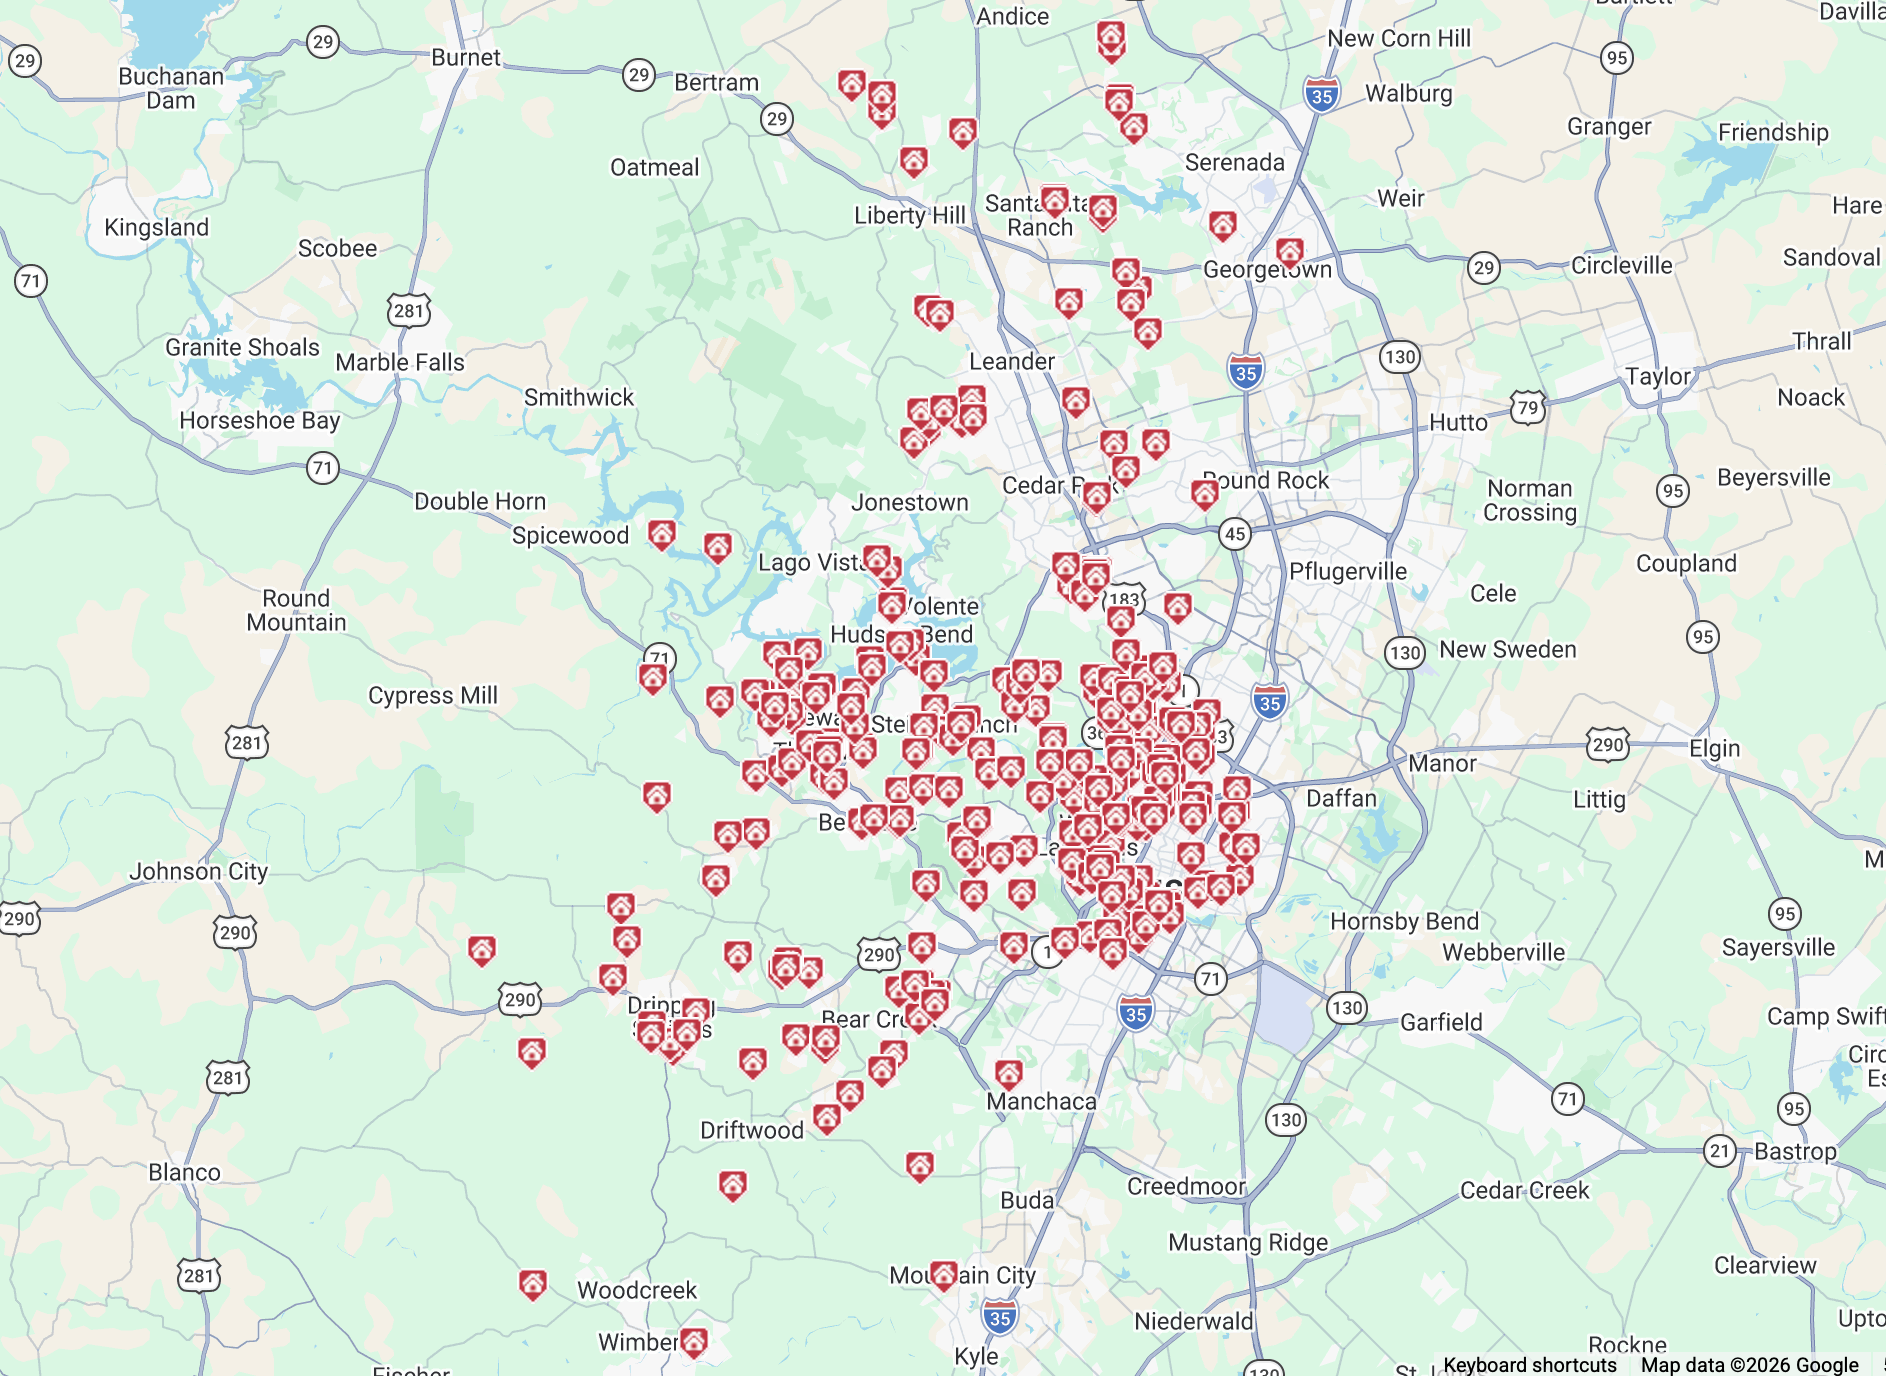
The map above shows where the 312 luxury homes that sold in May 2026 were located across Travis, Williamson, and Hays Counties. The highest concentration of sales is in the central and west Austin areas of Travis County, particularly in the Westlake/Bee Cave and central Austin corridors, as well as the northern Travis County neighborhoods near Cedar Park and Lago Vista. Sales in Williamson County are spread across the Round Rock, Georgetown, and Liberty Hill areas, while Hays County activity is distributed through Dripping Springs, Wimberley, and the communities south of Austin along the 290 and I-35 corridors.
The map illustrates the broad geographic reach of Austin luxury real estate. While Travis County accounts for the majority of closings, meaningful luxury activity is occurring across all three counties and in communities that span from the urban core to rural acreage settings 30 to 40 miles from downtown Austin. This distribution reflects the range of buyer preferences in the luxury segment, from walkable urban luxury to private hilltop estates.
May 2026 Austin Luxury Real Estate Strictly by the Numbers
The table below is pulled directly from the Unlock MLS statistics for May 2026 and covers the 312 luxury home sales (homes that sold for $1,000,000 or more) in Travis, Williamson, and Hays Counties.
| Min | Max | Avg | Median | |
|---|---|---|---|---|
| Beds | 2 | 9 | 4 | 4 |
| Baths | 2 | 9 | 4 | 4 |
| Sq Ft | 1,326 | 10,991 | 3,678 | 3,589 |
| Lot Sq Ft | -- | 3,049,200 | 61,328 | 15,756 |
| List Price | $950,000 | $8,900,000 | $1,797,524 | $1,475,000 |
| LP/Sq Ft | $202.50 | $1,674.64 | $503.82 | $457.84 |
| Acres | 0.000 | 70.000 | 1.408 | 0.362 |
| Close Price | $1,000,000 | $8,000,000 | $1,721,859 | $1,420,250 |
| CP/Sq Ft | $198.27 | $1,858.67 | $484.22 | $438.01 |
| CP/LP% | 75.00% | 117.00% | 96.32% | 97.00% |
| CP/OLP% | 62.00% | 117.00% | 93.40% | 95.00% |
| ADOM | 0 | 669 | 56 | 25 |
The most expensive luxury home that sold in May 2026 sold for $8,000,000 and the least expensive sold for $1,000,000. Homes ranged in size from 1,326 to 10,991 square feet with an average size of 3,678 square feet. The average price per square foot for a luxury home that sold in May 2026 was $484.22 with the lowest being $198.27 per square foot and the highest being $1,858.67 per square foot. It took, on average, 56 days to sell a luxury home and sellers received, on average, 93.4% of their original list prices.
The gap between CP/LP% (96.32%) and CP/OLP% (93.40%) is one of the more telling data points in this table. That 2.92 percentage point difference represents the accumulated effect of price reductions taken before going under contract. A seller who started at $2,000,000, reduced to $1,900,000 (5%), and then received 97% of that reduced price ($1,843,000) ended up at about 92.2% of their original ask, right in line with the average OLP outcome. Sellers who priced correctly from day one consistently outperform those who test the market and reduce.
The ADOM range of 0 to 669 days illustrates how different the experience can be across luxury listings. The median of 25 days is the most useful single number for planning purposes, but the average of 56 days reflects the drag of slow-moving outliers. A home sitting at 669 days on market is a fundamentally different situation from the typical May 2026 transaction, and its presence in the dataset pulls the average well above the median. If your home is approaching or past 60 days on market without a contract, it is worth reassessing your pricing and marketing strategy.
Austin Luxury Real Estate Search Criteria
The data in this report covers homes that sold for $1,000,000 or more in Travis County, Williamson County, and Hays County during May 2026. Both single-family homes and condominiums are included if they meet the price threshold.
Luxury Homes for Sale Around Austin
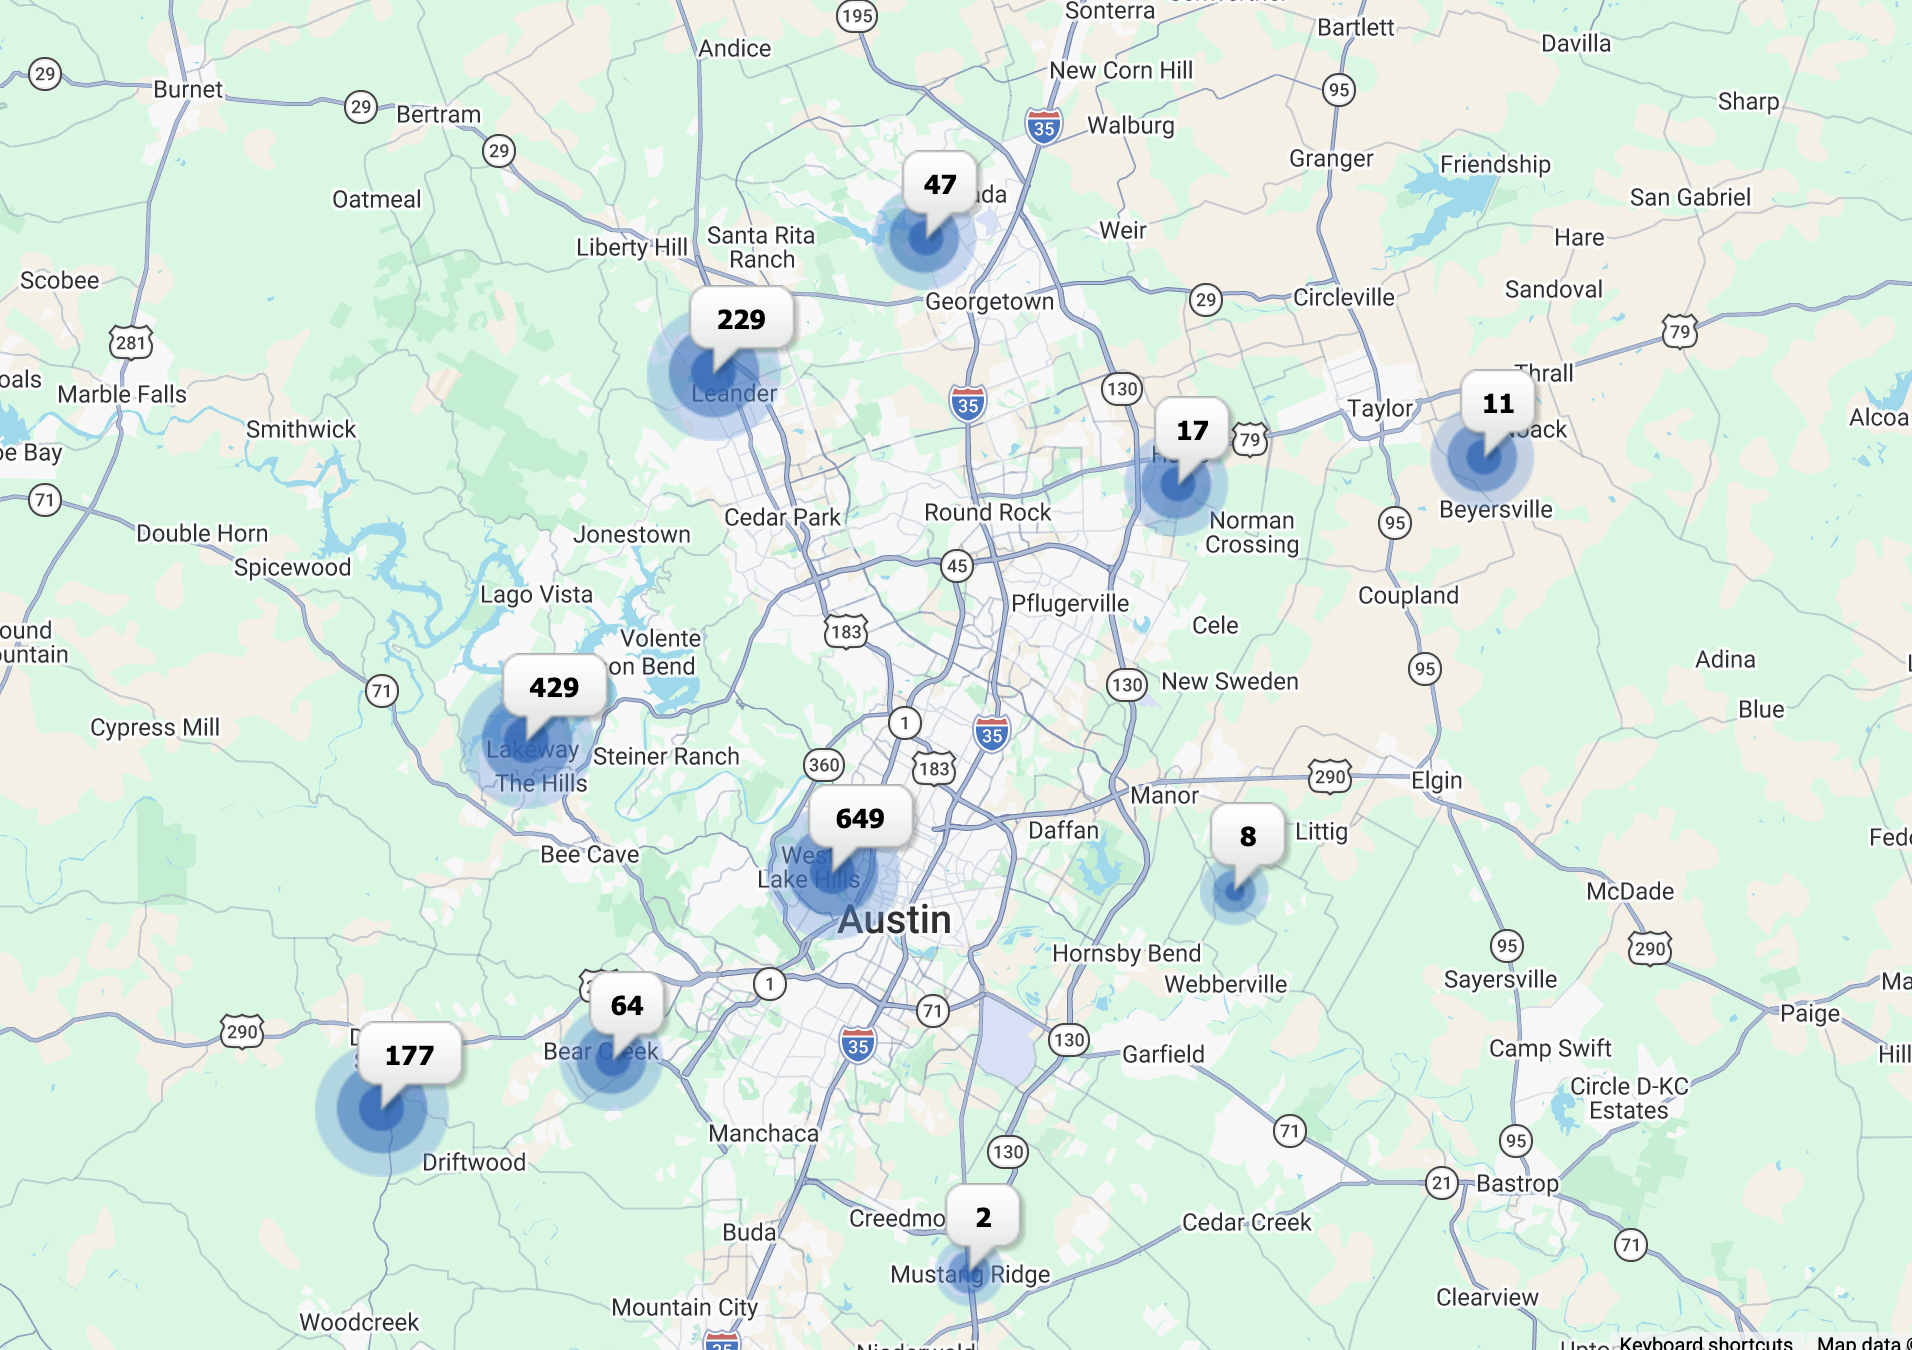
As of June 12, 2026, there are 1,694 luxury homes (priced at $1,000,000 or more) for sale in the Austin area: 1,205 in Travis County, 234 in Williamson County, and 257 in Hays County.
With 312 luxury homes closing in May 2026, the current inventory of 1,694 active listings represents approximately 5.4 months of supply at the May sales pace. That is a buyer's market by conventional definitions, though conditions vary significantly by price range and location. Buyers have meaningful choices, particularly at the $1.4 million-plus level where inventory is deepest, and well-positioned homes at any price point are still finding buyers relatively quickly when priced correctly.
Tips for Luxury Home Buyers
The May 2026 data gives buyers clear signals about where to focus your energy. With 5.2 months of overall supply and homes selling at an average of 3.9% under asking, you have real negotiating leverage, but that leverage is not uniform across all price ranges and zip codes. The $1.2 million to $1.39 million range is the tightest segment right now, with only 4.3 months of supply, while the $1.4 million-plus tier carries 5.9 months. If your target is in the $1.2 million to $1.4 million range, be prepared to move more decisively than the headline inventory numbers might suggest.
The days on market data is your best friend as a buyer in this market. The median is 25 days, but the zip code heat maps show that some areas have median DOM under 10 days while others sit above 50. Before you make an offer, know the specific DOM profile of the zip code you are targeting. In fast-moving zip codes, waiting for a price reduction is risky; in slower-moving areas, time and patience are on your side.
Pay close attention to the 49% price reduction figure in active inventory. Nearly half of all active luxury listings have already taken at least one price cut, which means nearly half of sellers have signaled a willingness to negotiate. For homes with recent price reductions, you have data that the seller is motivated, and the 14-day median from price drop to contract tells you those sellers are also getting traction. Use that information to make a well-informed offer rather than lowballing on the assumption that all reduced-price homes are desperate.
Finally, the county-level buyer demand chart shows that all three counties currently favor buyers. Hays County is the tightest of the three, with homes selling at about 3.6% under asking and a median DOM of roughly 19 days. If Hays County is your target and you find a home you love, be prepared to act within your first week of serious consideration. Williamson County currently offers the most negotiating room at about 4.5% under asking, which on a $1.5 million purchase translates to roughly $67,500 in potential savings from the initial ask.
Tips for Luxury Home Sellers
The May 2026 data delivers both encouragement and a clear warning for luxury sellers. The encouragement: prices are rising, with a 7.2% year-over-year gain in median sold price, and sales activity is accelerating, with 312 closings in May representing the strongest month in the past year. The warning: 49% of your competition has already reduced their price at least once, and those sellers who started too high lost an average of 6% from their original ask before finding a buyer. Pricing your home accurately at the start is not optional if your goal is to maximize net proceeds.
The median time to sell is 25 days. Plan your expectations and your logistics around a 3 to 5 week timeline from listing to contract if you are priced well and your home is in strong condition. Homes that are not under contract within the first 30 days will start to see increased buyer skepticism and pressure to reduce. Use the first two weeks on market as your primary feedback window: if you are getting showings but no offers, the price is likely slightly above market. If you are not getting showings, you have a pricing or marketing issue that needs to be addressed immediately.
The CP/OLP% average of 93.4% is the most important number for sellers to internalize. That means the typical luxury seller in May 2026 walked away with 6.6% less than they originally hoped. On a $2,000,000 listing, that is $132,000 left on the table relative to the original list price. Some of that gap is attributable to legitimate market dynamics, but a meaningful portion comes from overpricing at launch. The sellers who received the median CP/LP% of 97% of their final list price were generally the ones who priced close to market from the start and avoided reductions entirely.
Summer is historically a solid season for Austin luxury sales, and the rising demand signals in the May 2026 data suggest that the market has momentum going into June and July. If you are considering listing, doing so now, while buyer activity is elevated and new listing supply is moderating from the spring peak, gives you a favorable competitive environment. Sellers who wait until fall may find more competition from other listings and a buyer pool that has had more time to cherry-pick through summer inventory.
The Bottom Line on the May 2026 Austin Luxury Real Estate Market
May 2026 was the strongest month for Austin luxury real estate in the past year, and the data tells a coherent story: prices are up, sales are up, and the demand signals that predict future activity are also pointing in a positive direction. The 10.2% year-over-year gain in closings and the 7.2% gain in median sold price, happening simultaneously, is not a one-month anomaly. It reflects a market that has worked through the inventory overhang of 2023 and 2024 and is now finding its footing again.
The nuance in the May data is in the details. Median days on market is up 25% year over year, which means buyers have more time and choice than they did in the overheated 2021 to 2022 period. The average seller is still leaving a gap between their original list price and their final sale price, which means that accurate pricing matters more than optimism when you go to market. The 49% of active listings sitting with price reductions are a constant reminder that the market rewards sellers who respect current conditions, not those who test them.
For buyers, May 2026 Austin luxury is a market where patience and preparation pay off. You have inventory to choose from, real negotiating leverage in most price ranges, and data-backed tools to evaluate whether a specific home is priced correctly. The buyers who will do best are those who do the homework, understand the zip-code-level dynamics, and move decisively when the right home is in front of them.
Austin's long-term fundamentals remain compelling. The city continues to attract high-income households, the technology and business sector employment base is diverse, and the lifestyle appeal of the Austin area is well-documented. The luxury market's current trajectory, rising prices and sales alongside still-elevated inventory, is consistent with a market returning to a healthy, sustainable pace after an extraordinary period of volatility in both directions.
Thinking About Buying or Selling a Luxury Home in Austin?
If you are thinking about buying a luxury home in Austin, our Buyers page is a good place to start. If you are thinking about selling your Austin luxury home, visit our Sellers page to learn what to expect in today's market.
Questions About the May 2026 Austin Luxury Real Estate Price Report?
Have questions about what the May 2026 Austin Luxury Real Estate Price Report means for your specific situation? Reach out to Rebecca Jacks and the team at Eleven Oaks Realty. Call or text (512) 827-8323 or email info@11OaksRealty.com. We have been helping buyers and sellers since 1978 and we are here to help you make the best decision for your situation.
Data sources: Unlock MLS (direct pull), CentralTX aggregated platform. Luxury market defined as homes that sold for $1,000,000 or more in Travis County, Williamson County, and Hays County. Reported figures reflect May 1, 2026 through May 31, 2026. Some variation between data sources may exist due to differing methodology and timing of data pulls.




Leave a Reply