
Eleven Oaks Realty is proud to present their June 2026 Austin Luxury Real Estate Price Report measuring activity in the luxury home market across Travis, Williamson, and Hays Counties. For this report, luxury is defined as any home that sold for $1,000,000 or more.
June 2026 delivered a strong month for Austin luxury real estate, with 333 homes selling at a median price of $1,375,000, a figure that held exactly flat compared to June 2025 while sales volume surged 31.6% year over year. Homes moved faster as well, with the median days on market dropping from 35 days in June 2025 to just 27 days this June. This report breaks down all the key trends shaping the Austin luxury market right now, from pricing and days on market to inventory, buyer demand, and neighborhood-level heat maps.
June 2026 Austin Luxury Real Estate Market Highlights
- 333 luxury homes sold in June 2026, up 31.6% from 253 sales in June 2025 and up 7.4% from May 2026's 310 sales, making this one of the strongest months of the year.
- The median sold price came in at $1,375,000, exactly flat year over year compared to June 2025, though down 3.4% from May 2026's $1,423,118 as the market settled into its typical summer pricing range.
- Homes sold faster in June 2026, with a median of 27 days on market, down 22.9% from 35 days in June 2025 and reflecting a market where well-priced homes are going under contract at a healthy pace.
- Travis County continued to account for the majority of luxury activity, with 265 of the 333 sales, while Williamson County contributed 41 and Hays County added 27.
- With 1,670 luxury homes currently for sale and approximately 4.9 months of supply, buyers have meaningful selection, though the fastest-moving price ranges are tightening.
June 2026 Austin Luxury Real Estate Market Overview
June 2026 told a clear story in the Austin luxury market: demand is back. The combination of surging sales volume, a flat median price, and faster sell times points to a market where buyers are active and motivated, and sellers who price correctly are closing deals. The 31.6% year-over-year jump in sales is not a small blip; it represents a significant return of buyer confidence after a period of elevated caution in 2024 and early 2025. What is particularly notable is that this volume increase happened without any meaningful price appreciation, which tells you buyers are engaged but still price-sensitive.
The 27-day median time to sell confirms the pickup in pace. In June 2025, luxury sellers were waiting an average of 35 days for a contract. This June they waited just 27 days, a 22.9% improvement. That said, the average days on market of 52 days (from the full MLS statistics) is a reminder that some properties, particularly those at higher price points or with positioning challenges, still spend considerable time on the market. The wide range from 0 days to 896 days captures just how varied luxury buyer decision timelines can be.
A note on data sources: this report draws from two sources, Rebecca's direct Unlock MLS pull and the CentralTX aggregated platform, which may show slightly different transaction counts due to timing and methodology. Body text and narratives in this report reflect 333 sales from the direct MLS pull; chart images may reflect 326 sales from the aggregated platform. Both sources confirm the same overall market direction.
June 2026 Austin Luxury Real Estate Price and Negotiation Trends
Luxury buyers in June 2026 were closing at 97.00% of the last list price on a median basis, which tells you the final negotiation gap between buyer and seller was modest. However, the more revealing figure is the median close price to original list price ratio of 95.00%, meaning sellers who made price adjustments along the way ended up accepting 5% less than what they originally asked. On average, that gap was even wider, with sellers receiving 94.38% of their original list prices.
This pattern plays out consistently across price ranges. The $1.2M to $1.39M segment saw the tightest negotiating environment, with a median of just 15 days on market and buyers paying within about 2.2% of asking. The $1.4M and above tier took longer at a median of 33 days and saw buyers landing about 3.03% below asking. If you are a seller, the takeaway is clear: pricing right from day one matters. Homes that need to reduce their price before going under contract are averaging an 8% reduction from that adjusted price, and 49% of currently active listings have already taken at least one price cut.
For buyers, the negotiation opportunity is real, particularly at the higher end of the luxury spectrum. The spread between original list price and close price has narrowed compared to 2024 and early 2025, but there is still room to work. Understanding which zip codes and price bands are moving fastest, as shown in the charts below, can help you calibrate your offer strategy.
Median Sold Price Essentially Unchanged Year Over Year
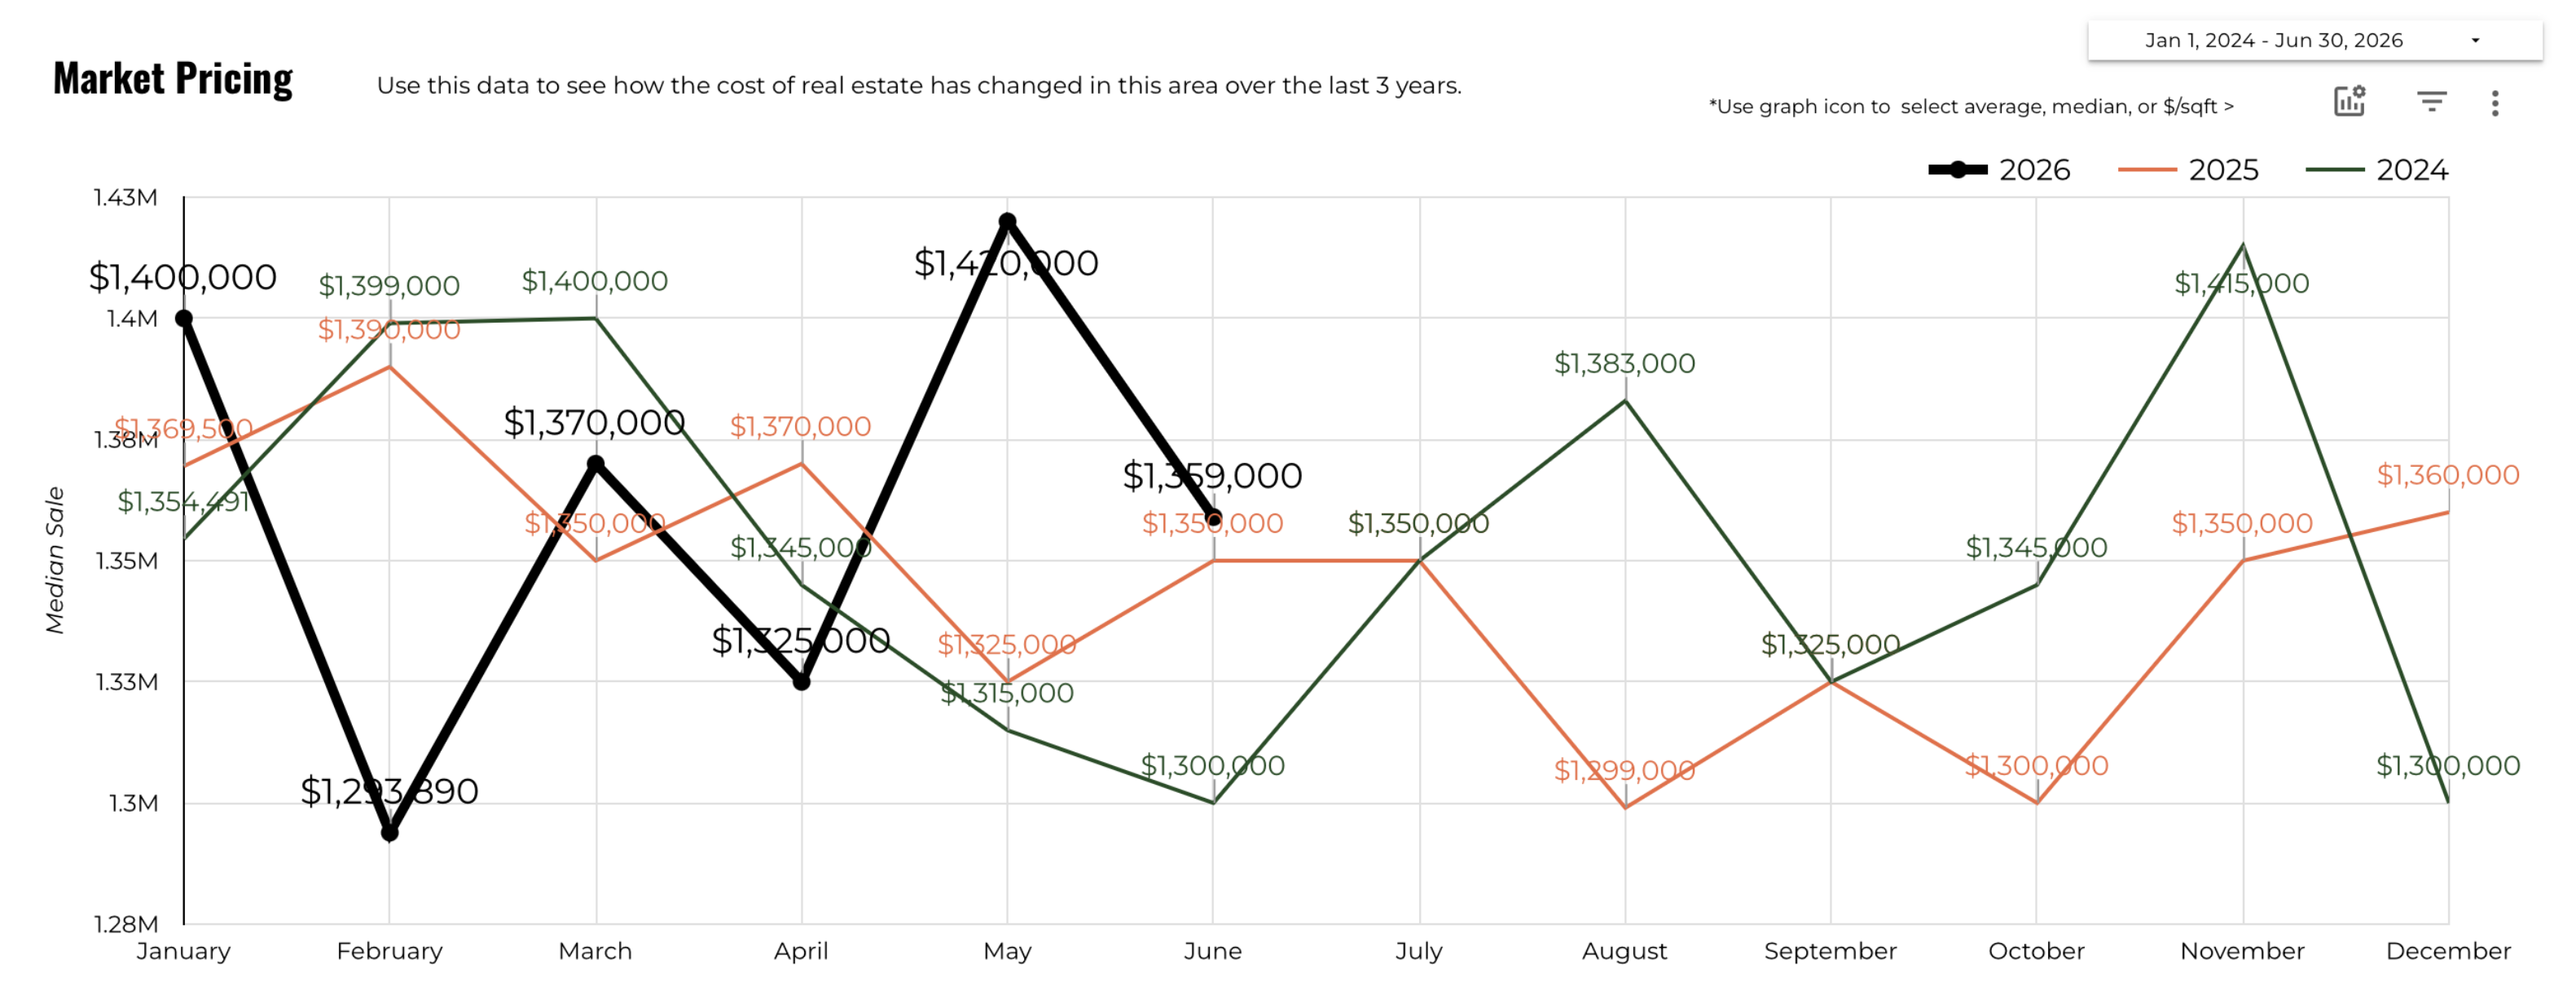
The median sold price for Austin luxury homes in June 2026 was $1,375,000, flat compared to $1,375,000 in June 2025 and down 3.4% from May 2026's $1,423,118.
Price stability at this level, after the volatility of 2021 through 2023, is actually a sign of a maturing and healthier market. The 3-year pricing chart shows the median sale price oscillating in a relatively tight band between roughly $1,293,000 and $1,420,000 over the past 18 months, without the dramatic swings seen during the pandemic peak years. June 2026's $1,375,000 sits comfortably in the middle of that range.
The month-over-month dip from May's $1,423,118 is worth putting in context. May frequently produces elevated pricing as spring demand peaks; a moderation in June is part of the seasonal rhythm of the Austin luxury market. Looking at the same period in prior years, June pricing tends to settle slightly below May. This is not a signal of weakness; it is a normal seasonal pattern in a market where 333 homes just transacted.
For buyers, a flat year-over-year price means you are not losing ground to appreciation right now, which reduces urgency somewhat. For sellers, the same data suggests that pricing at or very close to market value from the start is critical, since the overall price environment is not generating the kind of momentum that would bail out an overpriced listing.
Number of Luxury Home Sales Up 31.6% Year Over Year
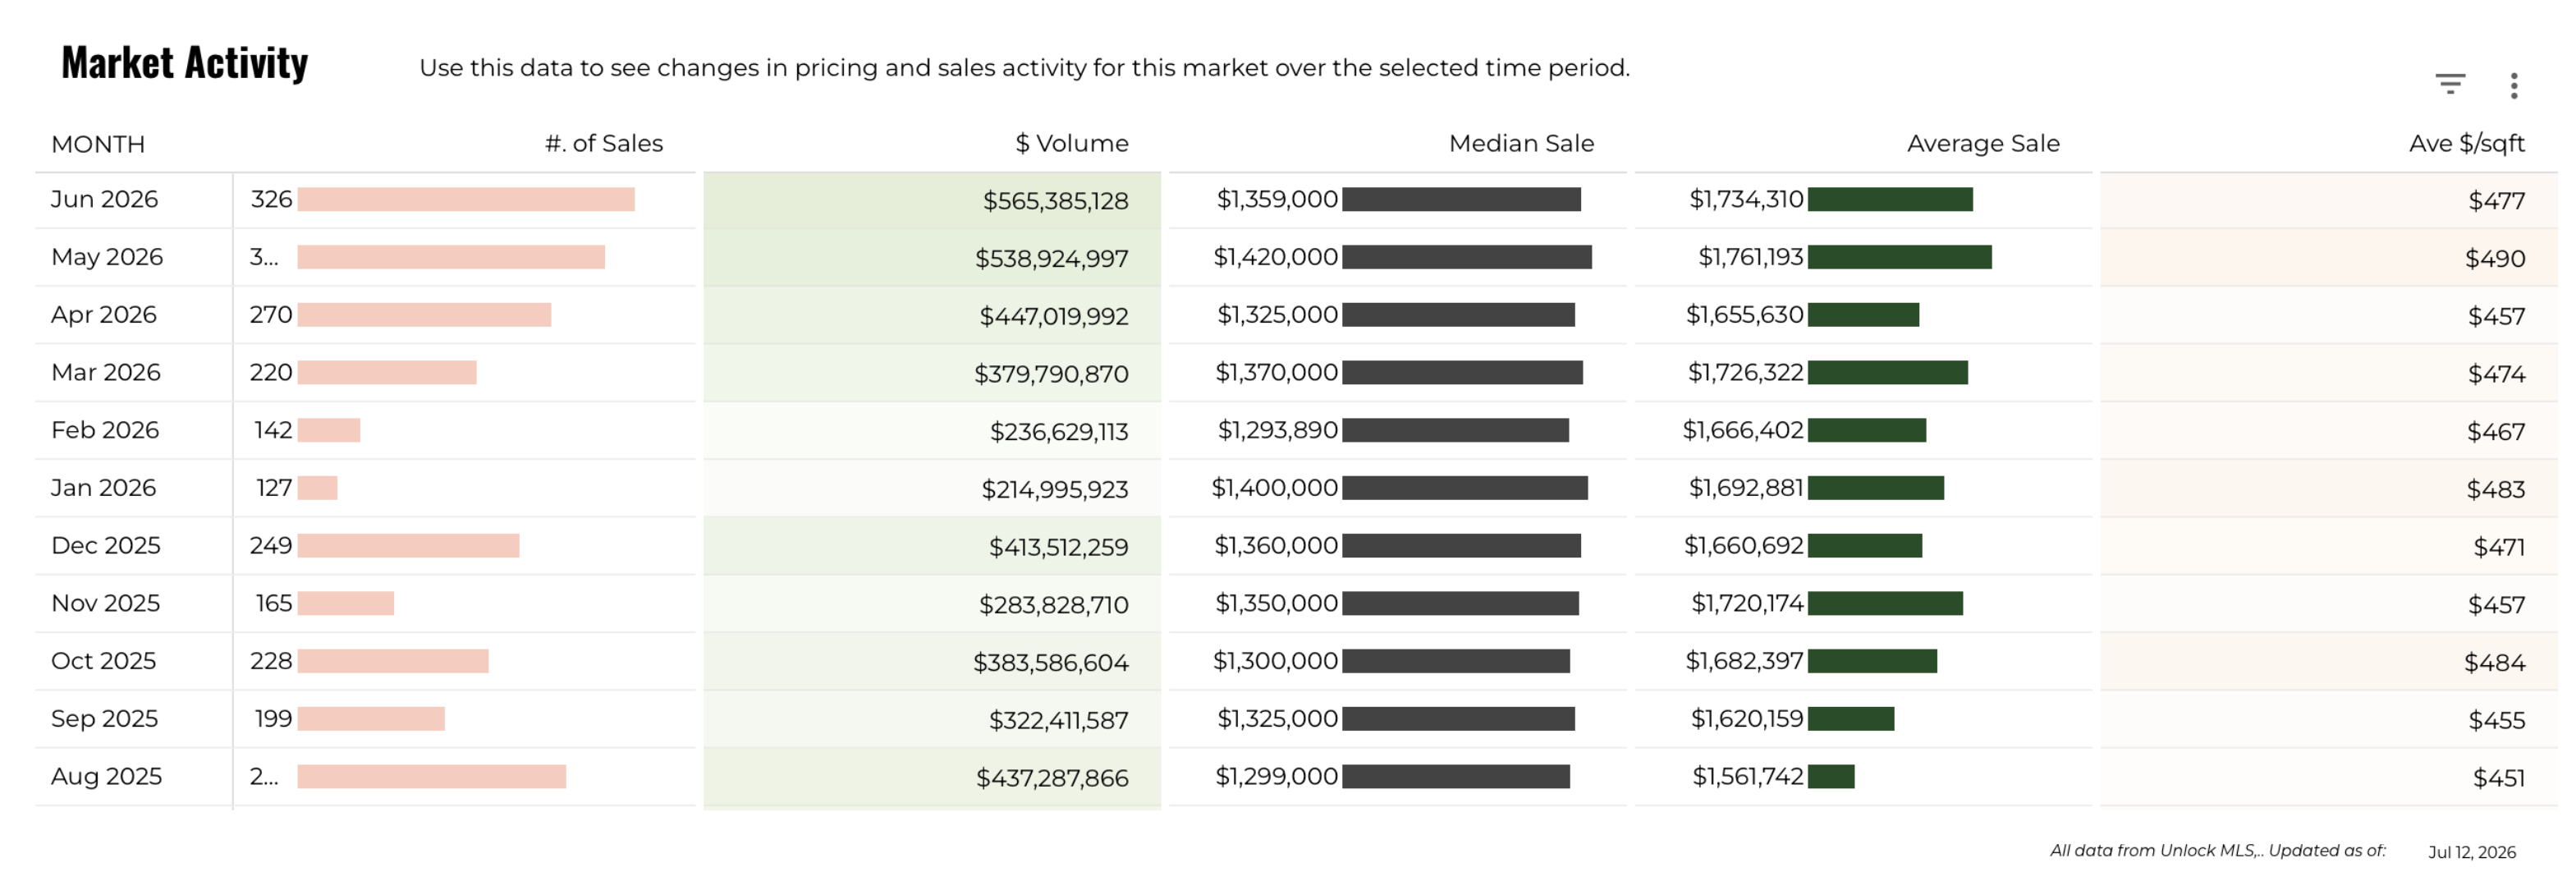
333 luxury homes sold in June 2026, up 31.6% from 253 in June 2025 and up 7.4% from 310 in May 2026.
This is a substantial year-over-year gain and one of the most significant data points in this report. In June 2025, the market was still working through a period of buyer hesitation tied to elevated interest rates and pricing uncertainty. This June, buyers came back in force. A 31.6% increase in closed transactions does not happen without real activity across the entire price spectrum, and the breakdown confirms that: the $1.4M and above tier accounted for 151 of the sales (from the CentralTX data), with the entry-level luxury range of $1M to $1.19M contributing 91 closings and the $1.2M to $1.39M band adding 76 more.
The market activity chart shows total sales volume for June 2026 reaching $565,385,128, up from the prior year. The average sale price came in at $1,748,669, which is above the median of $1,375,000 and reflects the influence of several high-end closings, including the top sale of $8,520,000. That gap between median and average is a normal feature of the luxury market, where a handful of exceptional properties can move the average meaningfully.
The month-over-month trend is equally encouraging. May 2026 produced 310 closings and June added 333, continuing a pattern of year-over-year growth through the spring selling season. New under contracts for June came in at 262, which suggests July closings will remain solid even if they step back slightly from June's pace.
Median Time to Sell Down 22.9% Year Over Year
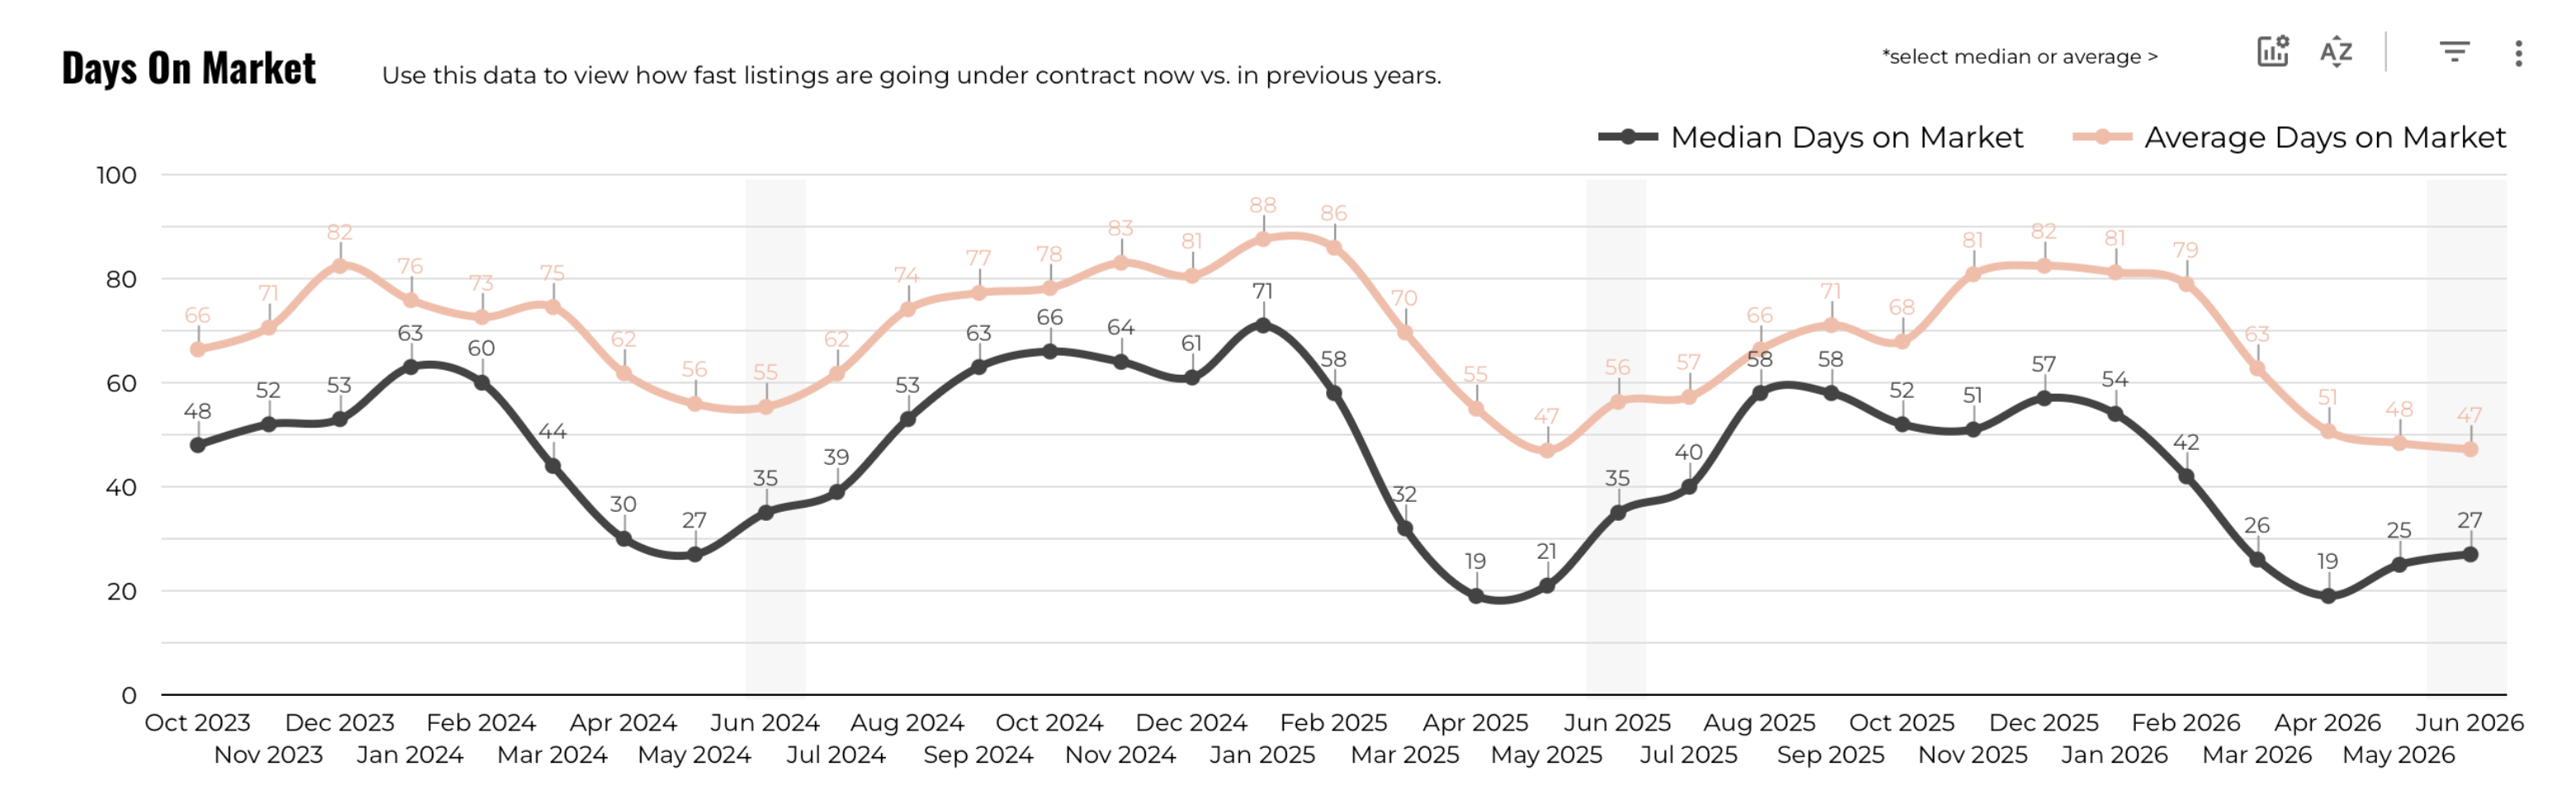
The median time to sell a luxury home in Austin in June 2026 was 27 days, down 22.9% from 35 days in June 2025 and up slightly from May 2026's 25 days.
Fewer days on market is generally good news for sellers, and this trend has been building for several months. The days on market chart shows the median dropping sharply from the highs of late 2024 and early 2025, when luxury homes were sitting for 58 to 71 days before going under contract. The move from 35 days in June 2025 to 27 days this June represents meaningful improvement and reflects the increased buyer activity described in the sales volume section above.
The average days on market of 52 tells a slightly different story. That 25-day spread between the median and average signals a two-speed market: well-priced, well-presented homes are going under contract in under a month, while others are sitting significantly longer and pulling the average up. The single longest sale in the dataset took 896 days to close, a reminder that outlier situations do exist in a market this large and price-diverse.
For sellers, 27 median days is an encouraging benchmark, but it is not a green light to overprice and wait. The data on price drops shows that 49% of currently active listings have already reduced their price, with sellers typically waiting about 21 days before making that first cut. A home that enters the market correctly priced has a much better chance of landing in the 27-day category than the 52-day one.
Austin Luxury Sales by Price Range: The $1.4M and Above Tier Leads Volume
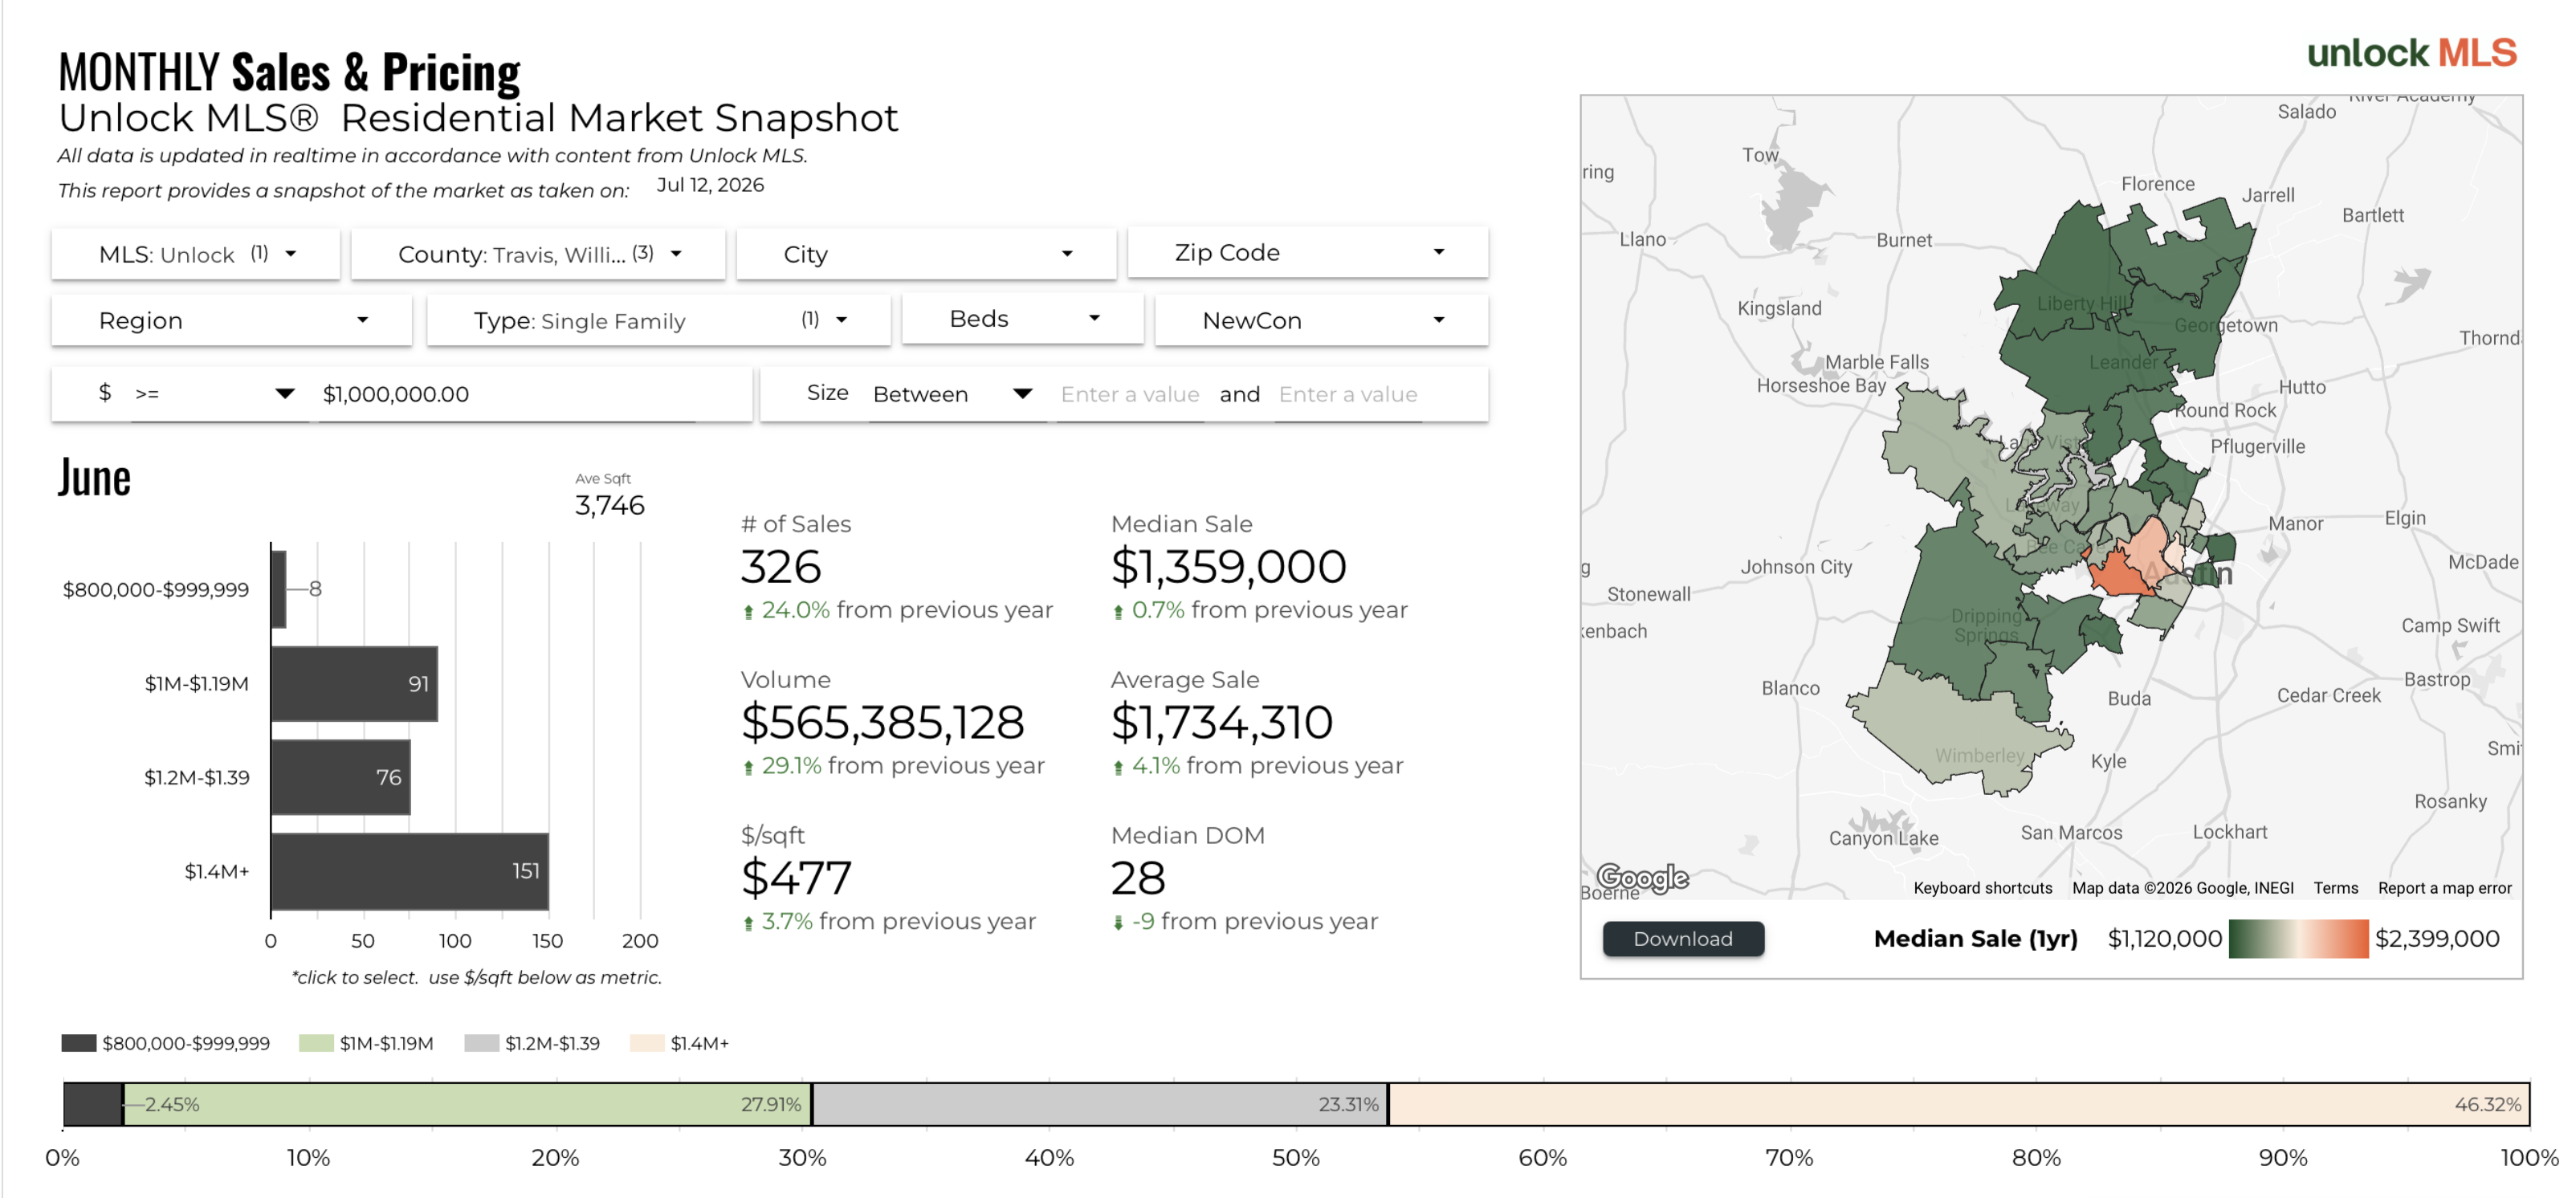
The $1.4M and above segment accounted for 151 of the 326 sales tracked by the CentralTX platform in June 2026, representing 46.3% of total luxury closings. The entry-level luxury tier of $1M to $1.19M contributed 91 closings (27.9%) and the $1.2M to $1.39M range added 76 (23.3%). There were also 8 sales in the $800,000 to $999,999 range, which sit just below the luxury threshold and reflect borderline pricing activity.
The dominance of the $1.4M and above tier in volume is a significant shift from earlier market cycles. In a higher-rate environment, you might expect that segment to slow as affordability tightens, but the June data shows it holding the largest share of closings. This reflects both the continued accumulation of higher-end inventory over the past two years and the fact that buyers at this price point tend to be less rate-sensitive than those financing entry-level luxury homes.
The $1.2M to $1.39M range deserves attention from buyers. The buyer demand chart shows this tier had a median of just 15 days on market in June, the fastest of any luxury segment, and a relatively tight negotiating margin of about 2.2% under asking. If you are targeting this price band, you should be prepared to move quickly and make a clean offer.
Travis County Drives 79% of Austin Luxury Sales
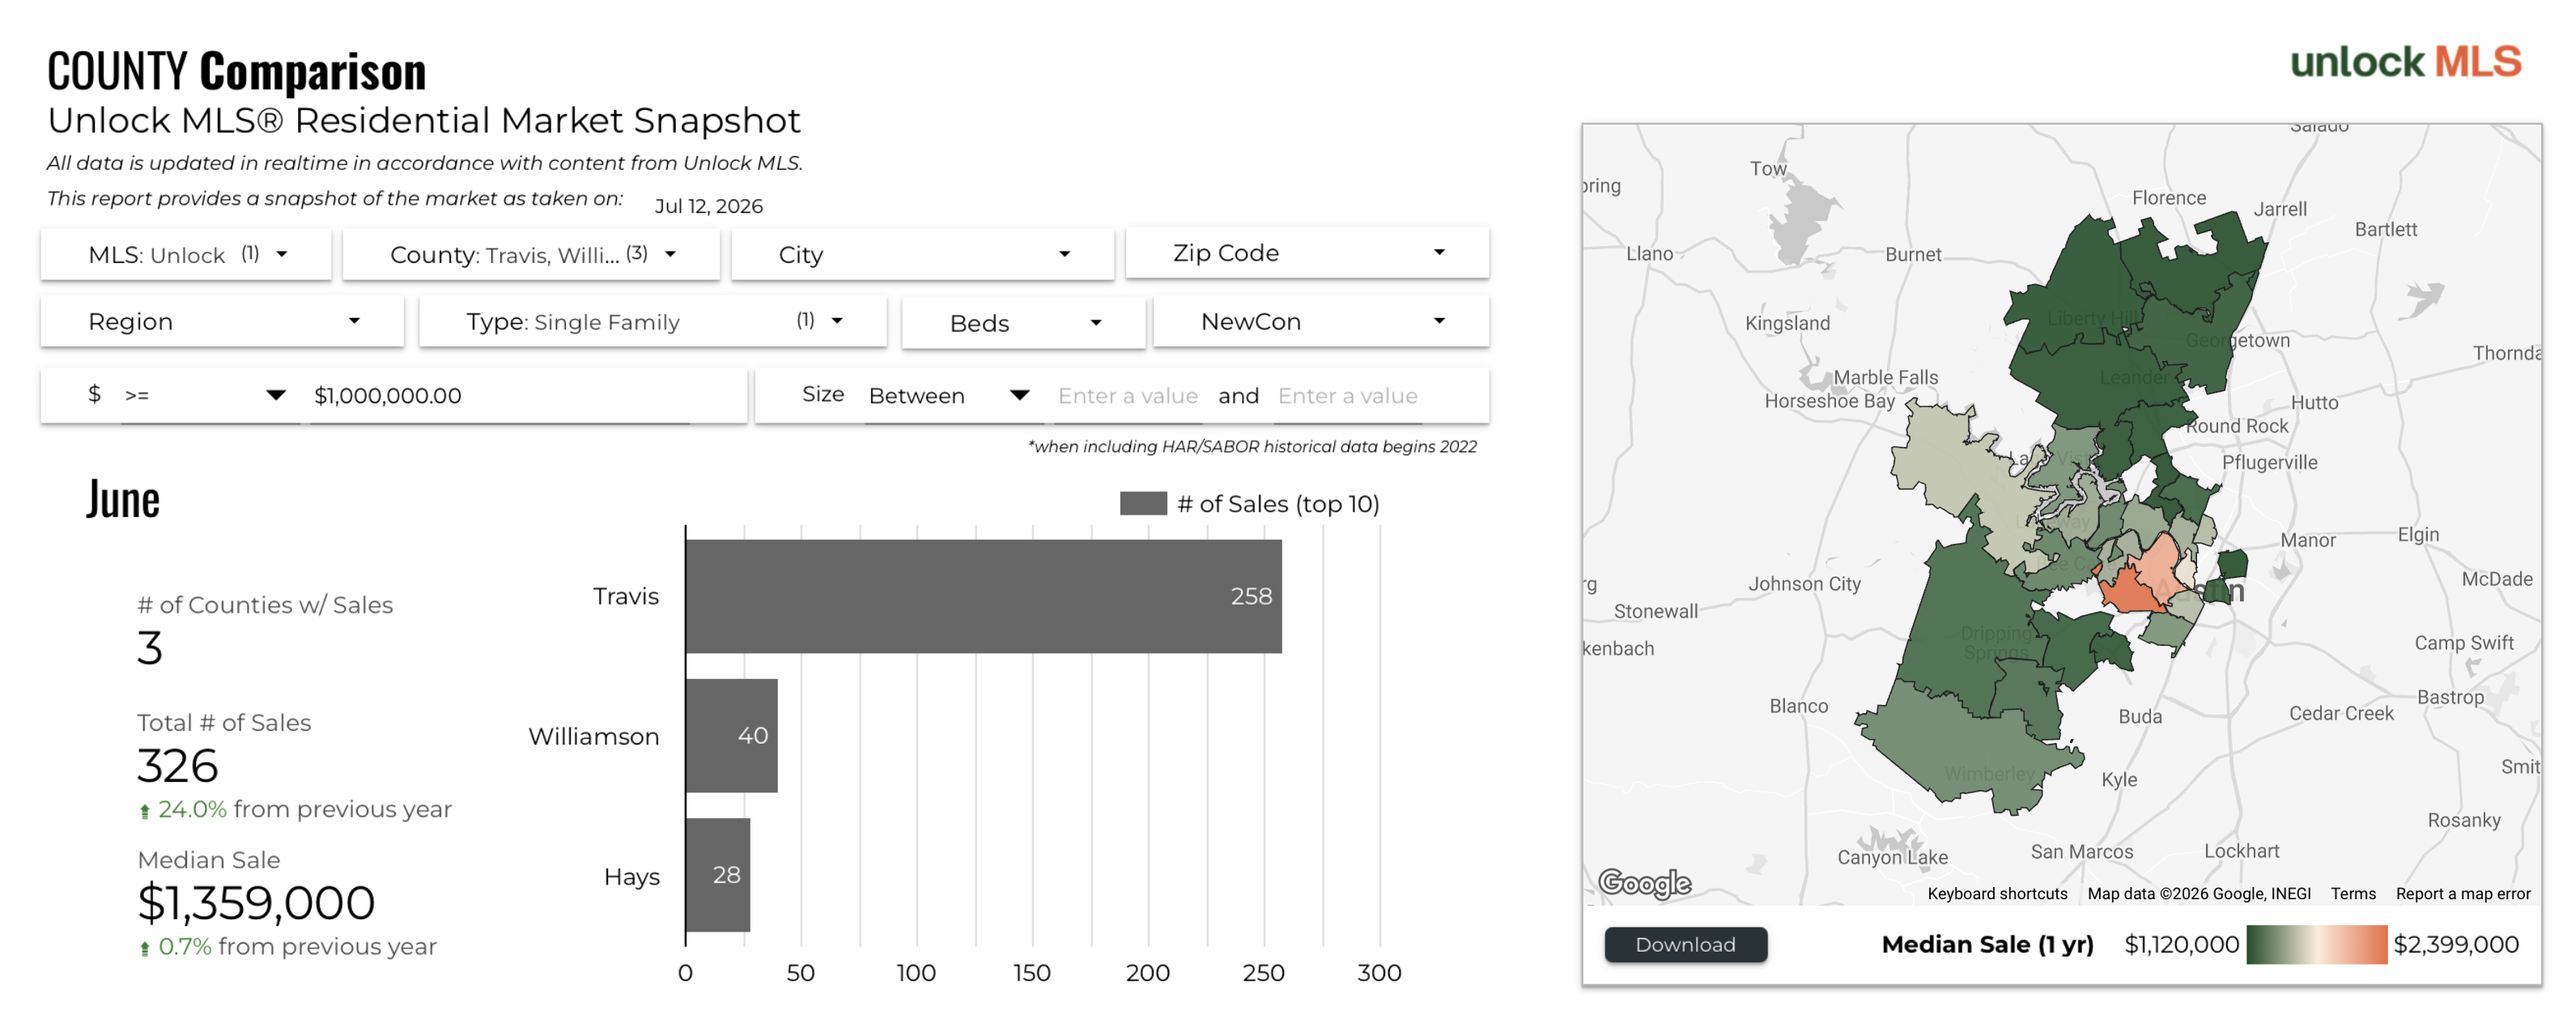
Travis County accounted for 258 of the 326 sales in the CentralTX dataset, or about 79% of total luxury closings in June 2026. Williamson County added 40 sales and Hays County contributed 28. Rebecca's direct MLS pull shows comparable proportions: 265 in Travis, 41 in Williamson, and 27 in Hays, for a total of 333.
Travis County's dominance is consistent with historical patterns, given that it encompasses central Austin, West Austin, the Westlake/Eanes corridor, and the Lake Travis area, all of which carry significant luxury housing stock. The county comparison map shows the median sale price has held in the range of $1,120,000 to $2,399,000 over the past year, with the highest prices concentrated in the central Austin zip codes and the Lake Austin waterfront areas.
Williamson County's 41 transactions reflect continued demand in communities like Georgetown, Leander, and the northern suburbs. Hays County's 28 closings, largely driven by Dripping Springs and Wimberley area sales, show that buyers willing to trade proximity for acreage and natural amenities remain an active segment of the Austin luxury market.
Austin Luxury Median Sale Price: Holding Steady in the $1.35M to $1.42M Range
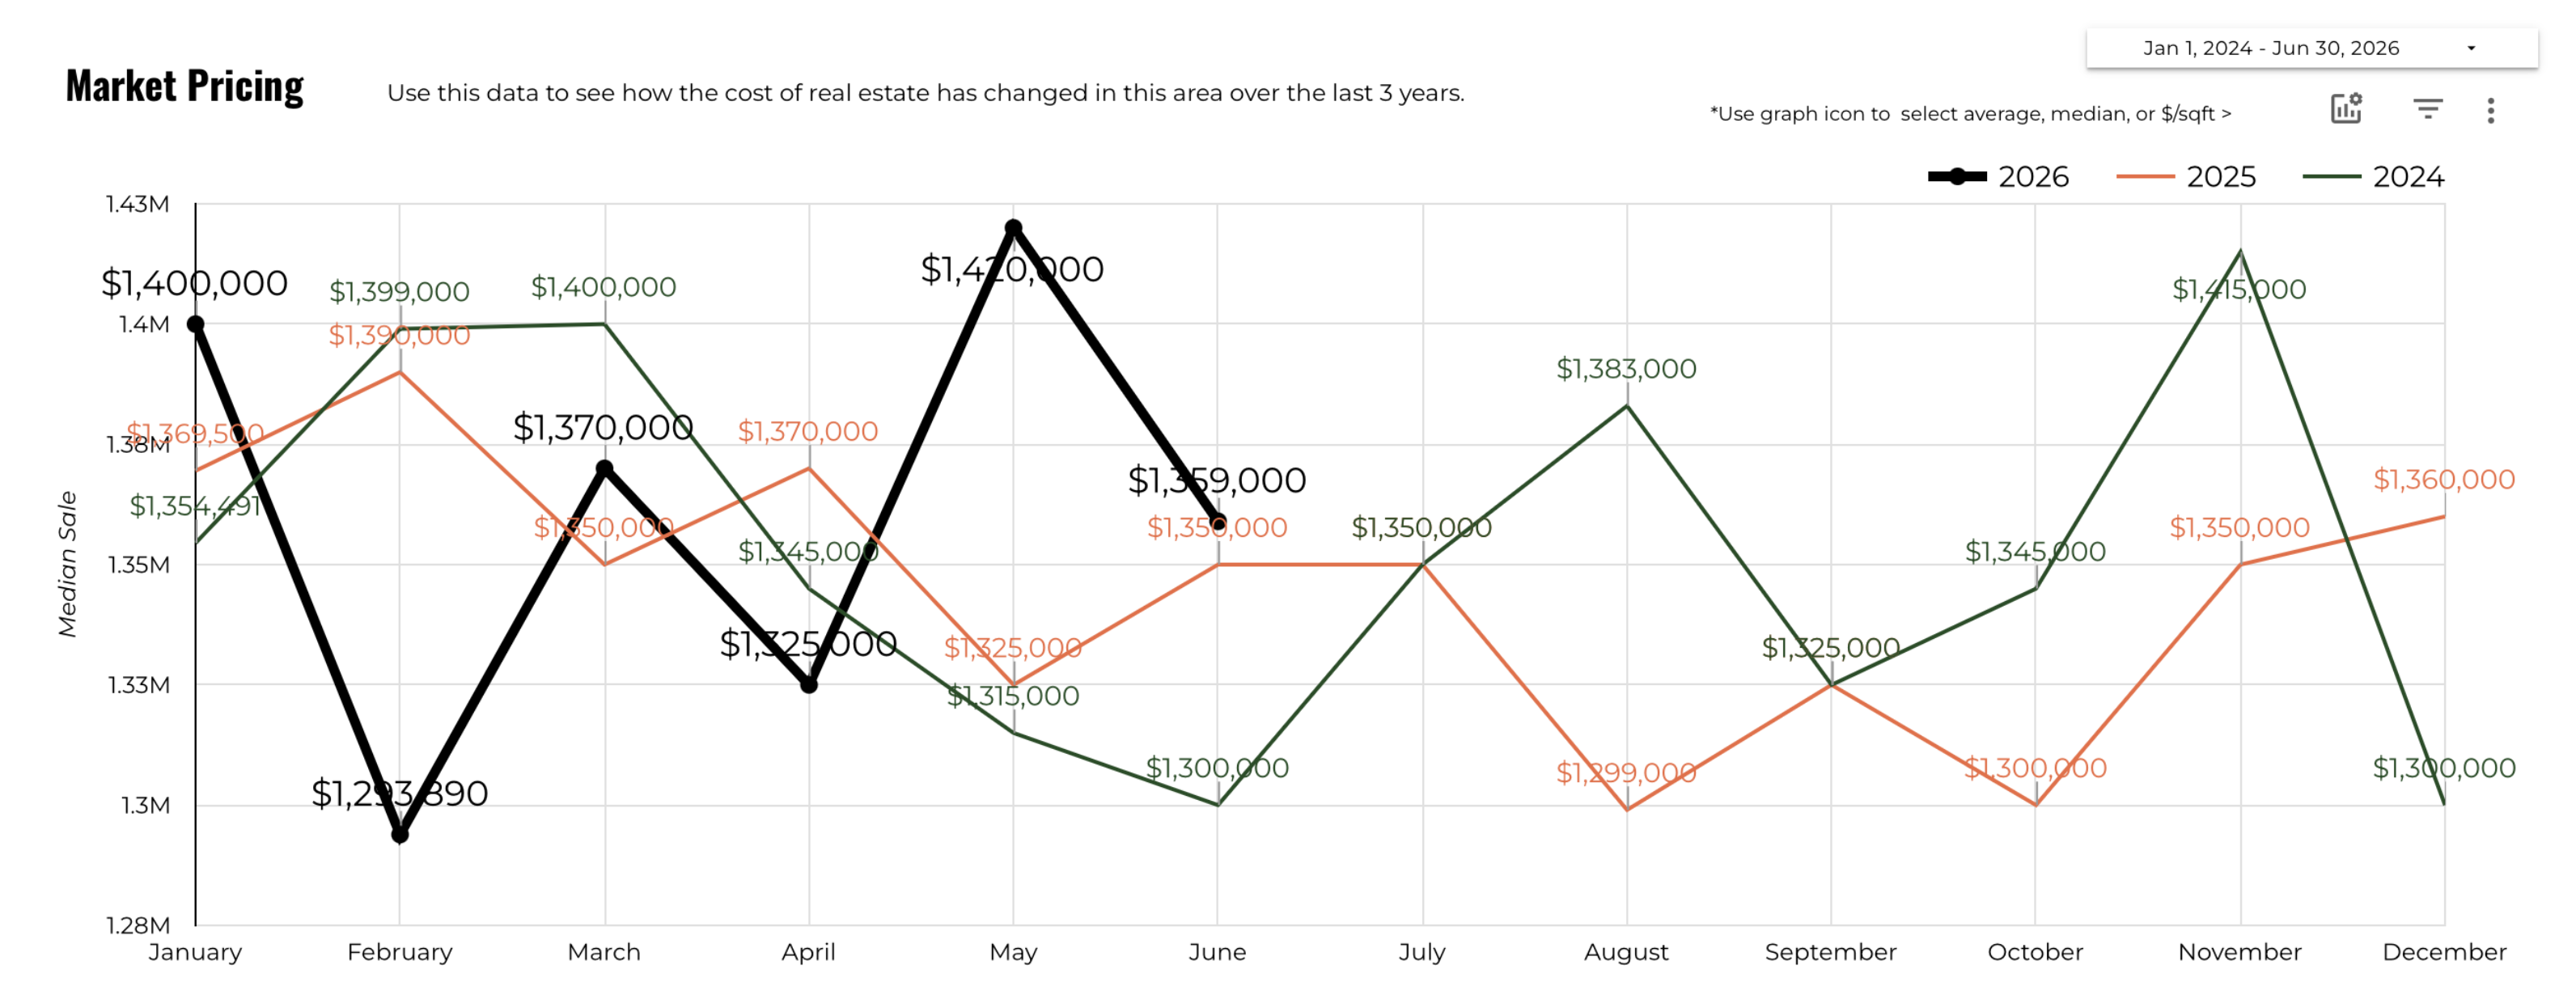
The 3-year market pricing chart shows the Austin luxury median sale price has remained in a relatively contained range over the past 18 months, oscillating between roughly $1,293,000 and $1,420,000. June 2026's $1,359,000 (as shown in the CentralTX chart; Rebecca's direct MLS pull shows $1,375,000) represents a slight pullback from May's peak of $1,420,000 but sits above the corresponding June 2025 value of $1,350,000 from the same CentralTX data.
The 2024 line (dark green) shows June at $1,300,000, meaning the luxury market has added roughly $59,000 to $75,000 in median value over the past two years. That is a modest appreciation rate for a premium market, and it reflects the broader pattern of Austin normalizing after the dramatic 2021 to 2022 run-up. The market is not retreating; it is stabilizing at a higher level than pre-pandemic pricing while absorbing significant new inventory.
For buyers comparing where the market stands today versus recent years, the pricing chart shows you are not in a falling-price environment, but you are also not facing the kind of aggressive appreciation that would pressure you into bidding beyond market value. For sellers, the data reinforces the importance of pricing at or near the current market median for your specific location and features, rather than anchoring to 2021 or 2022 peak comparables.
Austin Luxury Market Temperature: Trending Toward a More Balanced Market
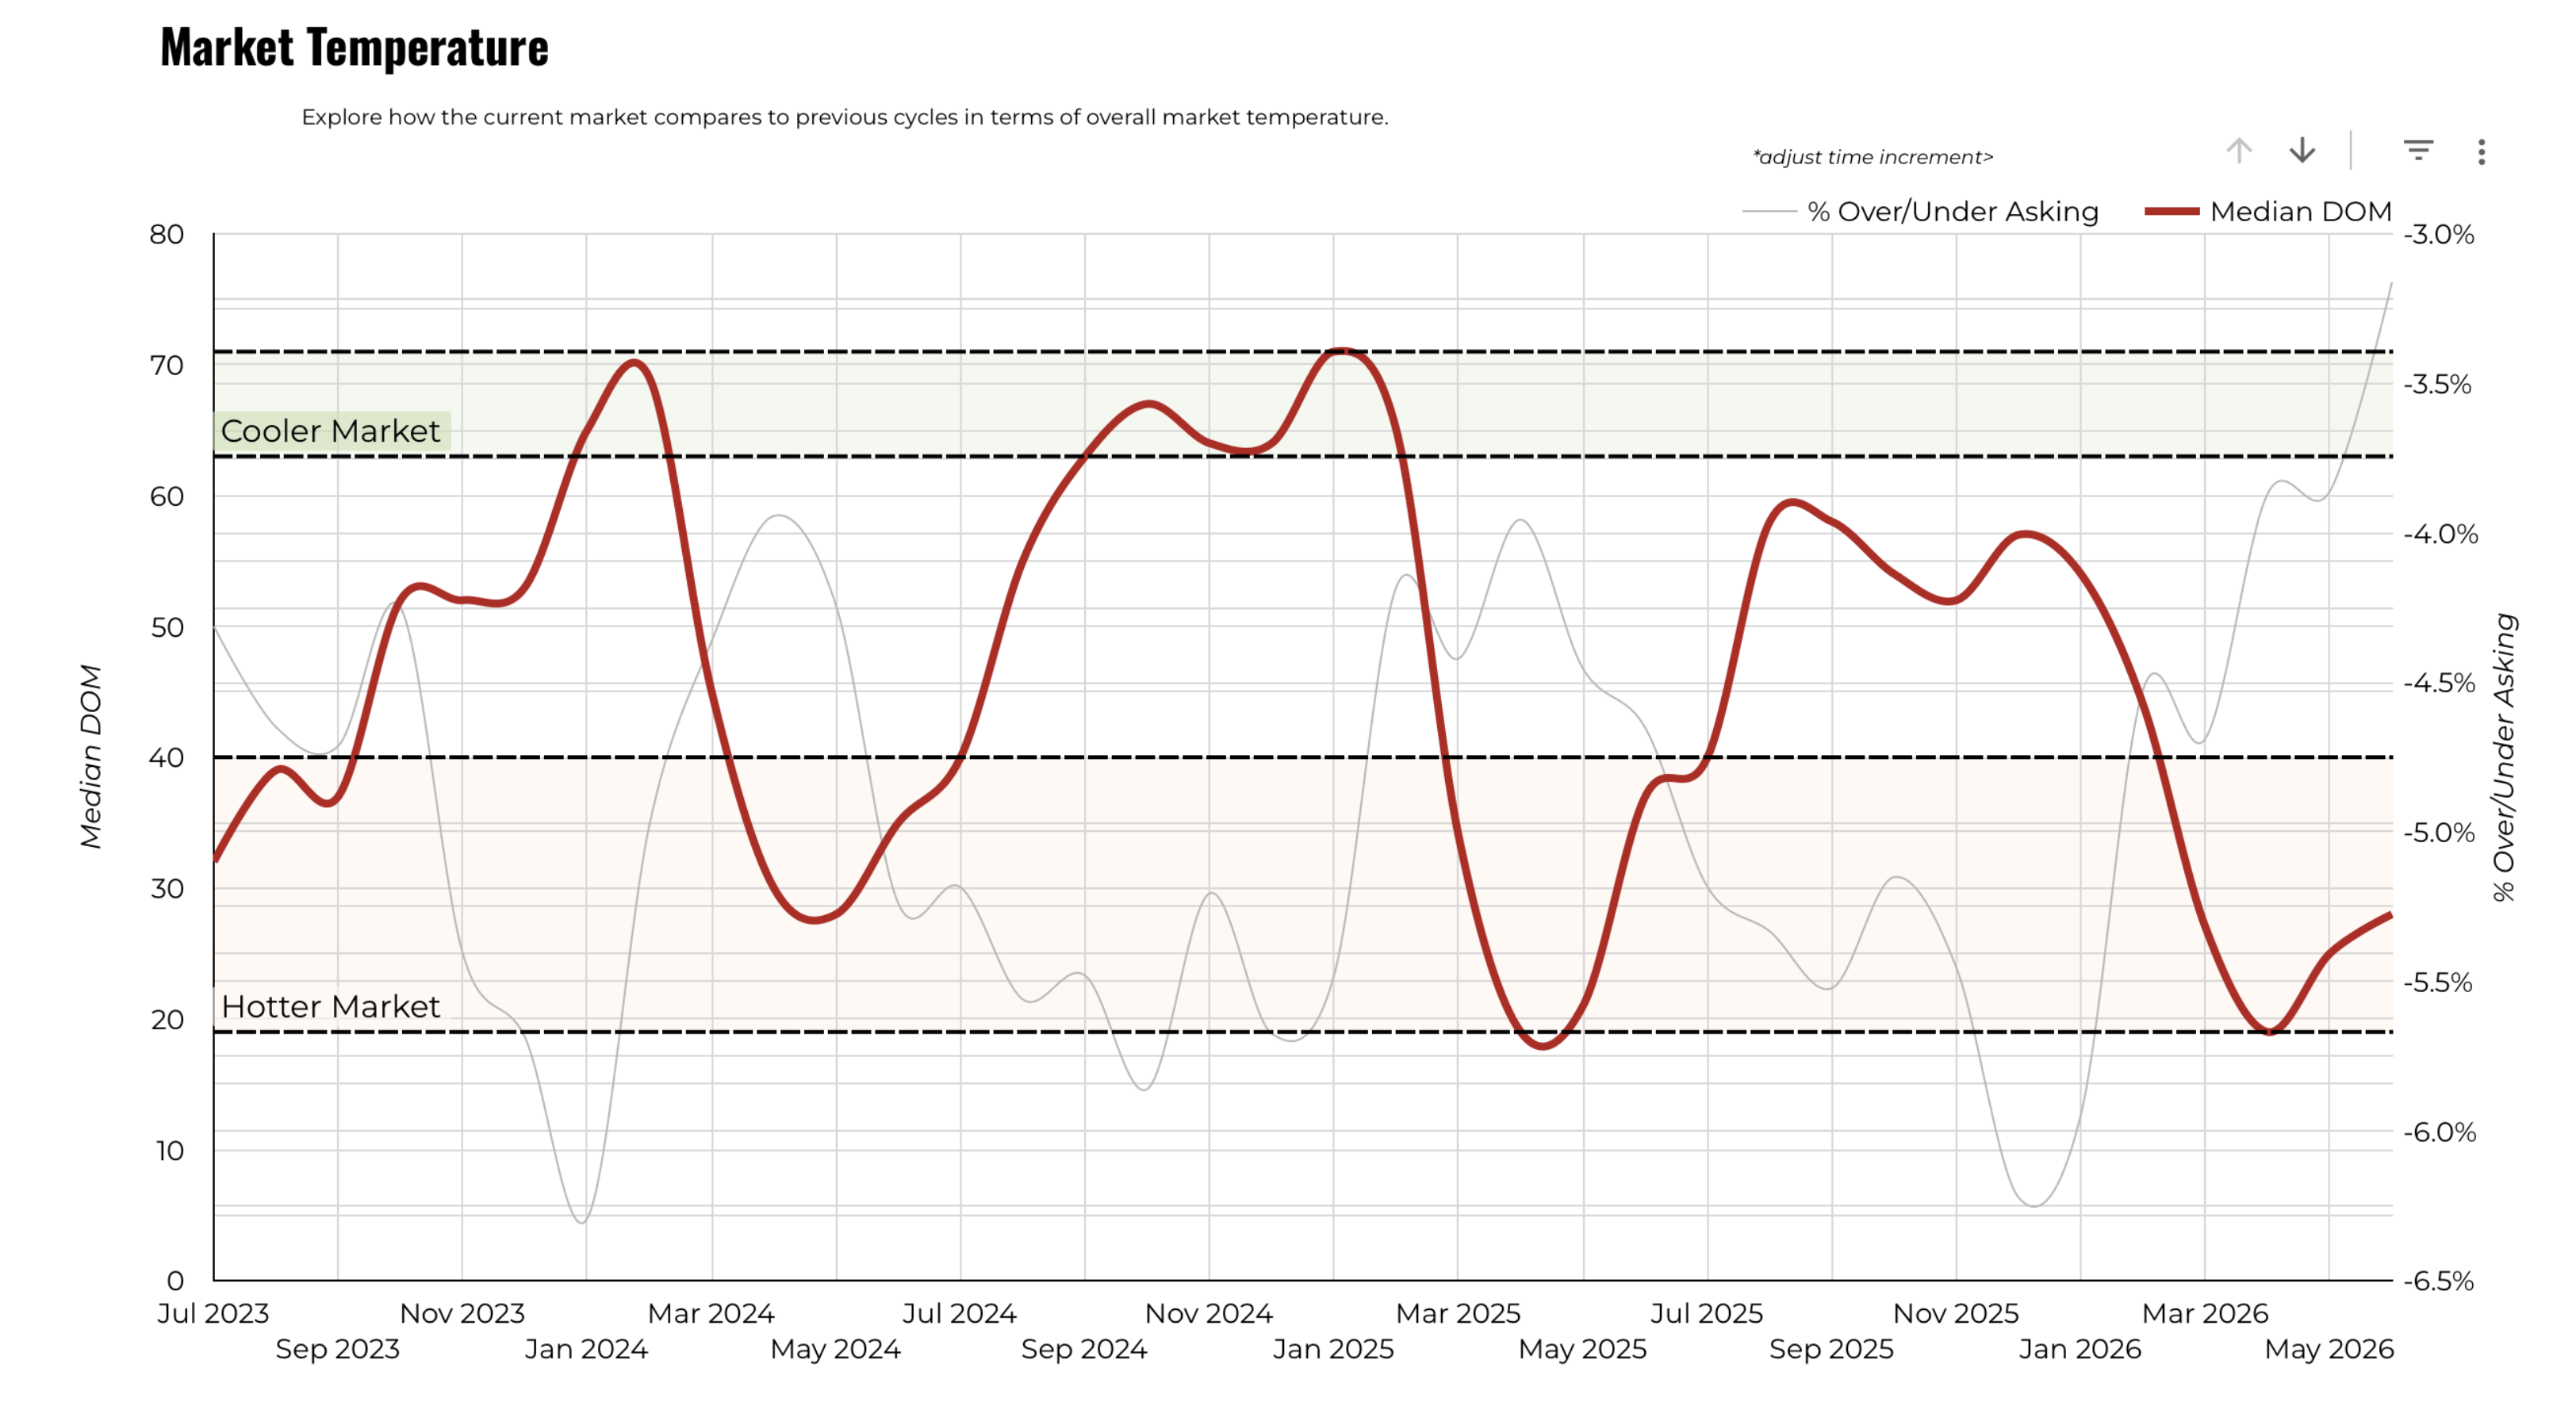
The market temperature chart tracks median days on market alongside the percentage that homes are selling over or under asking price. In June 2026, median DOM of approximately 27 to 28 days places the market in the middle zone between the "hotter market" threshold (under 20 days) and the "cooler market" zone (above 63 days). This reading indicates a balanced to slightly buyer-favoring market, without the frenzied bidding that defined 2021 and 2022.
The trend line in the chart tells an important story. From the highs of late 2024 when median DOM reached 57 to 71 days, the market has compressed steadily through early 2026. The rapid descent through Q1 2026, hitting a low near 19 days in February and March, then moderating back to the mid-to-high 20s through spring, shows that demand recovered sharply before finding a more sustainable pace.
The percentage over/under asking line (right axis) confirms the picture. Homes are currently closing at roughly 3.1% under asking price on average, which is a notable improvement from the 5% to 6% under-asking readings of 2024. Sellers are closing the gap, but buyers still have room to negotiate, particularly on homes that have been sitting longer than the 27-day median.
Months of Supply at 4.9: Balanced Territory with Variation by Price
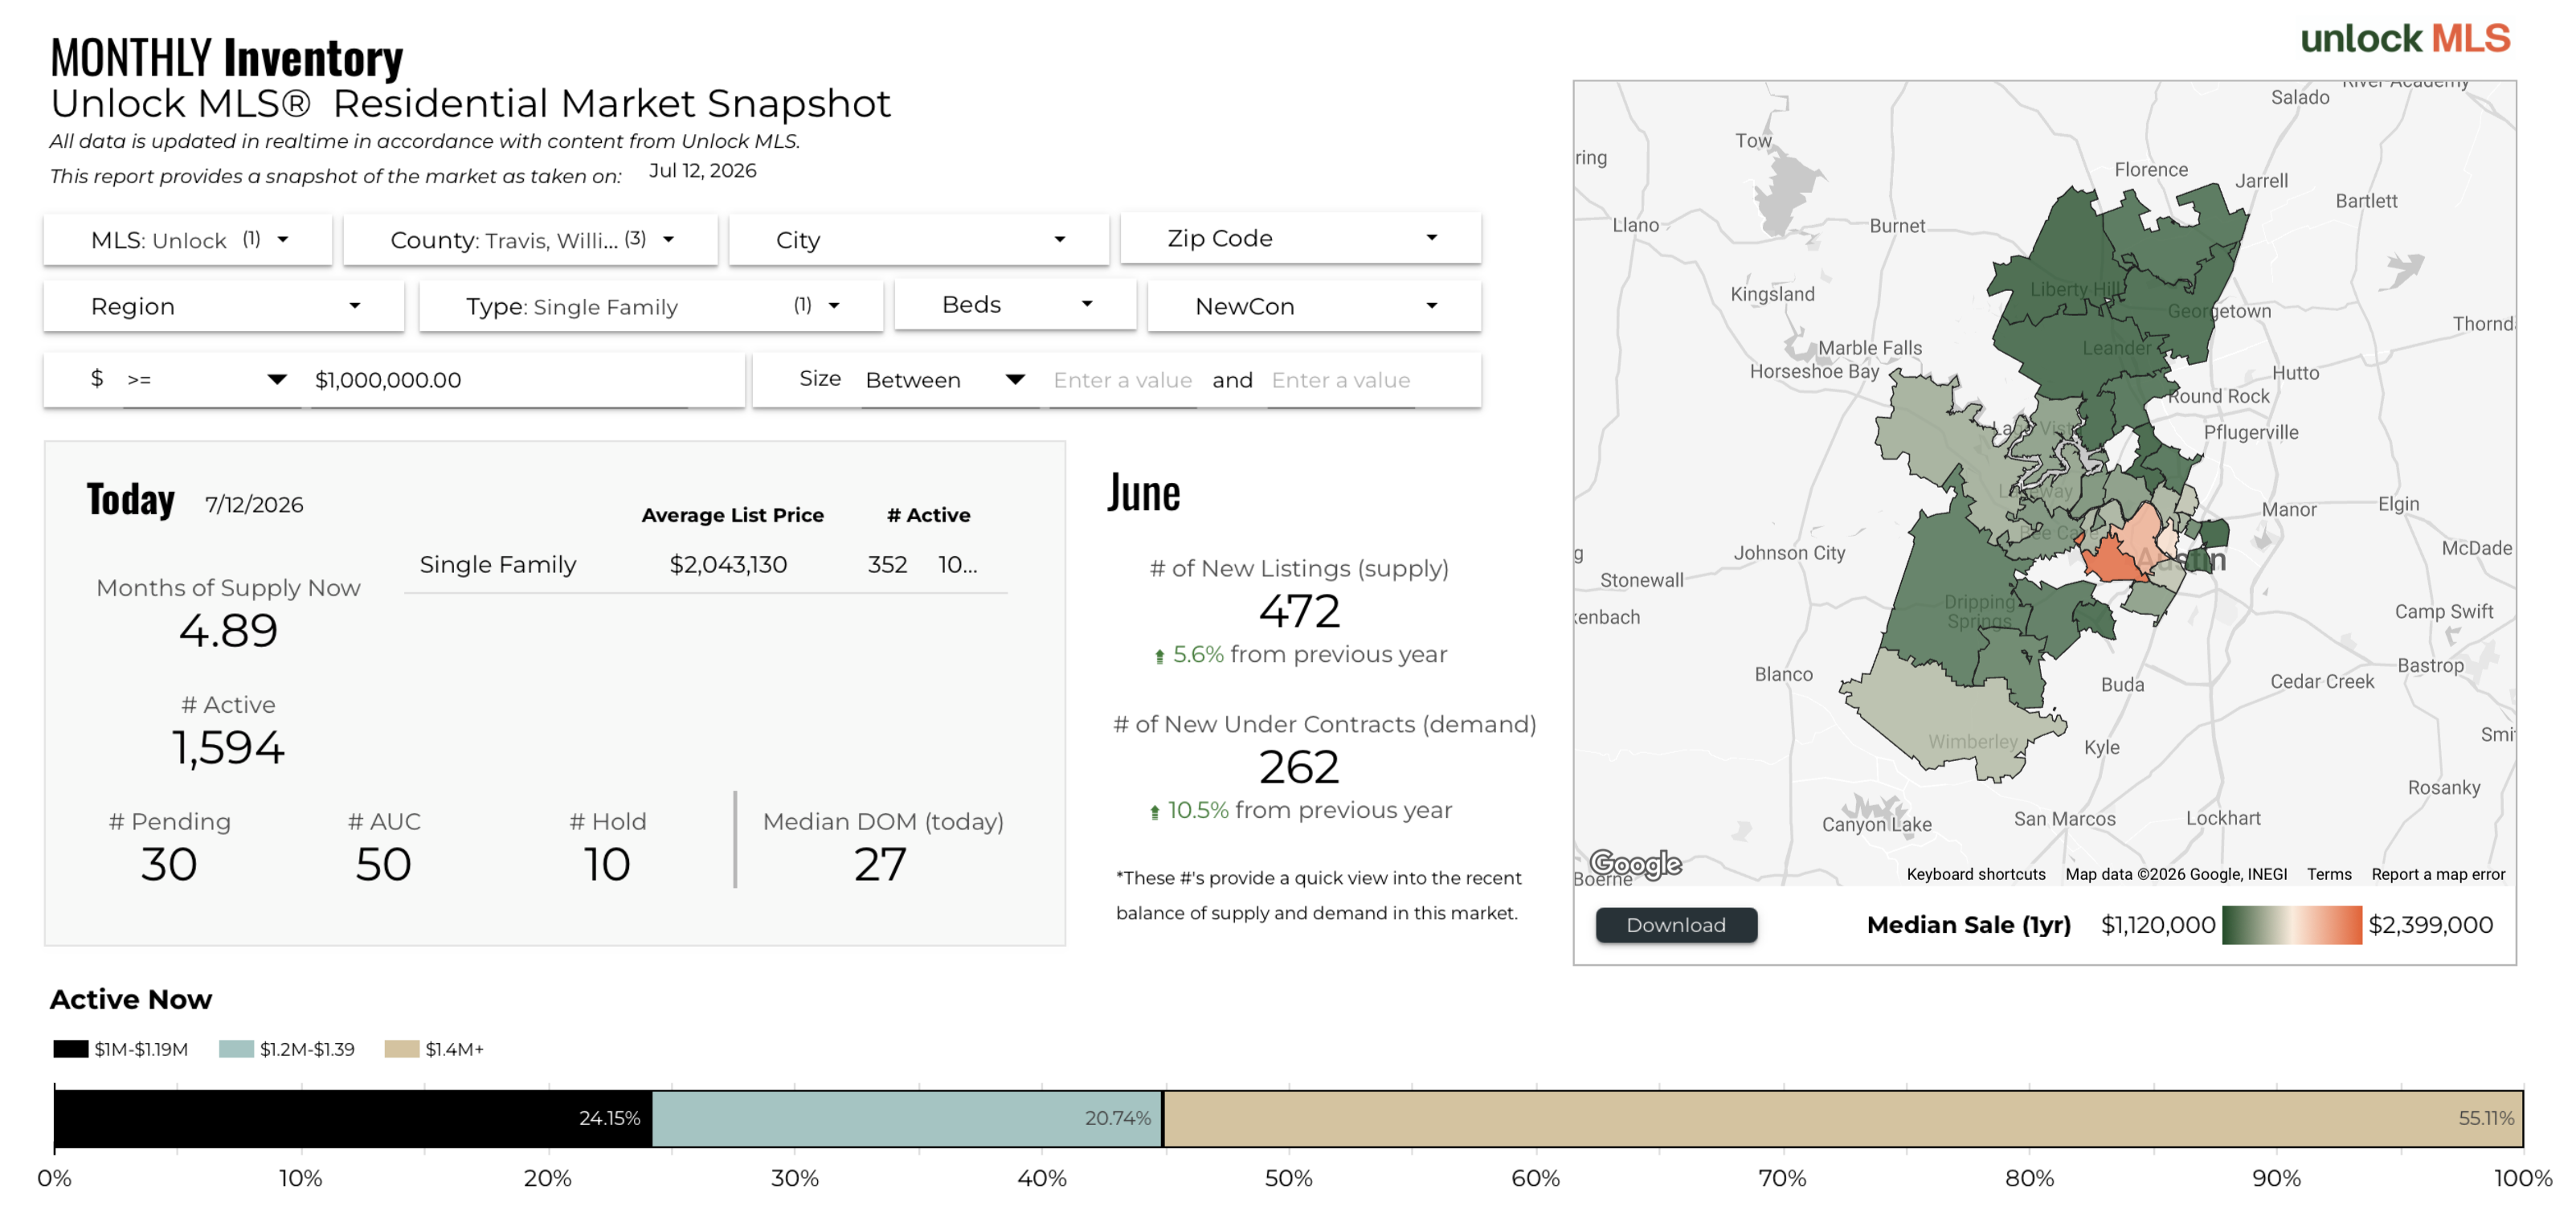
The months of supply chart shows an overall reading of 4.9 months for the Austin luxury market as of July 12, 2026. That figure sits in balanced market territory, generally defined as 4 to 6 months of supply. However, the breakdown by price range reveals meaningful variation: the $1M to $1.19M tier has 4.4 months of supply (378 active, 86 sales last month), the $1.2M to $1.39M range has just 3.8 months (301 active, 80 sales), and the $1.4M and above segment has 5.7 months (915 active, 160 sales).
The $1.2M to $1.39M range at 3.8 months is the tightest segment of the market, consistent with the fast median DOM of 15 days seen in the buyer demand chart. If you are a buyer targeting this price band, you are working in the most competitive corner of the Austin luxury market right now. Inventory moves quickly and well-priced homes do not sit.
The $1.4M and above tier at 5.7 months provides more breathing room for buyers. With 915 active listings and 160 closings in the prior month, there is real selection available at the upper end. Sellers in this range need to be patient and price thoughtfully; the volume of competition is higher and buyers have choices.
Active Inventory and Asking Prices: 1,594 Homes and Median Asking Near $1.5M
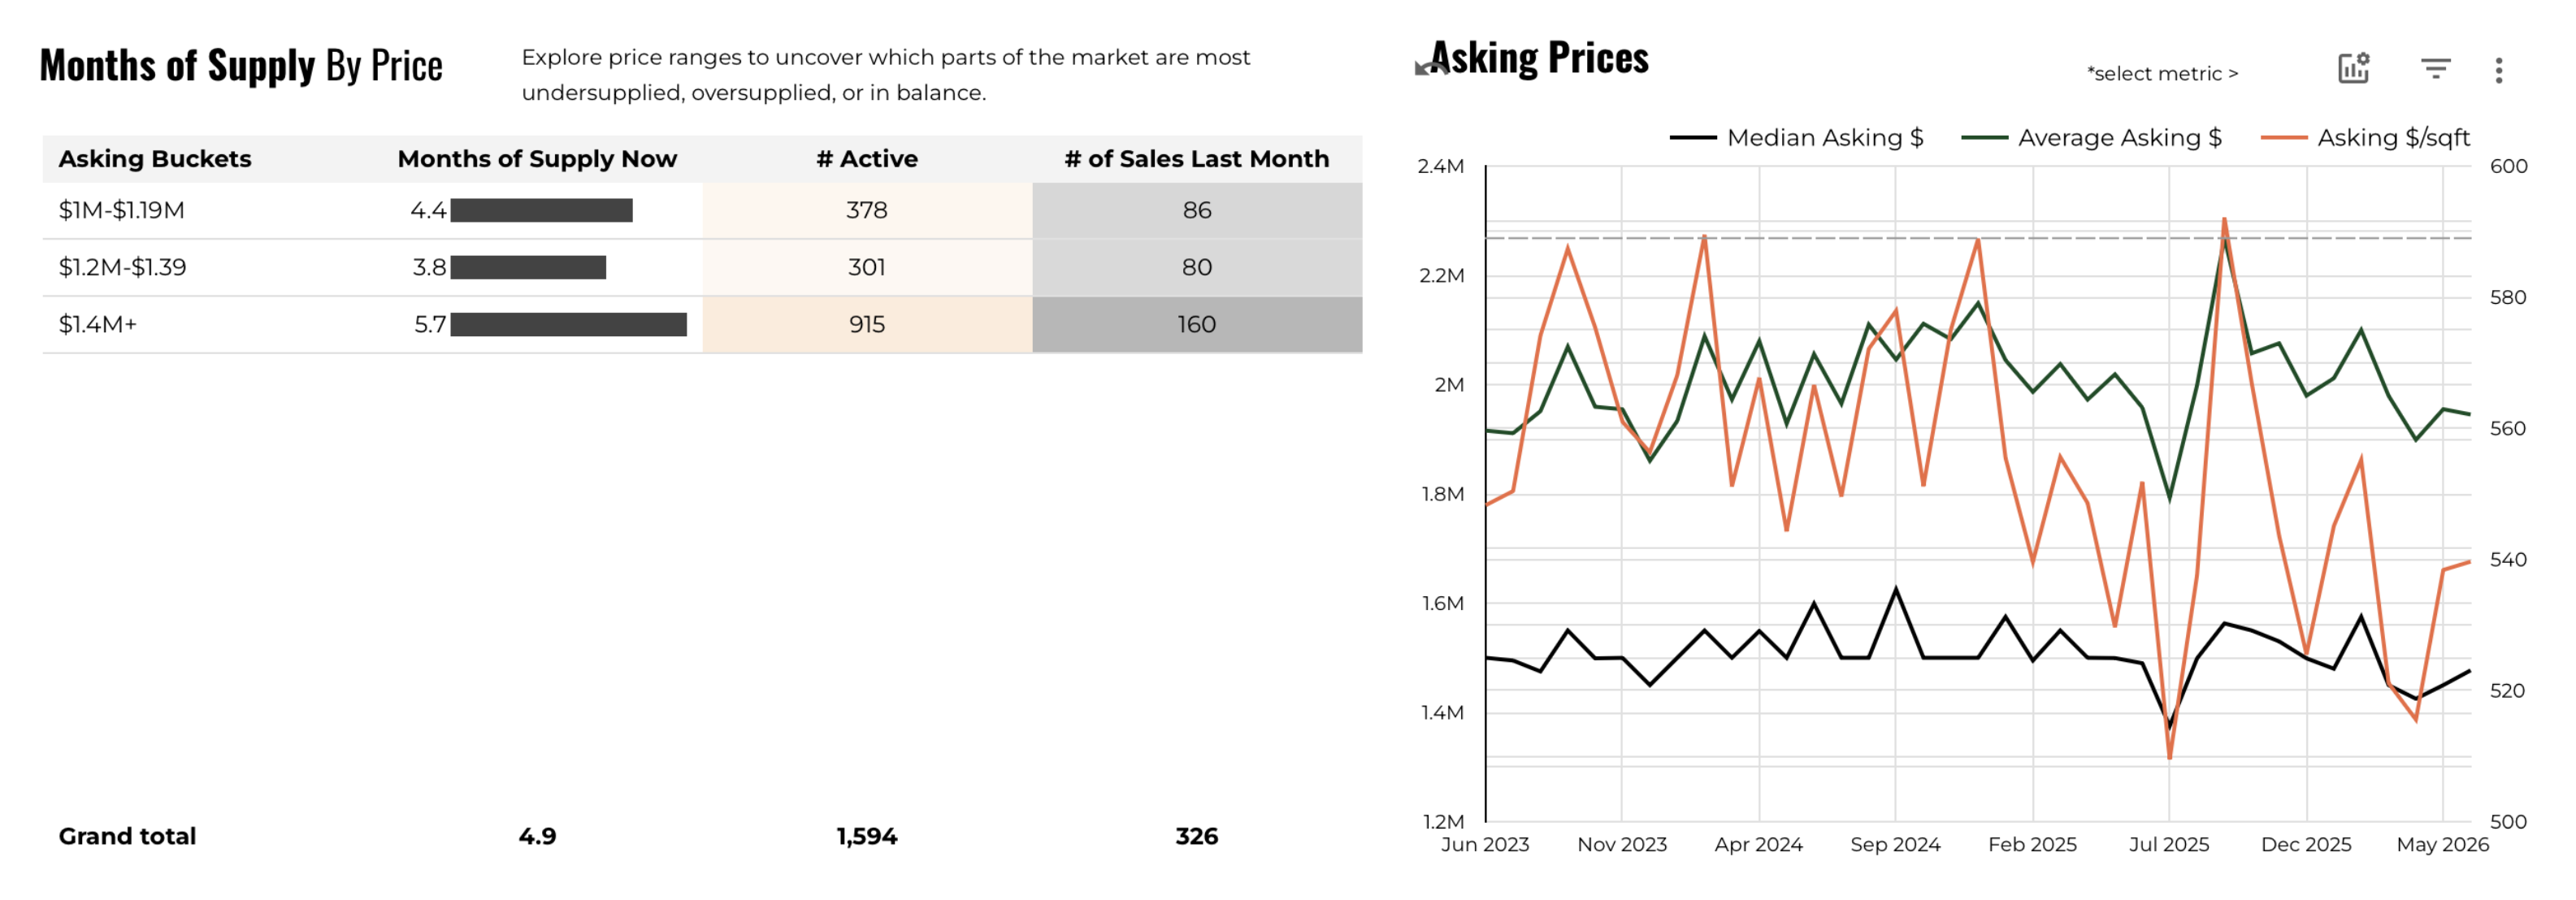
As of July 12, 2026, there are 1,594 single-family luxury homes currently active in the Travis, Williamson, and Hays County market, with an average list price of $2,043,130. The median asking price chart on the right side of the image shows the median has been holding in the low-to-mid $1.4M to $1.5M range in 2026, while average asking prices fluctuate more due to the influence of high-end spec and waterfront properties.
June 2026 brought 472 new listings to the market, up 5.6% from the prior year. That supply increase is being met by rising demand: new under contracts for June came in at 262, up 10.5% from June 2025. The fact that demand is growing faster than supply is encouraging for sellers, even if the overall months-of-supply reading remains in balanced territory.
The asking price trend is worth watching because it can be a leading indicator of where sold prices will head in coming months. When asking prices drift higher while sold prices stay flat, it usually means sellers are testing the market and finding resistance. The current gap between average asking ($2,043,130) and average sold ($1,748,669) is a reminder that list price and sell price are not the same, and buyers should evaluate homes on their actual market value rather than anchor to the list.
49% of Active Listings Have Had a Price Reduction
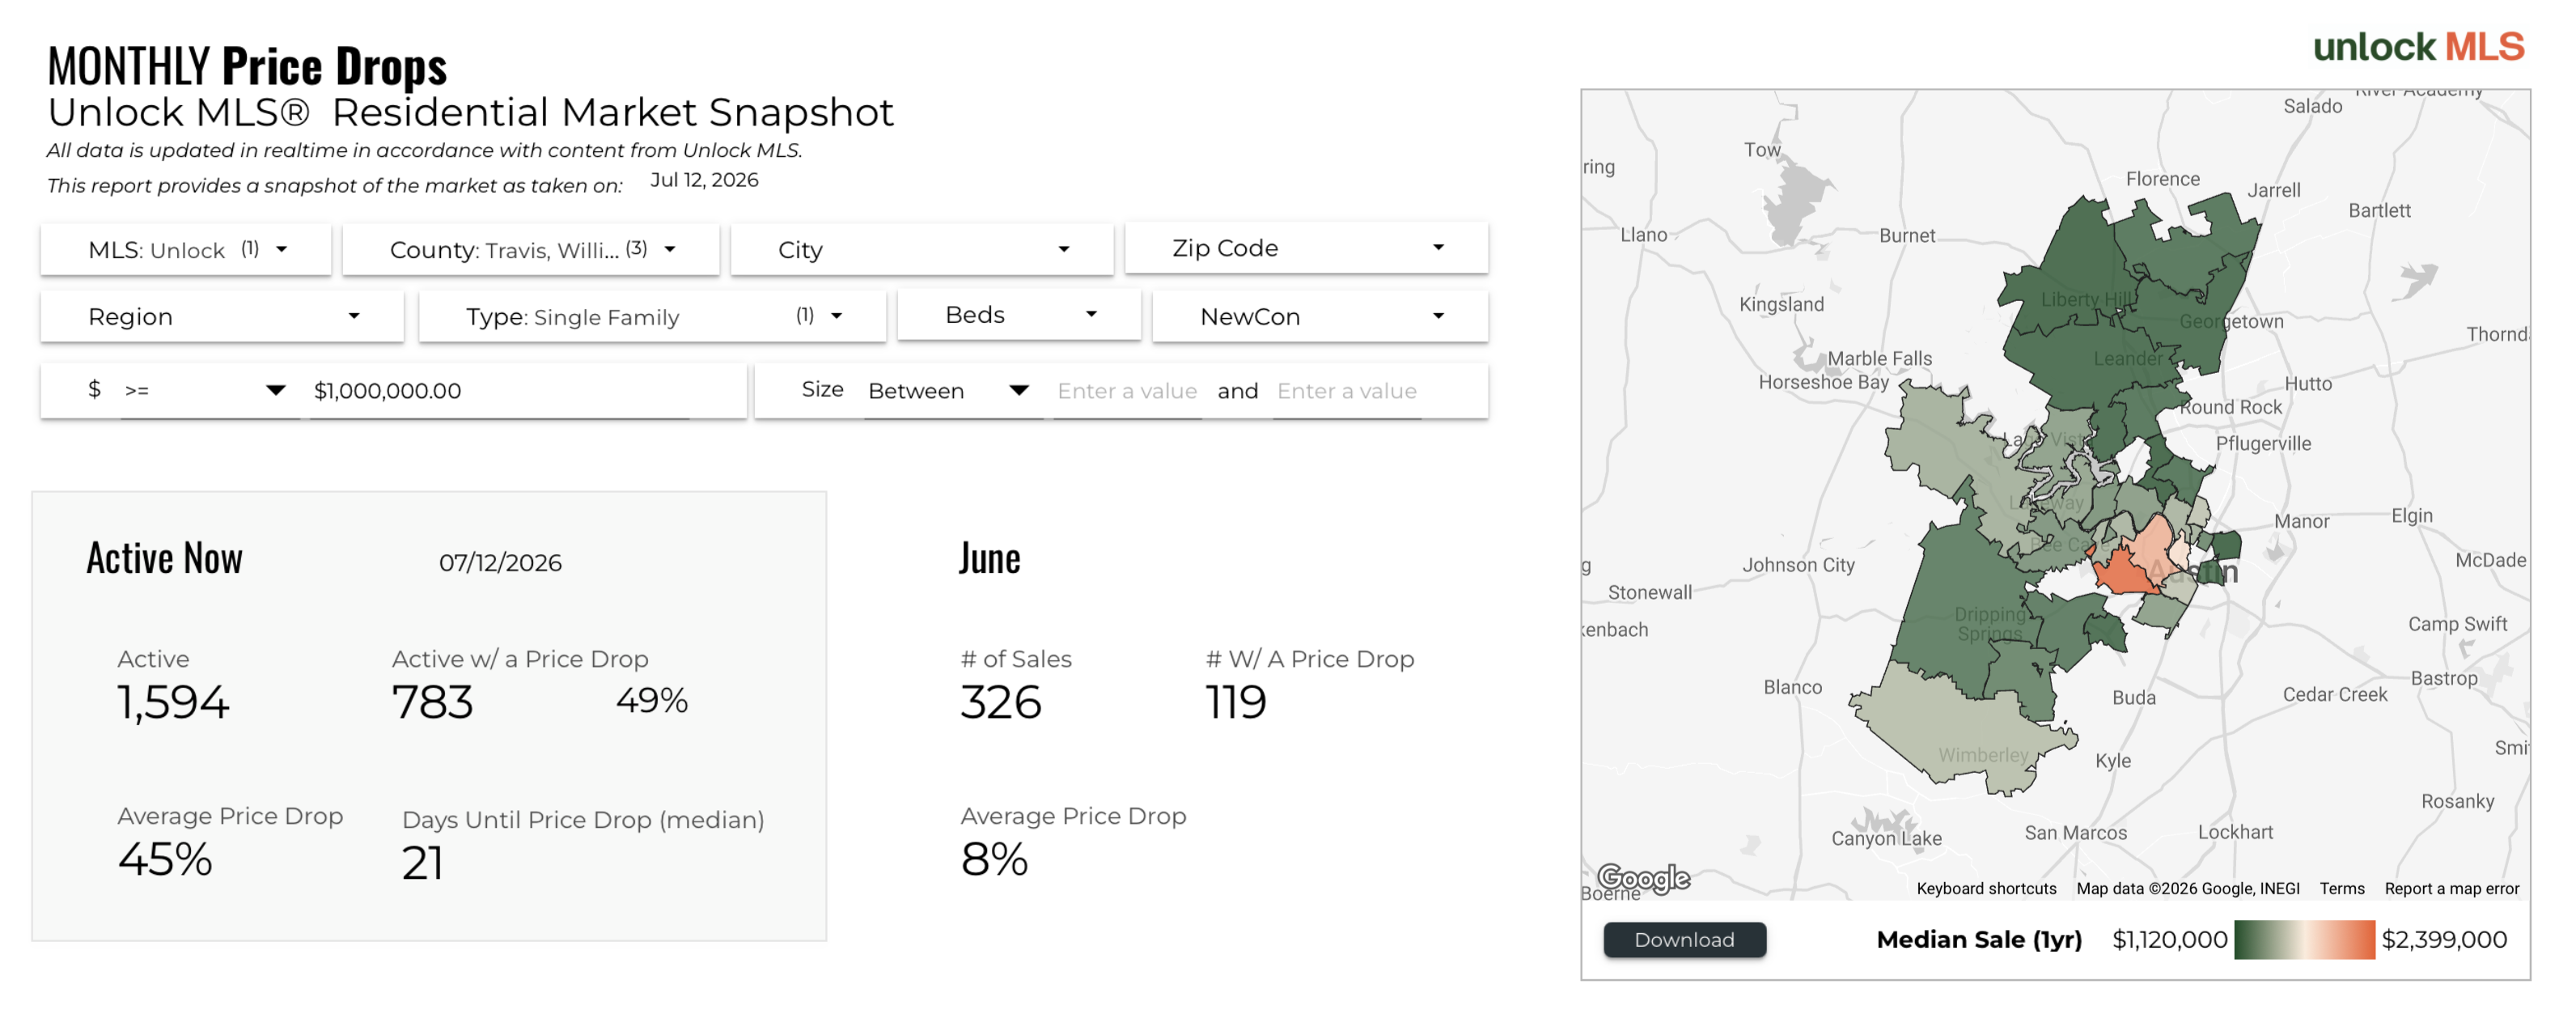
Of the 1,594 luxury homes currently active on the market, 783 have had at least one price reduction, representing 49% of active inventory. The median time from listing to first price cut is 21 days, meaning sellers who enter the market overpriced are not waiting long to acknowledge it.
In June, 119 of the sold homes (from the CentralTX dataset of 326) had taken a price reduction before closing, with an average reduction of 8% from the adjusted list price. That is a meaningful concession: on a $1.5M home, an 8% reduction is $120,000. Sellers who avoid price reductions by pricing correctly from day one are preserving significant value.
For buyers, the fact that nearly half of active listings have already reduced their price is useful information. It tells you there is a segment of the market where sellers have already demonstrated flexibility, and where further negotiation may be possible. If a home you are interested in has been active for more than 30 days and has taken a price cut, you have more leverage than the headline asking price might suggest.
Average Price Drop Percentage Reaches Multi-Year Low at 8.1% in Q2 2026
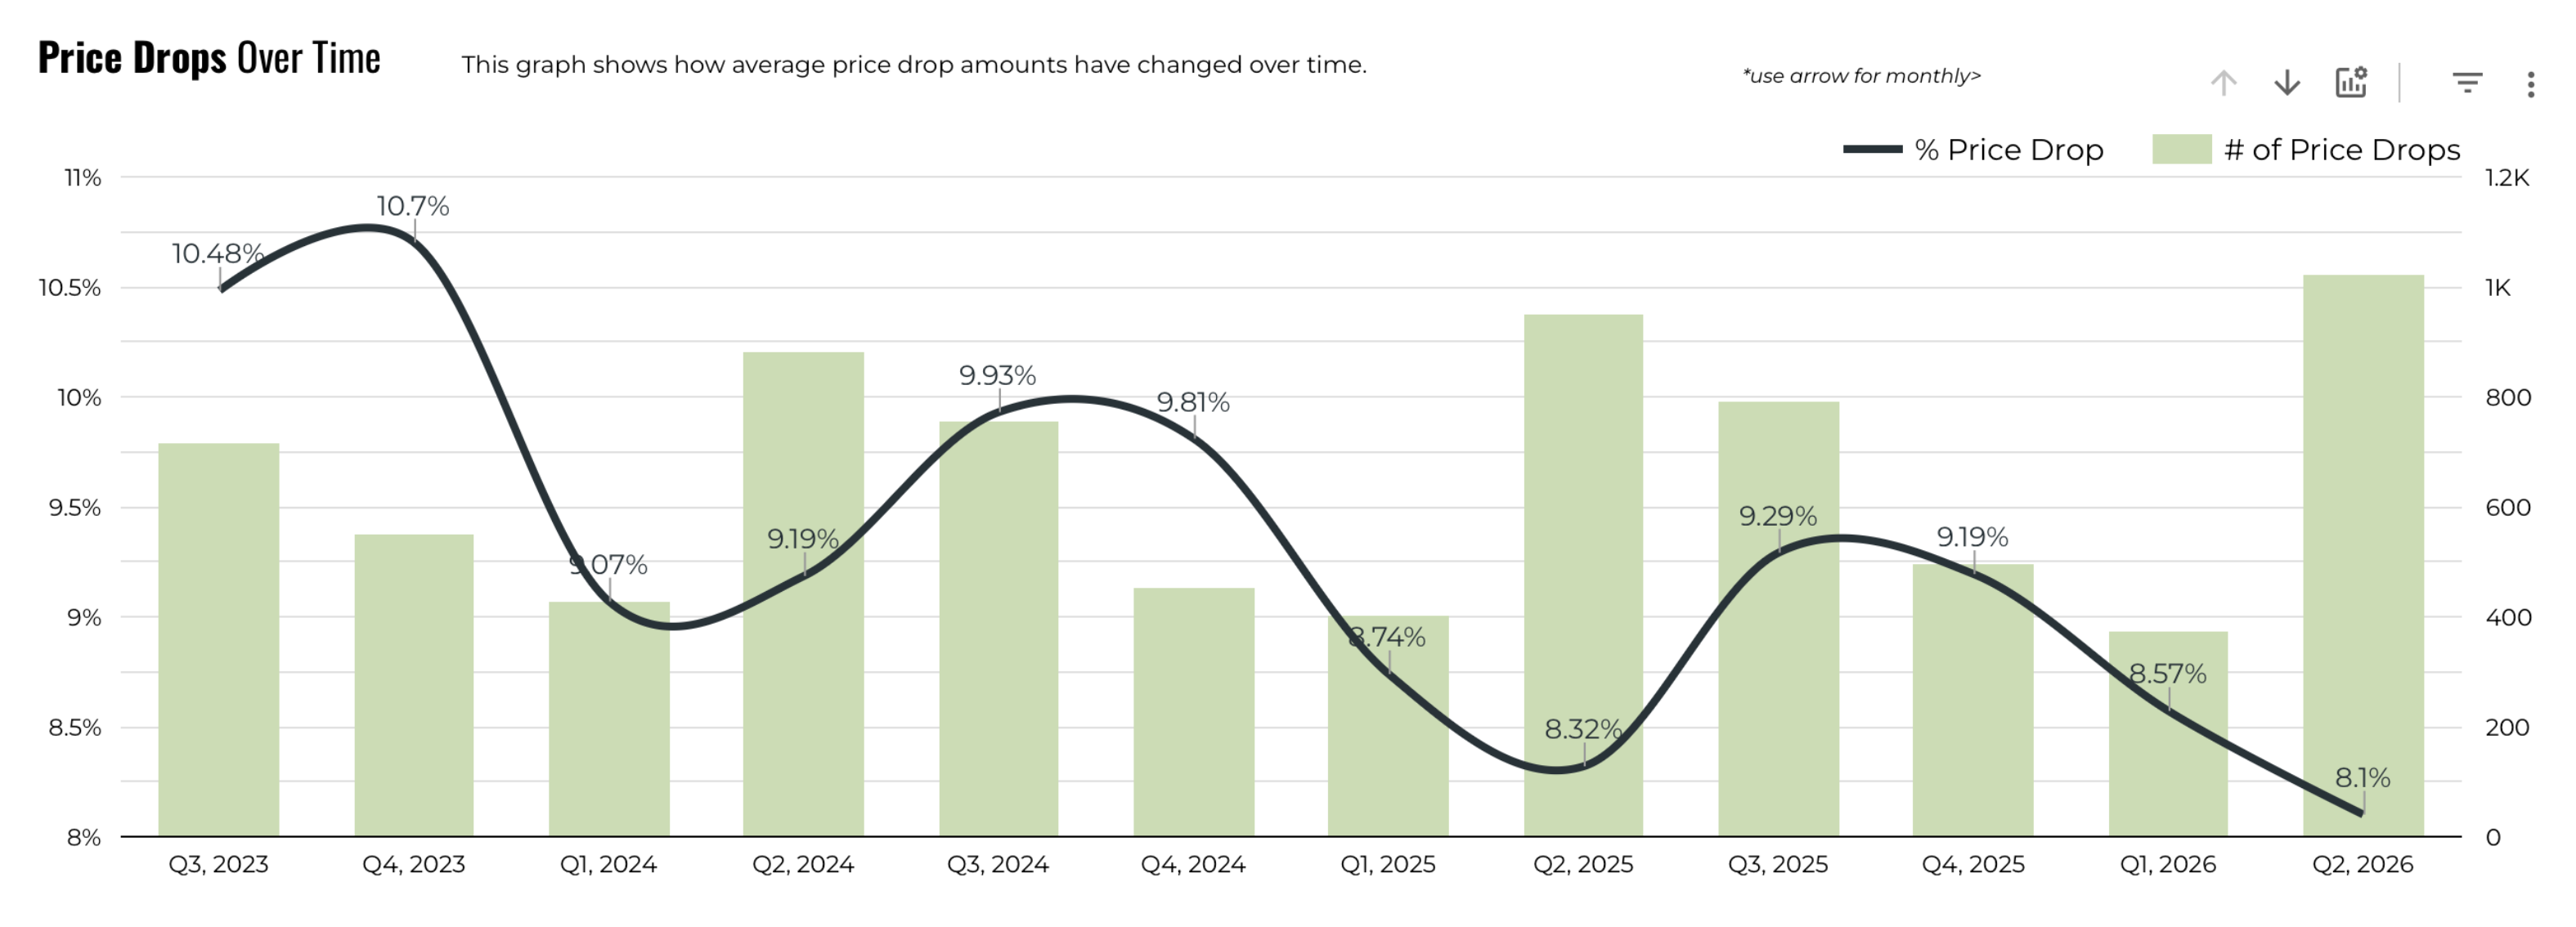
The price drops over time chart tracks the average percentage of price reduction by quarter, and Q2 2026 shows 8.1%, the lowest reading in the dataset stretching back to Q3 2023. This downward trend from the 10.48% to 10.7% readings in 2023 suggests that sellers are becoming more accurate in their initial pricing, which reduces the magnitude of corrections needed before a home sells.
The number of price drops (shown as bars in the chart) reached a new high in Q2 2026, approaching 1,000 individual reductions. That high volume combined with a lower average percentage drop suggests sellers are making smaller, more frequent adjustments rather than large one-time cuts. This is a more sophisticated pricing strategy, and it reflects a seller base that is paying attention to market feedback.
For buyers tracking price reduction patterns, smaller percentage cuts may mean sellers have already landed close to market value. A 3% to 4% reduction from a correctly positioned home is very different from a 10% cut on an overpriced listing. Understanding where in that spectrum a given property falls is important context for making an offer.
Price-Reduced Homes Going Under Contract in 26 Days
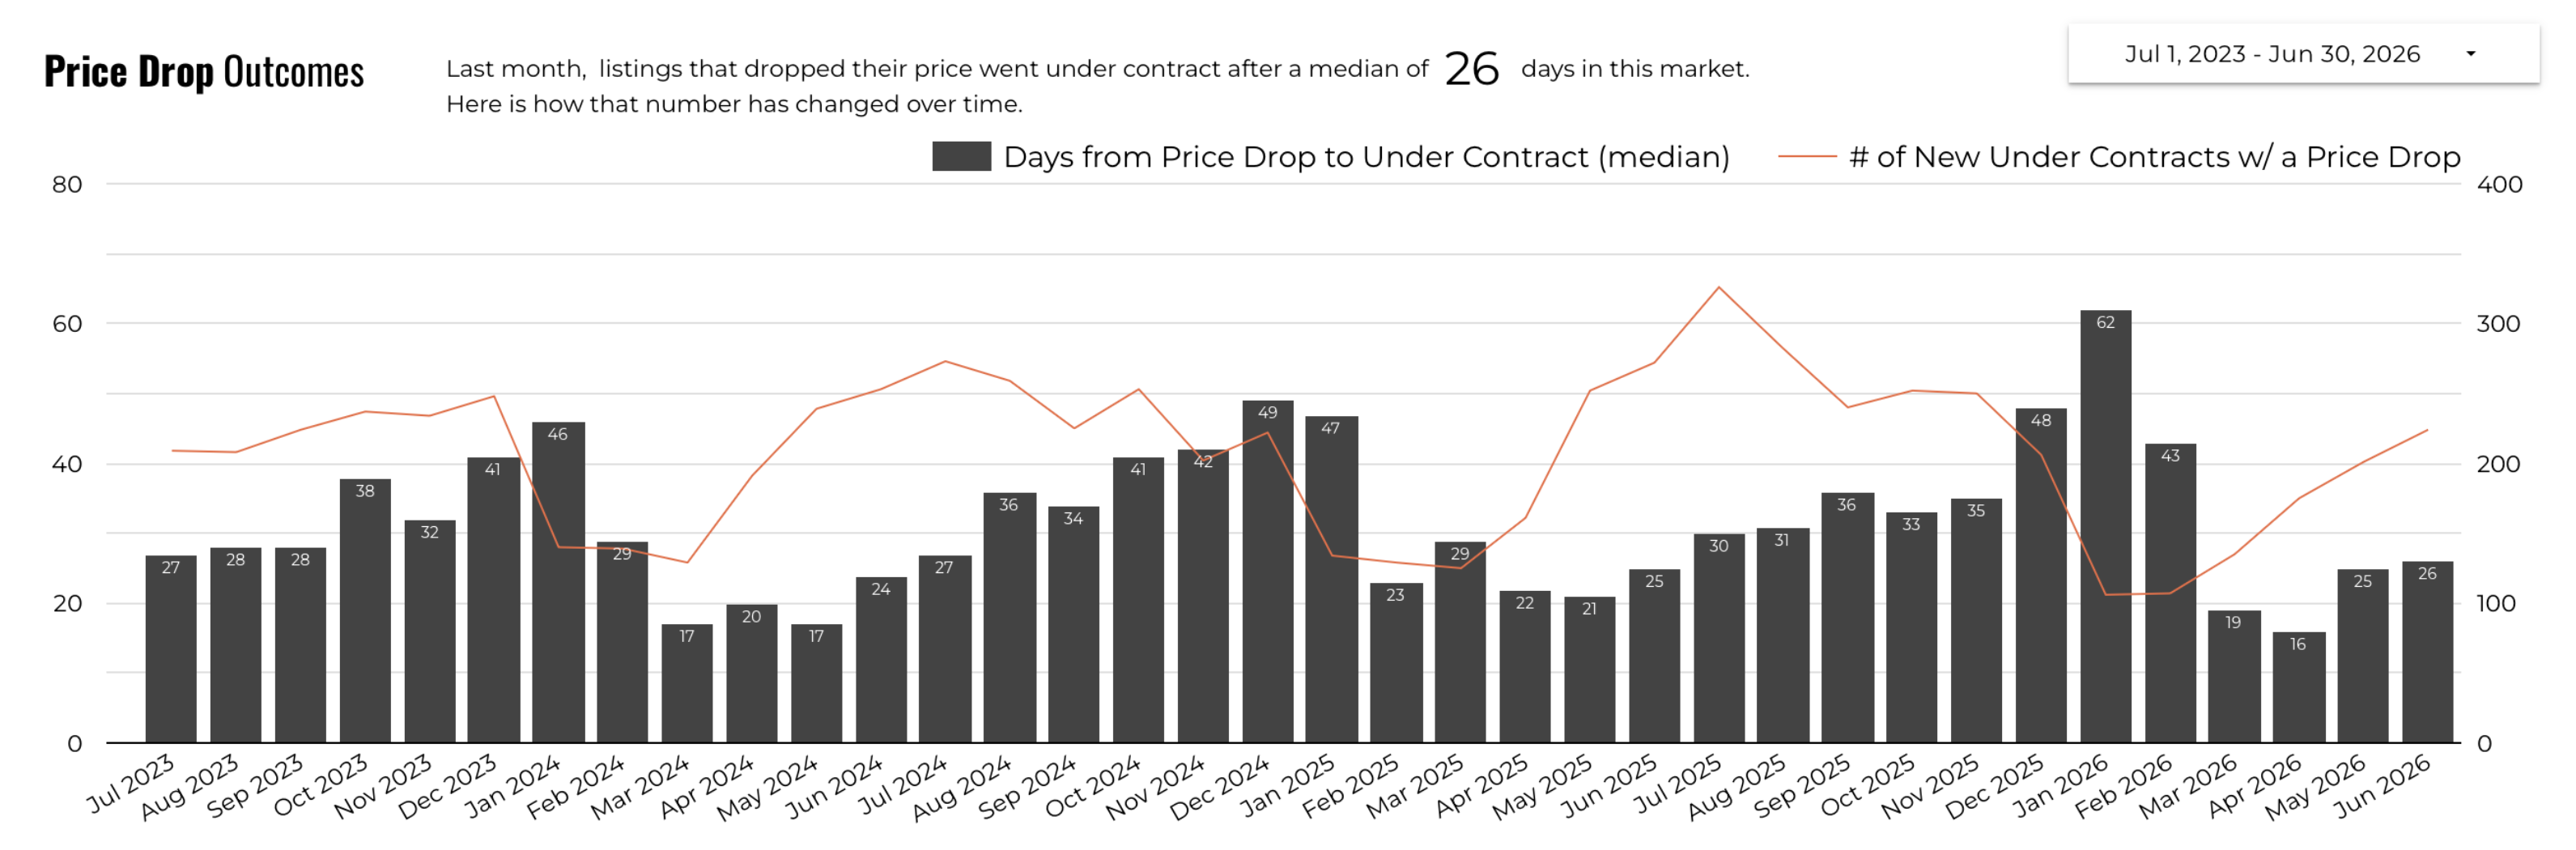
Listings that reduced their price in June 2026 went under contract after a median of 26 days following the price cut. That is a healthy outcome, indicating that price reductions are effective at re-engaging buyers. The chart shows this figure has dropped significantly from the 48 to 62-day ranges seen in late 2025 and early 2026, when the market was slower to respond even after sellers made concessions.
The number of new under contracts with a price drop (the orange line) has been rising steadily through 2026, which is consistent with more homes taking price reductions and buyers responding to the adjusted pricing. The combination of a shorter time-to-contract after a cut and a growing number of price-reduced homes finding buyers is a healthy signal for overall market liquidity.
If you are a seller whose home has been on the market for more than three weeks without an offer, the price drop outcomes data provides a useful benchmark: a well-calibrated reduction can re-engage the market in about 26 days. The key is making the cut meaningful enough to attract fresh attention rather than just clipping a small amount that buyers may not notice.
New Luxury Listings Dipped to 472 in June After Spring Peak
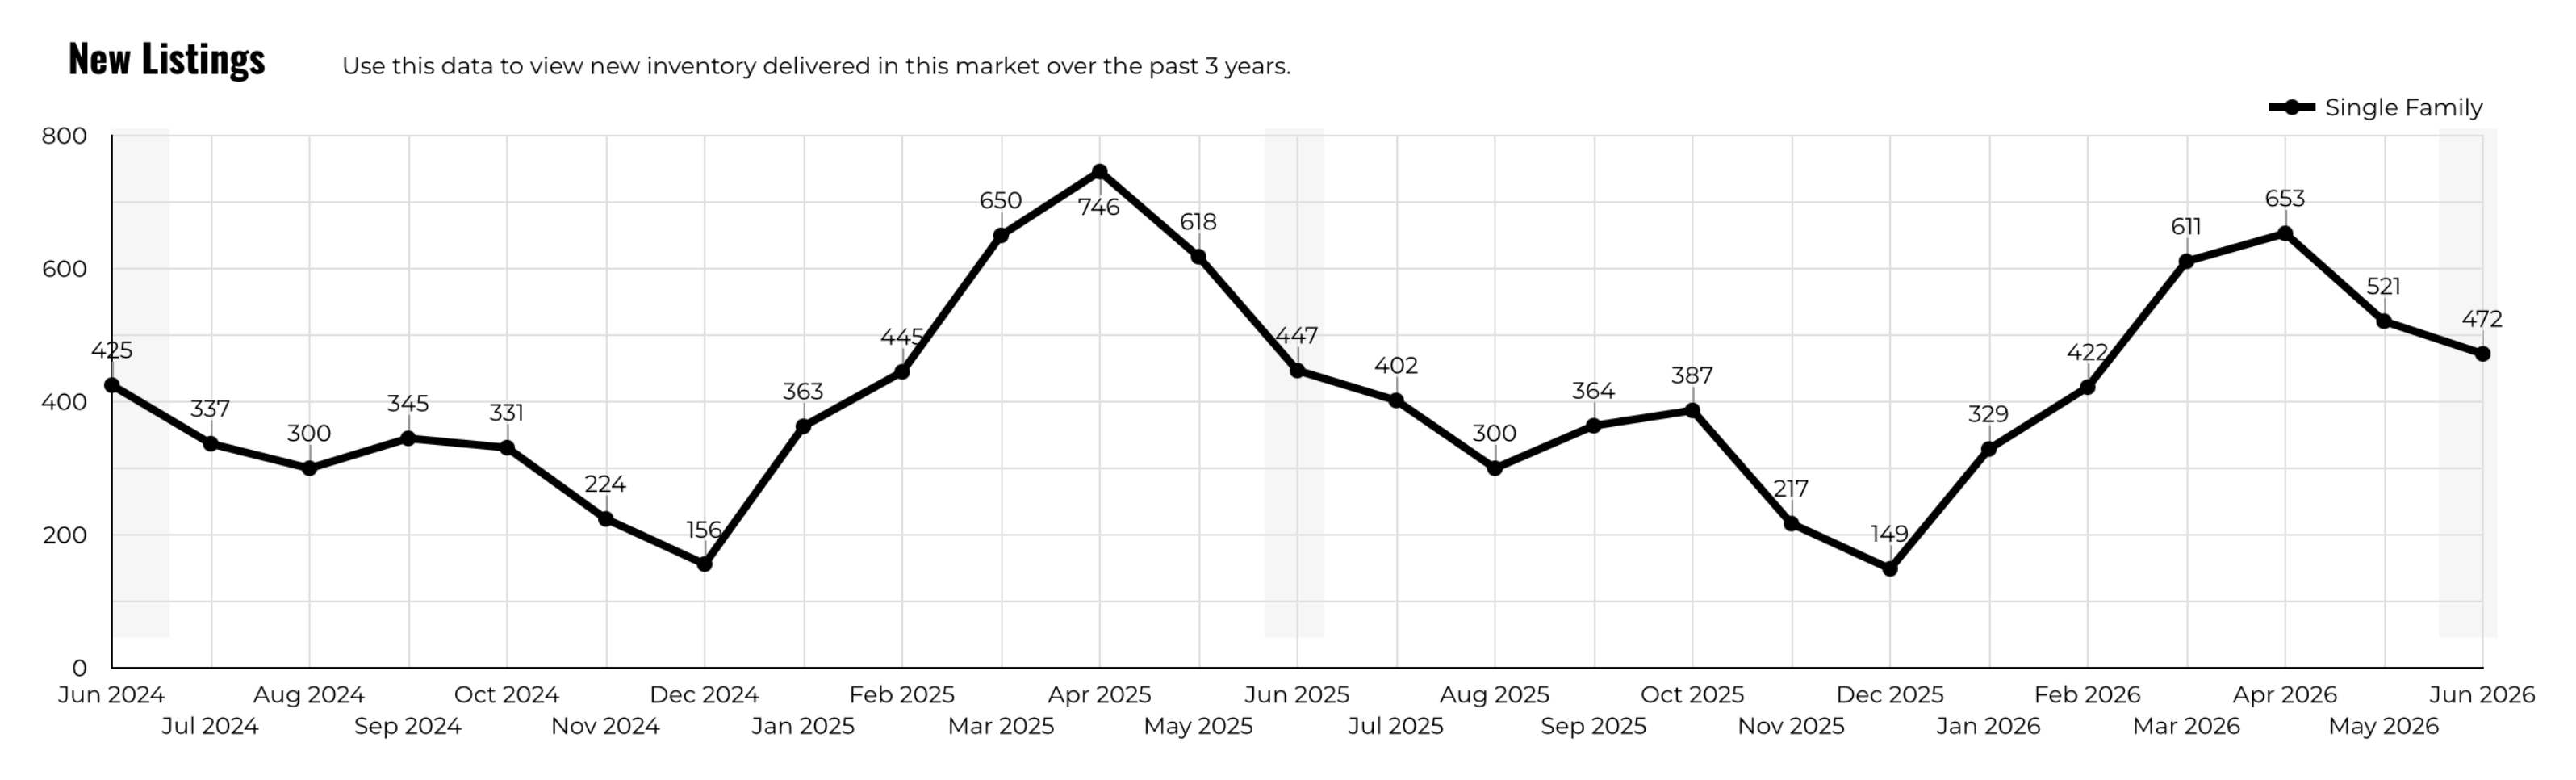
New luxury listings came in at 472 for June 2026, down from the spring peak of 653 in April and 521 in May, but up 5.6% from June 2025's figure. The seasonal pattern is consistent: the market floods with new listings in March through May, then supply moderates through summer as sellers who did not sell in the peak window either reduce or wait.
Looking at the 3-year chart, the 472 June reading compares favorably to June 2025 (approximately 447 new listings from the chart) and June 2024 (approximately 618), reflecting a more measured pace of new supply entering the market compared to the inventory surge of 2024. Fewer new listings relative to recent years means buyers have less fresh competition arriving each month, which can help existing listings gain traction.
For sellers considering whether to list in summer, the reduced new listing competition relative to spring is a legitimate reason to move forward. Yes, buyer traffic tends to slow in July and August, but so does competition. A well-priced home entering a less crowded July market may perform better than one that got lost in the May supply wave.
New Under Contracts at 262: Demand Holding After Spring Surge
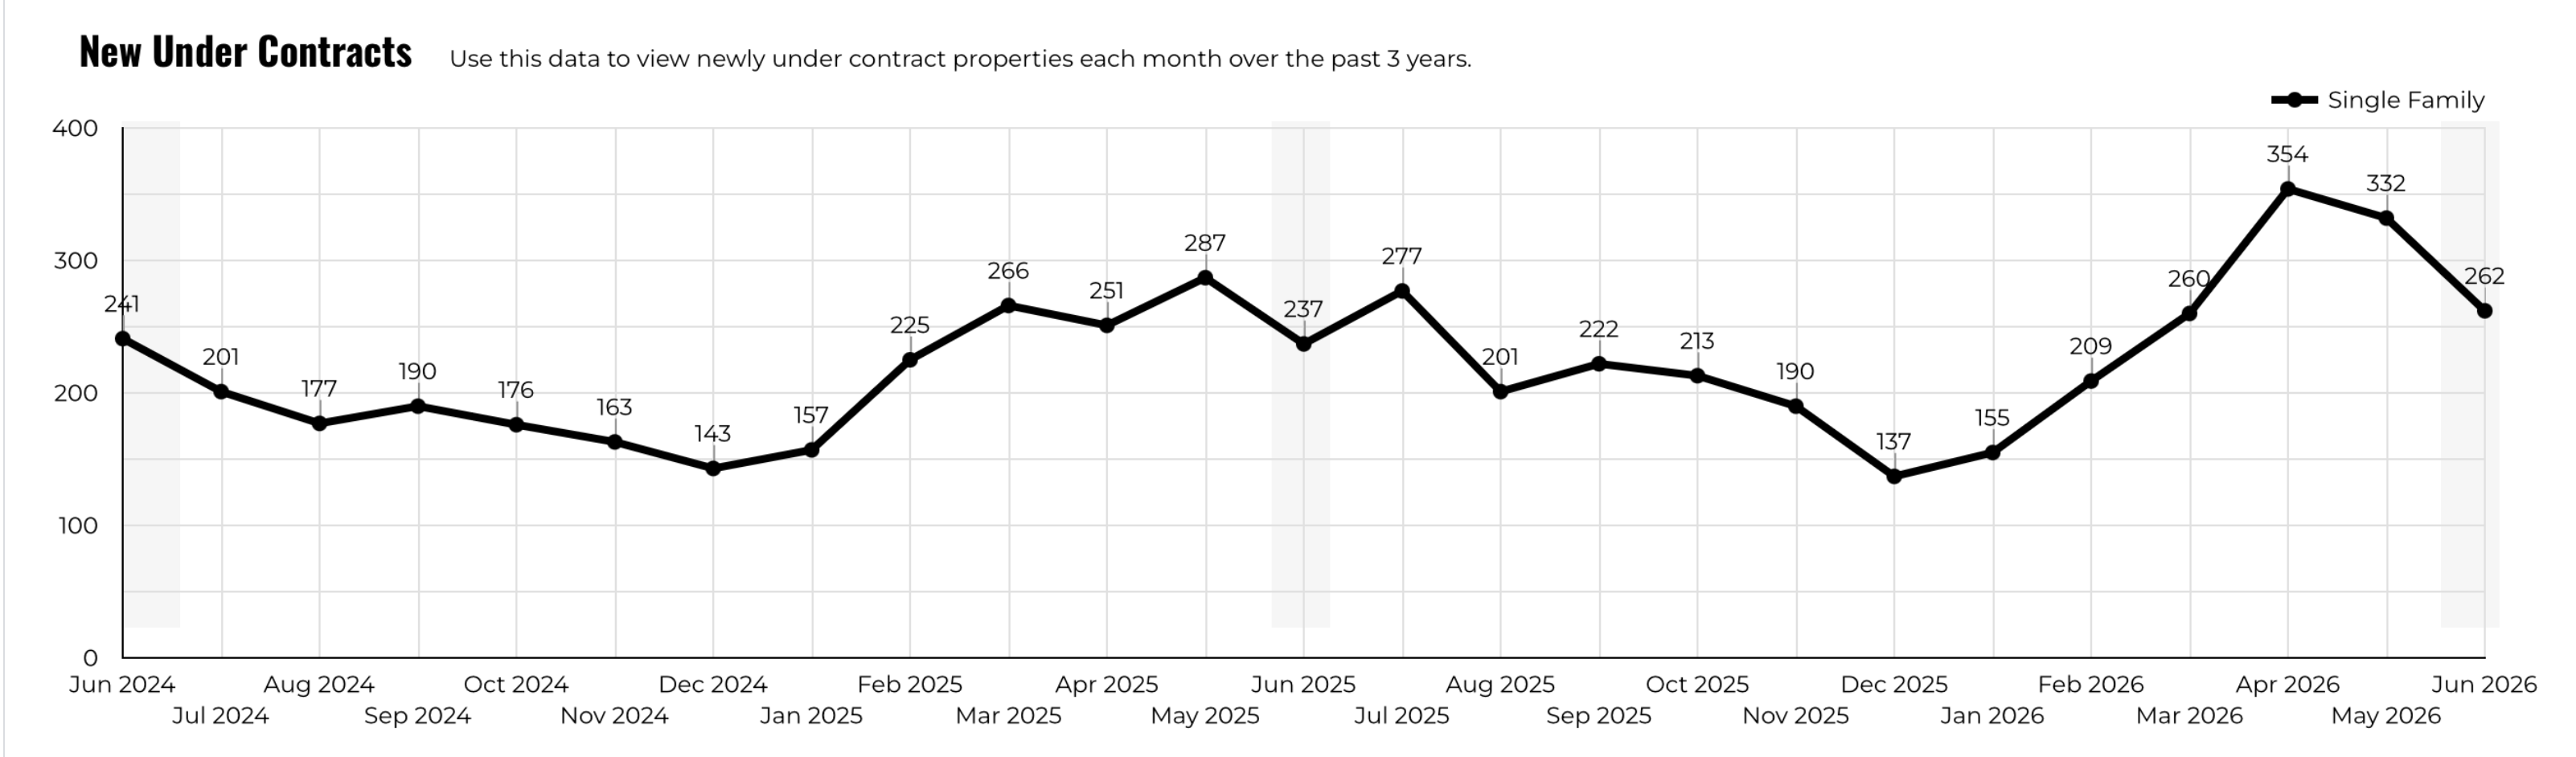
New under contracts for June 2026 came in at 262, down from the 354 peak in April and the 332 in May, but up 10.5% from June 2025. This moderation is expected after a strong spring, and the year-over-year improvement confirms that 2026 buyer activity is running ahead of 2025 on a sustained basis, not just a one-month spike.
The 3-year chart shows June 2024 produced approximately 237 under contracts, June 2025 approximately 237 as well (from the chart values), and June 2026 reached 262. That is a meaningful step forward. These under contracts represent July closings in progress, which means July's closed sales report should continue to reflect healthy activity even if it does not match June's exceptional volume.
Taken together, the new listings and new under contracts data tells you the Austin luxury market is working through its spring momentum in an orderly way. Supply and demand are both moderating in parallel, which is the healthiest outcome for price stability heading into the second half of 2026.
Buyer Demand by Price Range: The $1.2M to $1.39M Tier Is the Most Competitive
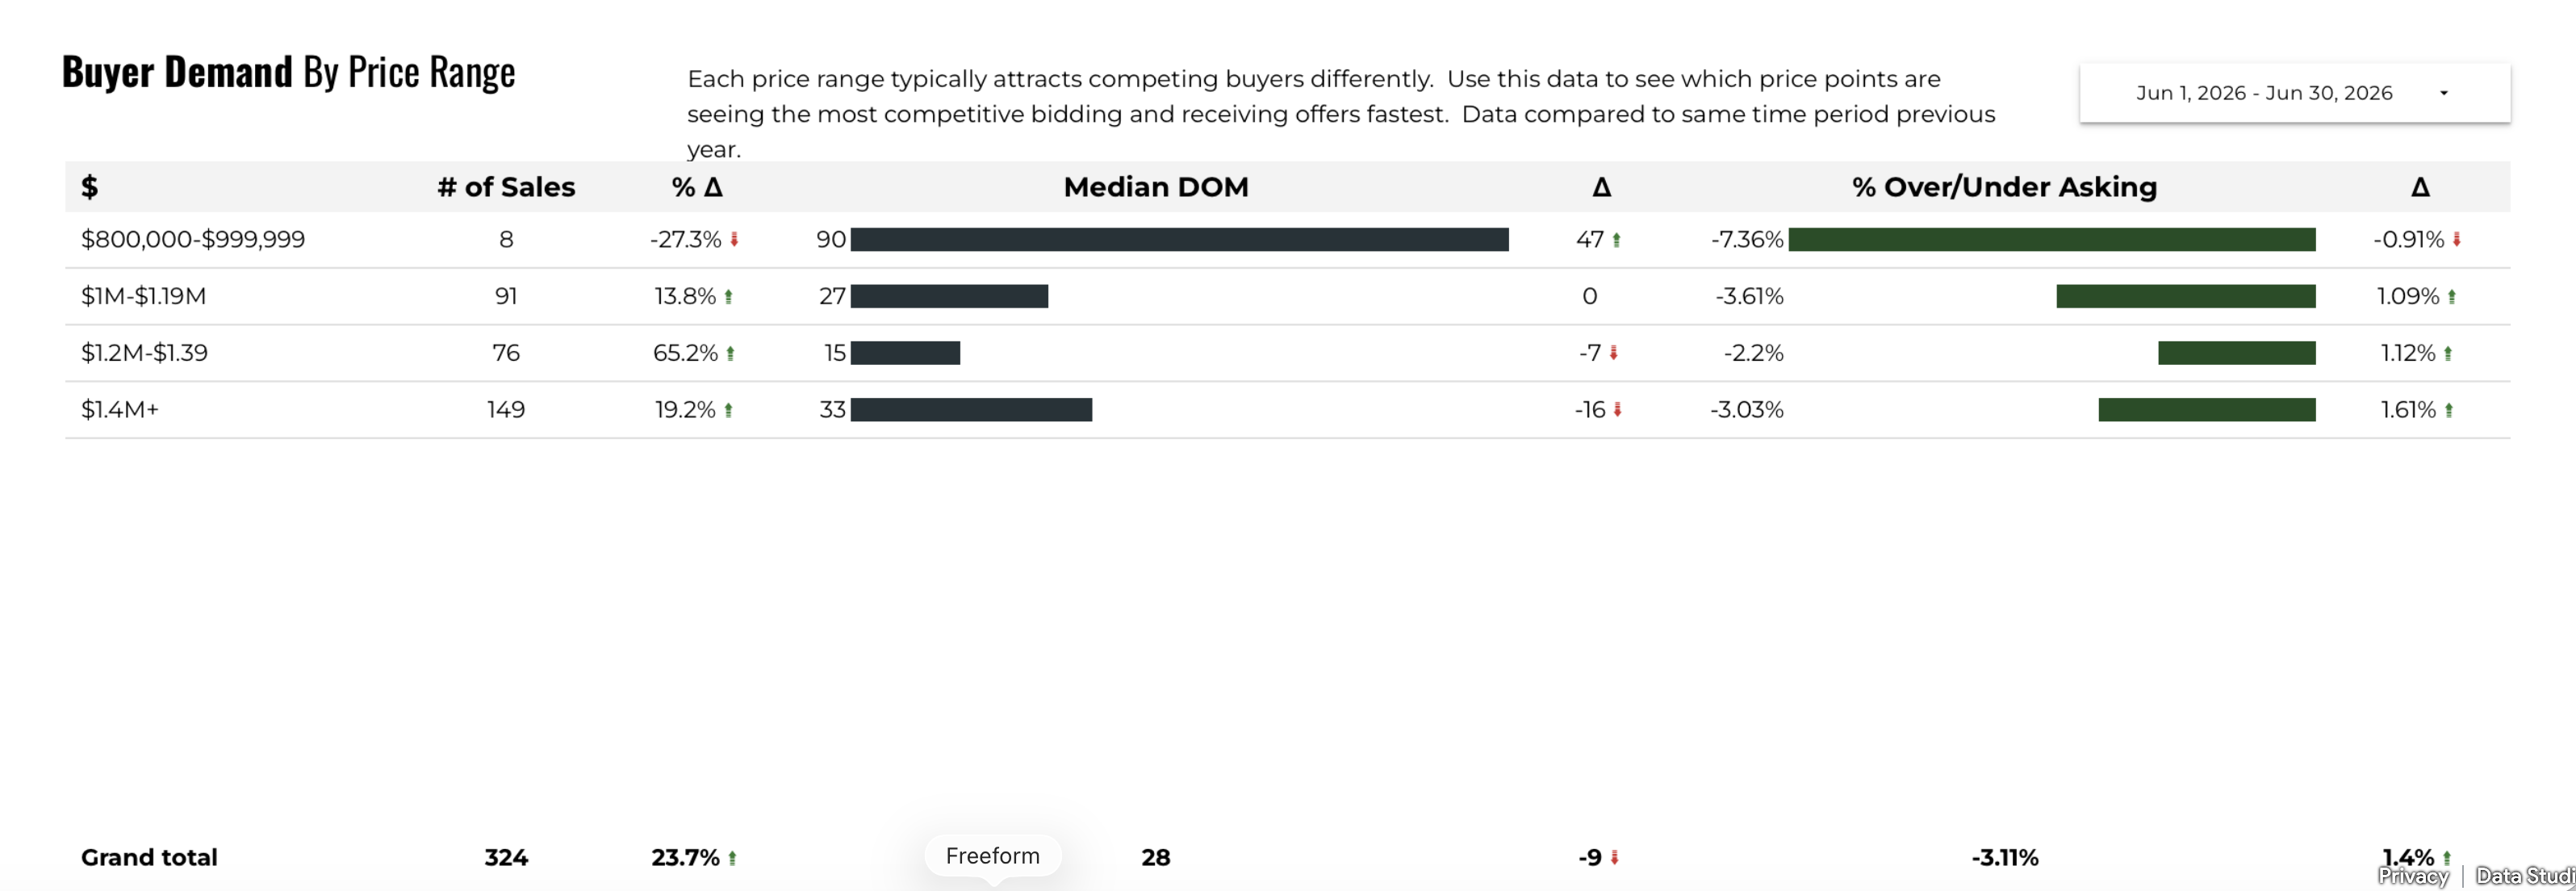
The buyer demand by price range breakdown for June 2026 reveals important differences across the luxury spectrum. The $1.2M to $1.39M tier saw a 65.2% year-over-year increase in sales, the strongest growth of any segment, with a median of just 15 days on market and buyers closing at about 2.2% under asking. This is where demand is most concentrated right now and where buyers face the most competition.
The $1.4M and above tier showed 19.2% year-over-year sales growth with a median of 33 days and buyers landing about 3.03% under asking. The entry-level luxury tier of $1M to $1.19M grew 13.8% year over year with a median of 27 days and a 3.61% average discount to asking. Each segment has its own supply, demand, and negotiation dynamic, and buyers should understand which bucket they are shopping in before calibrating their expectations.
One figure that stands out in the table is the $800,000 to $999,999 tier, which technically sits below the luxury threshold but shows up in this comparison for context. It experienced a 27.3% decline in year-over-year sales and a median of 90 days on market, suggesting that the sub-million segment near the luxury floor is seeing slower traffic than the segments above it. For sellers in the upper $900,000s, crossing into the $1M range with the right pricing strategy may actually open you up to a larger, more active buyer pool.
Buyer Negotiating Terms Improving for Sellers Through 2026
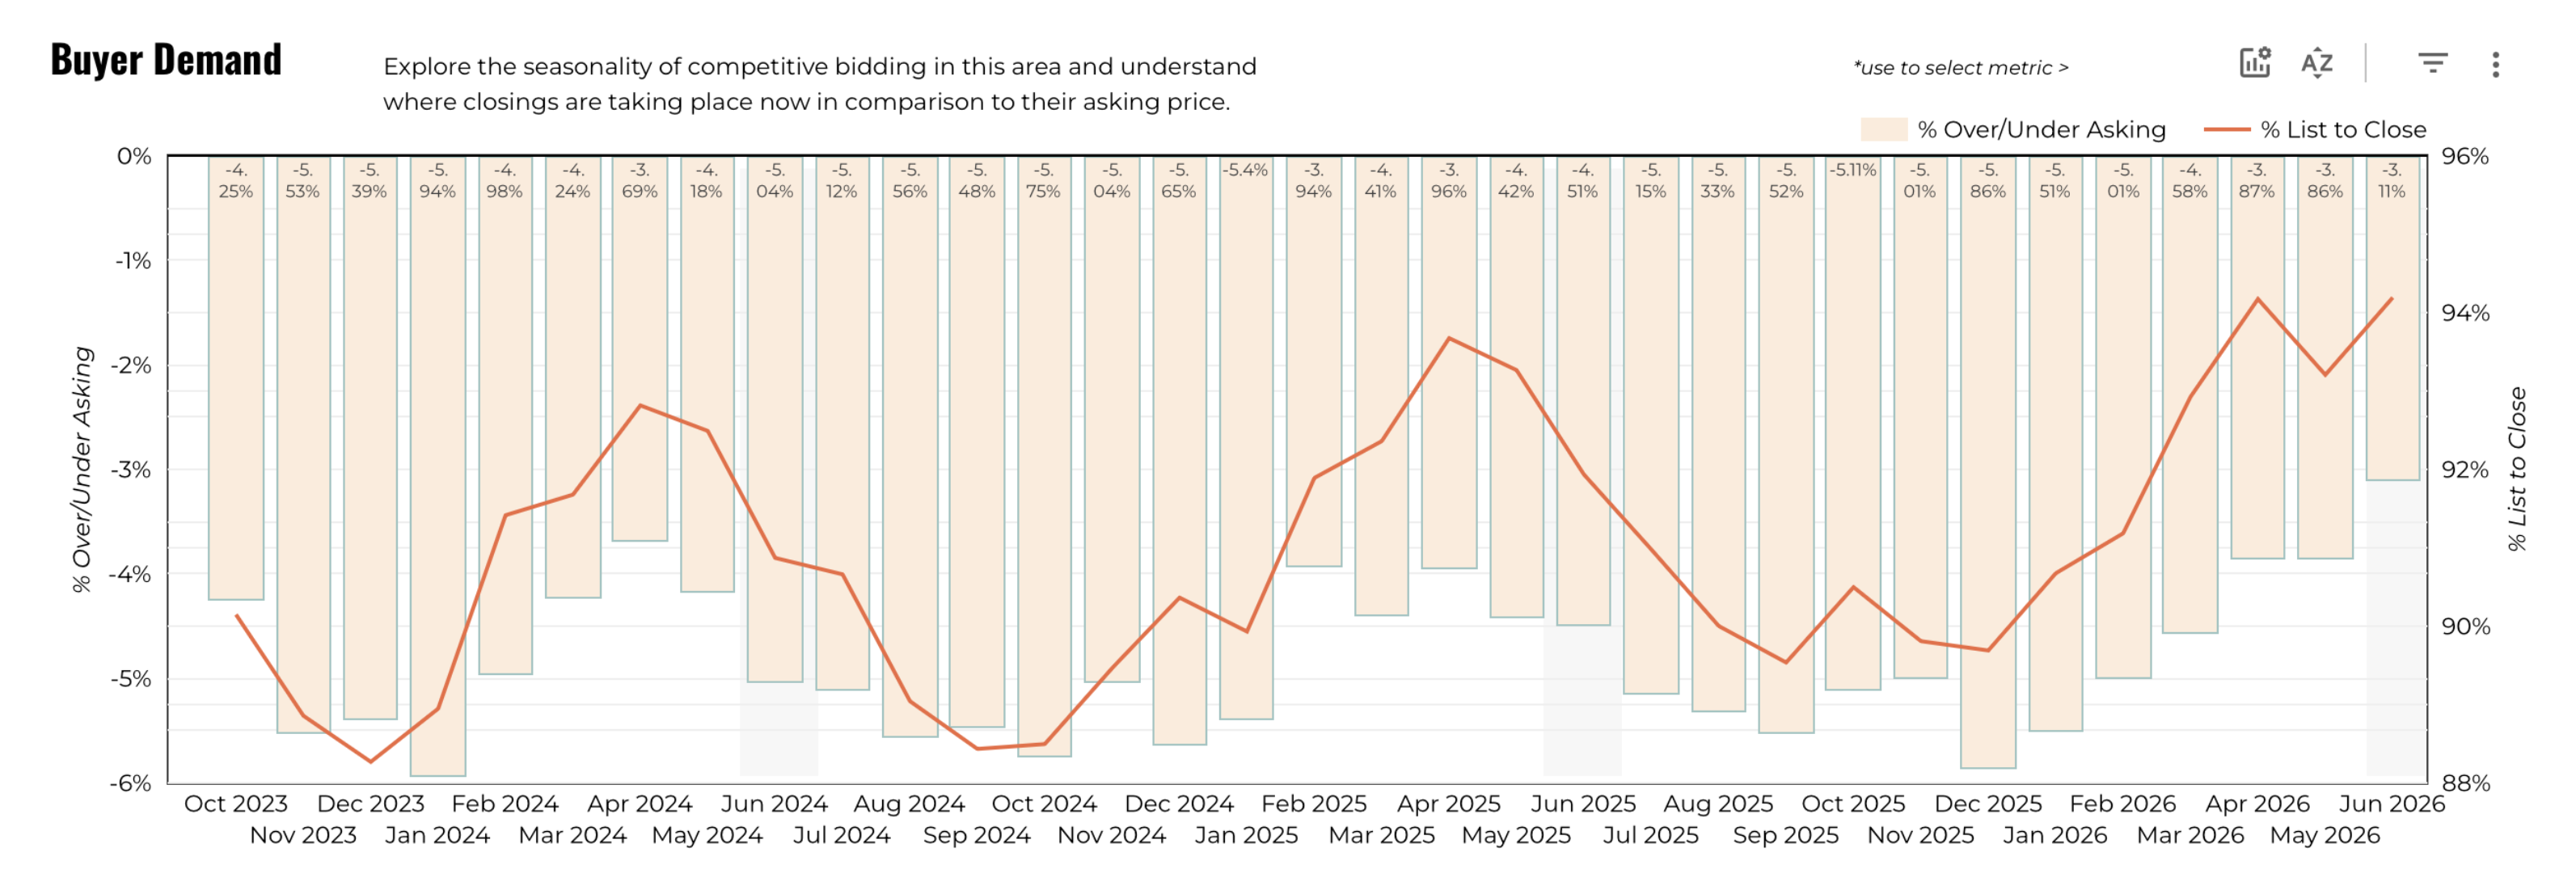
The buyer demand 3-year history chart tracks the percentage over or under asking that buyers are paying (shown as bars) alongside the percentage of list price received at close (the orange line). Both metrics have been improving for sellers through 2026. The percentage over/under asking has moved from the 5% to 6% under-asking range in late 2024 to approximately 3.1% under asking in June 2026, a meaningful shift that tells you buyers are paying closer to asking price than they were 18 months ago.
The list-to-close percentage line (right axis) shows a similar improvement, rising to approximately 94% in June 2026 from lows near 90% in 2024. For sellers, this trend means you are leaving less money on the table than in recent years, provided your pricing is grounded in current comparable sales rather than peak-market expectations.
Buyers who purchased luxury homes in 2024 may have become accustomed to a market where 5% to 6% discounts were routine. That gap has closed. The trend toward tighter negotiating margins is likely to continue as sales volume grows, so buyers who are waiting for the market to soften further may find the window has already narrowed.
All Three Counties Favoring Buyers Slightly, With Travis Moving Fastest
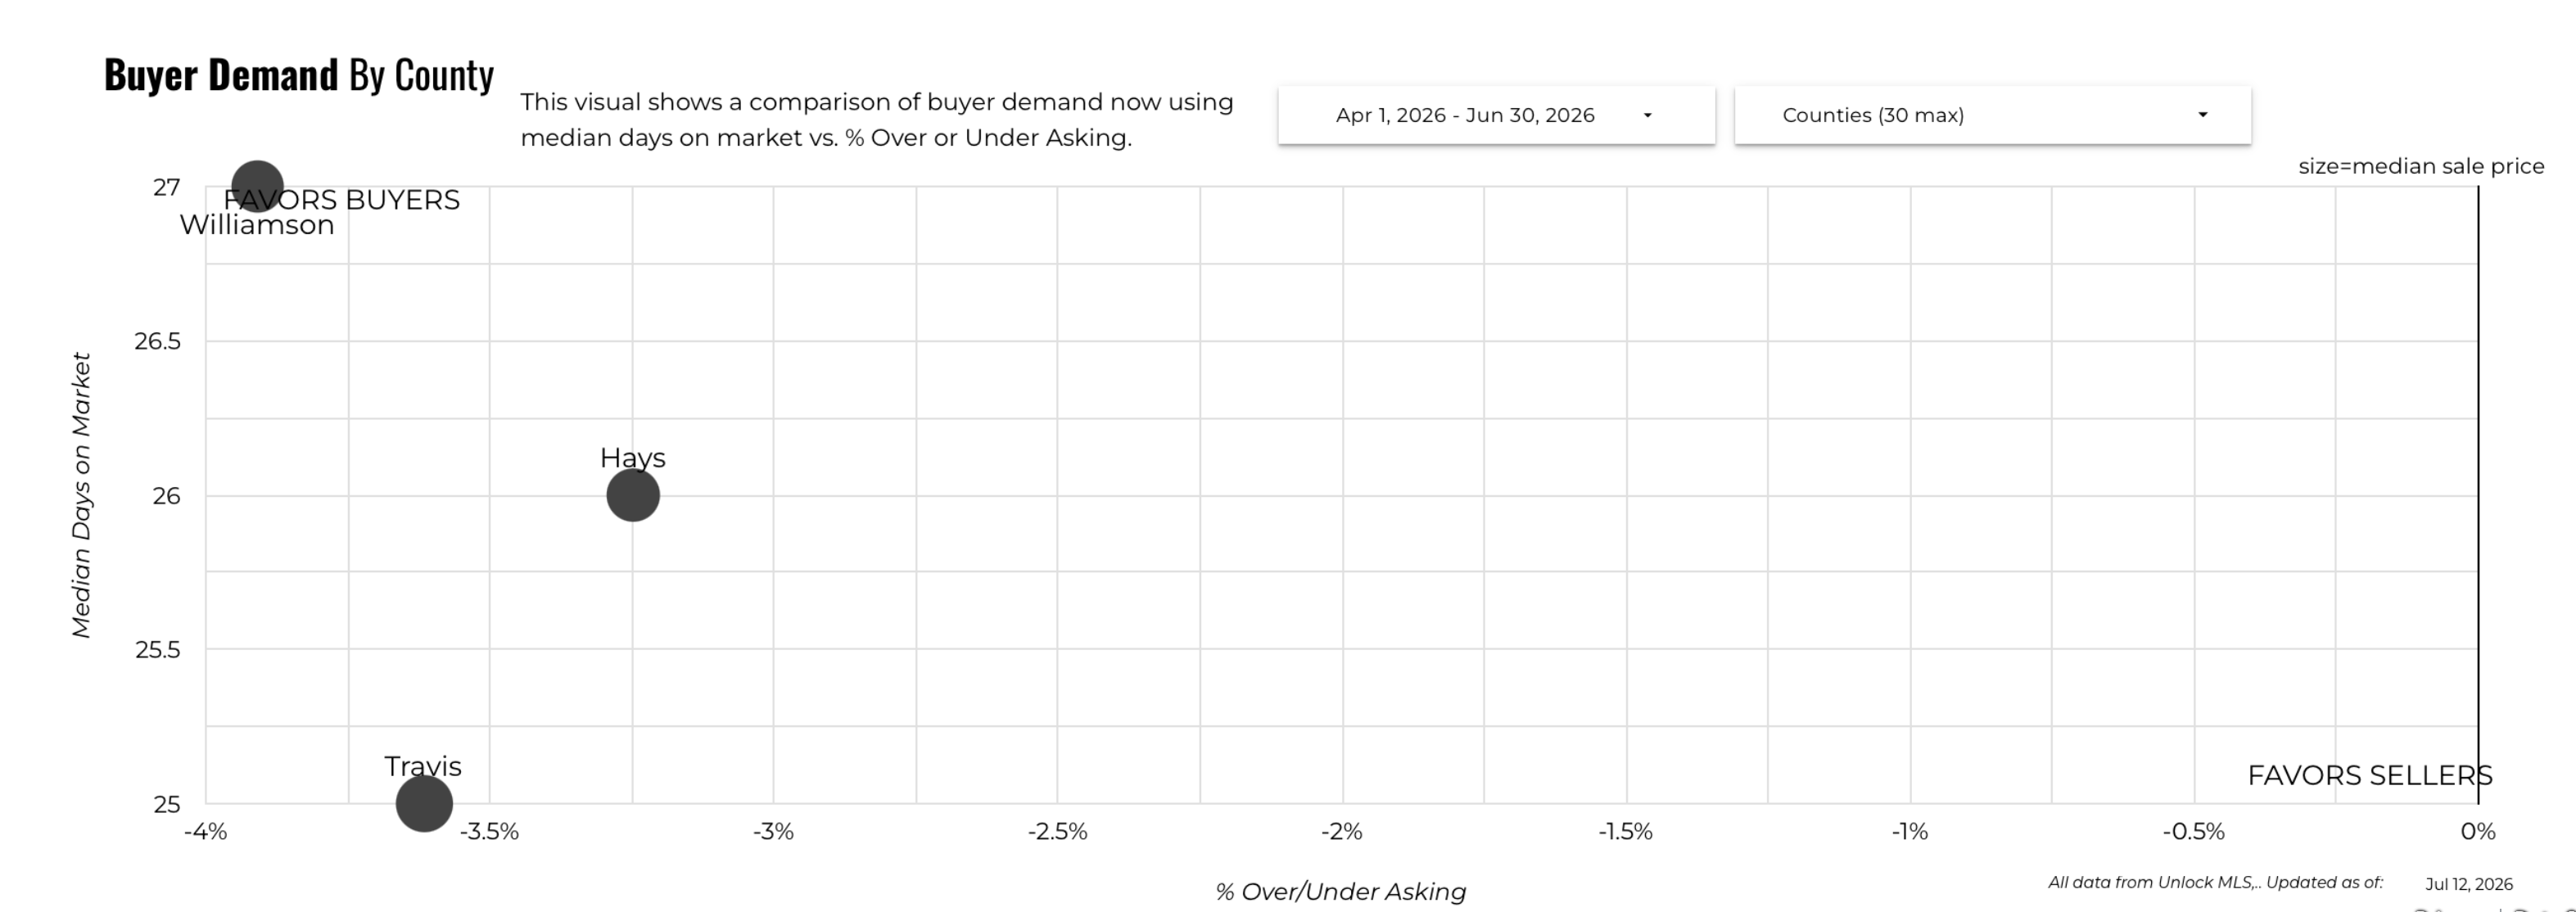
The buyer demand by county chart compares median days on market against percentage over or under asking for Travis, Williamson, and Hays Counties over the April through June 2026 period. All three counties fall in the "favors buyers" quadrant of the chart, meaning homes are selling under asking price and taking more than a minimal number of days to close. However, the differences between counties are revealing.
Travis County shows a median of approximately 25 days and a roughly 3.5% discount to asking, placing it as the fastest-moving and most competitive of the three. Hays County sits at about 26 days and roughly 3.2% under asking, very close to Travis in pace. Williamson County shows a median of about 27 days with a slightly larger discount to asking at approximately 4%, making it the most buyer-favorable county of the three over this period.
If you are a buyer with geographic flexibility across the three counties, the data suggests Williamson County offers slightly more negotiating room on a relative basis, while Travis County's pace and competition require a more decisive approach. For sellers in Williamson County, understanding that buyers are pricing in a bit more discount than in Travis is important context for setting your initial list price.
Price Per Square Foot: Travis County at $512, Hays at $416, Williamson at $308
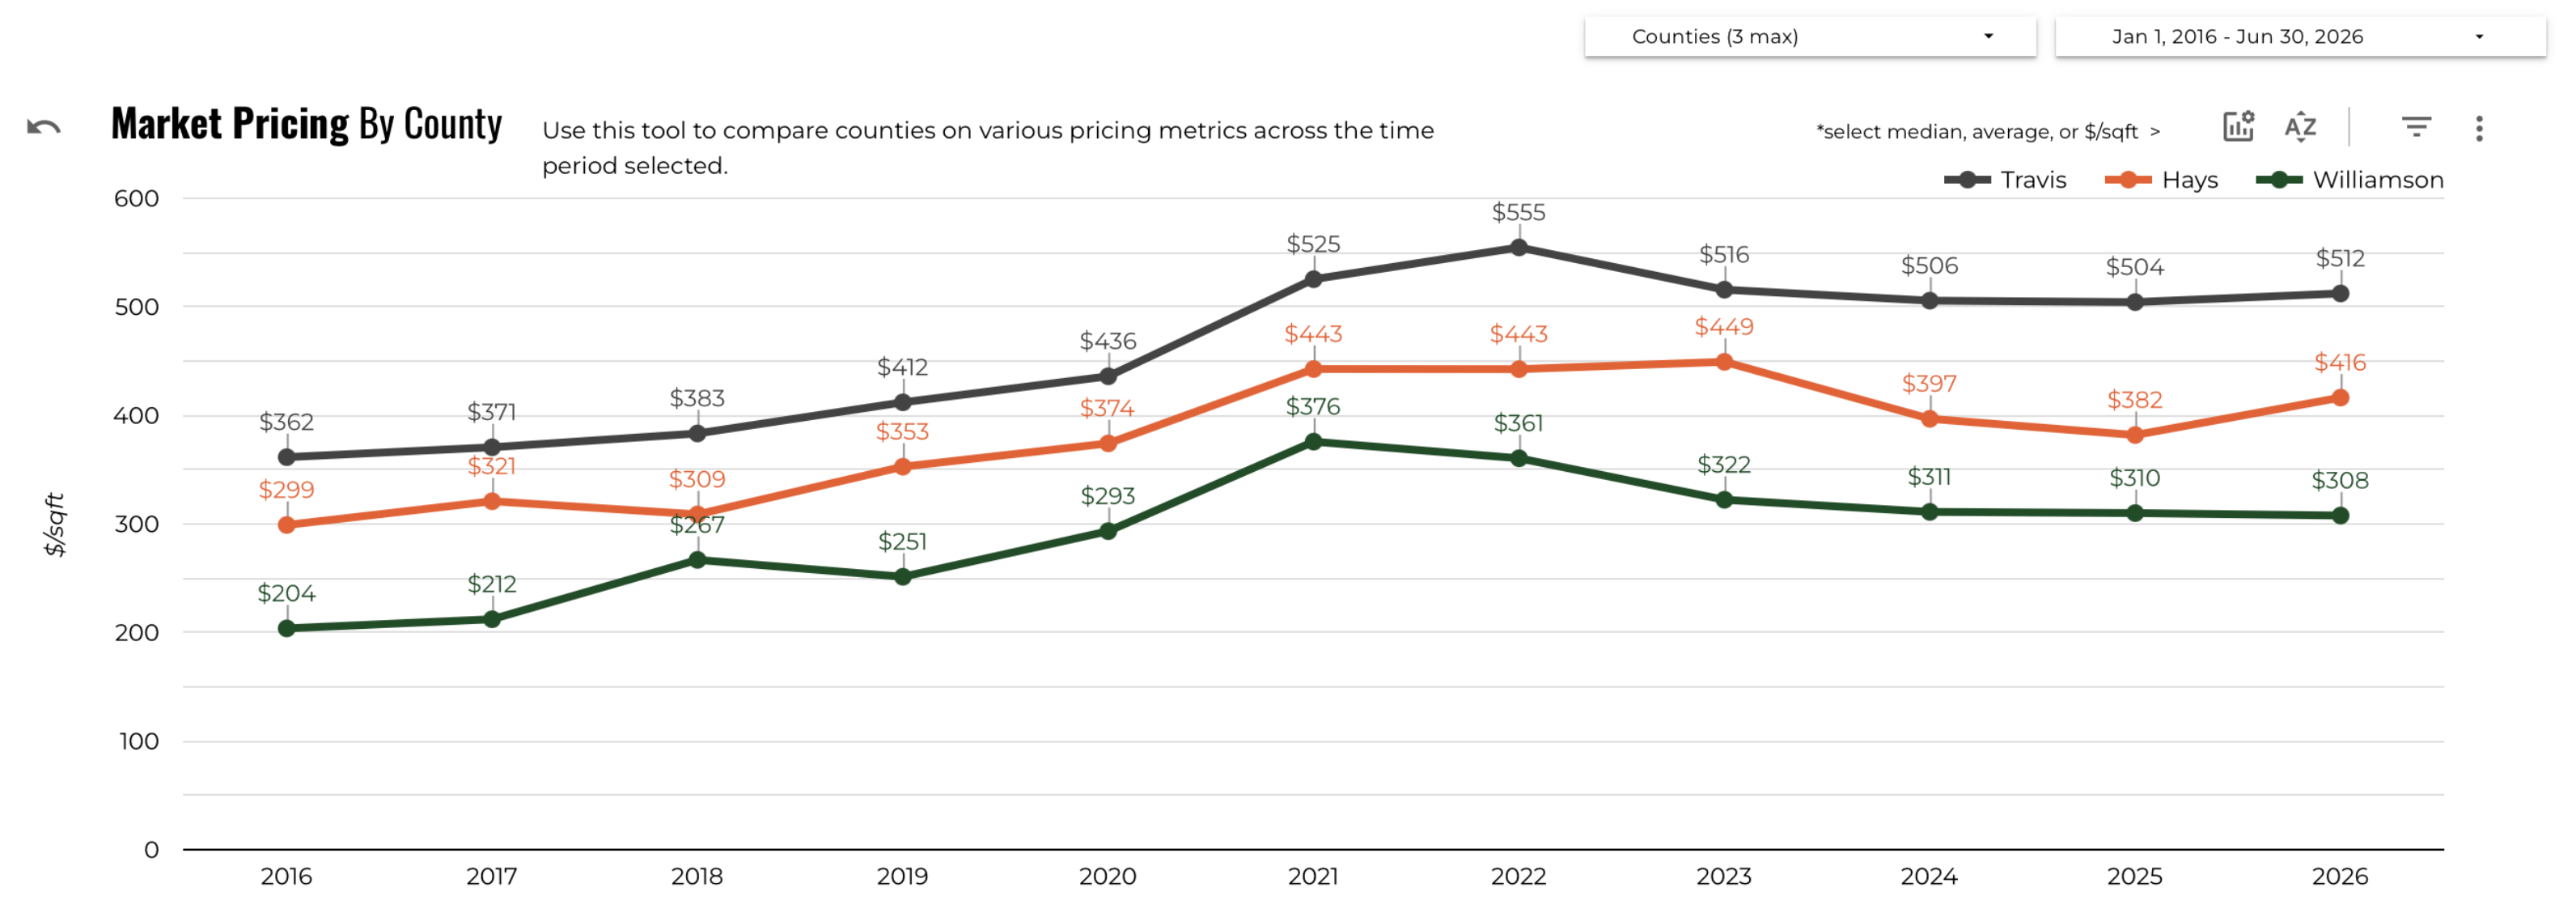
The price per square foot by county chart covering 2016 through 2026 shows Travis County leading at $512 per square foot in 2026, followed by Hays County at $416 and Williamson County at $308. Travis County has held the premium position throughout the decade, reflecting the concentration of high-demand neighborhoods, limited buildable land, and strong location fundamentals in central and west Austin.
All three counties show a similar pattern: a sharp run-up from 2020 through 2022, a peak in 2022 or 2023, and a modest correction or plateau since. Travis County peaked around $555 per square foot in 2022 and has settled at $512 in 2026. Hays County peaked near $449 in 2023 and has pulled back to $416. Williamson County peaked at $361 in 2022 and now sits at $308, the deepest relative correction of the three.
For buyers comparing value across counties, Williamson County's $308 per square foot represents a meaningful discount to Travis's $512, though the tradeoff is typically distance from central Austin employment and amenities. Hays County at $416 offers a middle ground, particularly for buyers drawn to the Hill Country communities of Dripping Springs, Wimberley, and Driftwood.
Median Sold Price by County: Travis at $1.44M, Hays at $1.25M, Williamson at $1.15M
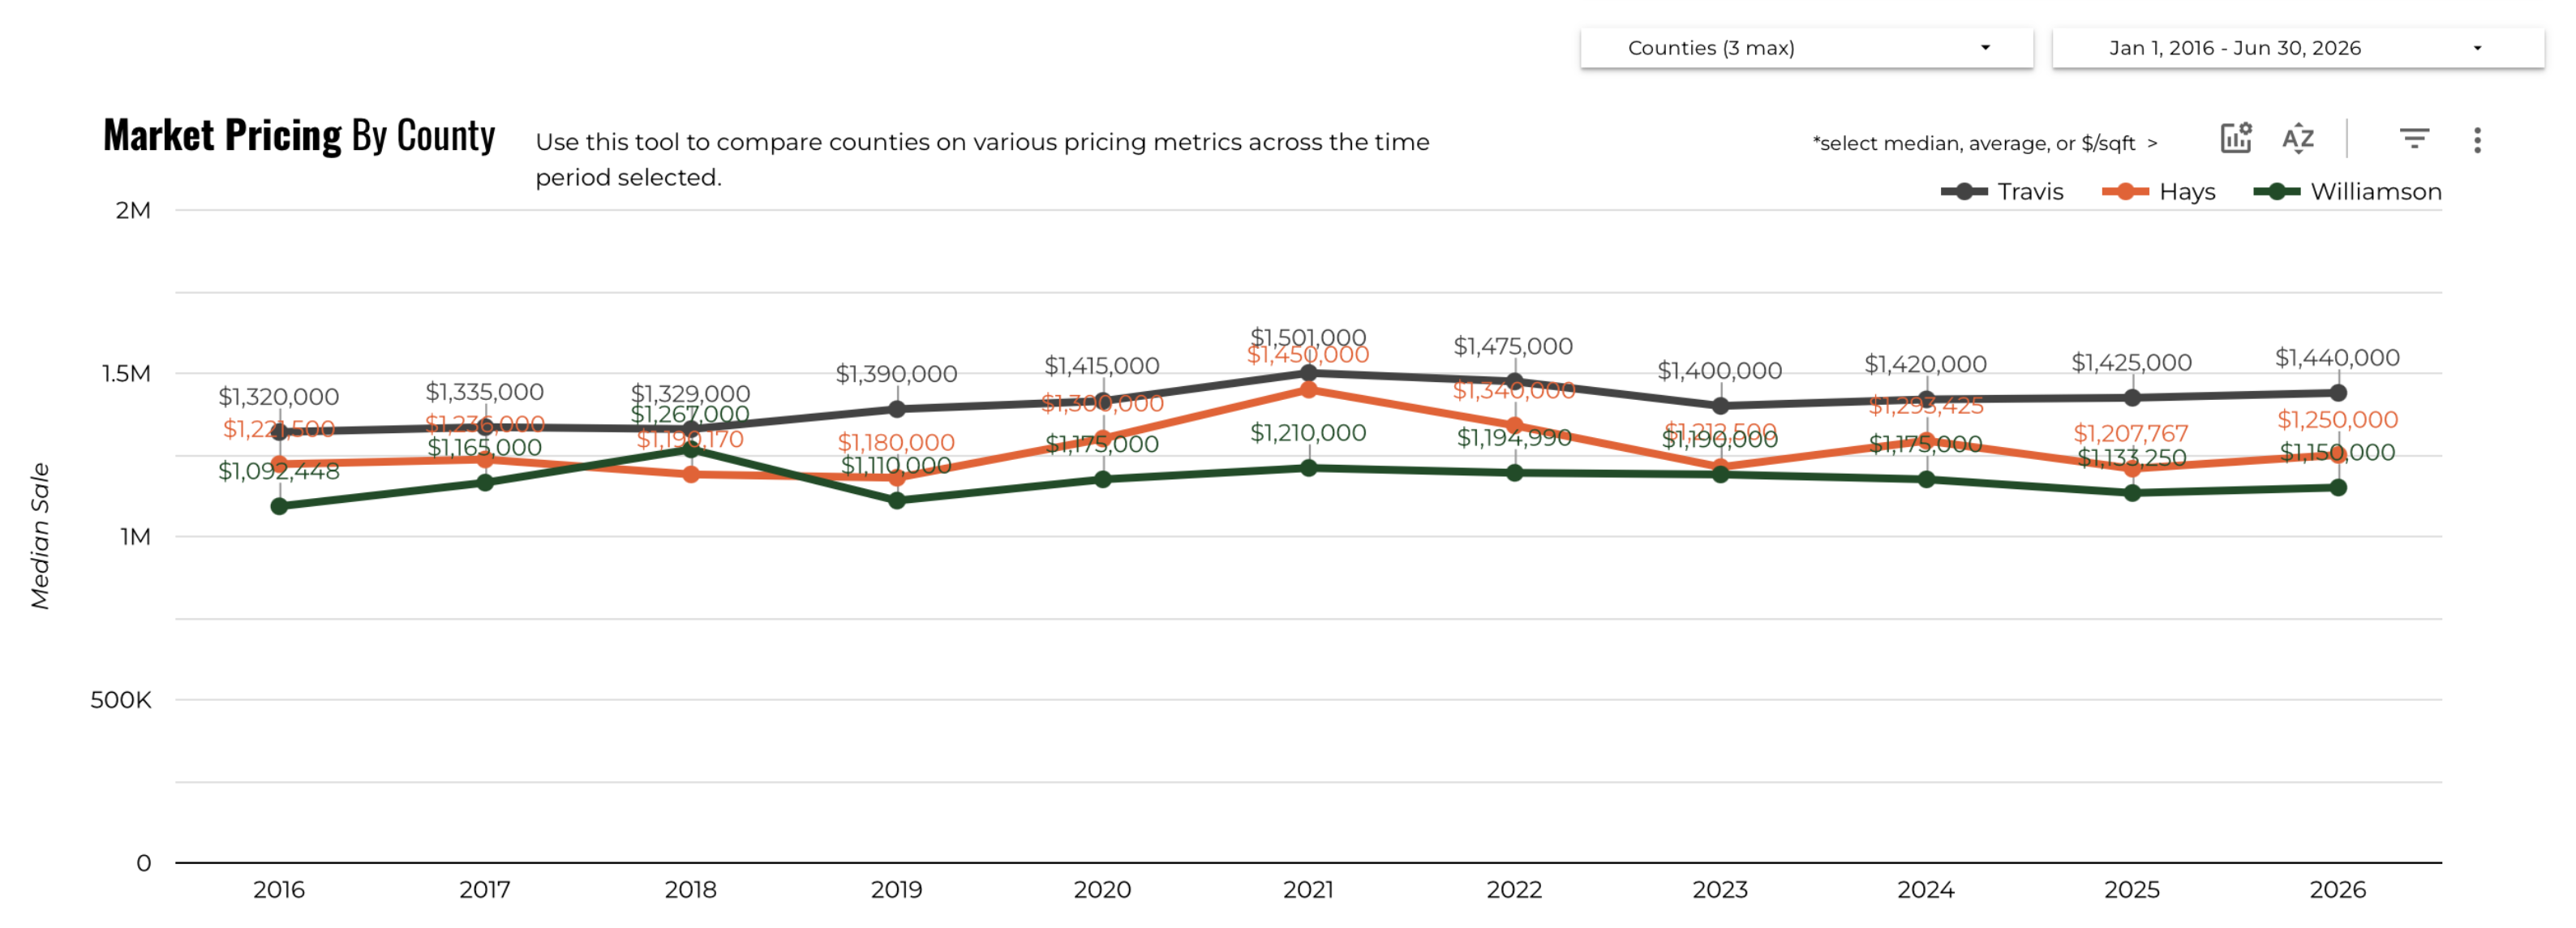
The median sale price by county chart shows Travis County leading at $1,440,000 in 2026 (through June), Hays County at $1,250,000, and Williamson County at $1,150,000. All three counties are above their 2020 levels, which ranged from approximately $1,110,000 to $1,415,000, confirming that even after the post-peak corrections, values have not retreated to pre-pandemic baselines.
Travis County's 2026 median of $1,440,000 represents a slight recovery from the 2024 level of $1,420,000 and is approaching the 2025 figure of $1,425,000. Hays County's $1,250,000 is a meaningful gain from $1,207,767 in 2025. Williamson County's $1,150,000 is up from $1,133,250 in 2025. Each county is showing modest year-to-date appreciation, which aligns with the overall market's flat-to-slightly-up pricing story.
For sellers, these county-level medians are a useful starting point for understanding where the market sets prices. A luxury home in Travis County commands roughly a $290,000 premium over a comparable home in Williamson County on a median basis, and that gap has been remarkably consistent over the past several years.
Median Days on Market by County: All Three Averaging Late 20s to Early 30s
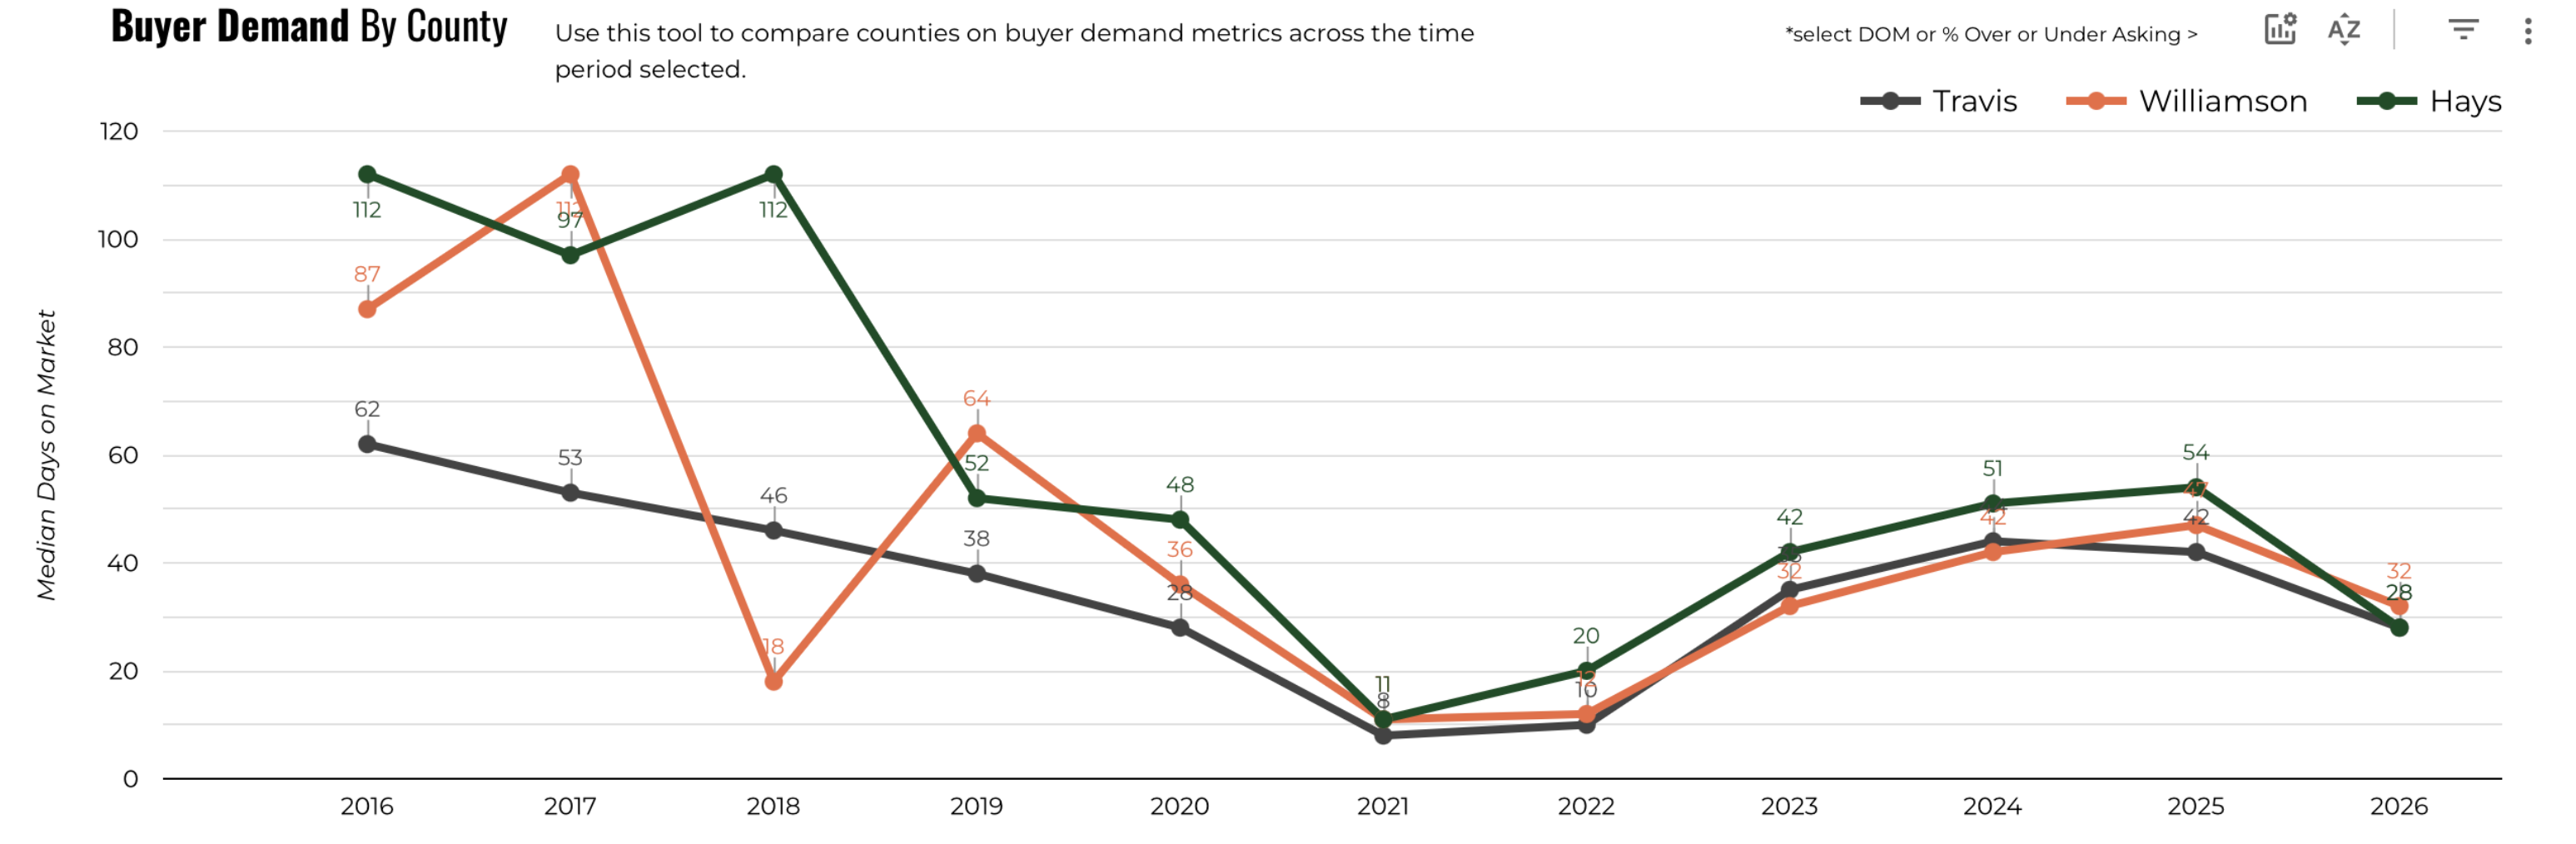
The median days on market by county chart shows all three counties have converged to similar selling speeds in 2026 after years of more varied performance. Travis County is at approximately 28 days, Williamson County at 32 days, and Hays County at 28 days in 2026. This is a dramatic improvement from 2016, when Williamson County median DOM was 112 days and Hays was 112 as well, and Travis was 62 days.
The decade-long chart shows the pandemic-era low of around 10 to 11 days in 2022, the subsequent surge to 42 to 54 days in 2025, and the meaningful recovery in 2026 to the upper 20s to low 30s. This current range represents a normalization toward what might be considered a healthy, functioning luxury market. Homes are not flying off the market in days the way they did in 2021 and 2022, but sellers are not waiting months for contracts either.
Buyers should note that Williamson County's slightly higher median of 32 days compared to Travis's 28 may represent an opportunity. Homes in Williamson County communities like Georgetown and Leander's luxury enclaves are sitting a few days longer, which gives you slightly more time to conduct thorough due diligence before making an offer.
June 2026 Heat Maps: Highest Sales Concentration in West Austin and Lake Travis
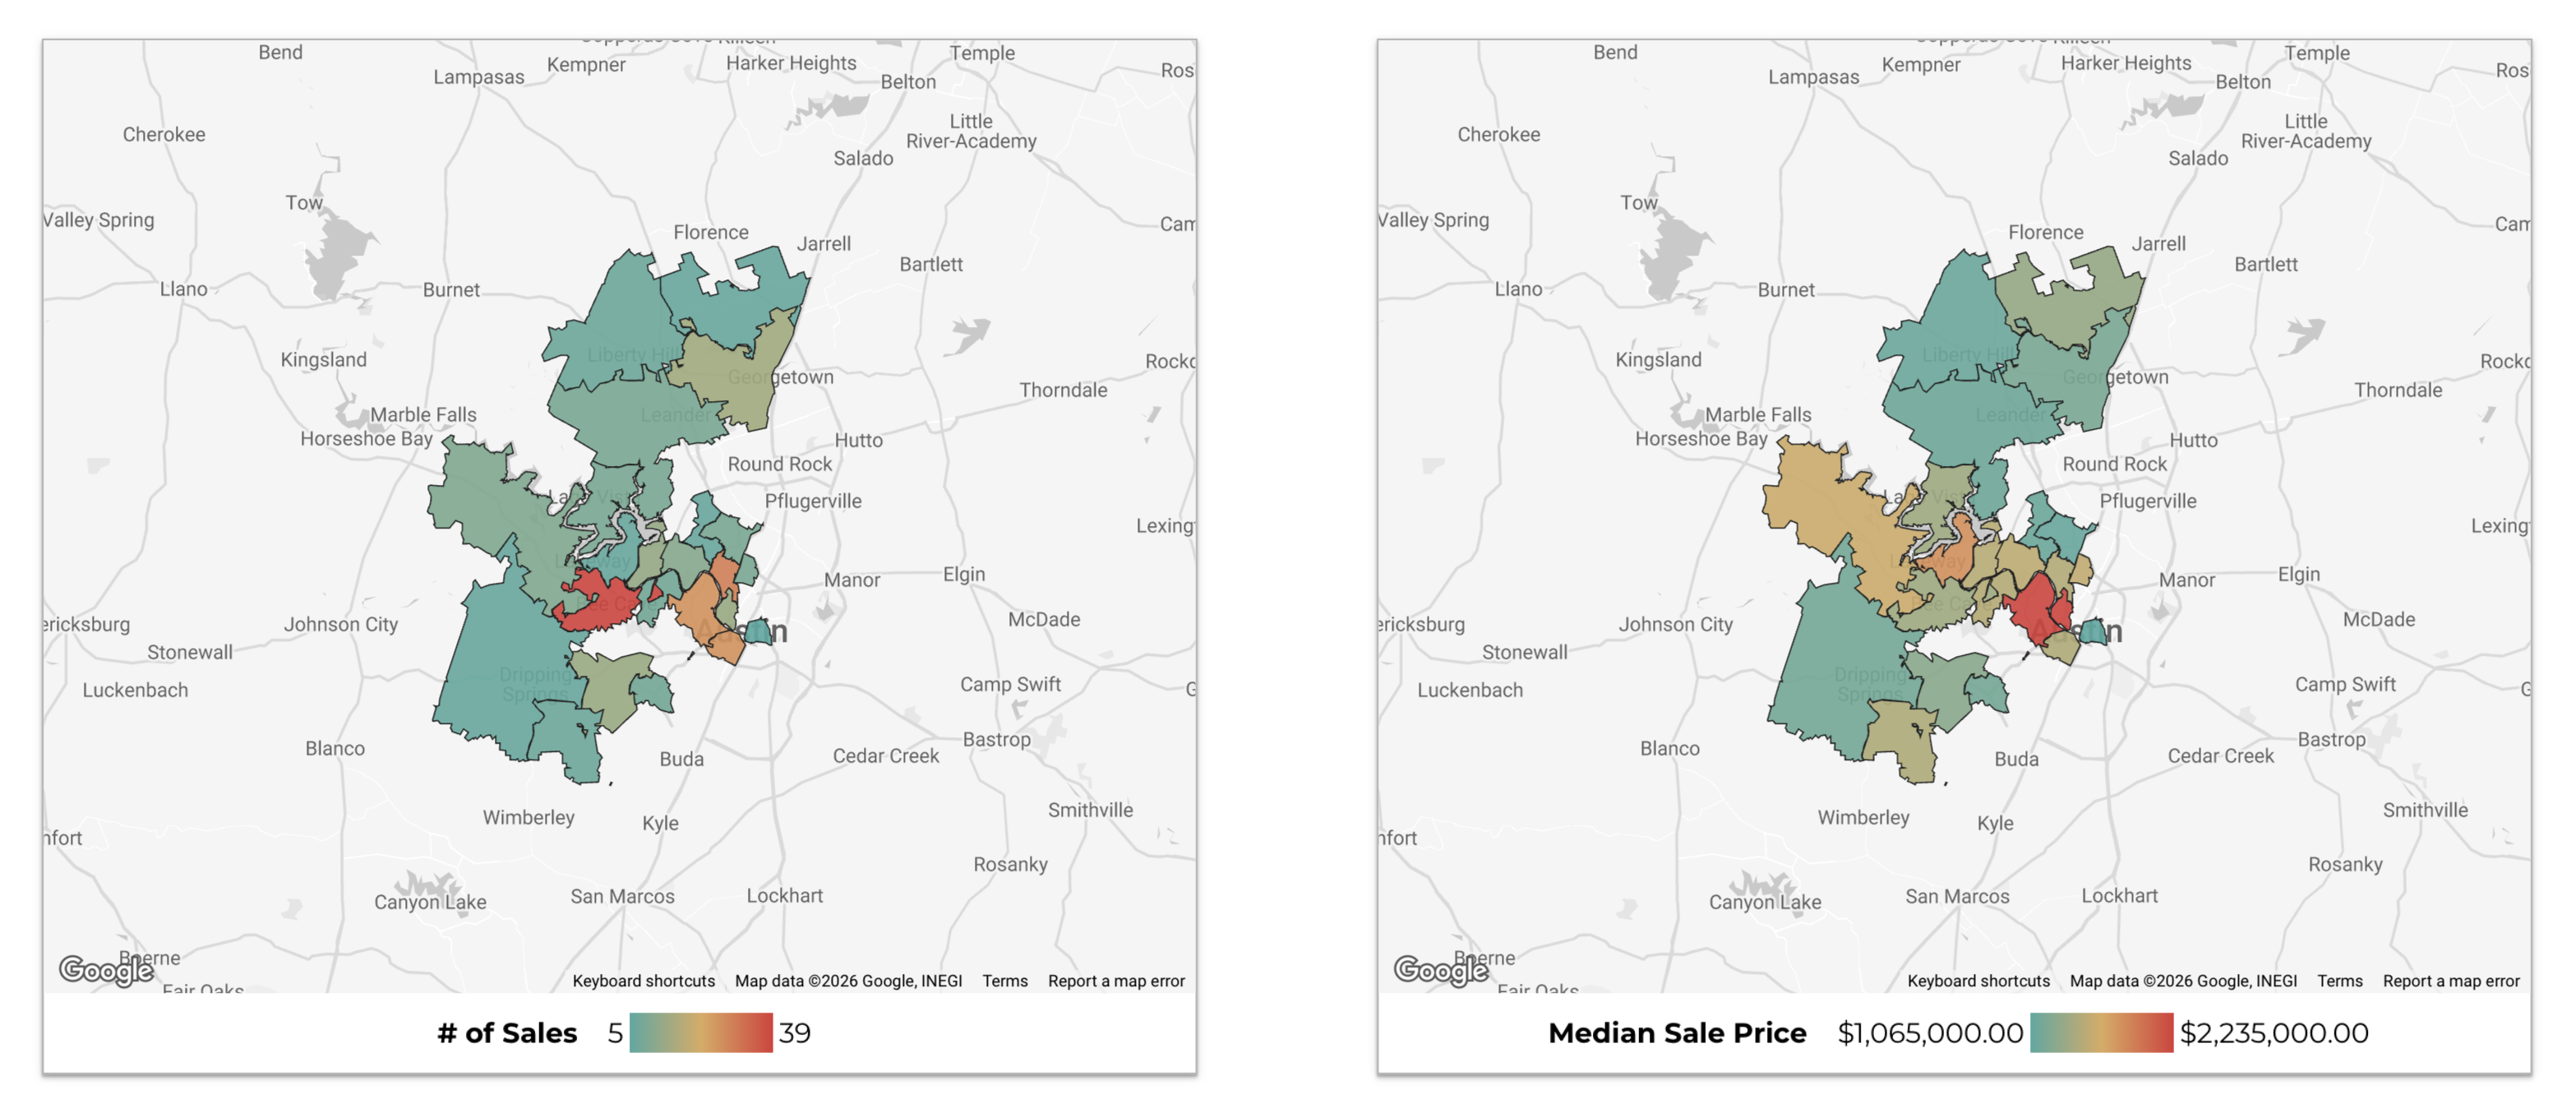
The June 2026 heat maps for number of sales and median sale price show the expected concentration of luxury activity in central and west Travis County. The darkest areas on the sales volume map correspond to the highest-selling zip codes, with counts ranging from 5 to 39 transactions per zip code. The Lake Austin waterfront corridor, Westlake/Eanes area, and central Austin zip codes account for the heaviest volume.
The median sale price heat map tells a complementary story. The highest median prices (shown in the orange-to-red range, up to $2,235,000) are concentrated in the Lake Austin waterfront zip codes and the most exclusive West Austin neighborhoods. The teal and green zones, representing medians in the $1,065,000 to $1,400,000 range, spread across north Austin, the northern suburbs, and the Hill Country markets in Hays County.
Together, these two maps help buyers and sellers understand that luxury real estate is highly localized. A zip code with 30 or more transactions has deep comparable data to draw from, making pricing much easier to anchor. A zip code with 5 to 8 transactions requires more careful analysis since a single outlier sale can skew the median significantly. If you are buying or selling in a lower-volume zip code, your agent's ability to interpret thin data becomes even more important.
Days on Market and Negotiating Margins Vary Widely by Zip Code
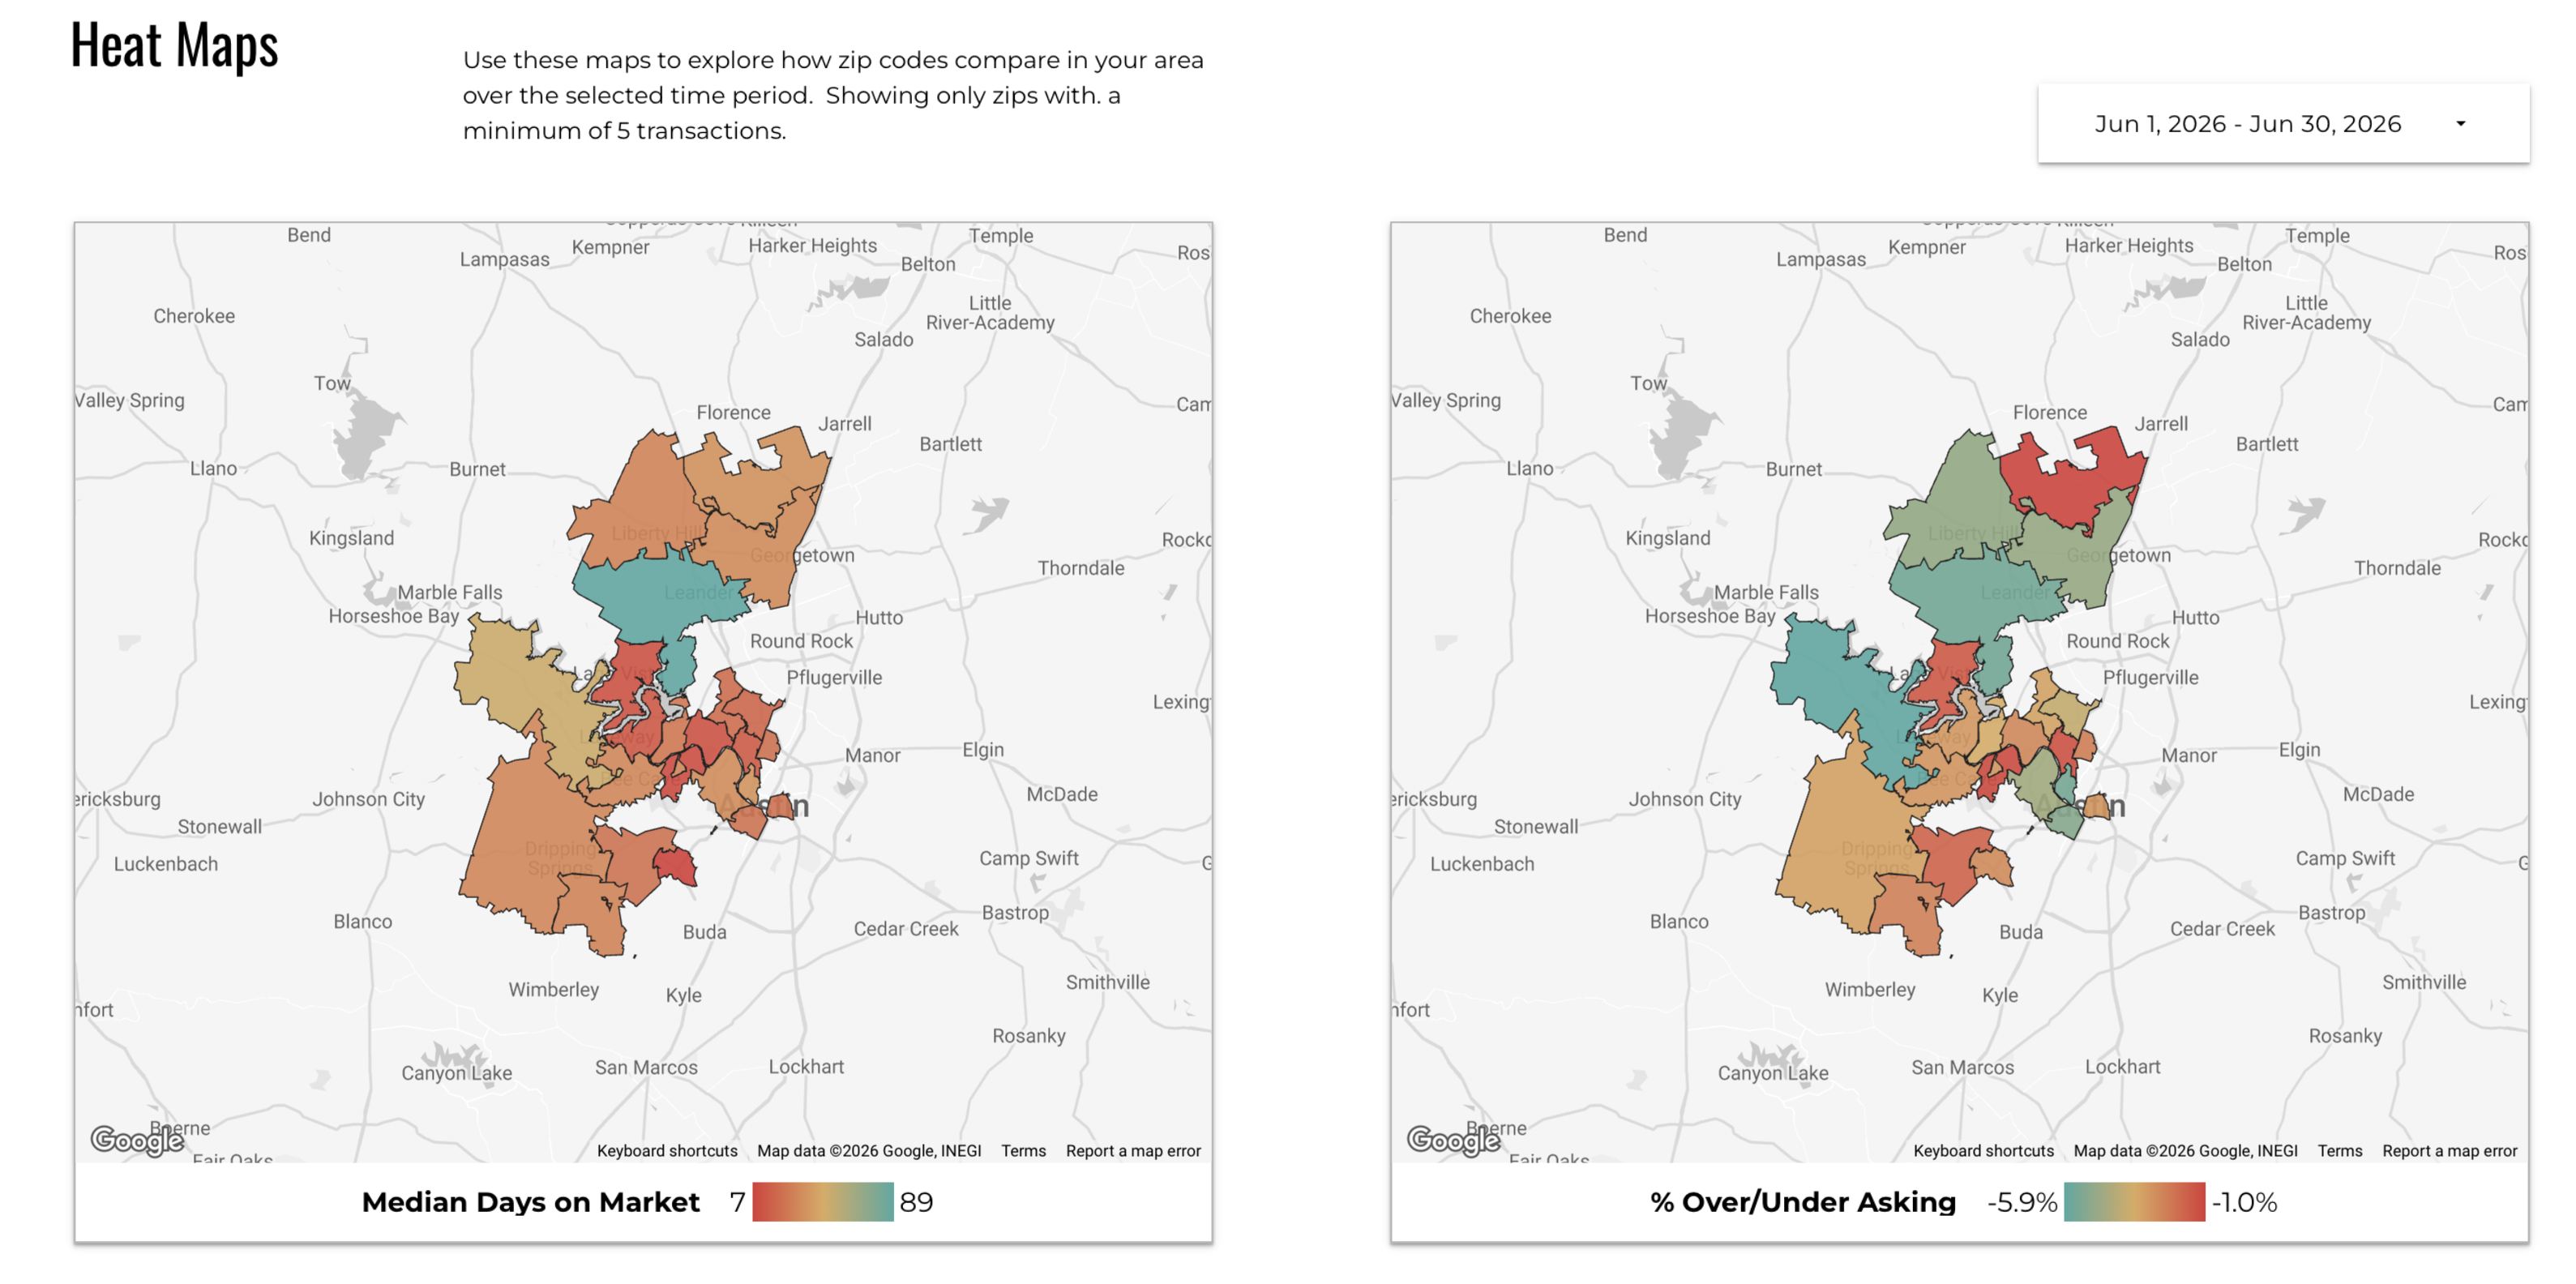
The days on market heat map for June 2026 shows a wide range, with zip codes running from as fast as 7 median days to as slow as 89 days. The fastest-selling areas are concentrated in inner-ring West Austin and the Lake Austin corridor, where demand is most concentrated and inventory is tightest. The slower zip codes tend to be in outlying areas with more supply relative to demand.
The percentage over or under asking map tells a similar story. The range runs from 5.9% under asking on the high end to 1.0% under asking on the tighter end. Zip codes in the 1% to 2% under-asking range tend to overlap with the fastest-selling areas, confirming the connection between strong demand and pricing power. The zip codes where buyers are getting 4% to 6% under asking tend to have longer days on market and higher inventory relative to sales pace.
If you are comparing two homes in different zip codes at similar list prices, these maps can help you understand which market you are actually buying into. A home in a 7-day median zip code requires a very different offer strategy than one in an 89-day median zone, even if both are priced at $1.5M.
Austin Luxury Sale Prices by Year and Bedroom Count
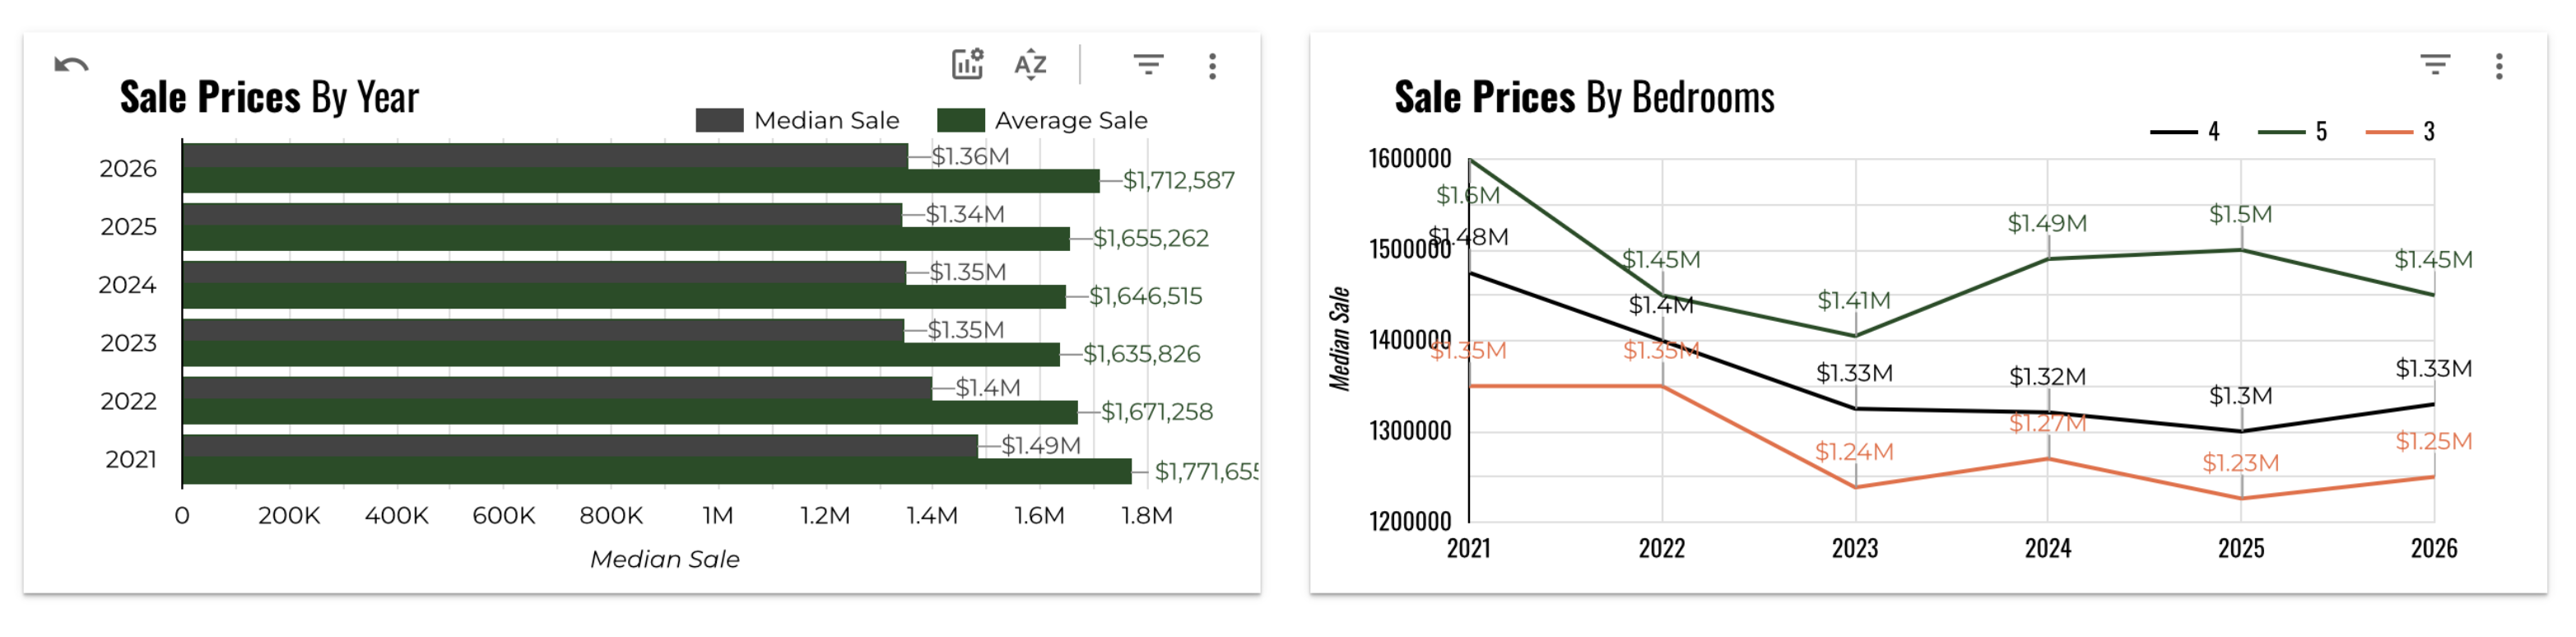
The sale prices by year chart (YTD through June 2026) shows the 2026 median at $1.36M and the average at $1,712,587, both above the 2025 full-year readings of $1.34M median and $1,655,262 average. The year-over-year improvement in average sale price is meaningful, suggesting that higher-end transactions are contributing more to the mix in 2026 than they did in 2025.
The sale prices by bedrooms chart shows the 5-bedroom luxury home commanding the highest median at $1,450,000 in 2026, followed by the 4-bedroom at $1,330,000 and the 3-bedroom at $1,250,000. All three bedroom tiers have recovered modestly from their 2023 lows. The 5-bedroom tier, which peaked near $1,600,000 in 2021, has settled in a range that reflects the broader market normalization.
For buyers evaluating bedroom count against budget, the data shows a clear premium for 5-bedroom homes of about $120,000 over 4-bedroom homes at the median level. If you are stretching to get to 5 bedrooms and the budget is tight, the data suggests you may find better value in a well-positioned 4-bedroom home with room to grow.
Austin Luxury Home Sales in June 2026
Here is a breakdown of luxury home sales in June 2026:
- 1 luxury home that sold in June 2026 was a foreclosure
- 19 were waterfront homes
- 124 were in the Austin Independent School District
- 18 were in the Dripping Springs Independent School District
- 36 were in the Eanes Independent School District
- 22 were in the Georgetown Independent School District
- 2 were in the Hays Consolidated Independent School District
- 53 were in the Lake Travis Independent School District
- 35 were in the Leander Independent School District
- 12 were in the Round Rock Independent School District
- 0 were in the San Marcos Consolidated Independent School District
- 7 were in the Wimberley Independent School District
- 33 were in gated communities
- 183 had a homeowners association
- 185 had a pool
- 82 had a septic system
- 265 were in Travis County
- 41 were in Williamson County
- 27 were in Hays County
Where Did Luxury Homes Sell in June 2026?
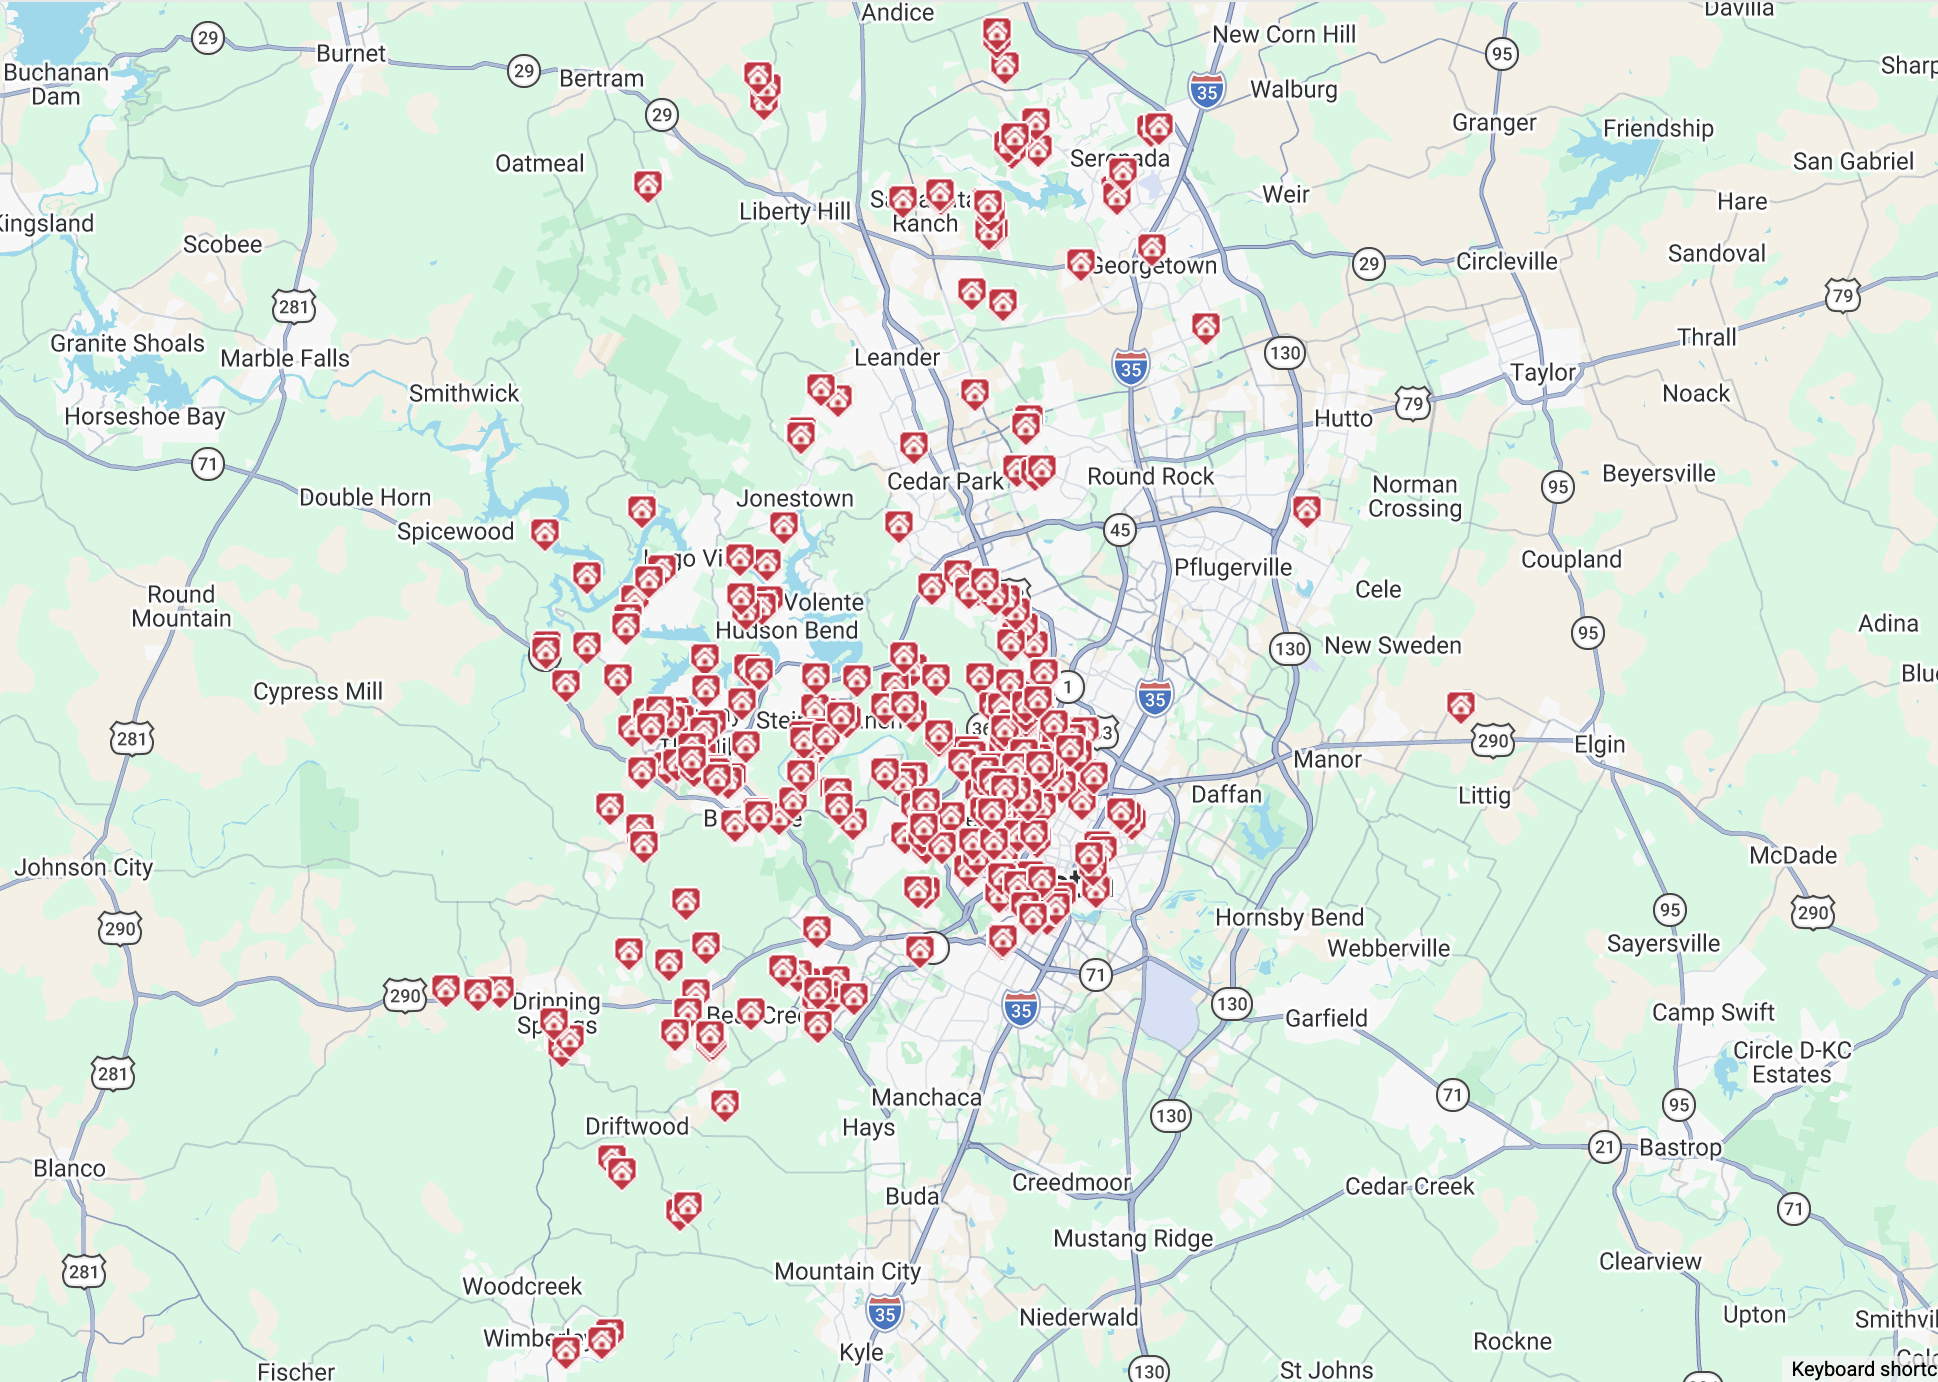
The map above shows where the 333 luxury homes that sold in June 2026 were located across Travis, Williamson, and Hays Counties. The heaviest concentration of sales falls in central and west Travis County, with dense clusters in the Westlake and Lake Austin corridor, the Barton Creek and Steiner Ranch areas, and the central Austin neighborhoods stretching from Tarrytown through the 78703, 78746, and adjacent zip codes. Activity also extends north into the Cedar Park and Leander areas of Williamson County and south and southwest into the Dripping Springs, Wimberley, and Driftwood communities of Hays County.
The geographic spread of June's 333 sales reflects the breadth of the Austin luxury market. While Travis County's 265 closings dominate the count, Williamson County's 41 sales and Hays County's 27 sales confirm that buyers are finding value and amenity appeal well beyond the city core. The Lake Travis and Hill Country areas continue to draw buyers who prioritize land, water access, and views, while the urban luxury corridors remain active for buyers who want proximity to Austin's employment and cultural amenities.
June 2026 Austin Luxury Real Estate Strictly by the Numbers
The table below is pulled directly from the Unlock MLS statistics for June 2026 and covers the 333 luxury home sales (homes that sold for $1,000,000 or more) in Travis, Williamson, and Hays Counties.
| Min | Max | Avg | Median | |
|---|---|---|---|---|
| Beds | 2 | 7 | 4 | 4 |
| Baths | 2 | 11 | 4 | 4 |
| Sq Ft | 1,314 | 11,459 | 3,739 | 3,695 |
| Lot Sq Ft | -- | 1,306,800 | 42,647 | 15,416 |
| List Price | $949,000 | $8,900,000 | $1,811,150 | $1,399,900 |
| LP/Sq Ft | $160.27 | $2,282.49 | $498.57 | $438.07 |
| Acres | 0.068 | 30.000 | 0.979 | 0.354 |
| Close Price | $1,000,000 | $8,520,000 | $1,748,669 | $1,375,000 |
| CP/Sq Ft | $128.66 | $2,147.18 | $482.29 | $424.23 |
| CP/LP% | 80.00% | 117.00% | 97.10% | 97.00% |
| CP/OLP% | 48.00% | 125.00% | 94.38% | 95.00% |
| ADOM | 0 | 896 | 52 | 27 |
The most expensive luxury home that sold in June 2026 sold for $8,520,000 and the least expensive sold for $1,000,000. Homes ranged in size from 1,314 to 11,459 square feet with an average size of 3,739 square feet. The average price per square foot for a luxury home that sold in June 2026 was $482.29 with the lowest being $128.66 per square foot and the highest being $2,147.18 per square foot. It took, on average, 52 days to sell a luxury home and sellers received, on average, 94.38% of their original list prices.
The CP/OLP% column is one of the most revealing in the table. The minimum of 48.00% means at least one luxury home sold for less than half its original asking price, a figure that almost certainly reflects a spec or investment property that sat on the market for an extended period and required a dramatic reset. The maximum of 125.00% shows the opposite end, a bidding war on a highly desirable property. The median of 95.00% is the most useful number for most buyers and sellers: in the typical transaction, the seller accepted 5% below their original asking price.
The ADOM spread from 0 days to 896 days reflects the full spectrum of the luxury market. A 0-day ADOM means a home went under contract before or on the day of listing, either through a pocket listing arrangement or exceptional demand. An 896-day ADOM represents nearly two and a half years of market time before a buyer and seller agreed on price and terms. The 27-day median is far more representative of the typical experience, but the extremes are a reminder that the luxury market does not operate in a single gear.
Austin Luxury Real Estate Search Criteria
The data in this report covers homes that sold for $1,000,000 or more in Travis County, Williamson County, and Hays County during June 2026. Both single-family homes and condominiums are included if they meet the price threshold.
Luxury Homes for Sale Around Austin
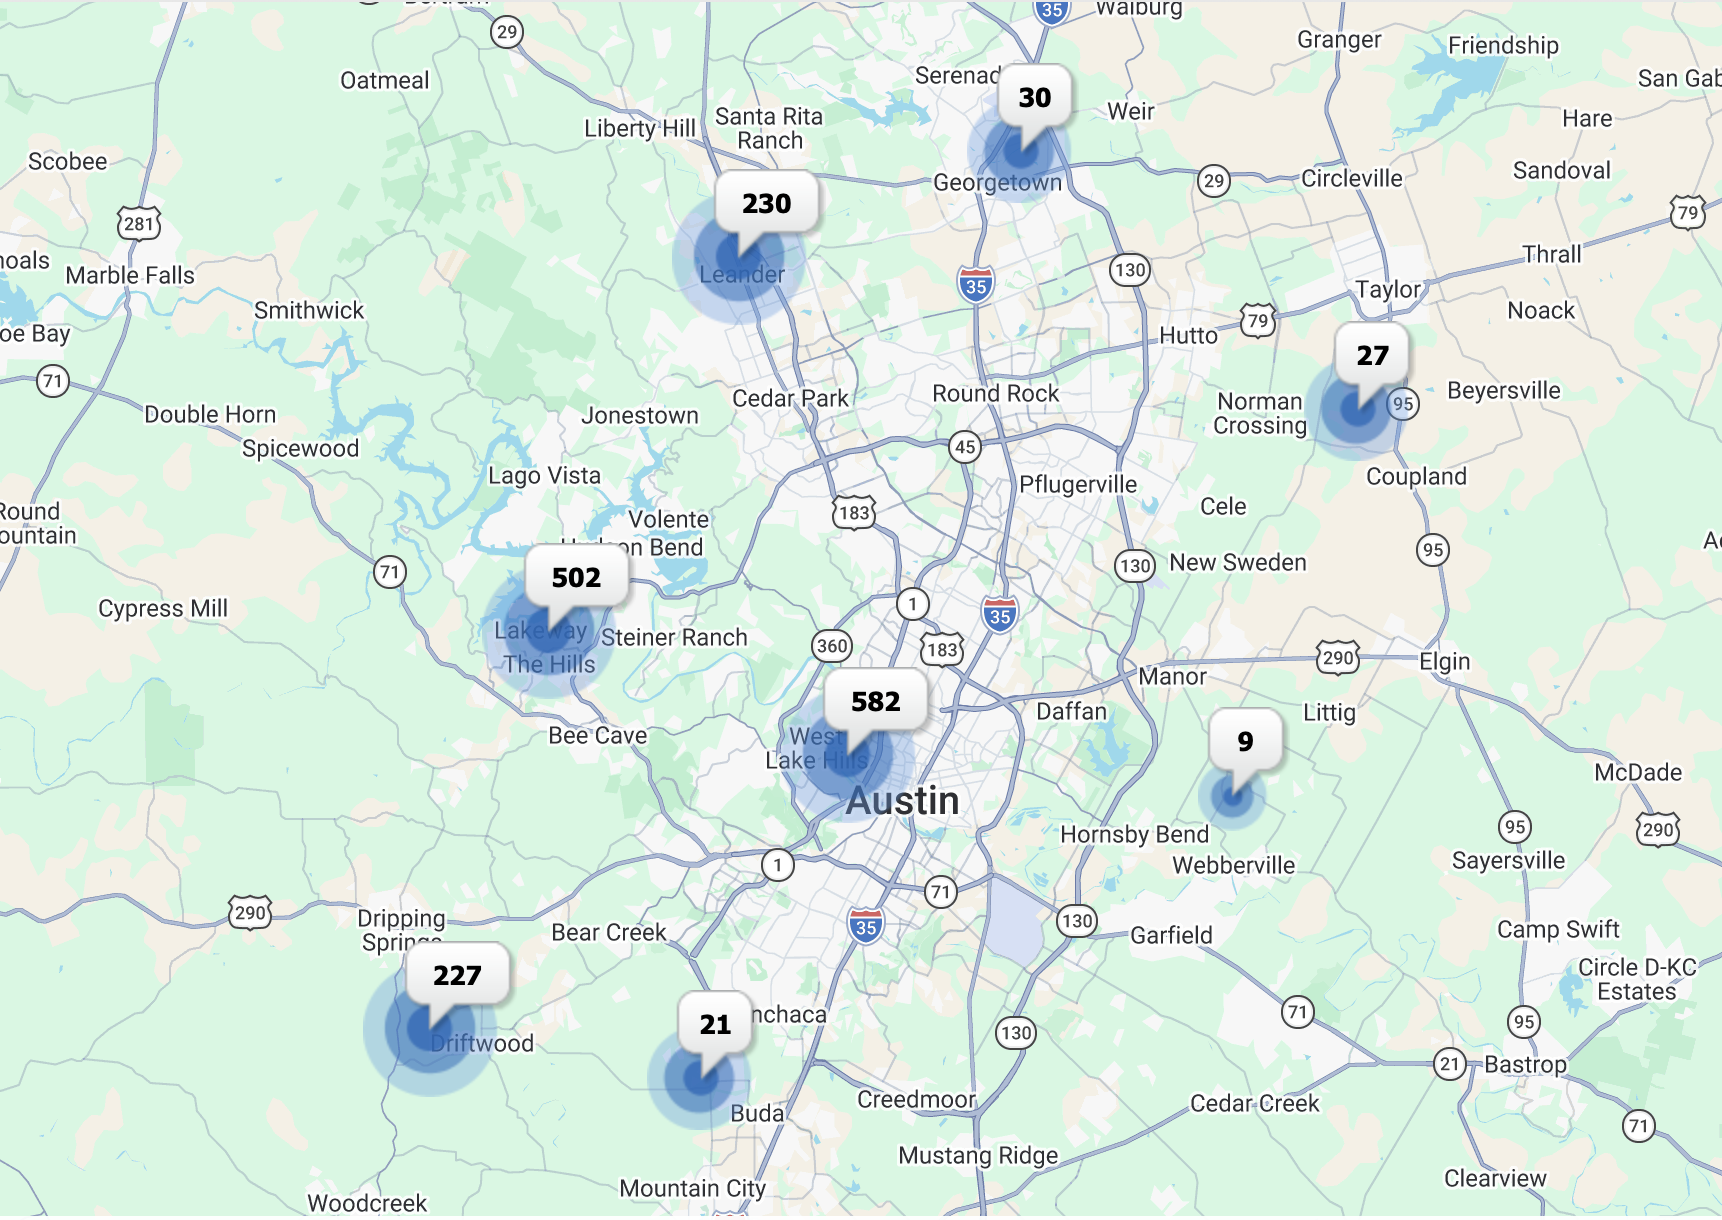
As of July 12, 2026, there are 1,670 luxury homes (priced at $1,000,000 or more) for sale in the Austin area: 1,179 in Travis County, 239 in Williamson County, and 252 in Hays County.
At June's pace of 333 closings per month, 1,670 active listings represents approximately 5 months of supply, sitting comfortably in balanced market territory. The homes for sale map shows the largest concentrations in central Austin (582 listings), the Lakeway and The Hills area (502), the Leander and Liberty Hill corridor (230), and the Dripping Springs and Driftwood area (227). Buyers have real selection across all price points and geographies right now, which is a meaningful shift from the near-zero inventory conditions of 2021 and 2022.
Tips for Luxury Home Buyers
The June 2026 data points to a market that is more active and competitive than it was a year ago, but one that still offers buyers meaningful leverage if you approach it correctly. The 27-day median days on market is a useful benchmark: if you are targeting the $1.2M to $1.39M range, you should plan to move within 15 days of finding the right home, as that segment is moving fastest. In the $1.4M and above tier, you have slightly more time at a median of 33 days, but well-positioned homes still go quickly.
Price negotiation is still available but has narrowed. The median close-to-original-list ratio of 95.00% means the average seller accepted 5% below their original ask. On a $1.5M home that translates to $75,000, which is meaningful. However, the buyer demand chart shows this gap has shrunk from 6% under asking in 2024 to 3.1% in June 2026. If you are anchoring your offer expectations to what buyers were getting two years ago, you may find the market has moved on.
With 49% of active listings having already reduced their price, there is a segment of the market where seller flexibility has already been demonstrated. When evaluating a home that has taken a price cut, look at how long it has been active, how many reductions it has taken, and how the adjusted price compares to recent comparable sales in the same zip code. A home that has been cut once and repriced correctly can be an excellent opportunity; a home on its third or fourth reduction may have a structural challenge that price alone cannot solve.
Finally, pay attention to the inventory level in your specific price range. The $1.2M to $1.39M tier has just 3.8 months of supply, the tightest in the luxury market. If that is your target, you are working with less selection and more competition than any other luxury price band. Come prepared with your financing squared away, a clear sense of your priorities, and the ability to move when the right home appears.
Tips for Luxury Home Sellers
June 2026 was one of the strongest months for luxury home sales in recent memory, with 333 closings representing a 31.6% year-over-year increase. If you have been waiting for the right moment to list, the market is showing up for sellers right now. However, strong volume does not mean you can skip the fundamentals of smart pricing and presentation.
The median time to sell of 27 days is an encouraging benchmark, but the 52-day average tells you the market is still bifurcated between homes that price correctly and sell quickly versus homes that enter too high and linger. The data shows that 49% of currently active listings have already reduced their price, meaning sellers who start too high are discovering the correction quickly. The median seller waited just 21 days before making their first price cut, which means you have about three weeks to generate real buyer interest before the market signals you need to adjust.
Pricing relative to your original list price matters more than most sellers realize. The average seller received 94.38% of their original list price. On a $2M home, that is a $112,400 gap from where you started to where you closed. Sellers who price correctly from the start are not just avoiding that gap; they are also capturing the attention of the most qualified buyers who enter the market in the first two weeks. The first two weeks of any luxury listing generate disproportionate traffic, and an overpriced entry wastes that window.
On the positive side, the trend in buyer negotiating terms is moving in your favor. The percentage under asking has improved from 6% in 2024 to approximately 3.1% in June 2026. If that trend continues through the second half of 2026, the gap between original list and close price may narrow further. For sellers who are planning to list in the fall, the current trajectory suggests you may be entering a slightly stronger negotiating position than sellers faced a year ago.
The Bottom Line on the June 2026 Austin Luxury Real Estate Market
June 2026 delivered a clear message: Austin luxury buyers are back. The 333 closings represent the kind of volume that signals genuine market health, not just one or two exceptional months of activity. When you combine that with a median price that held flat year over year at $1,375,000 and a days-on-market figure that dropped 22.9% to just 27 days, the picture that emerges is a market finding its footing after two years of recalibration.
The price story is one of stability rather than momentum. At $1,375,000 median, the Austin luxury market is holding well above pre-pandemic levels while avoiding the kind of speculative inflation that made 2021 and 2022 unsustainable for most buyers. That stability is healthy. It creates a market where buyers can make decisions based on value and fit rather than fear of missing out, and where sellers can price with confidence knowing that a correctly priced home will move in about four weeks.
The variation within the market deserves attention. The $1.2M to $1.39M tier is moving at a 15-day median with 3.8 months of supply, conditions that are genuinely competitive. The $1.4M and above tier has more breathing room at 5.7 months of supply and a 33-day median. Buyers and sellers in different price bands are experiencing meaningfully different markets even within the same June 2026 data set. Understanding your specific segment, not just the overall market, is what separates a successful transaction from a frustrating one.
Austin's luxury real estate market has always been grounded in the city's economic fundamentals, its position as a technology and business hub, its quality of life, and its long-term population trajectory. Those fundamentals have not changed. The 333 homes that sold in June 2026 represent buyers who made a decision that Austin's luxury market is worth investing in, and the data behind those closings supports that conclusion.
Thinking About Buying or Selling a Luxury Home in Austin?
If you are thinking about buying a luxury home in Austin, our Buyers page is a good place to start. If you are thinking about selling your Austin luxury home, visit our Sellers page to learn what to expect in today's market.
Have questions about what the June 2026 Austin Luxury Real Estate Price Report means for your specific situation? Reach out to Rebecca Jacks and the team at Eleven Oaks Realty. Call or text (512) 827-8323 or email info@11OaksRealty.com. We have been helping buyers and sellers since 1978 and we are here to help you make the best decision for your situation.
Questions About the June 2026 Austin Luxury Real Estate Price Report?
Have questions about the June 2026 Austin Luxury Real Estate Price Report or the Austin luxury market in general? We would love to help. Reach out to Rebecca Jacks and the Eleven Oaks Realty team at (512) 827-8323 or info@11OaksRealty.com.
Data sources: Unlock MLS (direct pull), CentralTX aggregated platform. Luxury market defined as homes that sold for $1,000,000 or more in Travis County, Williamson County, and Hays County. Reported figures reflect June 1, 2026 through June 30, 2026. Some variation between data sources may exist due to differing methodology and timing of data pulls.




Leave a Reply