
Eleven Oaks Realty is proud to present their December 2025 Austin Luxury Real Estate Price Report measuring market activity in the Austin area single family home market priced at $1 million or over. Our December 2025 Austin Luxury Real Estate Price Report covers the luxury market in the following Austin metro area counties: Travis, Williamson and Hays.
Austin Luxury Real Estate Market Highlights
Let’s dive straight into what the numbers are actually telling us right now. Despite what you might hear in passing, luxury pricing is holding its ground, hovering right near that mid–$1M range. However, the dynamics of the deal have shifted. Negotiations are decidedly buyer-friendly at the moment.
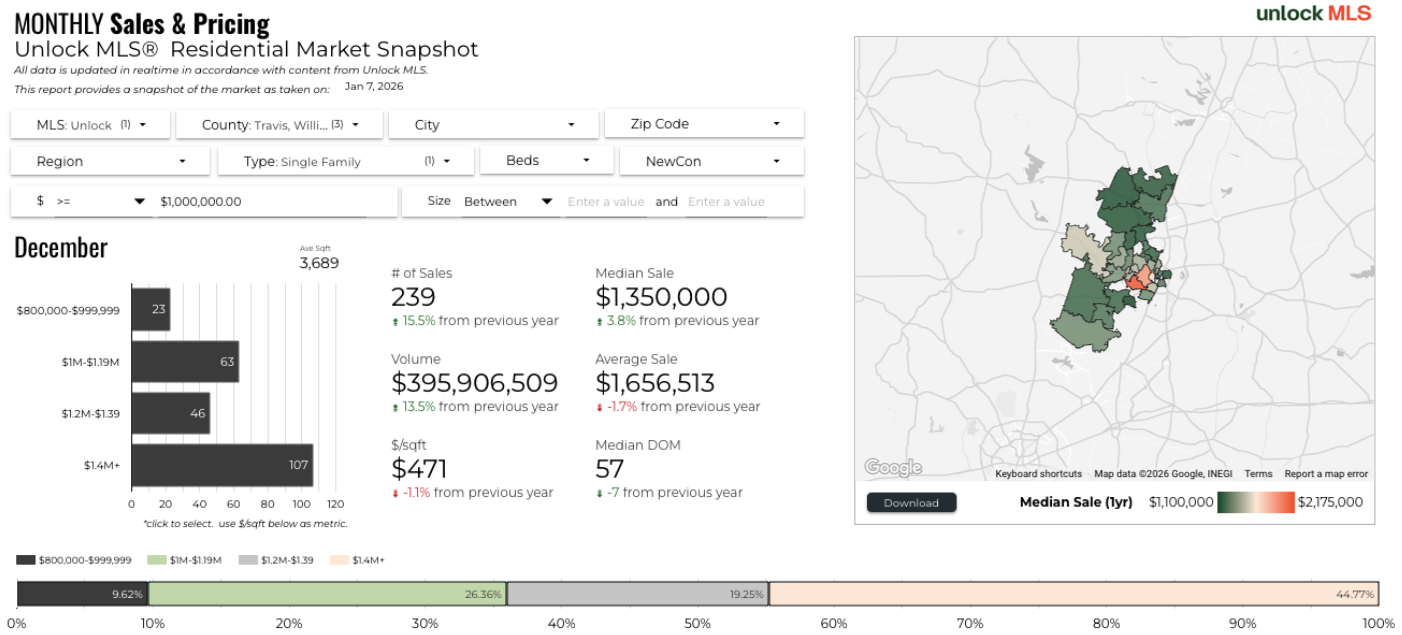
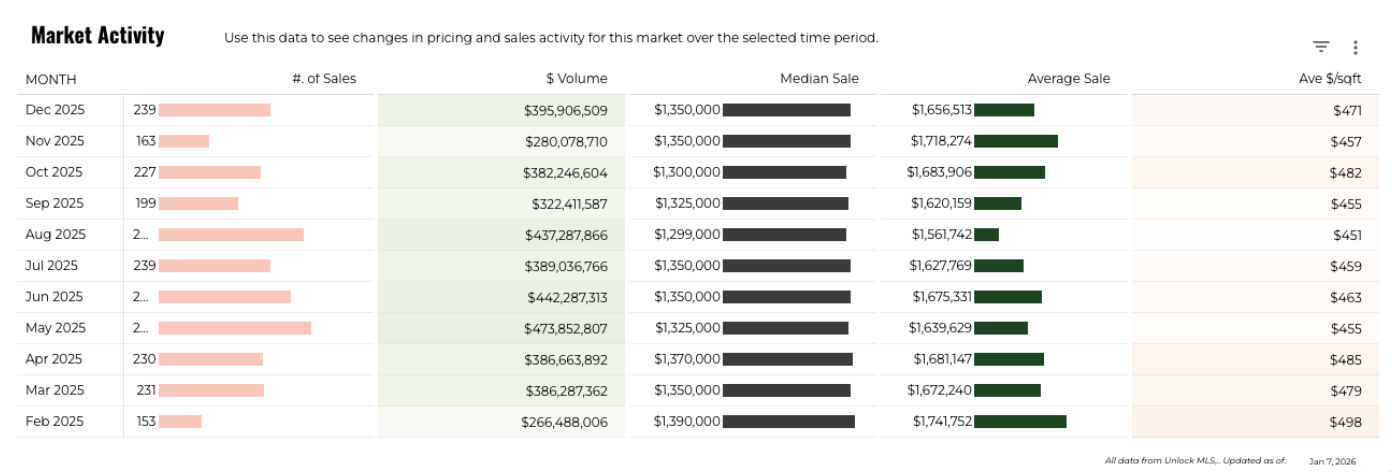
Looking at December’s performance, we saw a median sale price of $1,350,000, which is a solid +3.8% year-over-year increase. Activity is up, too—we had 239 sales (+15.5% YoY) and a total of $395.9M in volume (+13.5% YoY) across the $1M+ single-family segment in the Austin area. That is significant volume.
But here is where it gets interesting for anyone looking to make a move:
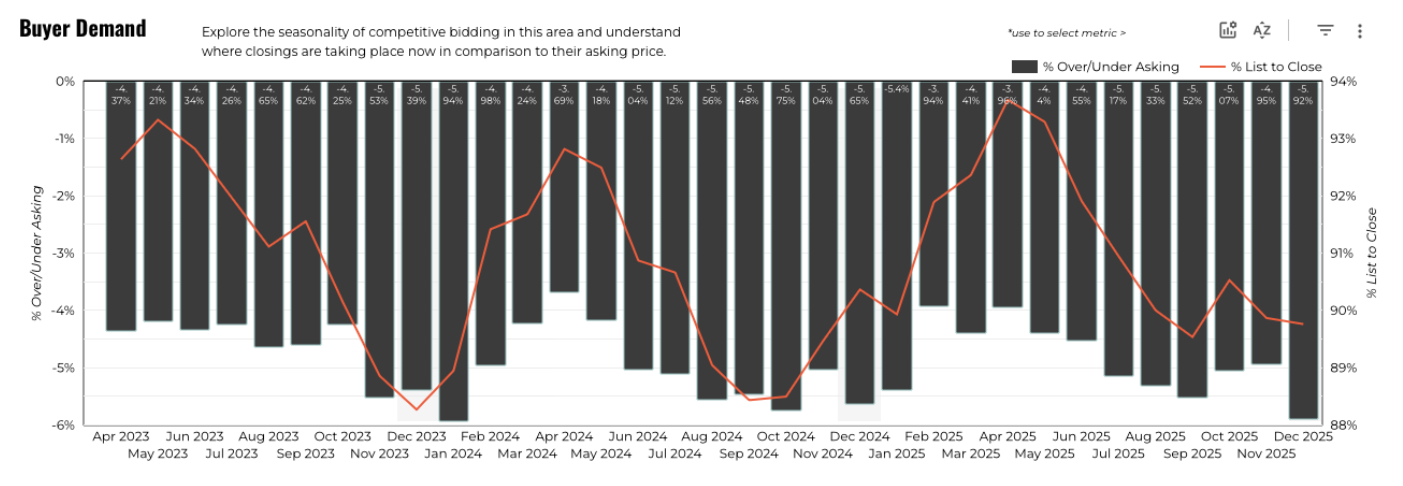
- Buyers are still “winning” on price relative to list. When we look at where the ink actually dries on the contract, December closings averaged -5.92% under asking price. That list-to-close ratio is sitting at 89.76%, with homes spending a median of 56 days on market. This tells me sellers are having to get real about pricing to get to the closing table.
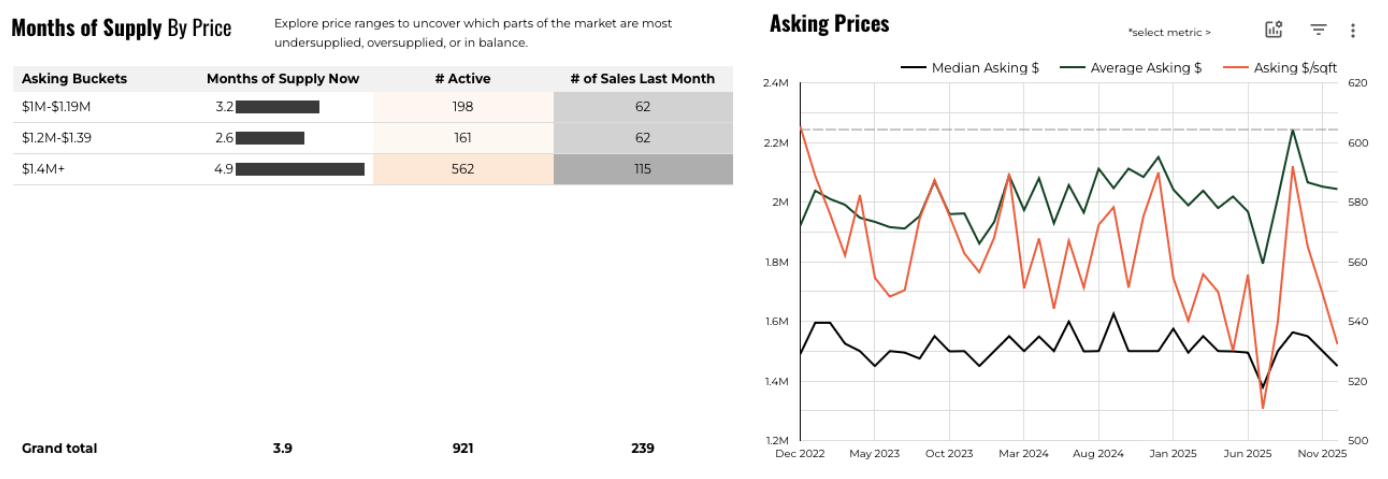
- Inventory is moderate overall, but looser at the very top. We currently have about 3.85 months of supply with 921 active listings on the market. But it’s not evenly distributed.
- If you look at the $1.2M–$1.39M range, inventory is tightest at 2.6 months of supply.
- Jump up to $1.4M+, and things loosen up considerably to 4.9 months of supply. This means the highest end of the market tends to be much more negotiable right now.
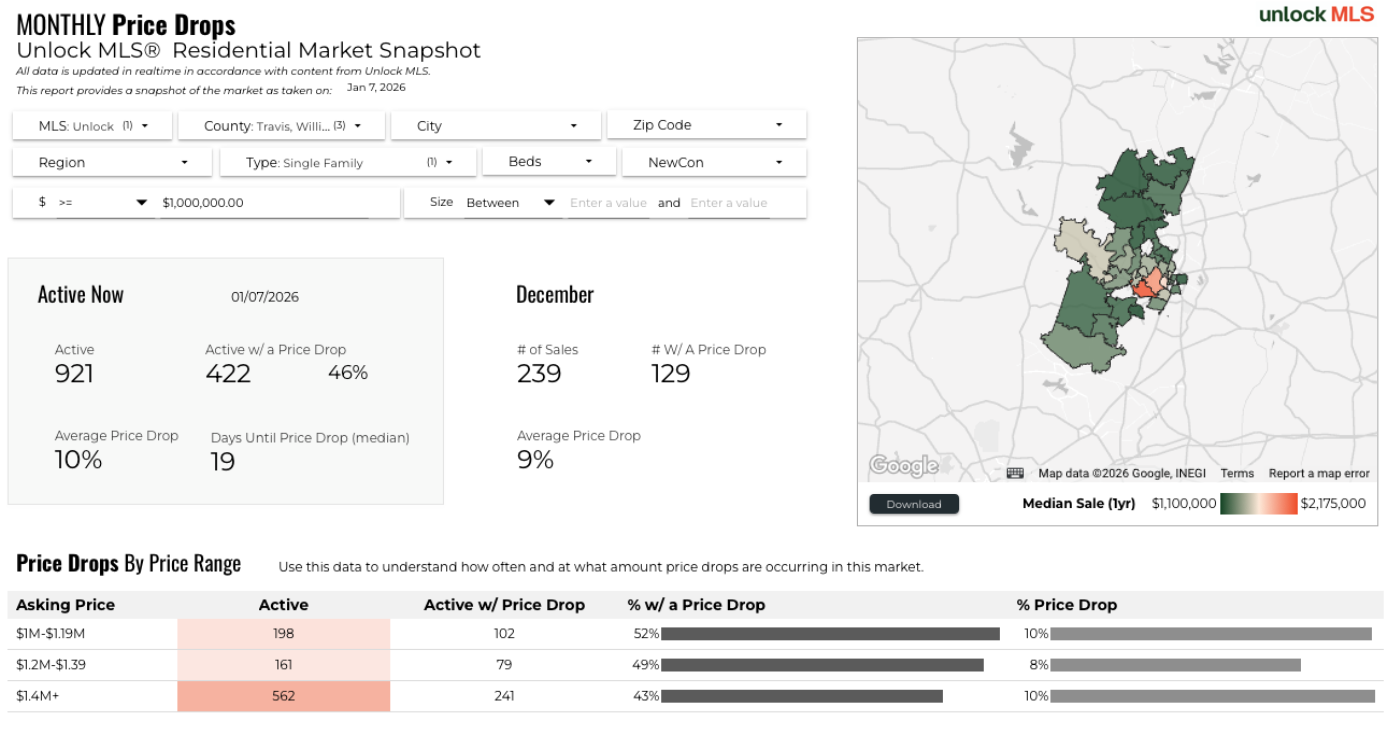
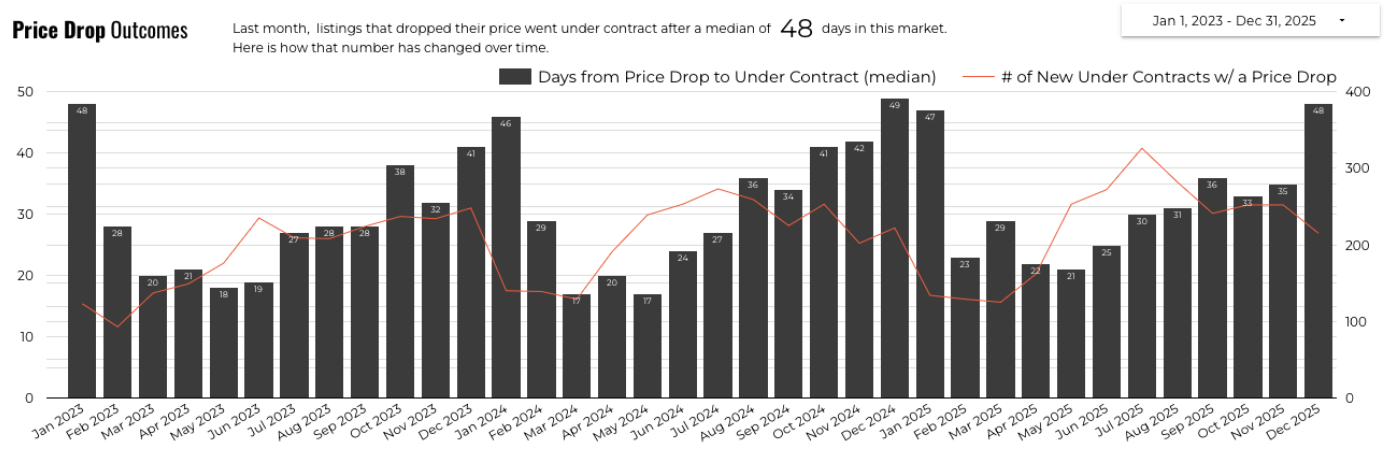
- Price drops are common and meaningful. We aren’t just seeing small adjustments; we are seeing real corrections. In December, 129 of 239 sales had a price drop. The median time until that first drop was just 19 days, with an average drop of roughly 9%. Even after dropping the price, those listings took a median of 48 days to go under contract.
- Austin proper is active, but still discounting. Narrowing in on the City of Austin, December showed 164 sales, which is a 16.3% jump. The median sale price was $1,435,000 (-1.7% YoY) at $524/sf. The median days on market was 43, and sales closed at -5.95% over/under asking—still below list on average.
Austin Luxury Real Estate Market Overview
At a high level, the story here is a market that is fundamentally healthy but picky. We are selling more homes than a year ago, and pricing remains relatively stable. However, the leverage in negotiations has clearly shifted toward the buyer. This is exactly what you would expect in a mature luxury environment: the serious buyers are present, but they are incredibly selective. They expect price realism, and they demand strong presentation.
From a supply-demand perspective, we aren’t flooded with inventory (3.85 months of supply isn’t a crisis), yet listings aren’t scarce enough to force broad bidding wars. The key nuance is the split within luxury: the $1.4M+ tier is running materially higher supply (about 4.9 MOS) versus the low-to-mid luxury bands. This tightens competition significantly for those “best value” listings in the lower bands.
Price and Negotiation Trends
1) Under-asking is the norm—especially when a home isn’t perfectly positioned
December closings averaged ~5.9% below asking and ~89.8% original list-to-close. That is a clear signal to everyone in the market: buyers are using comps aggressively. Sellers who start high are often giving back that value later via concessions, price reductions, or both.
2) Time-to-contract is steady, but the “price discovery” phase is very real
The median time on market for December was 56 days. Just as important is the timing of corrections: price drops are happening early—median 19 days until a drop—and they aren’t small adjustments, averaging around 9%.
When a home does reduce, it still takes time for the market to respond. Dropped listings went under contract after a median 48 days.
Talking point: “The market is rewarding correct pricing on day one more than it’s rewarding ‘test-the-market’ pricing.”
3) Micro-markets matter: county and zip performance diverges sharply
The market isn’t moving as one single unit.
- By county (December):
- Travis: Median $1.41M, 46 DOM, -6.09% over/under asking.
- Hays: Median $1.20M (down notably YoY), 56 DOM, -4.29%.
- Williamson: Median $1.125M, but 142 DOM (much slower absorption), -6.7%.
- By zip (December examples):
- 78704: Median $2.24M (up), 86 DOM, -7.34%.
- 78746: Median $1.88M (down YoY), 32 DOM, -6.52%.
- 78738: Median $1.38M (up), 61 DOM, -5.24%.
Interpretation for clients: “Even when a zip has strong prices, buyers can still negotiate—especially if DOM is elevated.”
0.9% Increase in Median Sold Price
In December 2025, the median home price of a luxury home in Austin was $1,398,000 compared to $1,385,000 in December 2024, showing an 0.9% increase in year over year numbers. Last month the median home price of a luxury home in Austin was $1,400,000, showing an 0.14% decrease in month over month comparisons.
10.5% Increase in the Number of Austin Luxury Home Sales
In December 2025, there were 220 luxury homes that sold in Austin compared to 197 in December 2024, showing a 10.5% increase in year over year numbers. Last month there were 156 luxury homes that sold, showing a 29.1% increase in month over month comparisons.
31.3% Decrease in Median Time to Sell
In December 2025 the median time to sell a luxury home in Austin was 48 days compared to 63 days in December 2024, showing a 31.3% decrease in year over year numbers. Last month the median time to sell a luxury home in Austin was 51 days, showing a 6.3% decrease in month over month comparisons.
December 2025 Austin Luxury Market Sales Breakdown
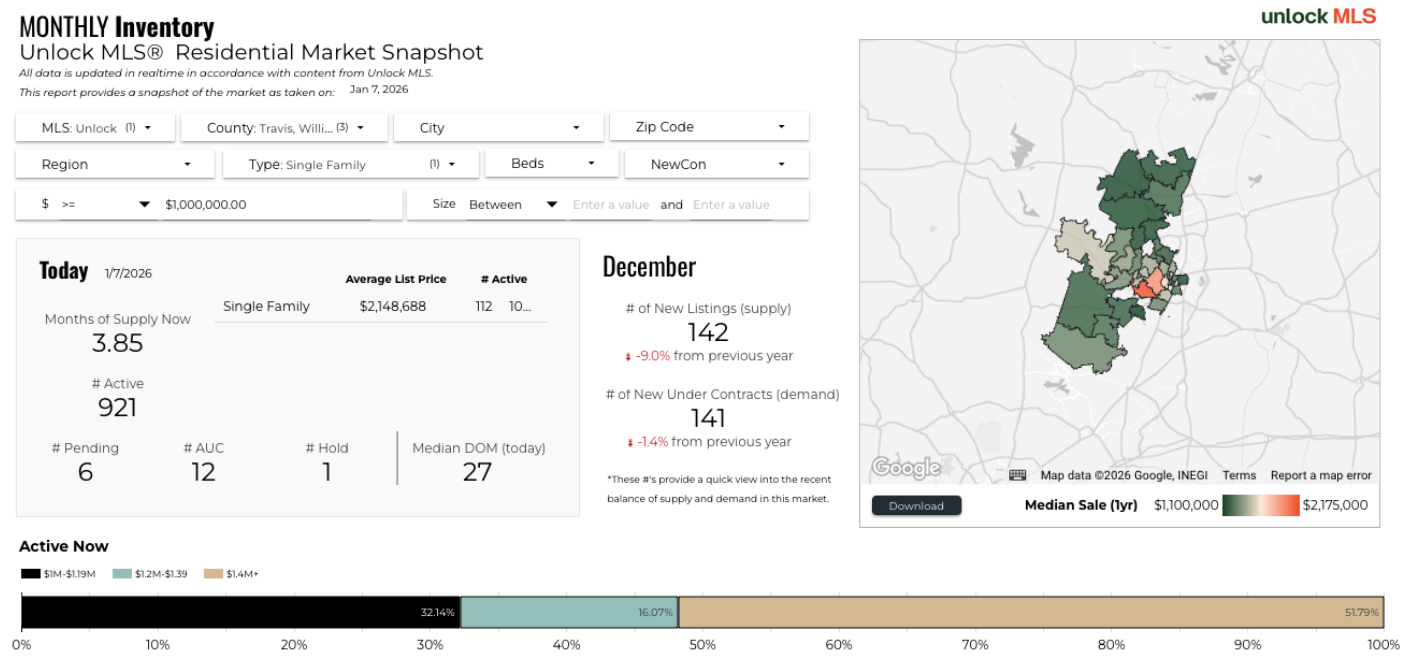
In December 2025, 23 (9.62%) of the 239 luxury homes that sold that were priced at $1,000,000 or higher at the time of contract sold for less than $1MM. 63 (26.36%) sold for between $1MM-$1.19MM. 46 (19.25%) sold for $1.2MM-$1.39MM. 107 (44.77%) sold for $1.4MM or more. You’ll see a heat map of median sale pricing where you see the most expensive luxury homes sold in Central and West Austin, a trend we see every month.
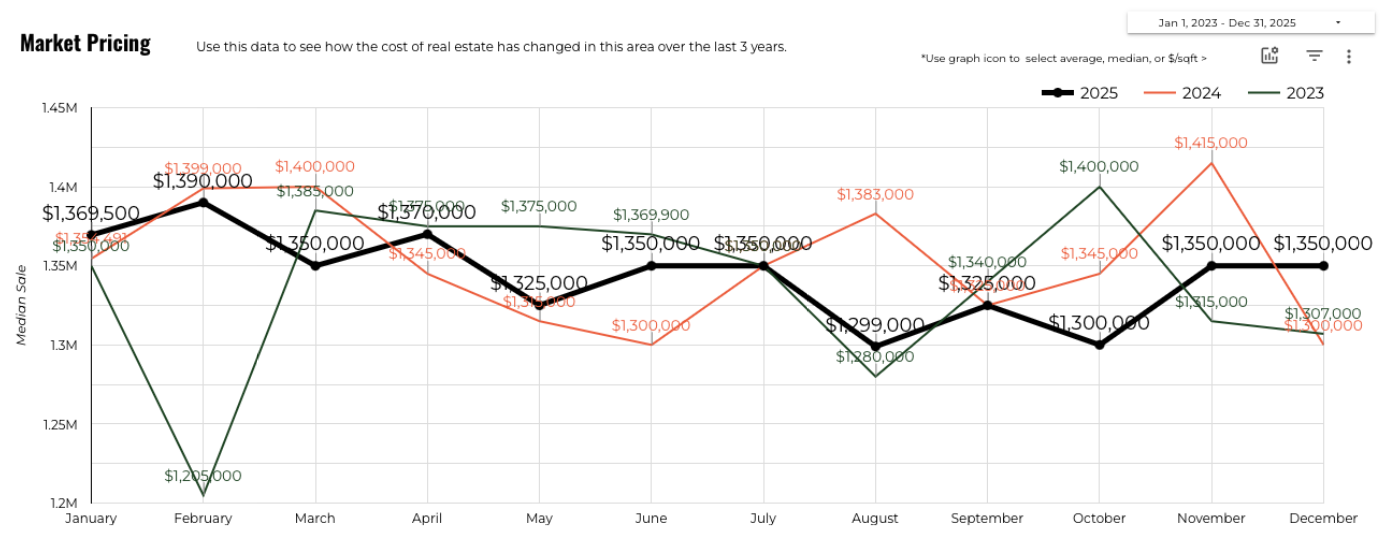
Luxury Market Pricing – Median Sold Price Over 3 Years
This chart shows the median sales price for Austin luxury homes over the last three years.
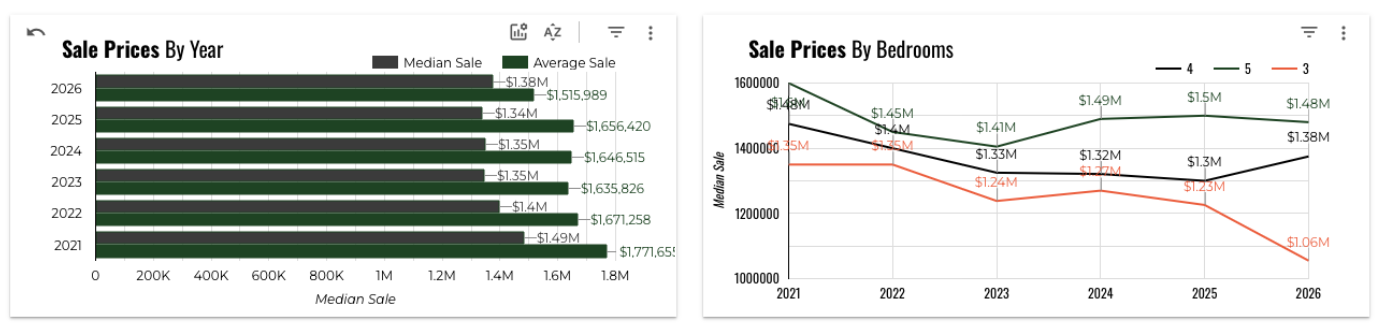
Austin Luxury Median & Average Sale Price and Sales Prices by Bedrooms By Year
Here is a five year look back on the Austin luxury market with median and average sale price on the left graph and sales prices by bedrooms by year on the right graph both broken down by year.
Austin Luxury Market Activity
Here is an 11 month look at the number of sales, total sales volume, median price, average price and average price per square foot in the Austin luxury market.
Austin Luxury Buyer Demand
This chart compares a three year look back on % list to close rates and %over/under asking price for Austin luxury homes. As the close rate increases, the % under asking decreases, which is what we would expect.
Austin Luxury Days on Market – Median vs Average
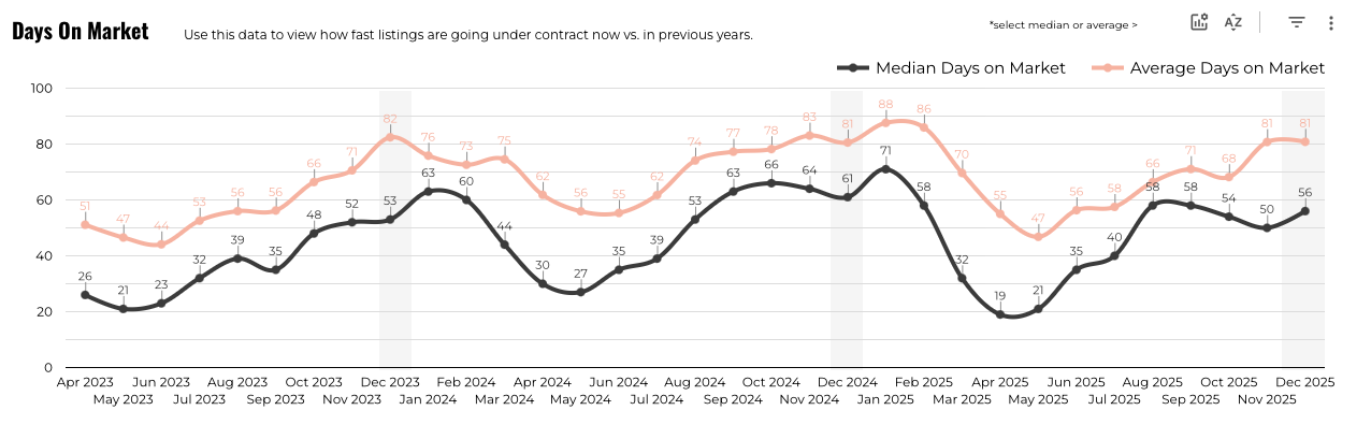
This chart shows how fast listings go under contract compared to previous years. This year is an interesting trend as we are heading into Q4 where we typically see days on market trend up and this year we are seeing the median trend down. The average has trended up, which tells me the homes that are selling are typically the homes that haven’t been on the market too long and you have some outliers that are bringing the average up. Last year the average days on market was 81 compared to 81 days this year and the median was 61 compared to 56 this year, so a definite decrease in year over year numbers.
Luxury Buyer Demand by Price Range
This chart looks at buyer demand by price range. The $800k-$999k sector is only included because those homes were listed at $1MM or more when they sold. This is not the full picture of that segment of the market. Those had the largest segment under asking, but those numbers are a little skewed as they only factored in homes that were listed at $1MM or above.
This month the $1MM-$1.19MM segment was the fastest moving segment of the luxury market with a median time to sell of 46 days. The next most active segment was the $1.4MM+ segment with a median time to sell of 47 days followed by the $1.2MM-$1.39MM segment with a median time to sell of 62 days. Buyers for luxury homes in the $1MM-$1.19MM segment were able to negotiate an average 6.2% off list price. Buyers for luxury homes in the $1.2MM-$1.39MM segment were able to negotiate an average 4.46% off list price and buyers in the $1.4MM+ segment were able to negotiate an average 5.79% off list price.

Austin Luxury Monthly Inventory
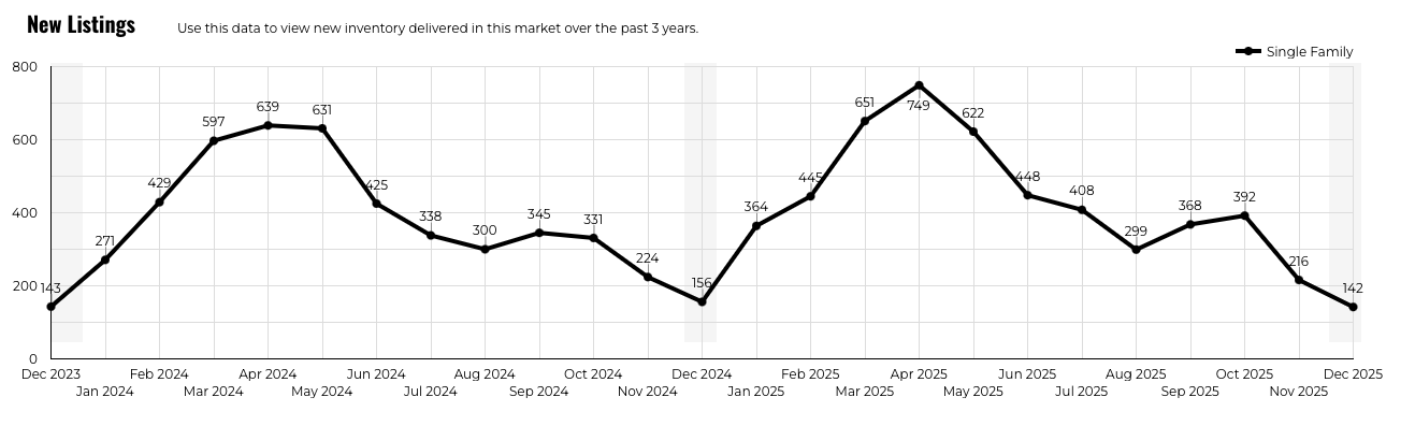
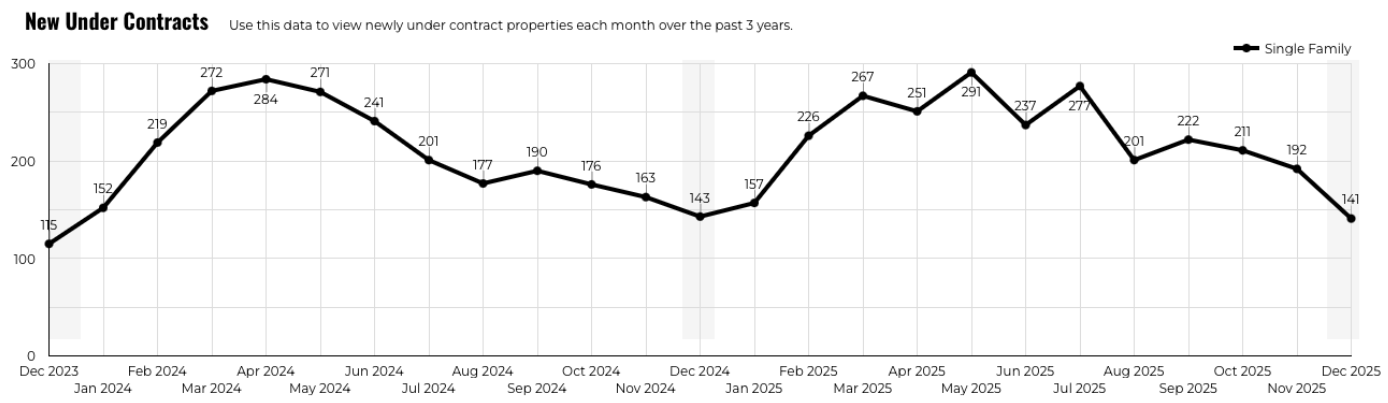
In December 2025, there were 142 new luxury listings, down 9% from the previous year. There were 141 luxury homes that accepted a contract, down 1.4% from the previous year. There are currently 3.85 months supply of inventory on the luxury market and 921 active luxury homes. 32.14% are priced from $1MM-$1.19MM, 16.07% are priced between $1.2MM-$1.39MM and 51.79% are priced at $1.4MM or more.
Months Supply of Luxury Inventory by Price and Asking Price
This chart breaks down the months supply of inventory by segment. This month we saw the leanest segment of the market in the $1.2MM-$1.39MM segment with 2.6 months of inventory, which is classified as a seller’s market. Next, came the $1MM-$1.19MM segment with 3.2 months of inventory, which is also classified as a seller’s market. Finally the $1.4MM and above segment had 4.9 months of inventory, which is classified as a seller’s market but just barely. The chart on the right plots median asking price, average asking price and asking $/sqft.
New Austin Luxury Listings
This chart maps the new listings by month over the past 3 years. April 2025 was the highest number of new luxury listings we have seen introduced to the market in the last 3 years. This month we had 142 luxury homes introduced to the market compared to 156 in December 2024 and 143 in December 2023, showing no real change in luxury market activity this year.
Number of Luxury Listings that Accepted a Contract
In December 2025 there were 141 luxury homes that accepted a contract compared to 143 in December 2024 and 115 in December 2023. 2025 numbers were a 1.4% decrease from 2024 and an 18.4% increase from 2023.
December 2025 Active Price Drop Info
As of January 7, 2026, there were 921 luxury homes actively listed for sale. Of those 422 (46%) of them had a price drop. The average price drop was 10% and it took a median of 19 days for sellers to drop the price. Of the 239 December 2025 sales, 129 of them had a price drop with an average 9% drop. If you break it down by price tier, homes priced from $1MM-$1.19MM had 198 luxury homes actively listed, 102 (52%) of which had a price drop. The average price drop for homes in this luxury segment was 10%. In the $1.2MM-$1.39MM category, there were 161 homes actively listed for sale and 79 (49%) of them had an 8%, on average, price drop. In the $1.4MM+ segment, there were 562 actively listed luxury homes. Of those, 241 (43%) had a 10%, on average, price drop.
December 2025 Price Drop Outcomes
In December there were 215 luxury homes that accepted a contract after having a price reduction. Homes that went under contract after a price reduction, took a median of 48 days after the price drop to find a buyer.
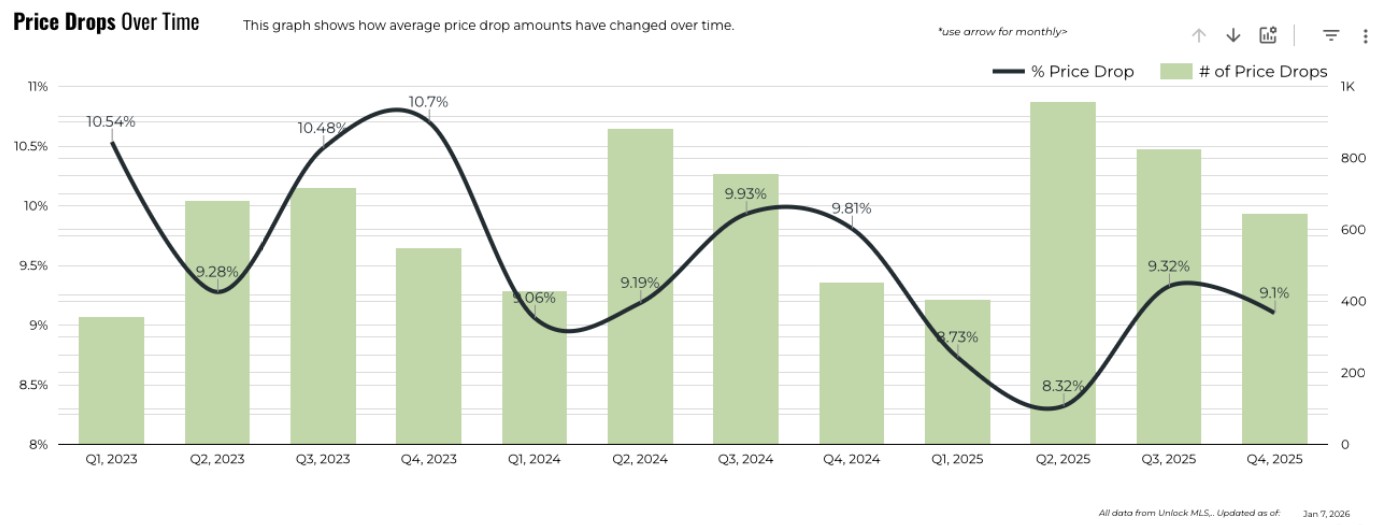
Austin Luxury Home Price Drops Over Time
This quarter (Q4 2025) we saw 647 price drops with an average price drop of 9.1%. In Q4 of 2024, we saw 454 price drops with an average price drop of 9.81%. In Q4 of 2023, we saw 550 price drops with an average price drop of 10.7%.
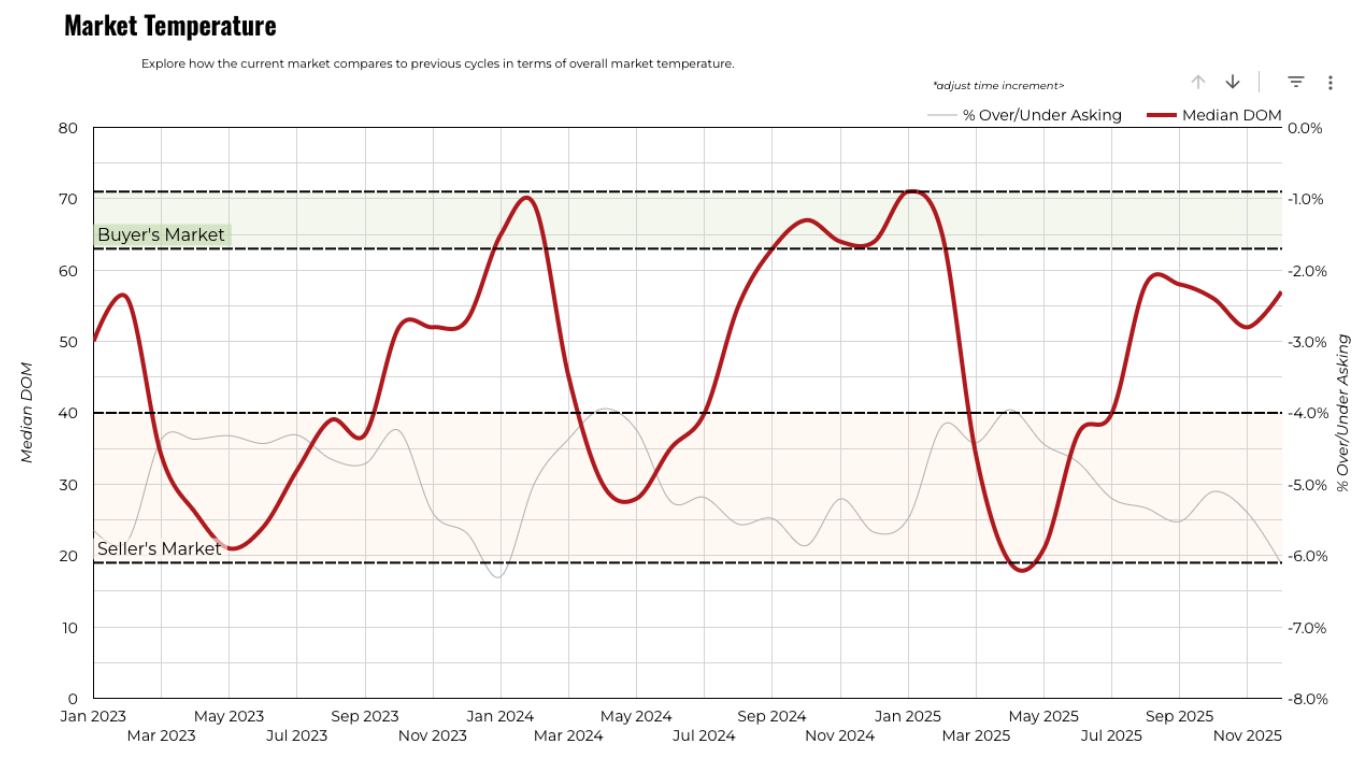
December 2025 Austin Luxury Market Temperature
In December 2025, the median days on market, 57 days fell into the top end of seller’s market territory. Sellers received, on average, 6.1% less than their list prices.
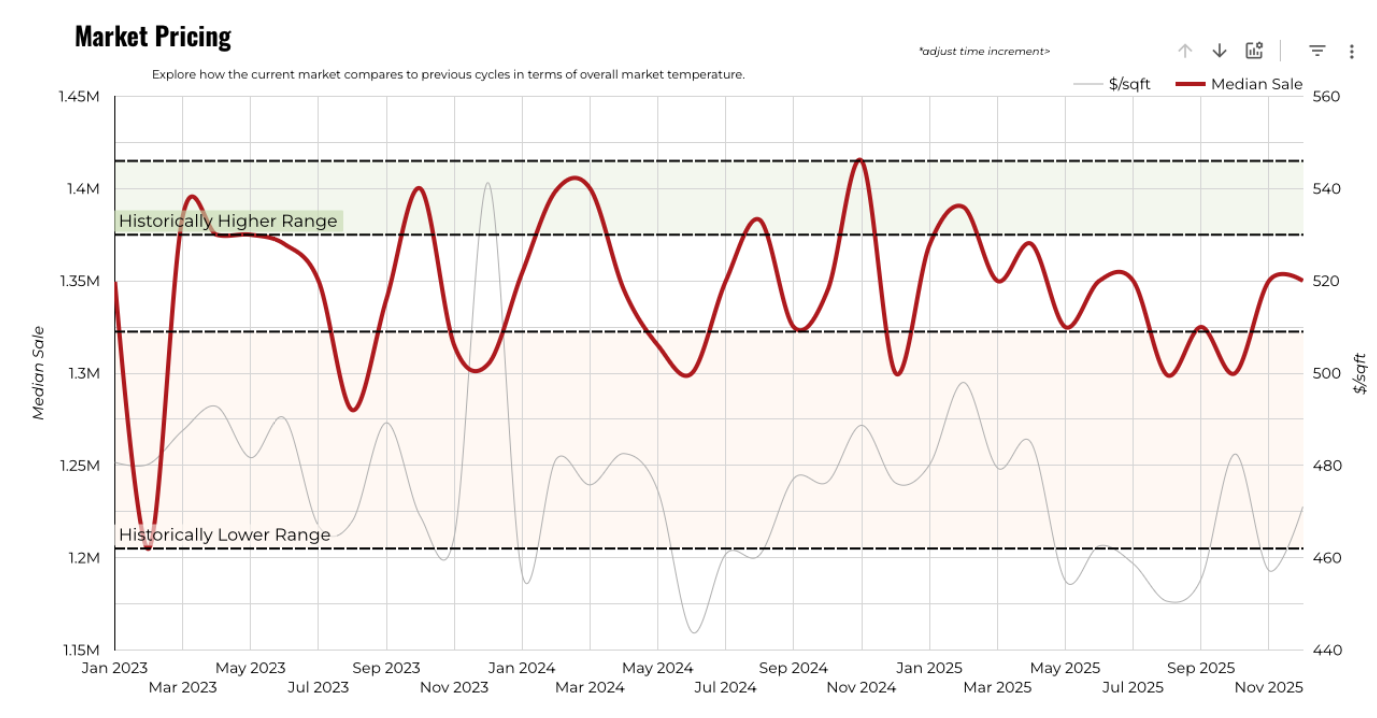
Austin Luxury Market Pricing
In December 2025 we dipped into below historically lower pricing of Austin luxury homes, which might explain the increase in activity for buyers recognizing the deals to be had.
December 2025 Austin Luxury Market County Comparison
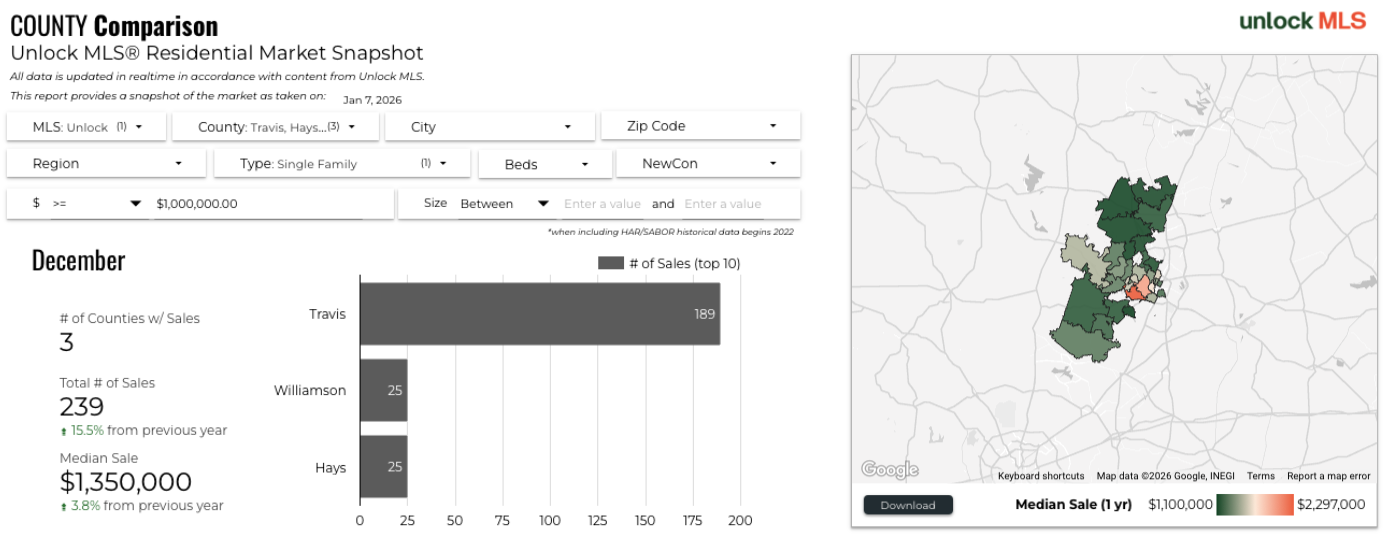
In December 2025, there were 189 homes in Travis County that sold, 25 in Williamson County and 25 in Hays County. The map to the right shows the heat map of median sold prices. The darker the color the closer to $1MM the median sold price and the lighter tree is closer to $2MM. The orange is circling around $2.2MM-$2.3MM.
Median Pricing by County
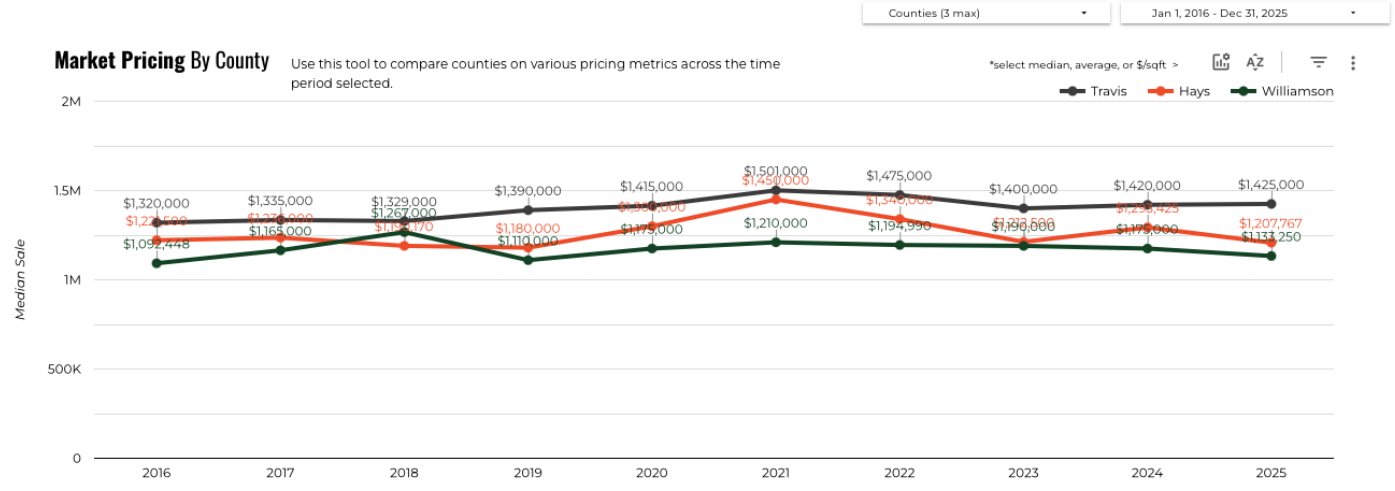
Here is a 10 year history of the median price of luxury homes separated by County. Travis County is the dark grey line, which is on top. Hays is the orange line and Williamson County is the dark green line (bottom of the chart).
Luxury Average Price Per Square Foot
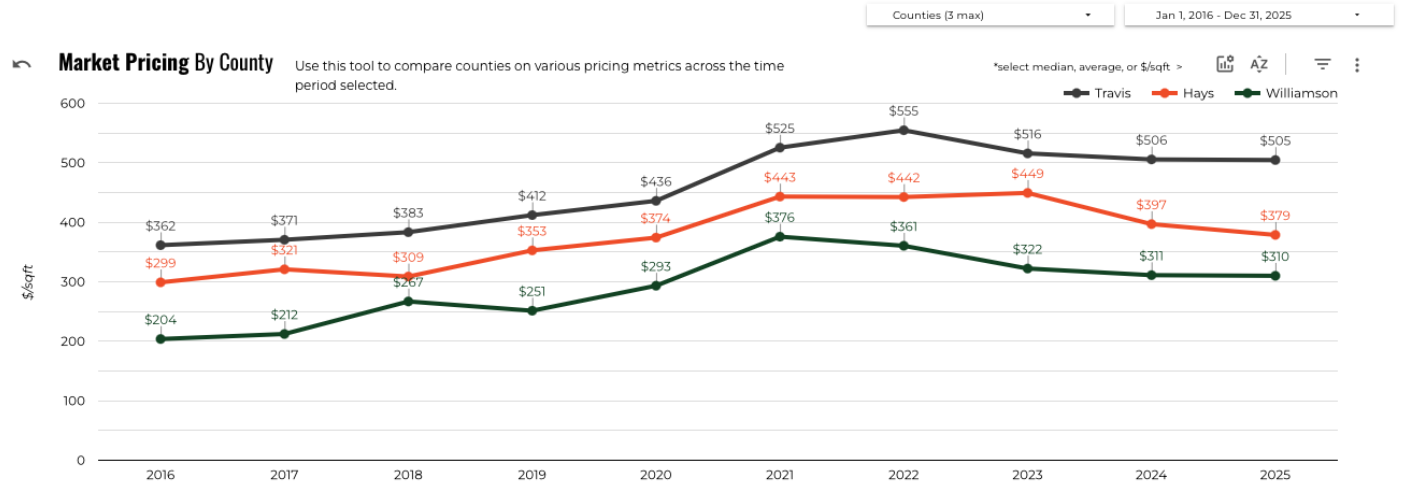
This chart compared the average price per square foot of a luxury home separated by county from 2016 to 2025.
Austin Luxury Median Days on Market by County
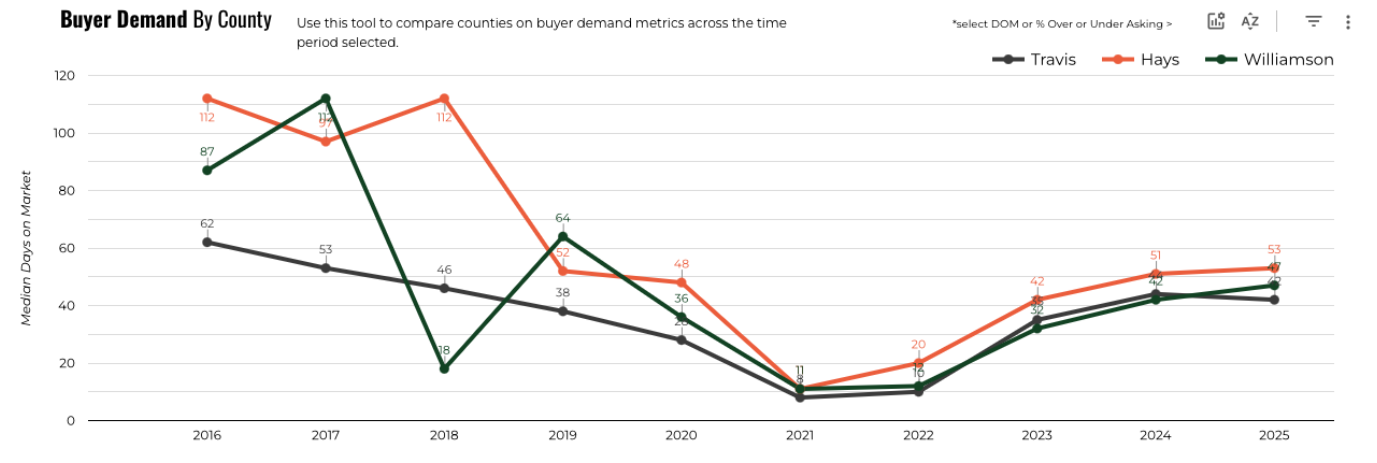
Here is a chart of the median days on market by county from 2015 to 2025. We are seeing median days on market come down a bit from the increase in 2023 and 2024. 2021 and 2022 were considered the peak of the Austin market, which coincides with the lowest median time to sell we’ve seen.
Buyer Demand by County – 3 Month History
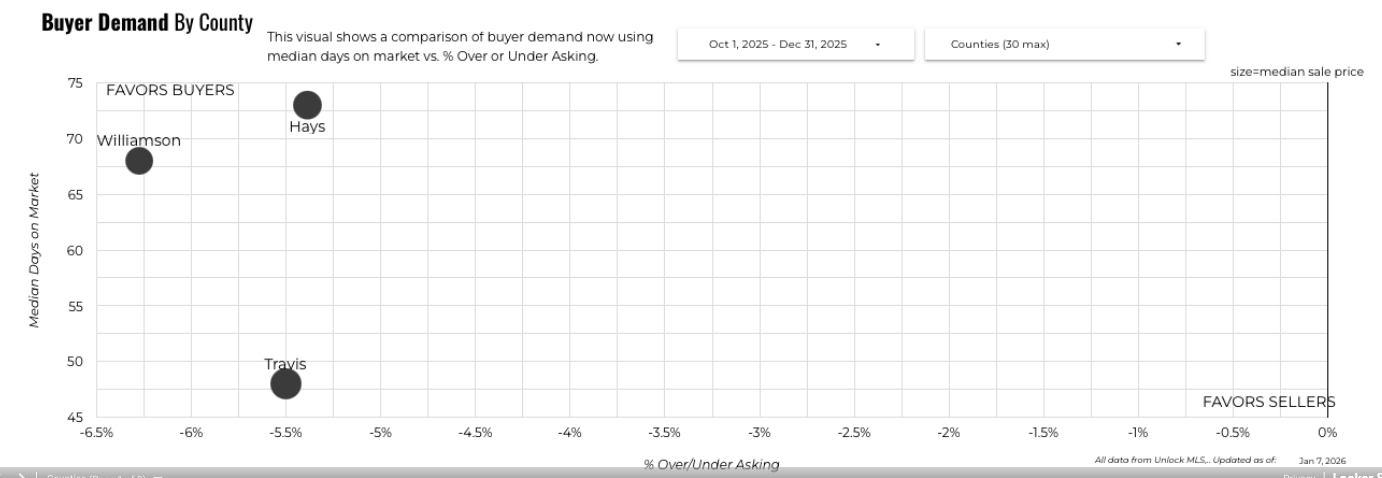
In Travis County we see market conditions more favoring sellers while in Williamson and Hays Counties they are more favoring buyers in the last 3 months. In Travis County, the median time to sell was 48 days with a median price of $1,410,000. Buyers were able to negotiate 5.5% off list prices. In Williamson County, the median time to sell was 68 days with a median price of $1,120,000. Buyers were able to negotiate 6.28% off list prices. In Hays County, the median time to sell was 73 days with a median price of $1,200,000. Buyers were able to negotiate 5.39% off list prices.
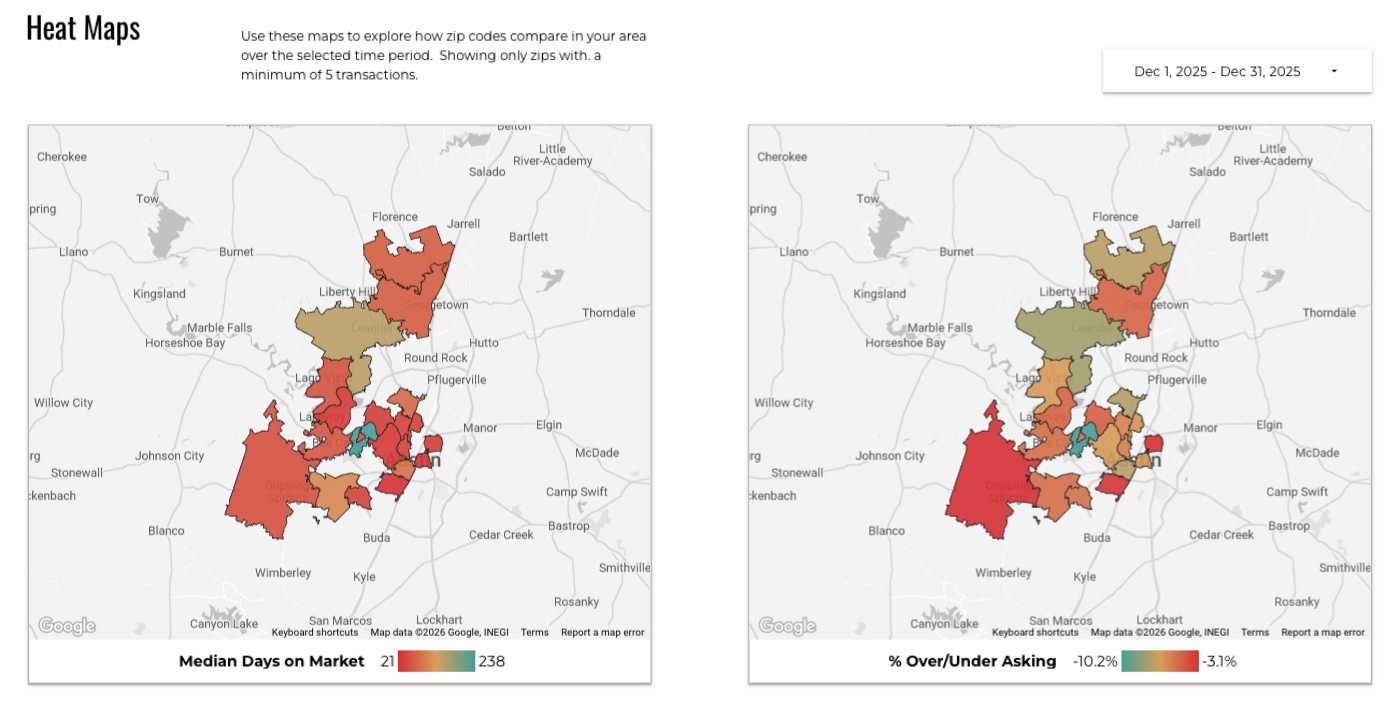
Heat Maps – Luxury Median Days on Market and $Over/Under Asking
This first set of maps shows the median days on market by area. The blue is the longest days on market and the red is the shortest median days on market. The chart to the right shows the % under asking (nothing sold over asking). The blue shows a higher discount negotiated by buyers and red shows the least discount negotiated by buyers.
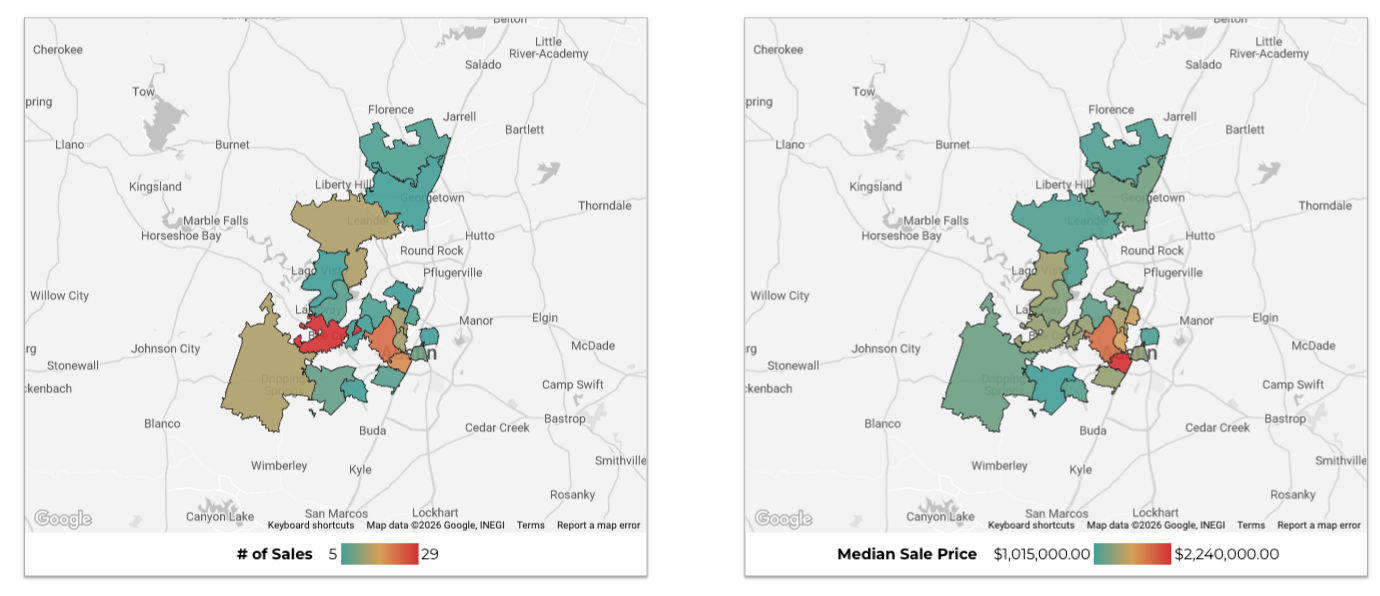
Number of Sales and Median Sale Price
These charts show the concentration of luxury home sales (the greatest number of luxury sales is located in Central and West Austin) and the median sales price. The highest median sales prices for luxury homes are again found in Central and West Austin.
Austin Luxury Home Sales December 2025
Here is some additional data on the 220 luxury homes that sold in Travis, Williamson and Hays Counties in December 2025. These 220 homes sold for $1 million or more.
- 4 luxury homes that sold were Foreclosures (Bank Owned)
- 10 luxury homes were Waterfront
- 94 luxury homes were in the Austin ISD
- 17 luxury homes were in the Dripping Springs ISD
- 25 luxury homes were in the Eanes ISD
- 7 luxury homes were in the Georgetown ISD
- 1 luxury home was in the Hays ISD
- 34 luxury homes were in the Lake Travis ISD
- 17 luxury homes were in the Leander ISD
- 7 luxury homes were in the Round Rock ISD
- 0 luxury homes were in the San Marcos ISD
- 4 luxury home was in the Wimberley ISD
- 36 luxury homes were in Gated Communities
- 110 luxury homes were in HOA’s
- 121 luxury homes had Pools
- 60 luxury homes were on Septic Systems
- 178 luxury homes that sold were located in Travis County
- 20 luxury homes that sold were located in Williamson County
- 22 luxury home that sold were located in Hays County
Source: ACTRIS, Home Sales in Travis, Williamson and Hays County Over $1 Million in December 2025
December 2025 Austin Luxury Home Sales Map
All of the Austin luxury single family homes that sold in December 2025 were west of 130, south of 138 and north of 150 (with the exception of 1). Here is a map of the 220 luxury homes that sold in Austin in December 2025.
December 2025 Luxury Real Estate Price Report – Strictly Numbers
For those of you who prefer to see the actual numbers, we’ve listed the figures for December 2025 Austin area luxury home sales below. The most expensive luxury home that sold in December 2025 sold for $8,000,000 and the least expensive luxury home sold for $1,000,000. Austin luxury homes ranged in size from 1,428 sqft – 9,184 sqft with an average size of 3,730 sqft. The average price per square foot for a luxury home that sold in Austin in December 2025 was $486.68 with the lowest being $208.33/sqft and the highest being $2,430.96/sqft. It took, on average, 80 days to sell a luxury home in Austin and sellers received, on average, 90.15% of their original list prices.
| | Beds | Baths | SqFt | List Price | LP/SqFt | Sold Price | SP/SqFt | SP/LP | SP/OLP | ADOM |
|---|---|---|---|---|---|---|---|---|---|---|
| Min | 2 | 2 | 1,428 | $950,000 | $222.20 | $1,000,000 | $208.33 | 76% | 53% | 0 |
| Max | 8 | 9 | 9,184 | $8,595,000 | $2,528.20 | $8,000,000 | $2,430.96 | 111% | 111% | 407 |
| Avg | 4 | 4 | 3,730 | $1,837,424 | $518.64 | $1,724,299 | $486.68 | 94.5% | 90.15% | 80 |
| Med | 4 | 4 | 3,596 | $1,469,954 | $452.43 | $1,398,000 | $423.10 | 95% | 91% | 48 |
| Search Criteria | |||
|---|---|---|---|
| Status | Sold | Sold Date | December 2025 |
| Property Type | Single Family Homes $1MM+ | Number Sold | 220 |
| Source: | ABoR Sales Data | Area | Travis, Hays, Williamson Counties |
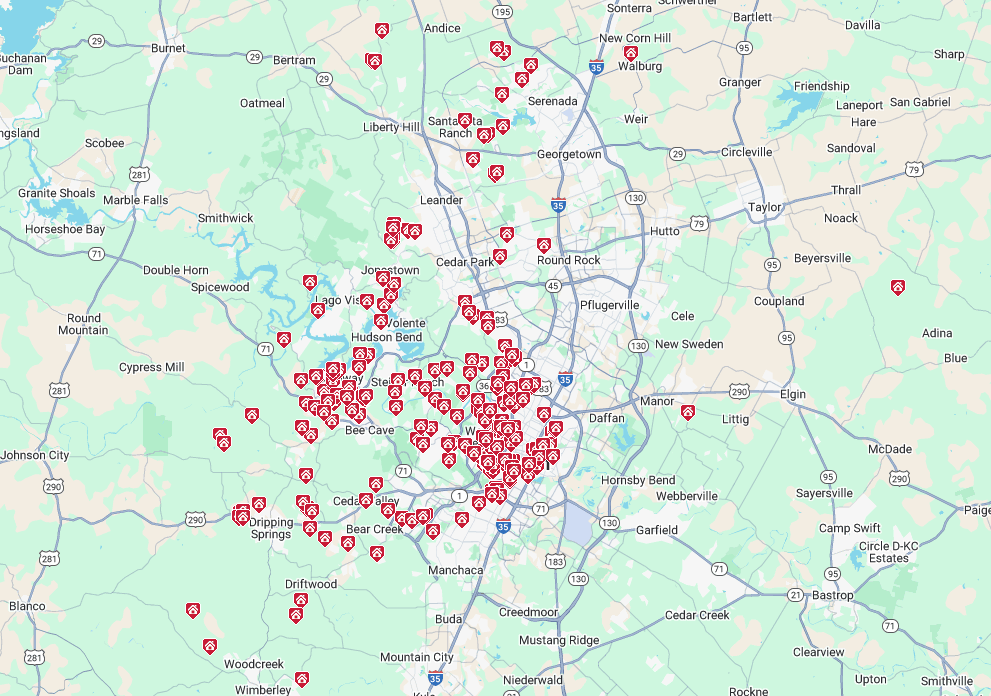
Luxury Homes for Sale Around Austin
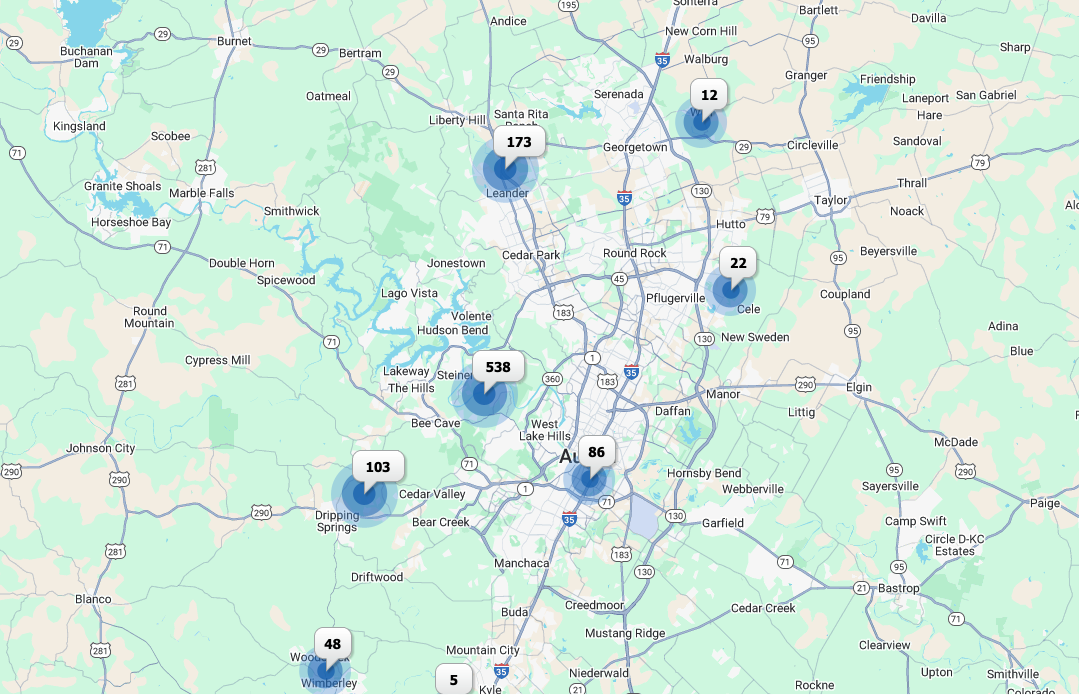
Here is a map of the 994 luxury homes for sale in the Austin area as of January 7, 2026. 717 are located in Travis County, 153 in Williamson County and 124 in Hays County. Here is a map.
Tips for Buyers
- Negotiate from the data, not the vibe. With closings averaging ~6% under list market-wide, assume there is room to move. Then, calibrate that assumption to the specific neighborhood or zip code and the home’s days on market.
- Target the ‘softer’ tiers strategically. If you want real leverage, shop where supply is higher—especially in that $1.4M+ tier (4.9 MOS)—and use that inventory data as justification for your price and terms.
- Use “price-drop timing” as your playbook. Many sellers adjust within roughly 19 days. If a home is fresh to market, you may need to be clean and strong with your offer. If it’s past that first reduction window (or already reduced), negotiate harder—because the market is signaling resistance.
- Ask for terms, not just price. In a market where sellers are commonly accepting offers below list, you can often improve the deal via repairs, rate buydowns, closing costs, or specific performance timelines—especially on listings that have already had to reduce their price.
Tips for Sellers
- Price to win the first 2–3 weeks. With the median first drop happening at 19 days, the market is telling you loudly that overpricing gets punished quickly.
- Avoid the slow-bleed reduction pattern. Average drops are around 9%, and homes that drop still take a median 48 days to go pending. That argues for either:
- a) strong day-one pricing, or
- b) one decisive correction instead of multiple small cuts.
- Stage and condition matter more in luxury right now. When buyers have options (and the market is clearing below list), they will pay up for “turnkey” properties and discount anything that feels like a project—even if the comps look similar.
- Know your micro-market and message it. For example, Austin proper posted 164 sales with a $1.435M median but still sold at ~6% under asking. That is active demand, but buyers are value-driven. Build your marketing narrative around what makes your property scarce (views, walkability, school zone, remodel quality), not just size and finishes.
The Bottom Line
For buyers: This is a market where patience and precision pay off. You don’t need to overpay broadly when the averages show ~6% under asking and meaningful price-drop behavior across the board. The best strategy is to get hyper-local on comps, pursue leverage in the $1.4M+ tier (higher supply), and negotiate on both price and terms, especially when DOM starts to climb.
For sellers: You can absolutely sell right now—activity is up year-over-year in multiple views of the data—but you must respect buyer expectations. The winning play is correct pricing early, premium presentation, and a proactive plan if you don’t see traction in the first few weeks (because the market often forces that first adjustment around day 19).
Considering Buying or Selling a Luxury Home in Austin?
Our team of Austin luxury real estate market specialists know the market well and can help you get the best deal possible. For more info about our team and how we work, check out our Austin Home Buyers and our Austin Home Sellers sections. Then, call us at (512) 872-8323 or email us at info@11OaksRealty.com to schedule a consultation.
Questions About the December 2025 Austin Luxury Real Estate Price Report?
Do you have questions about the December 2025 Austin Luxury Real Estate Price Report? Call us at (512) 827-8323 or email us at info@11OaksRealty.com and we’ll help you in any way we can.




Leave a Reply