
Eleven Oaks Realty is proud to present their June 2026 Austin Real Estate Price Report measuring activity in the single family home market.

June 2026 delivered a meaningful milestone for Austin’s housing market: the median sold price for single-family homes reached $645,000, the highest reading in the two-year data window tracked by RPR, rising 4% from May and 2.4% from a year ago. Inventory continued to shrink on a year-over-year basis, with months supply falling to 4.45 months, down 26.6% from the 6.06 months recorded in June 2025, a shift that is keeping Austin in seller’s market territory even as spring activity begins its seasonal cooldown. Sales volume pulled back from May’s strong pace, with 814 homes sold and 773 new contracts signed, both reflecting the typical early-summer deceleration while remaining close to year-ago levels. This report covers median sold price, list price trends, price per square foot, days on market, inventory, pending contracts, sales volume, and buyer demand by price range for the Austin single-family home market in June 2026.
All data below covers single-family residential homes in the city of Austin. Data is sourced from Realtors Property Resource (RPR) and the Austin Board of REALTORS MLS. Some metrics may vary slightly between sources due to differing methodology; where differences exist, they are noted.
The Austin Real Estate Market is a Seller’s Market
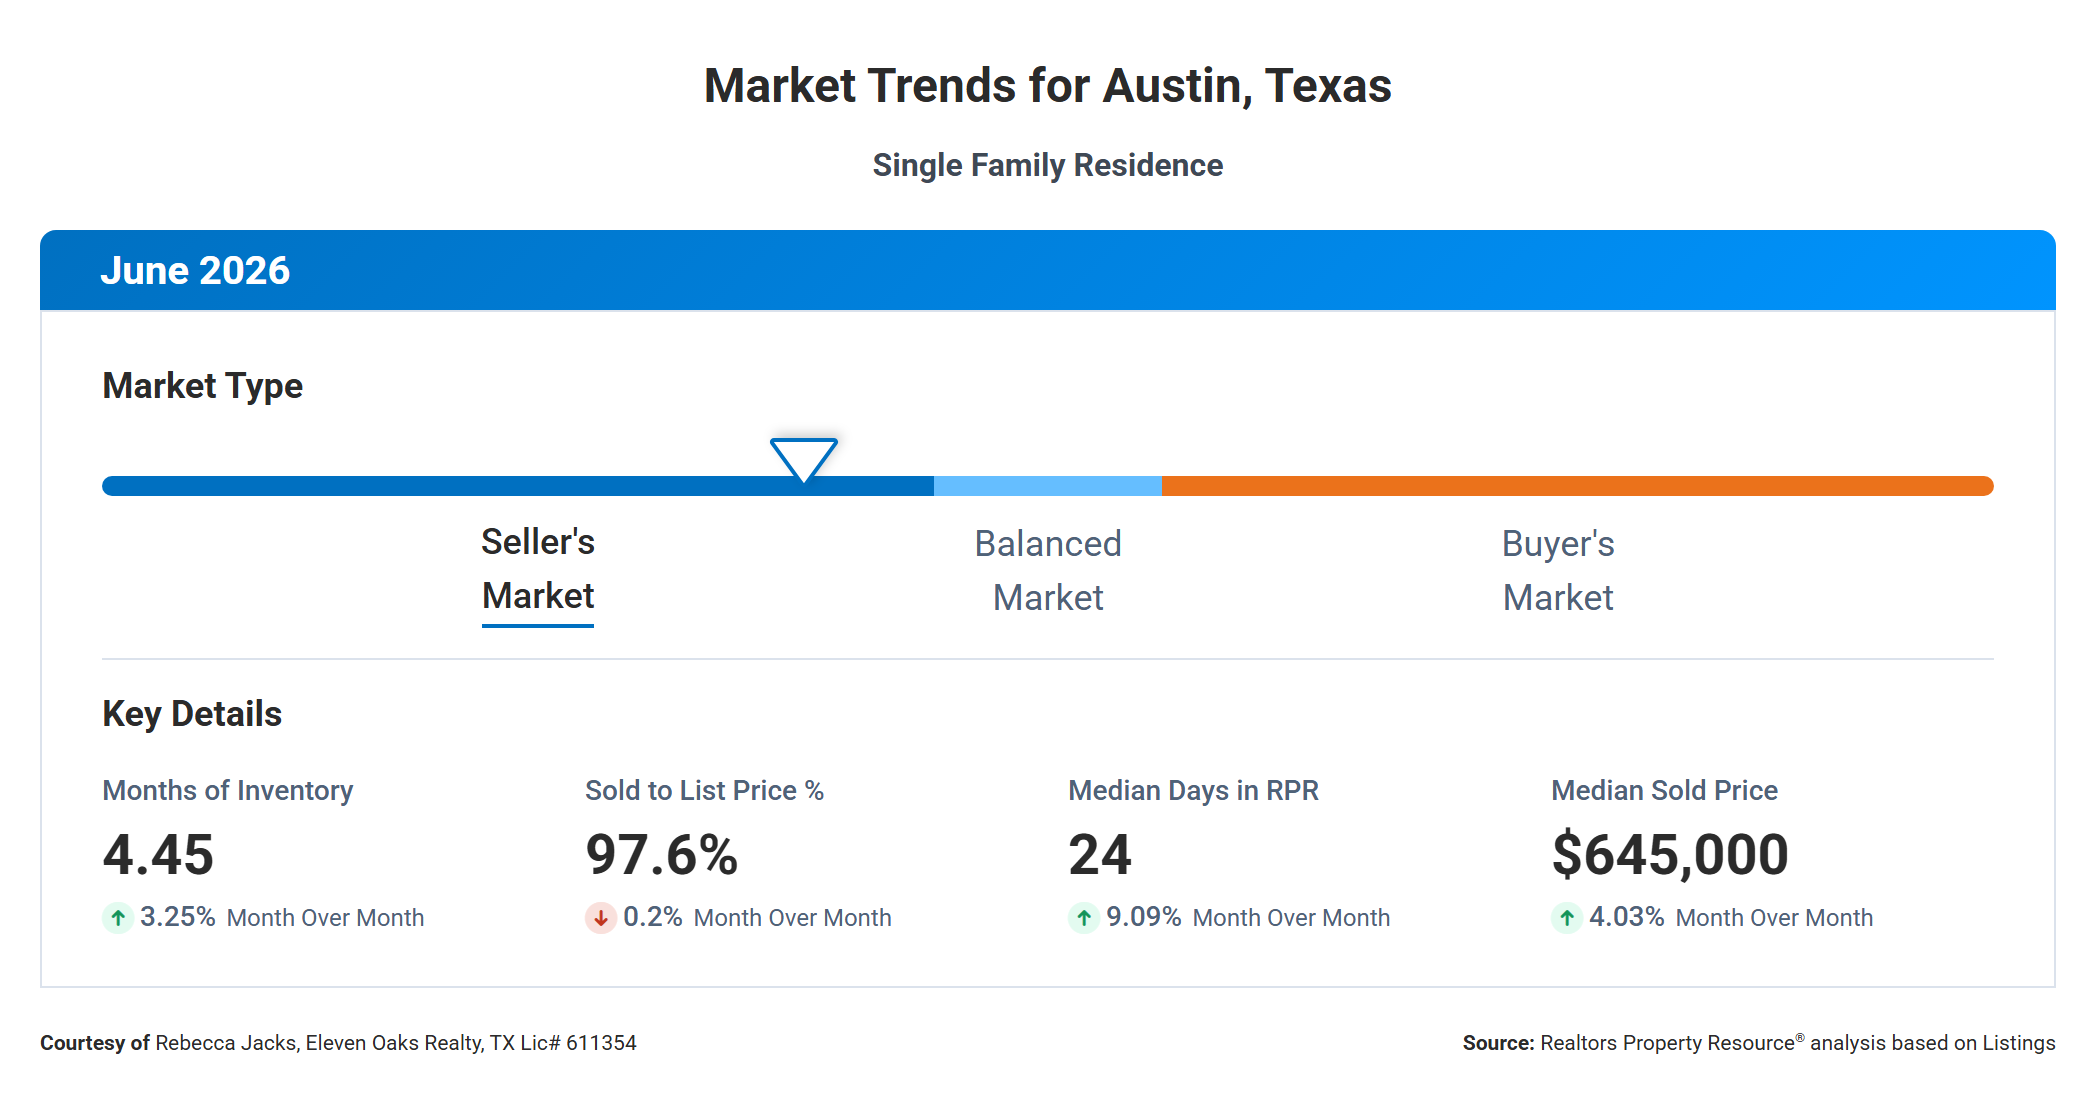
RPR classified Austin as a Seller’s Market in June 2026, with 4.45 months supply of inventory on the market. That number sits at the lower end of the balanced range and, combined with the other signals on the dashboard, keeps conditions tilted in favor of sellers. Compared to the 6.06 months recorded in June 2025, the inventory contraction over the past year is substantial, and the tightening trend has been the defining feature of Austin’s market through the first half of 2026.
The four key metrics on the dashboard tell a consistent story. Months supply rose 3.25% from May’s 4.31 to 4.45 in June, a seasonal uptick as listings accumulate and buyer activity plateaus after the spring rush. The average sold-to-list price ratio came in at 97.6%, down just 0.2% from May, meaning buyers continued to pay very close to asking prices throughout the month. Median days on market increased 9.09% from 22 days in May to 24 days in June, which is still an exceptionally quick pace historically. The median sold price reached $645,000, up 4.03% from May’s $620,000 and the highest level in the two-year tracking period.
Taken together, these four signals describe a market that is active, competitively priced, and moving quickly. Sellers are not giving away homes, but buyers who are prepared and priced realistically are still finding their offers accepted at or very near asking price. The next 60 to 90 days will be worth watching closely as inventory continues to rebuild from last winter’s lows and seasonal demand patterns determine whether those months-supply numbers trend higher or hold steady.
Median Sold Price Up 2.4% Year Over Year
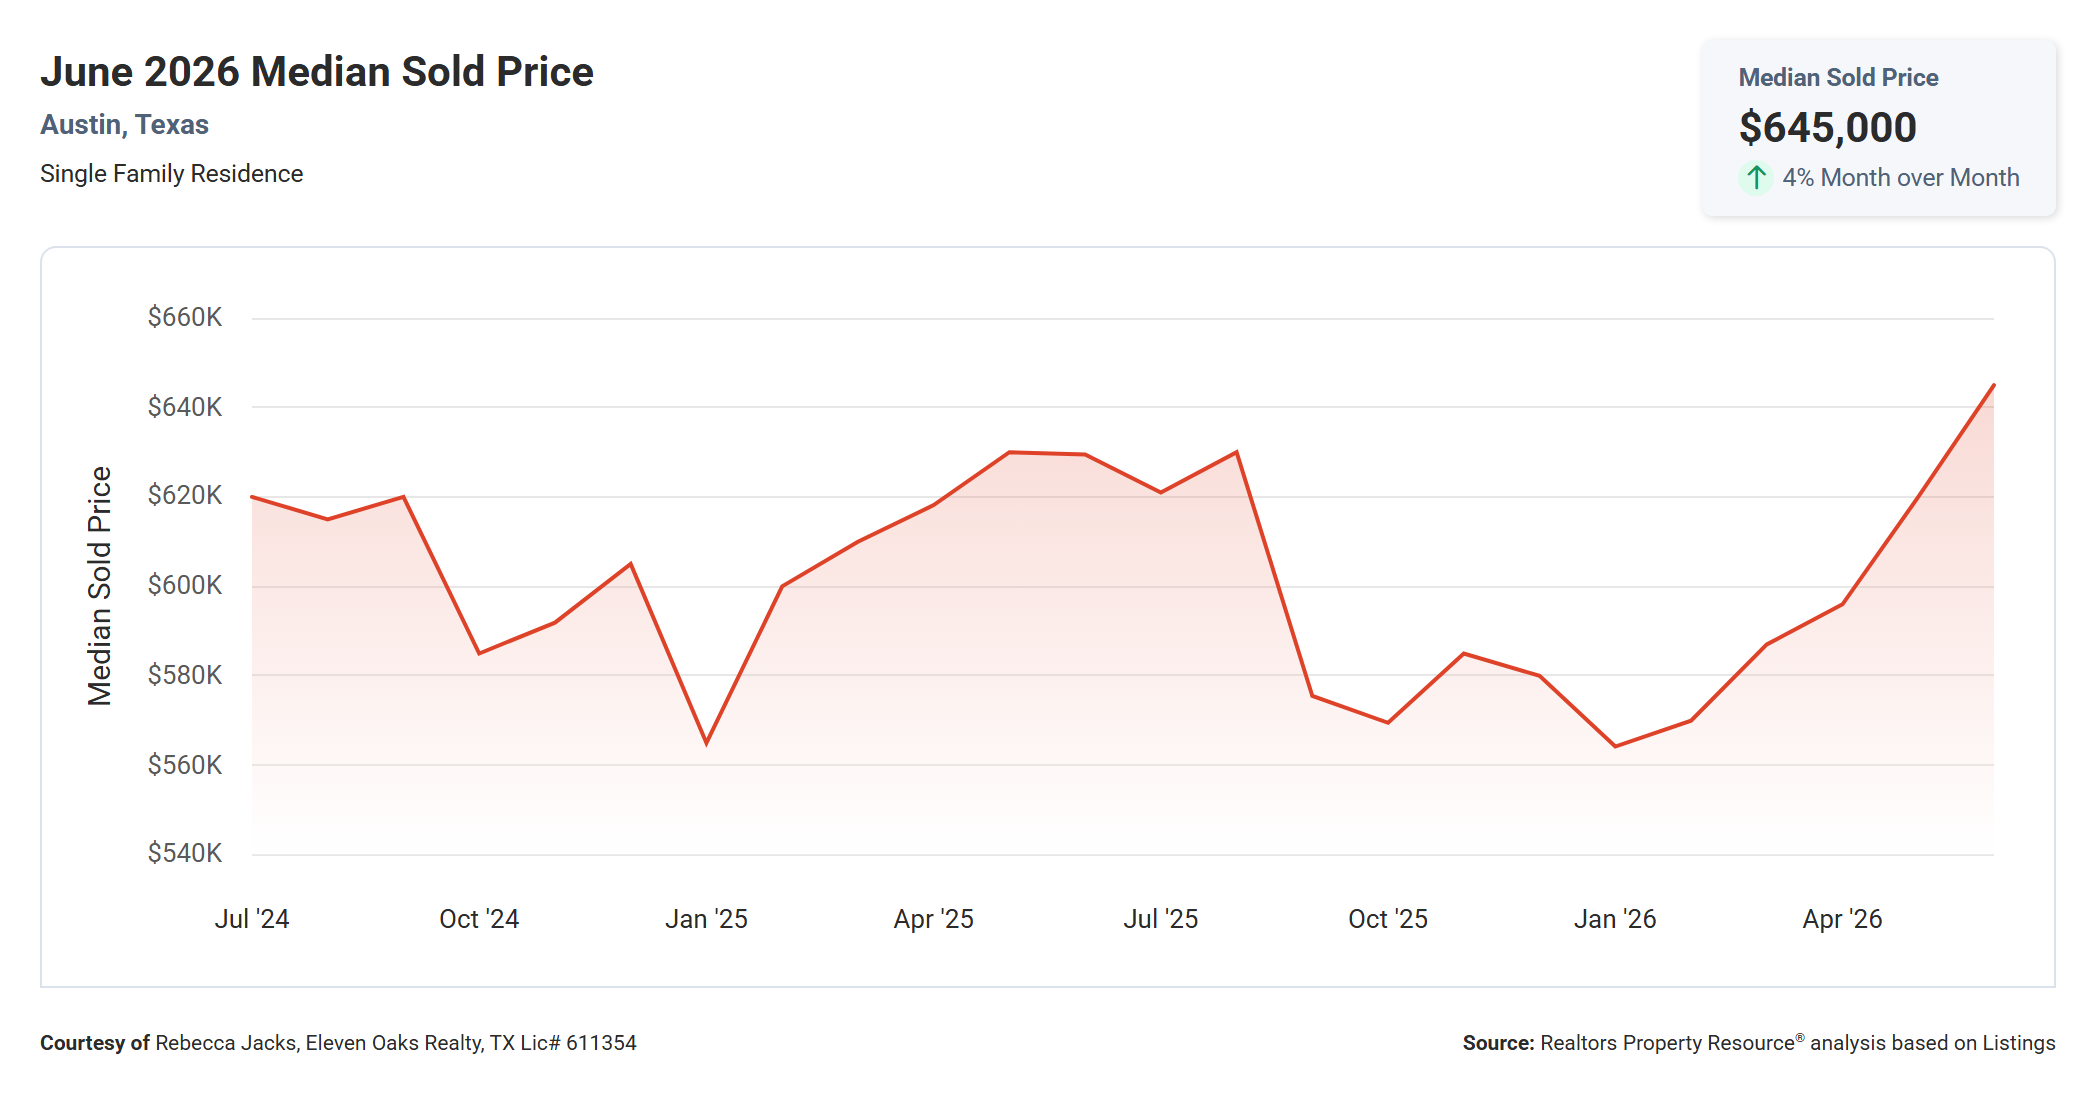
The median sold price for single-family homes in Austin in June 2026 was $645,000, up 4% from May 2026’s $620,000 and up 2.4% from June 2025’s $629,500.
The two-year chart tells a clear story of recovery and seasonal strength. Prices bottomed at approximately $562,000 in January 2025, the softest reading in the tracking window, before climbing through spring 2025 to about $628,000 by June of that year. A second dip followed through the fall and winter of 2025, with prices settling around $565,000 in January 2026. Since then, the trajectory has been steadily upward, with June 2026’s $645,000 sitting at the highest point in the entire two-year dataset.
In dollar terms, the year-over-year gain amounts to roughly $15,500 more for a typical Austin home compared to what buyers were paying in June 2025. For sellers, the trend reinforces the value of patience: homes listed and priced accurately in the spring selling season have consistently captured the highest valuations. The seasonal pattern also suggests that the summer months typically represent a pricing peak before the fall softening begins, so sellers who are still on the market in July and August should be prepared for renewed negotiation pressure if their homes remain unsold.
Median Active List Price Down 3.8% Year Over Year
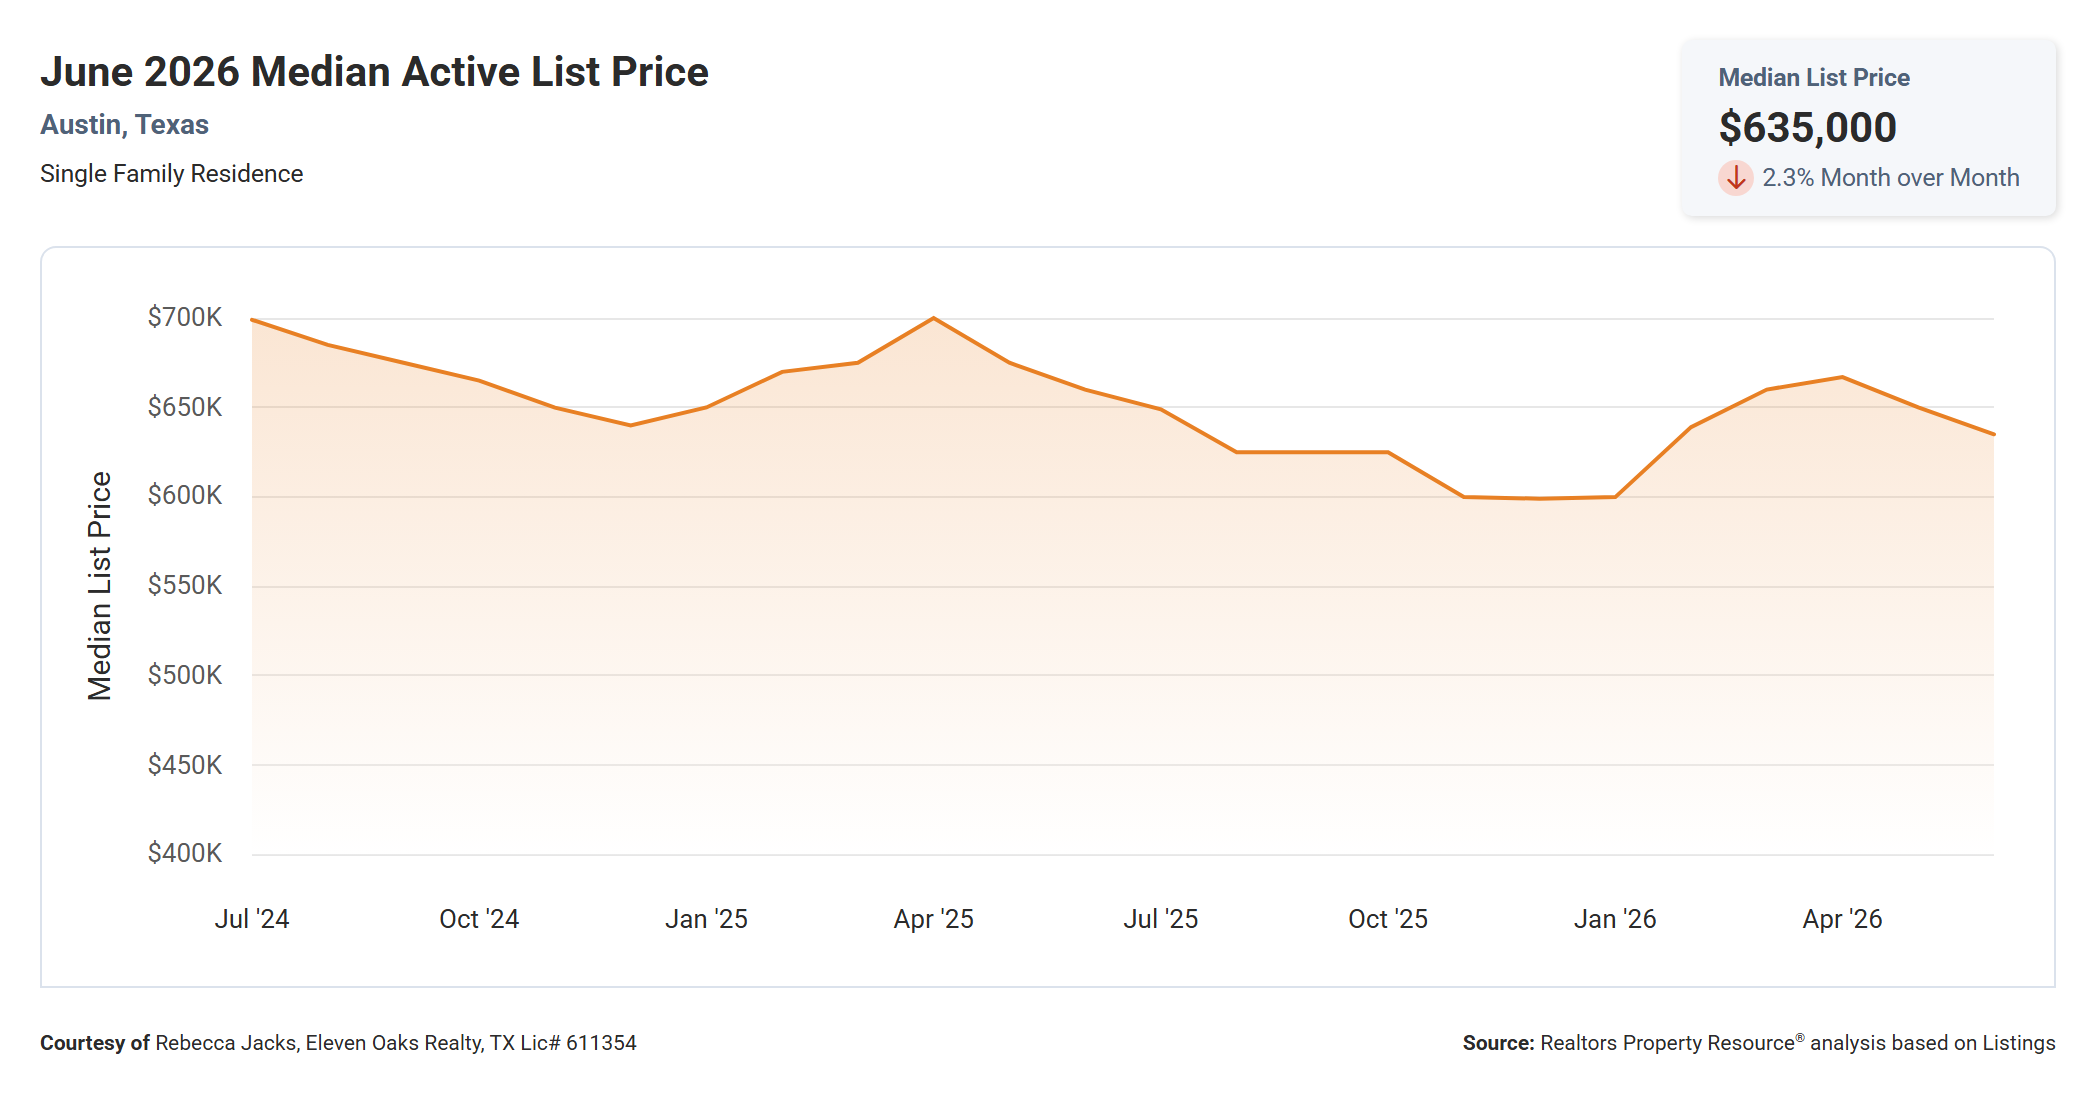
The median active list price in Austin in June 2026 was $635,000, down 2.3% from May 2026’s $650,000 and down 3.8% from June 2025’s $660,000.
The two-year chart shows that seller pricing expectations have moderated meaningfully since the mid-2024 period, when the median list price was tracking around $700,000. Prices declined gradually through late 2024 and into 2025, dipping to approximately $600,000 in late 2025 before recovering to $665,000 by May 2026. The June pullback to $635,000 reflects both the seasonal pattern of spring listings cycling out of the active inventory and new, more conservatively priced listings entering the pool.
The gap between the median list price ($635,000) and the median sold price ($645,000) tells an interesting story: sellers who are currently on the market are, on average, priced slightly below where June closings are landing. That can reflect either that active inventory skews toward smaller or less upgraded homes, or that closed transactions are drawing from listings that came to market a month or two earlier when pricing expectations were somewhat higher. Either way, the compression between what sellers are asking and what buyers are paying is relatively tight, which is a healthy sign for the market’s overall function.
Median Price Per Square Foot Up 3.0% Year Over Year
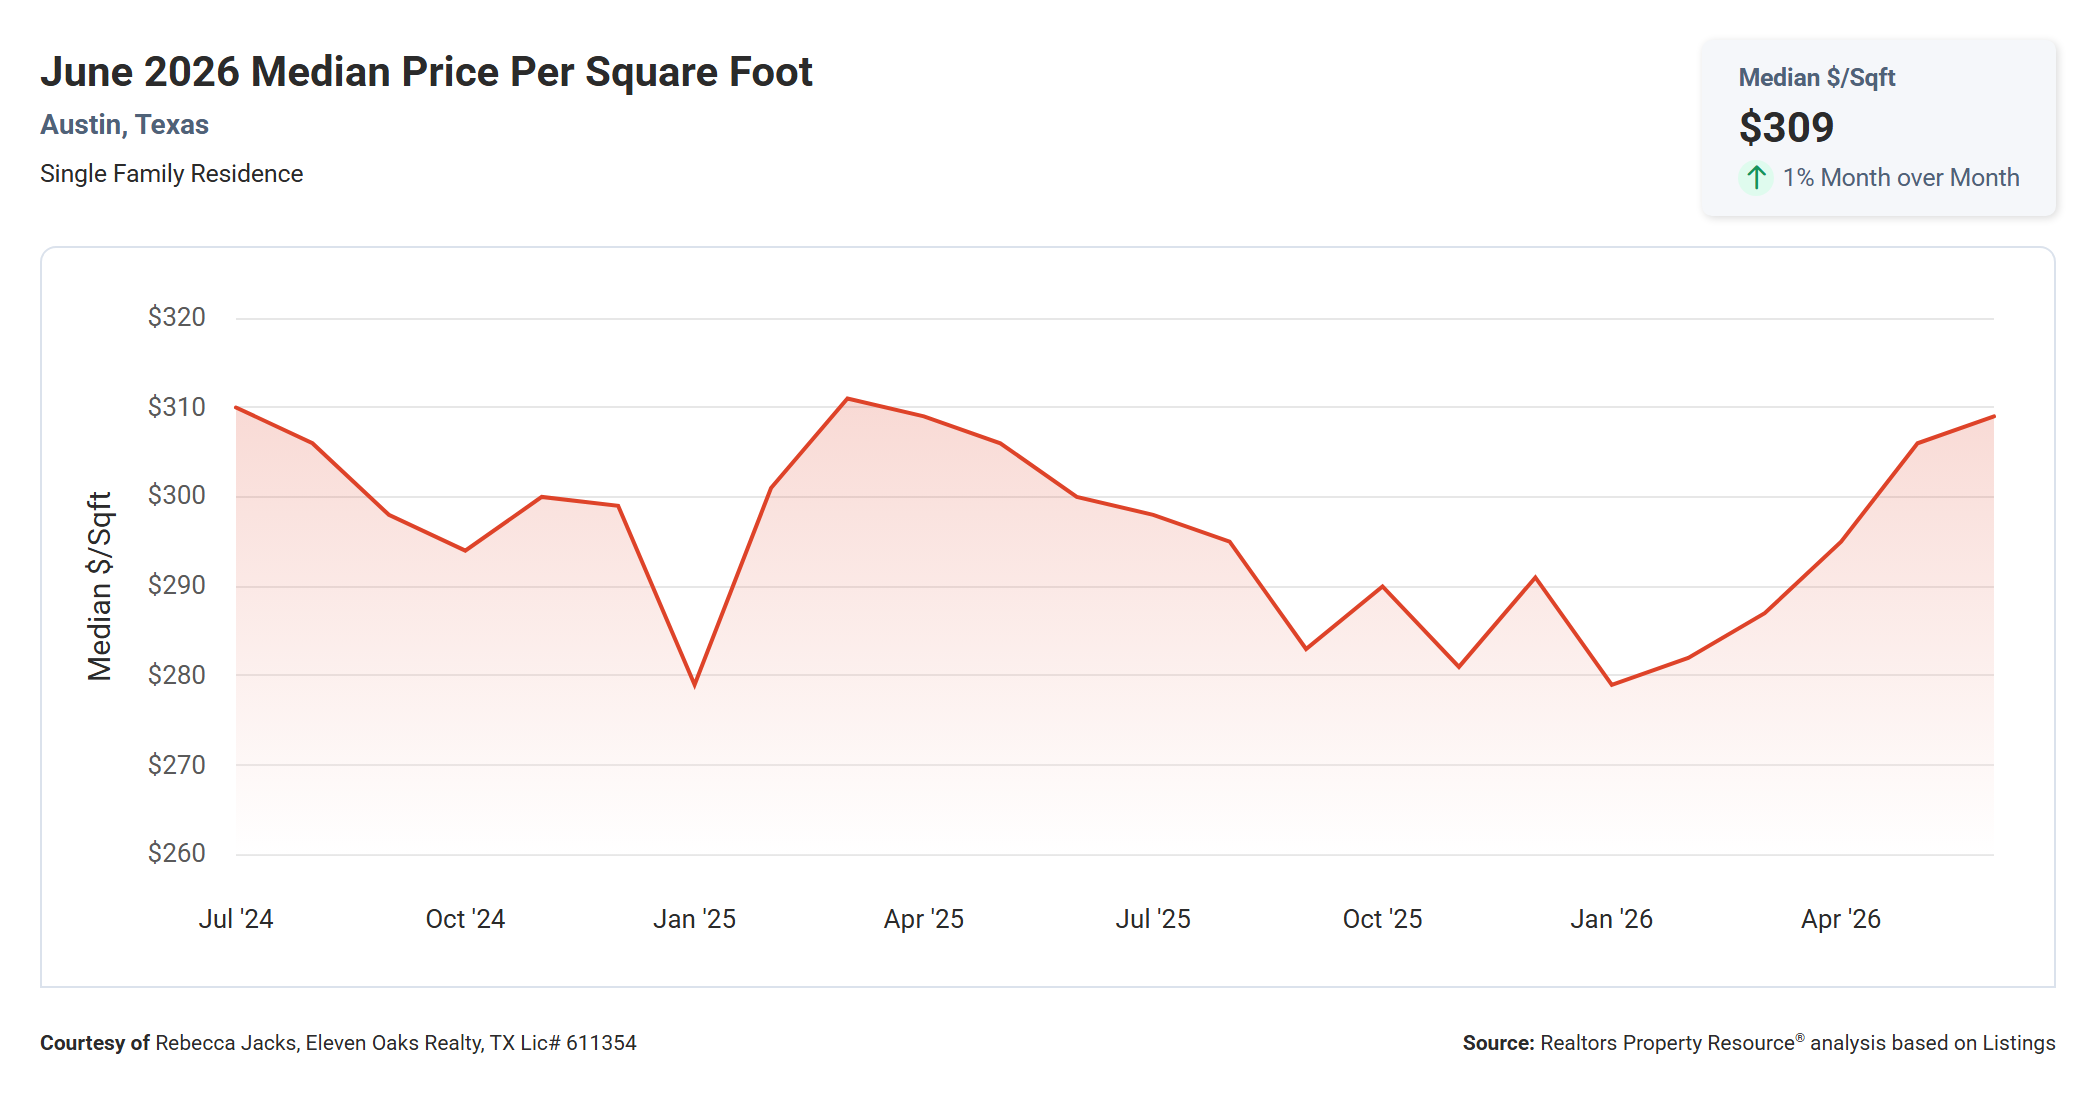
The median price per square foot for single-family homes in Austin in June 2026 was $309, up 1% from May 2026’s $306 and up 3.0% from June 2025’s $300 per square foot.
The two-year chart shows the per-square-foot metric following a similar seasonal pattern to the overall median price. Starting around $310 in July 2024, it dipped to a low of approximately $278 in January 2026 before recovering sharply through the spring. June’s $309 puts the market nearly back to where it was at the start of the tracking period, a meaningful recovery from the winter trough in just five months.
For buyers, the $309 per-square-foot benchmark provides a useful sanity check when evaluating whether a specific home is priced fairly for its size. A 2,000-square-foot home priced at $620,000 is landing right at median, while the same home at $660,000 is asking a premium that will need to be justified by condition, location, or finishes. For sellers, the per-square-foot trend confirms that the market is rewarding well-maintained, well-located homes, and that pricing above $330 to $350 per square foot requires a clear differentiator to support the ask.
Average Sold to List Price Essentially Unchanged Year Over Year
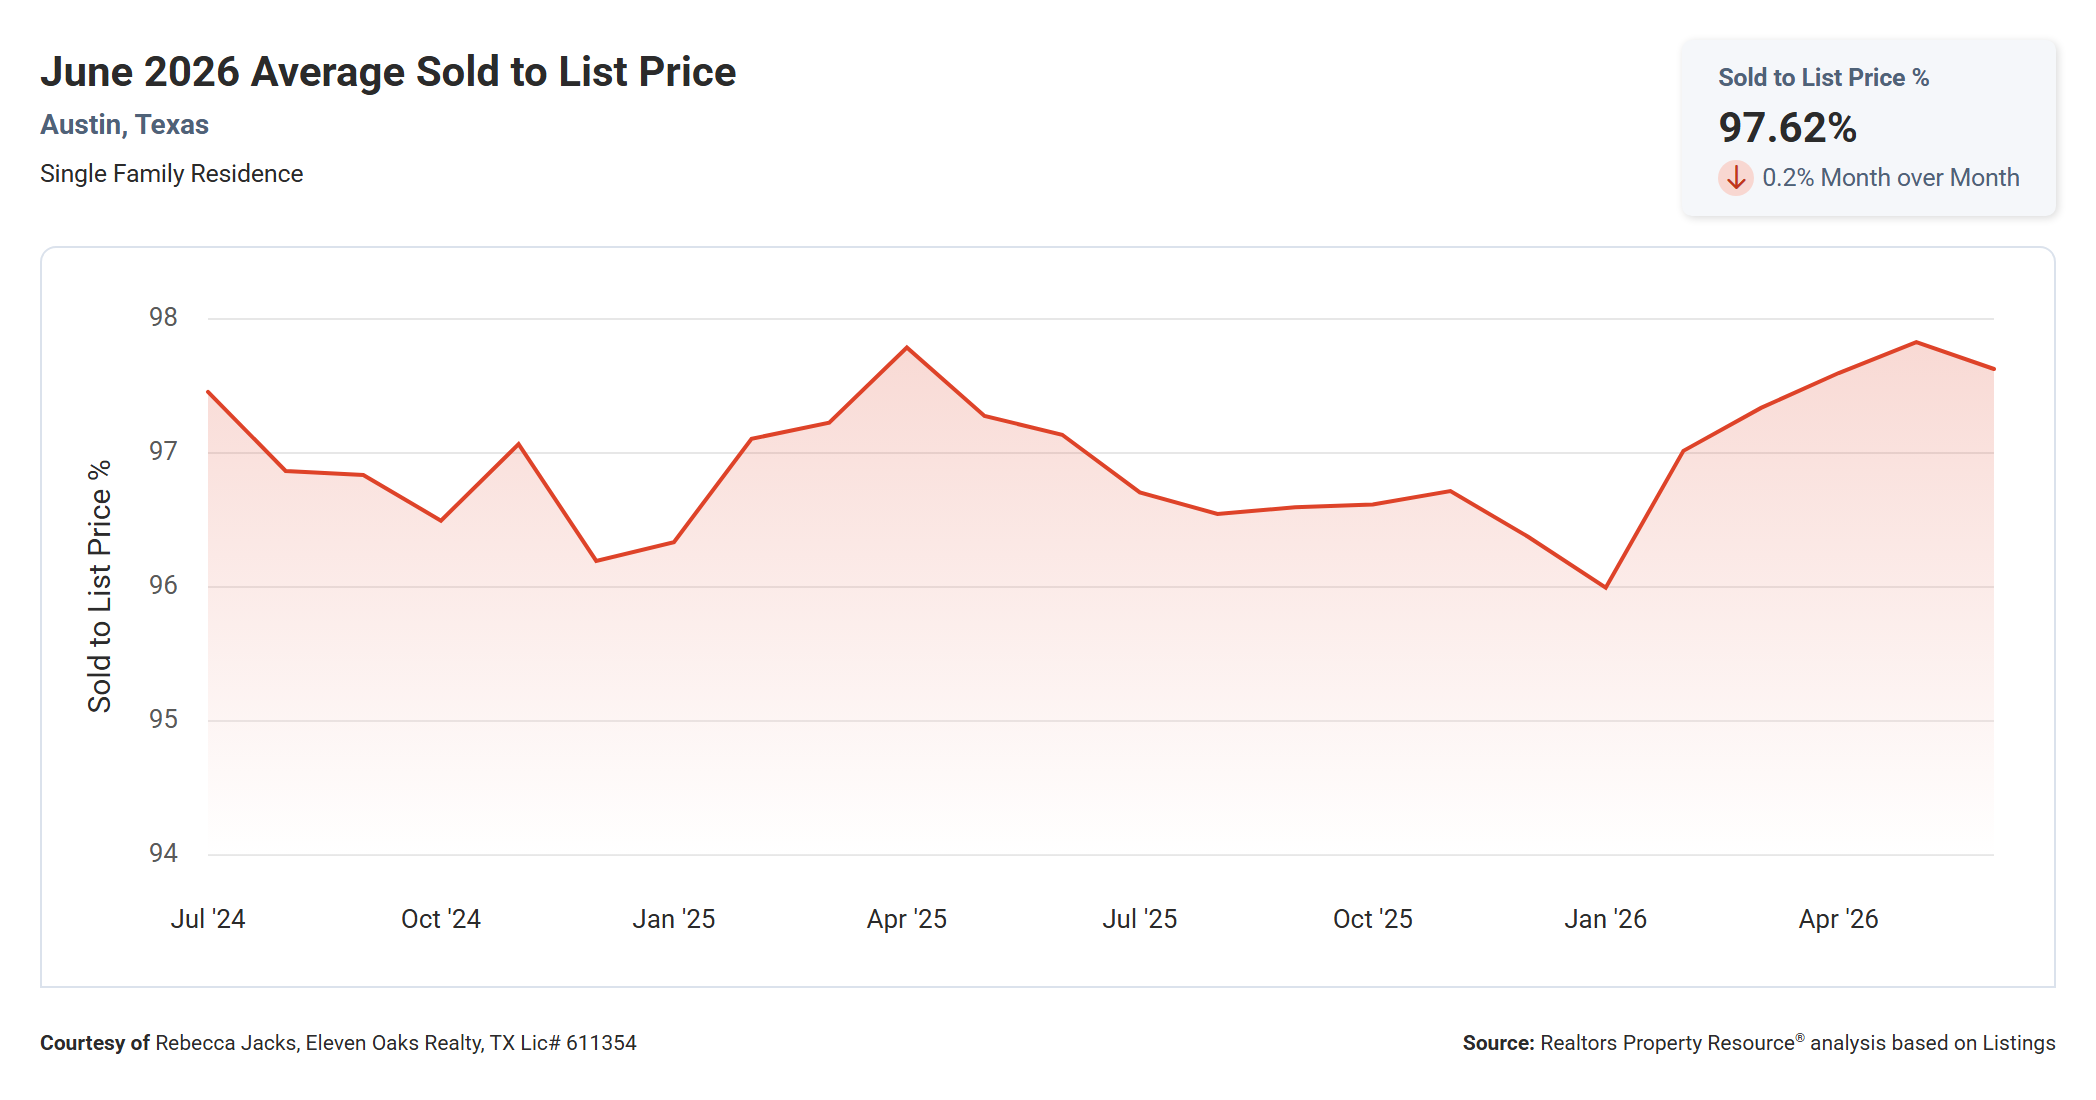
The average sold-to-list price ratio in Austin in June 2026 was 97.62%, down 0.2% from May 2026’s 97.82% and essentially unchanged from June 2025’s 97.13%.
Over the entire two-year chart, this metric has remained remarkably stable, oscillating between approximately 96.0% and 97.9% regardless of what was happening with prices, inventory, or volume. The seasonal low consistently appears in winter, when fewer buyers compete and sellers accept more modest discounts to close. The seasonal high appears in late spring, when demand peaks and buyers are competing more actively. June’s 97.62% sits near the high end of this range, indicating that the market remained competitive through the end of the spring selling season.
What this means practically is that Austin buyers in June were paying an average of about $0.024 below list price for every dollar of asking price. On a $645,000 home, that works out to roughly $15,500 below asking on average. That is not a large discount by historical standards, and it reflects a market where sellers still have meaningful leverage at the negotiating table. Buyers who go in expecting large concessions are likely to find themselves losing homes to more realistic offers.
Median Time to Sell Down 20.0% Year Over Year
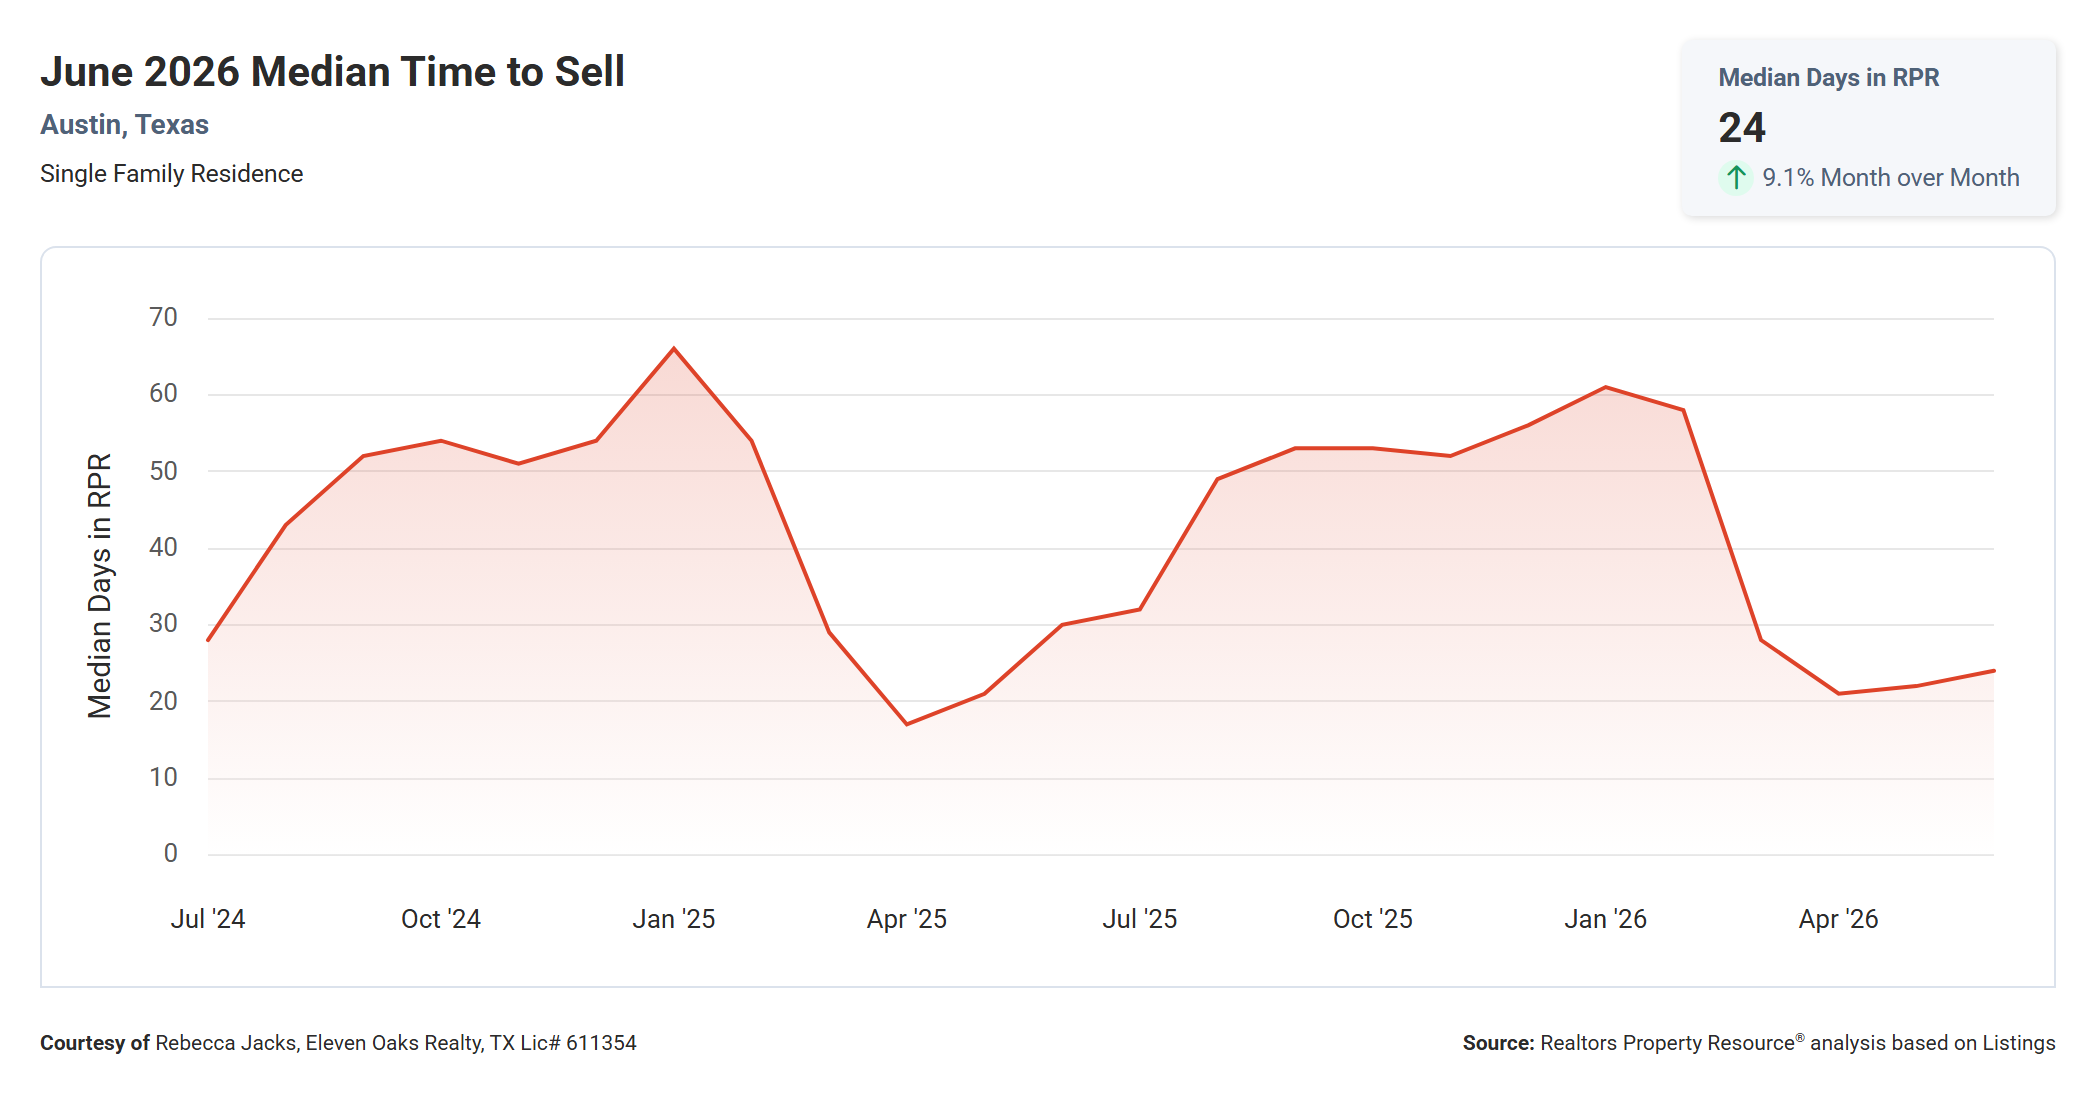
The median time to sell a single-family home in Austin in June 2026 was 24 days, up 9.1% from May 2026’s 22 days and down 20.0% from June 2025’s 30 days.
The two-year chart makes clear that time on market is highly seasonal and that June 2026 sits in a historically fast period for Austin. The metric spiked to 65 days in January 2025, reflecting the slow winter market, then plunged to approximately 17 days by March and April 2025. The pattern repeated in 2026, with time on market climbing to 60 days in January before dropping to 21 days in May and settling at 24 days in June. The year-over-year improvement of six days is meaningful: sellers in 2025 spent a month waiting for an offer, while sellers in 2026 are typically waiting less than three and a half weeks.
For buyers, 24 median days on market means that well-priced homes are still moving quickly, and hesitation can cost you a home. That said, the uptick from May’s 22 days suggests that buyers have a fractionally larger window than at the peak of spring activity. For sellers, the data supports listing without delay if summer is your target: June is historically one of the fastest months to sell in Austin, and that window tends to close as the calendar moves toward August and September.
Months Supply of Inventory Down 26.6% Year Over Year
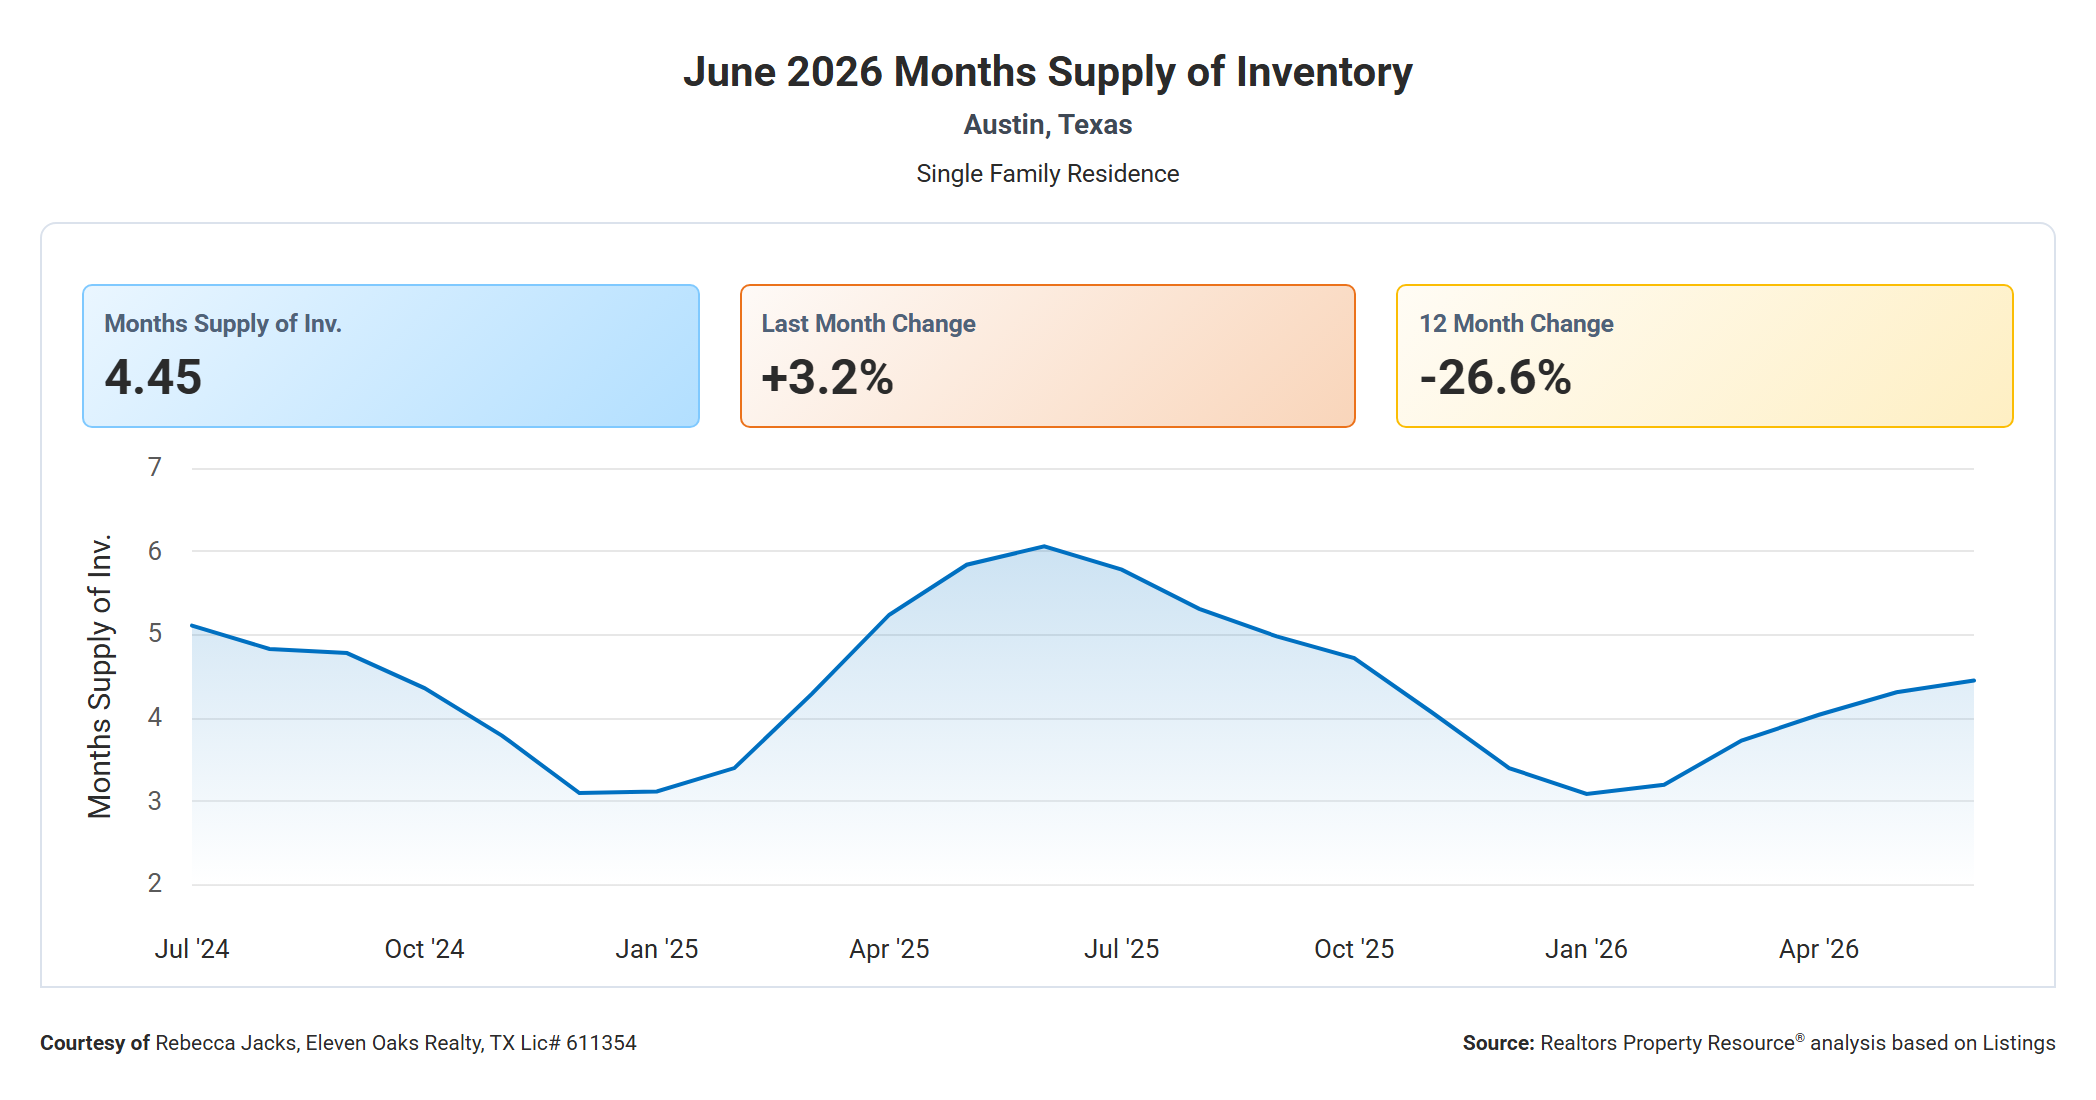
Months supply of inventory in Austin in June 2026 was 4.45 months, up 3.2% from May 2026’s 4.31 months and down 26.6% from June 2025’s 6.06 months.
The two-year chart shows a dramatic inventory cycle. Supply climbed from approximately 3.1 months in late 2024 to a peak of about 6.0 months in summer 2025, a level that clearly shifted negotiating power toward buyers and contributed to the price softening observed during that period. Since that peak, inventory has contracted sharply, bottoming around 3.1 months in January 2026 and gradually rebuilding to the current 4.45. The upward drift from the January low reflects the normal spring listing wave, but the pace of new listings has not kept up with demand, which is why the YoY reading shows such a large decline.
At 4.45 months, Austin sits right at the edge between a seller’s market and a balanced market. The direction matters as much as the number: supply is creeping upward month over month, which, if sustained, will gradually give buyers more options and more room to negotiate. However, given that June 2025’s 6.0 months produced only modest price softening and that inventory appears to be rebuilding slowly, the more likely scenario over the next 90 days is a continuation of the current, seller-favoring conditions rather than a rapid shift to buyer-friendly territory.
Active Listings Down 20.4% Year Over Year
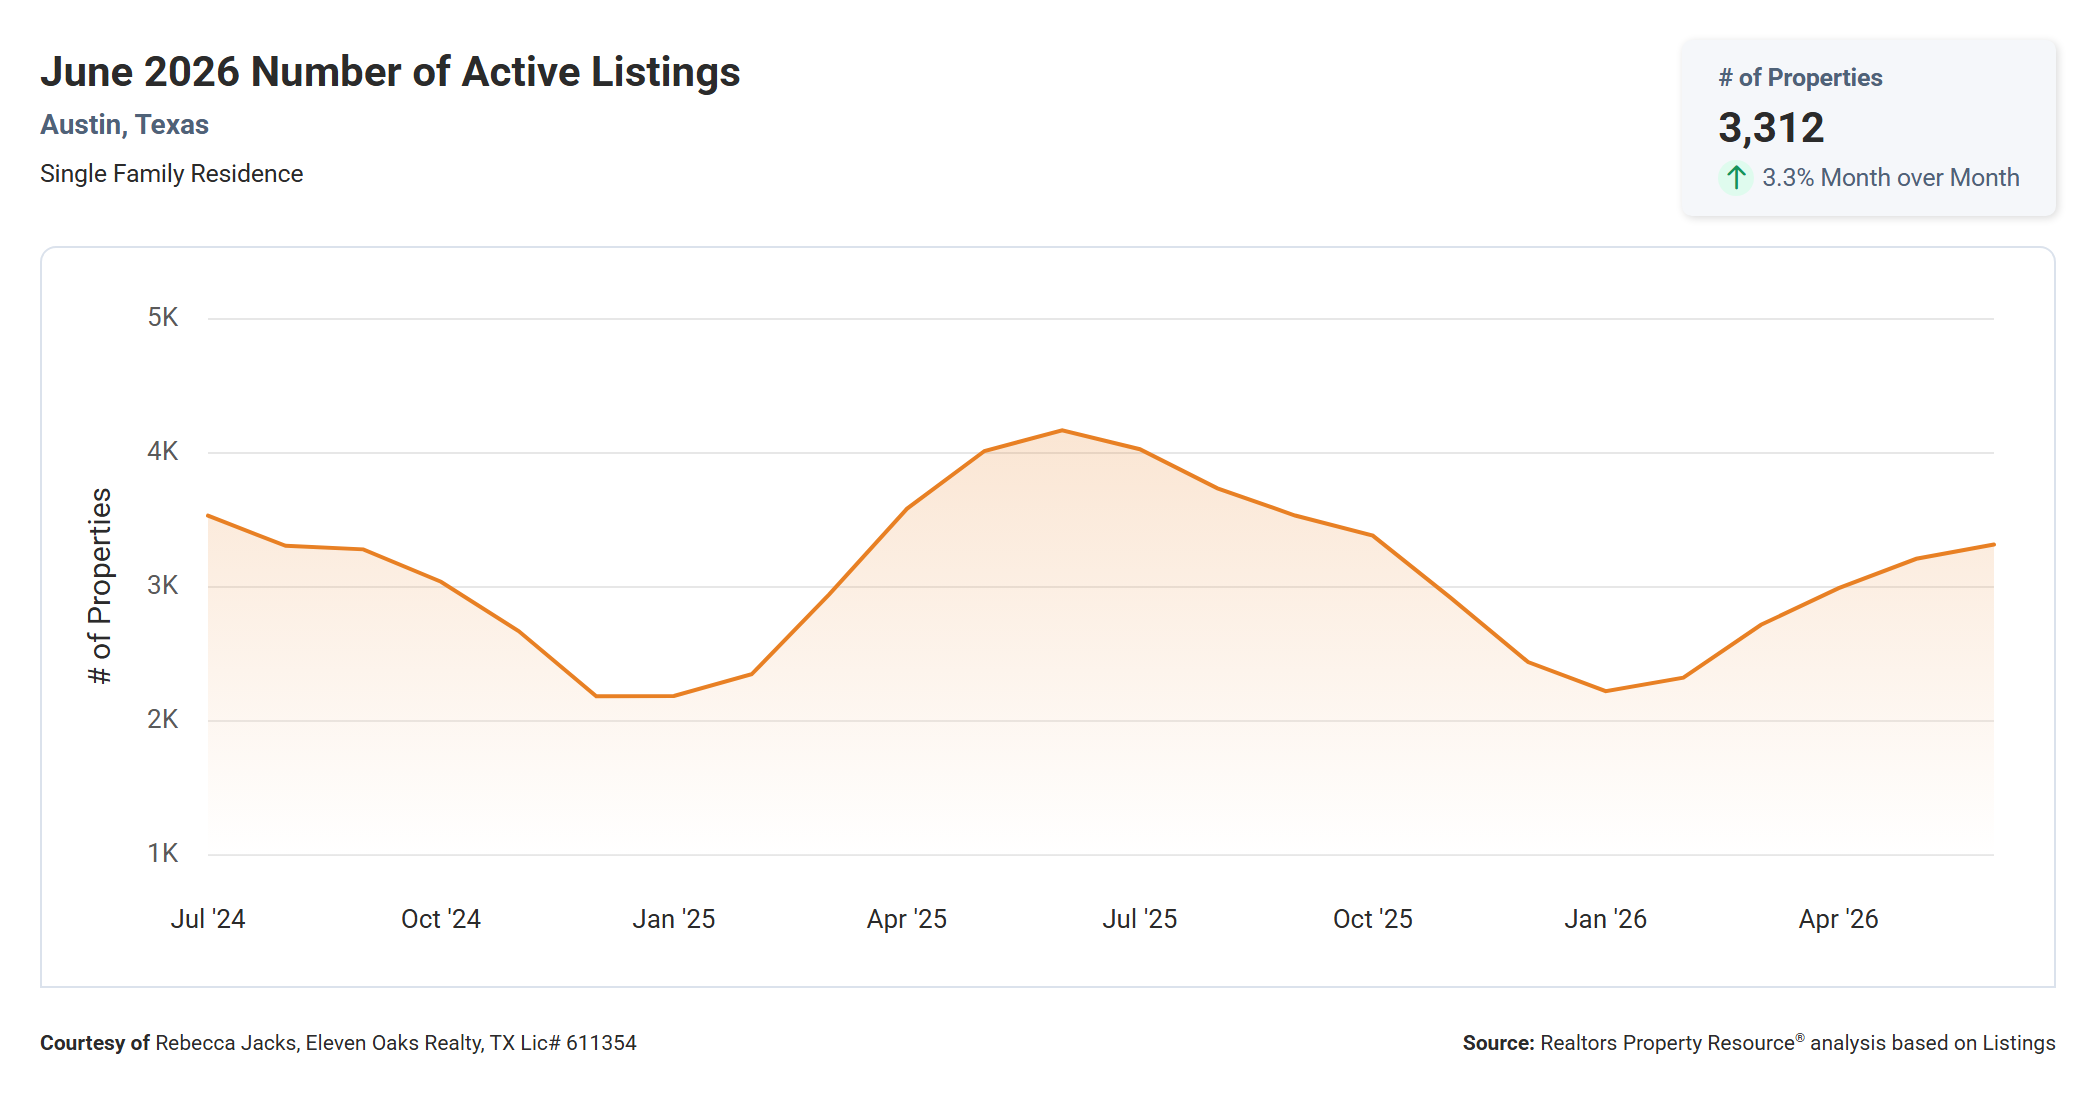
The number of active single-family listings in Austin in June 2026 was 3,312, up 3.3% from May 2026’s 3,210 and down 20.4% from June 2025’s 4,160.
The two-year chart shows that active inventory peaked at approximately 4,100 homes in July 2025, a level that gave buyers genuine choice and created competition among sellers. Since that peak, inventory declined through the fall and winter, reaching a low of about 2,200 homes in January 2026. The spring listing season has pushed active counts back up, but the recovery has been gradual: even after six months of rebuilding, June’s 3,312 homes represents roughly 20% fewer choices than buyers had at this time last year.
For buyers, the reduced inventory means you are competing for a meaningfully smaller pool of homes than you would have been a year ago. That creates more bidding pressure on well-priced listings and fewer opportunities to negotiate aggressively. For sellers, the compressed inventory is a genuine advantage: if your home is priced correctly and in good condition, you are competing against fewer comparable listings than at any point in the past year, which improves your odds of finding a ready buyer quickly.
New Listings Up Slightly Year Over Year
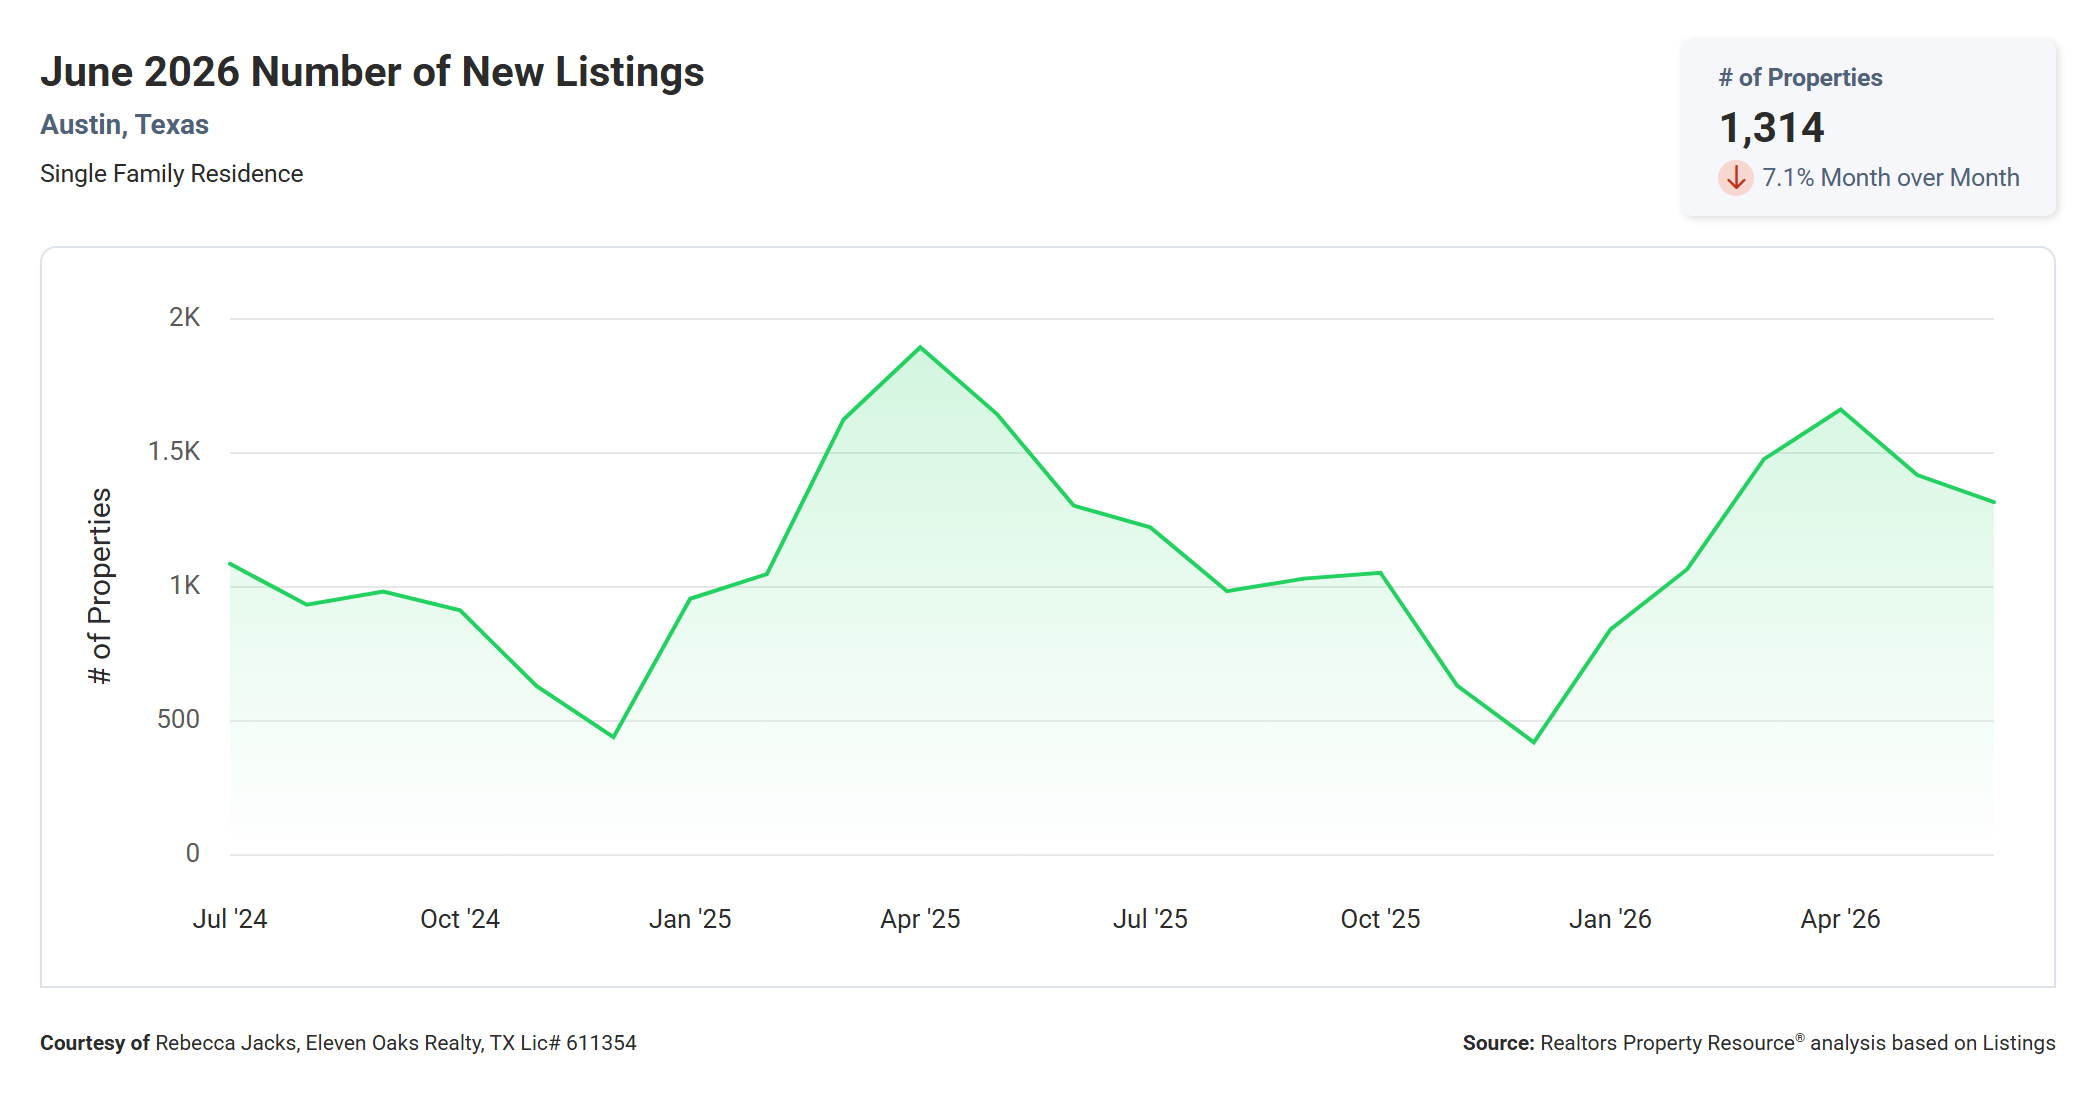
New listings in Austin in June 2026 totaled 1,314 homes, down 7.1% from May 2026’s 1,420 and up slightly from June 2025’s 1,300, a gain of just 1.1% year over year.
The two-year chart shows the typical seasonal rhythm of the Austin market: new listings spike in the spring (with May 2025 at approximately 1,650 being the peak in the chart), then taper off as the summer progresses. June 2026’s 1,314 new listings is consistent with that pattern, sitting close to where June 2025 landed and representing a natural pullback from May’s elevated pace. The relative stability of new listings on a year-over-year basis stands in contrast to the active inventory figure, which is down more than 20%. The explanation is that while new supply is coming to market at roughly the same pace as a year ago, homes are selling faster, so fewer listings accumulate into the active pool.
For buyers tracking new supply, the relatively flat new-listings trend suggests that the market is not about to flood with fresh inventory. The homes being listed in June are cycling into and out of the active pool quickly, meaning that being ready to move fast remains essential. Setting up MLS alerts and working with an agent who knows the market well enough to act the same day a property is listed is as important in June 2026 as it has been all year.
New Pending Listings Up Slightly Year Over Year
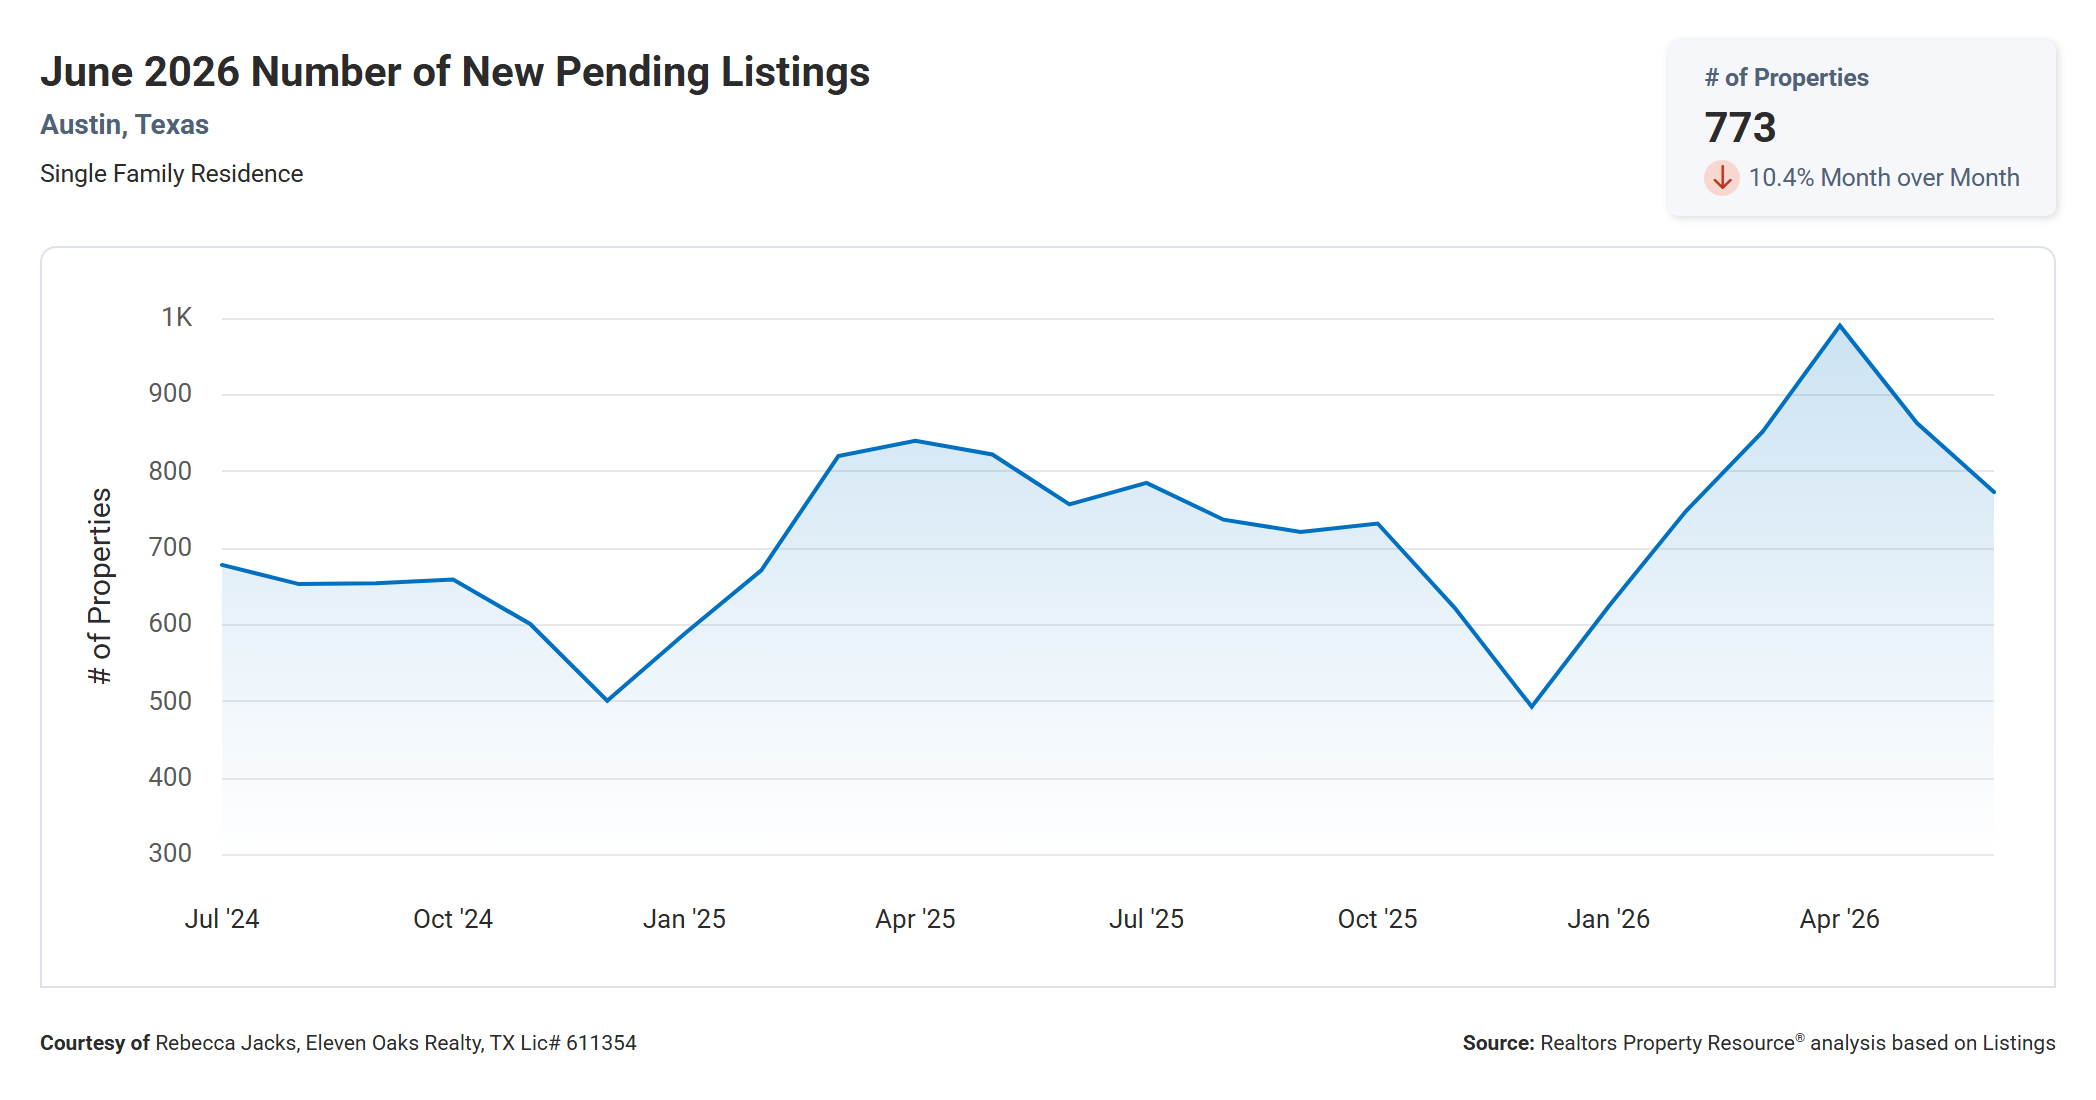
New pending listings in Austin in June 2026 totaled 773 homes, down 10.4% from May 2026’s 863 and up slightly from June 2025’s 757, a gain of 2.1% year over year.
The two-year chart shows that pending activity tracks closely with the seasonal calendar. The market’s highest pending counts in 2026 came in April (967) and May (863), representing the height of the spring buying season. The drop to 773 in June is normal and expected, as buyer urgency typically eases in early summer. The year-over-year comparison is encouraging: more buyers went under contract in June 2026 than in June 2025 despite the higher prices, which indicates that demand remains intact even as affordability has become a larger conversation.
For sellers, the pending data is a forward-looking indicator of what closed-sale counts will look like in July and August. With 773 contracts signed in June, the closing pipeline is solid going into summer. For buyers who are still searching, the slight deceleration in pendings could mean marginally reduced competition in July compared to the spring peak, though the reduced inventory will continue to limit options regardless of the pace of contract activity.
Homes Sold Essentially Flat Year Over Year
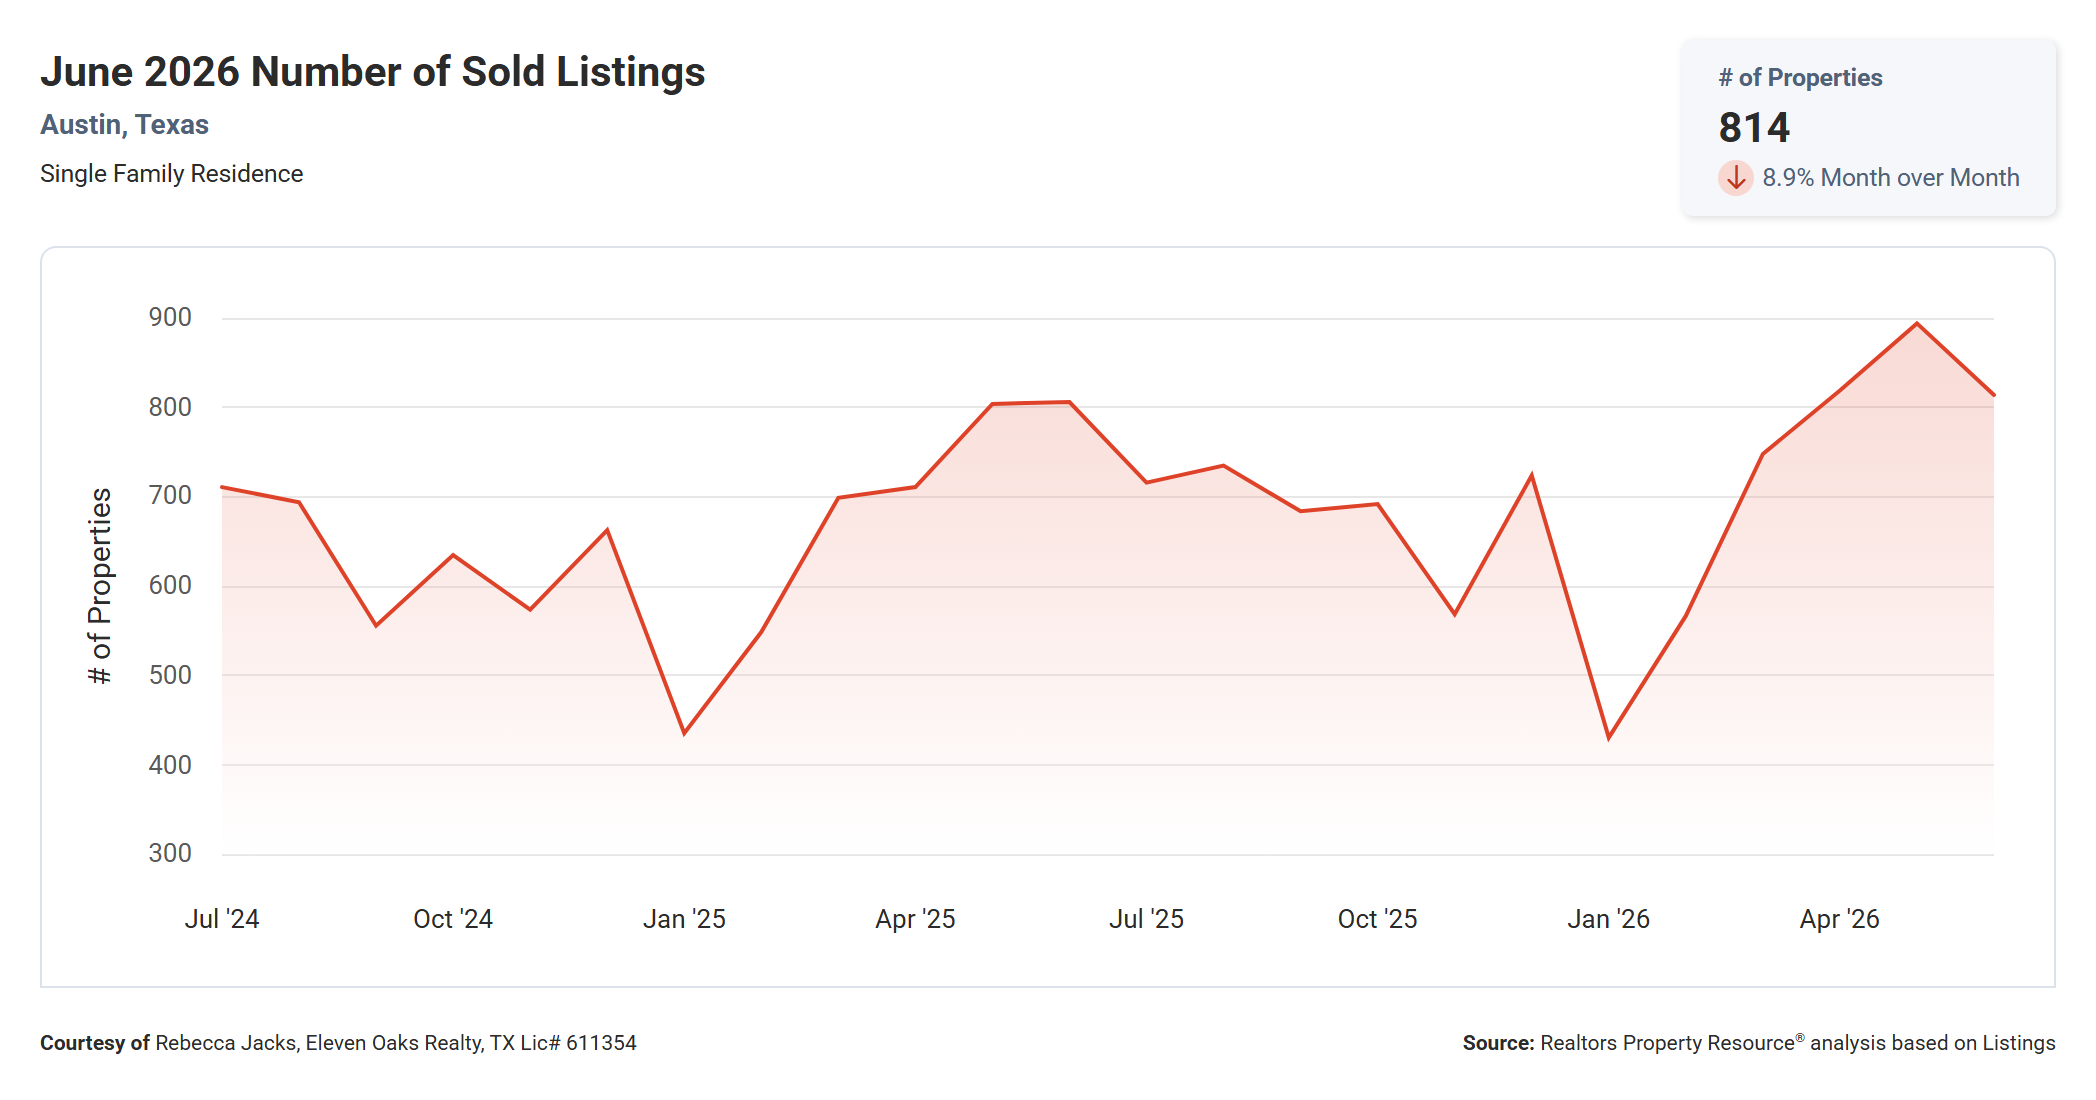
814 single-family homes sold in Austin in June 2026, down 8.9% from May 2026’s 894 and essentially flat compared to June 2025’s 806, a year-over-year gain of less than 1%.
The two-year chart shows the same seasonal pattern visible across virtually every other metric. Sales bottomed at approximately 431 homes in January 2026, the slowest month in the two-year window, before climbing steadily through the spring. May 2026’s 894 sales was one of the strongest months in the recent tracking period, and June’s pullback to 814 is consistent with the normal deceleration that occurs as the spring rush gives way to early summer. The near-flat year-over-year reading suggests that Austin’s transaction volume has stabilized after two years of adjustment following the 2022 market peak.
For the broader market, stable sales volume combined with rising prices and lower inventory is a healthy combination. It means buyers are not disappearing from the market, but they are simply working through a smaller available pool of homes. When volume holds steady and prices rise, it typically indicates underlying demand that the current supply cannot fully satisfy, which supports the current seller’s market classification.
Total Sales Volume Up 5.7% Year Over Year
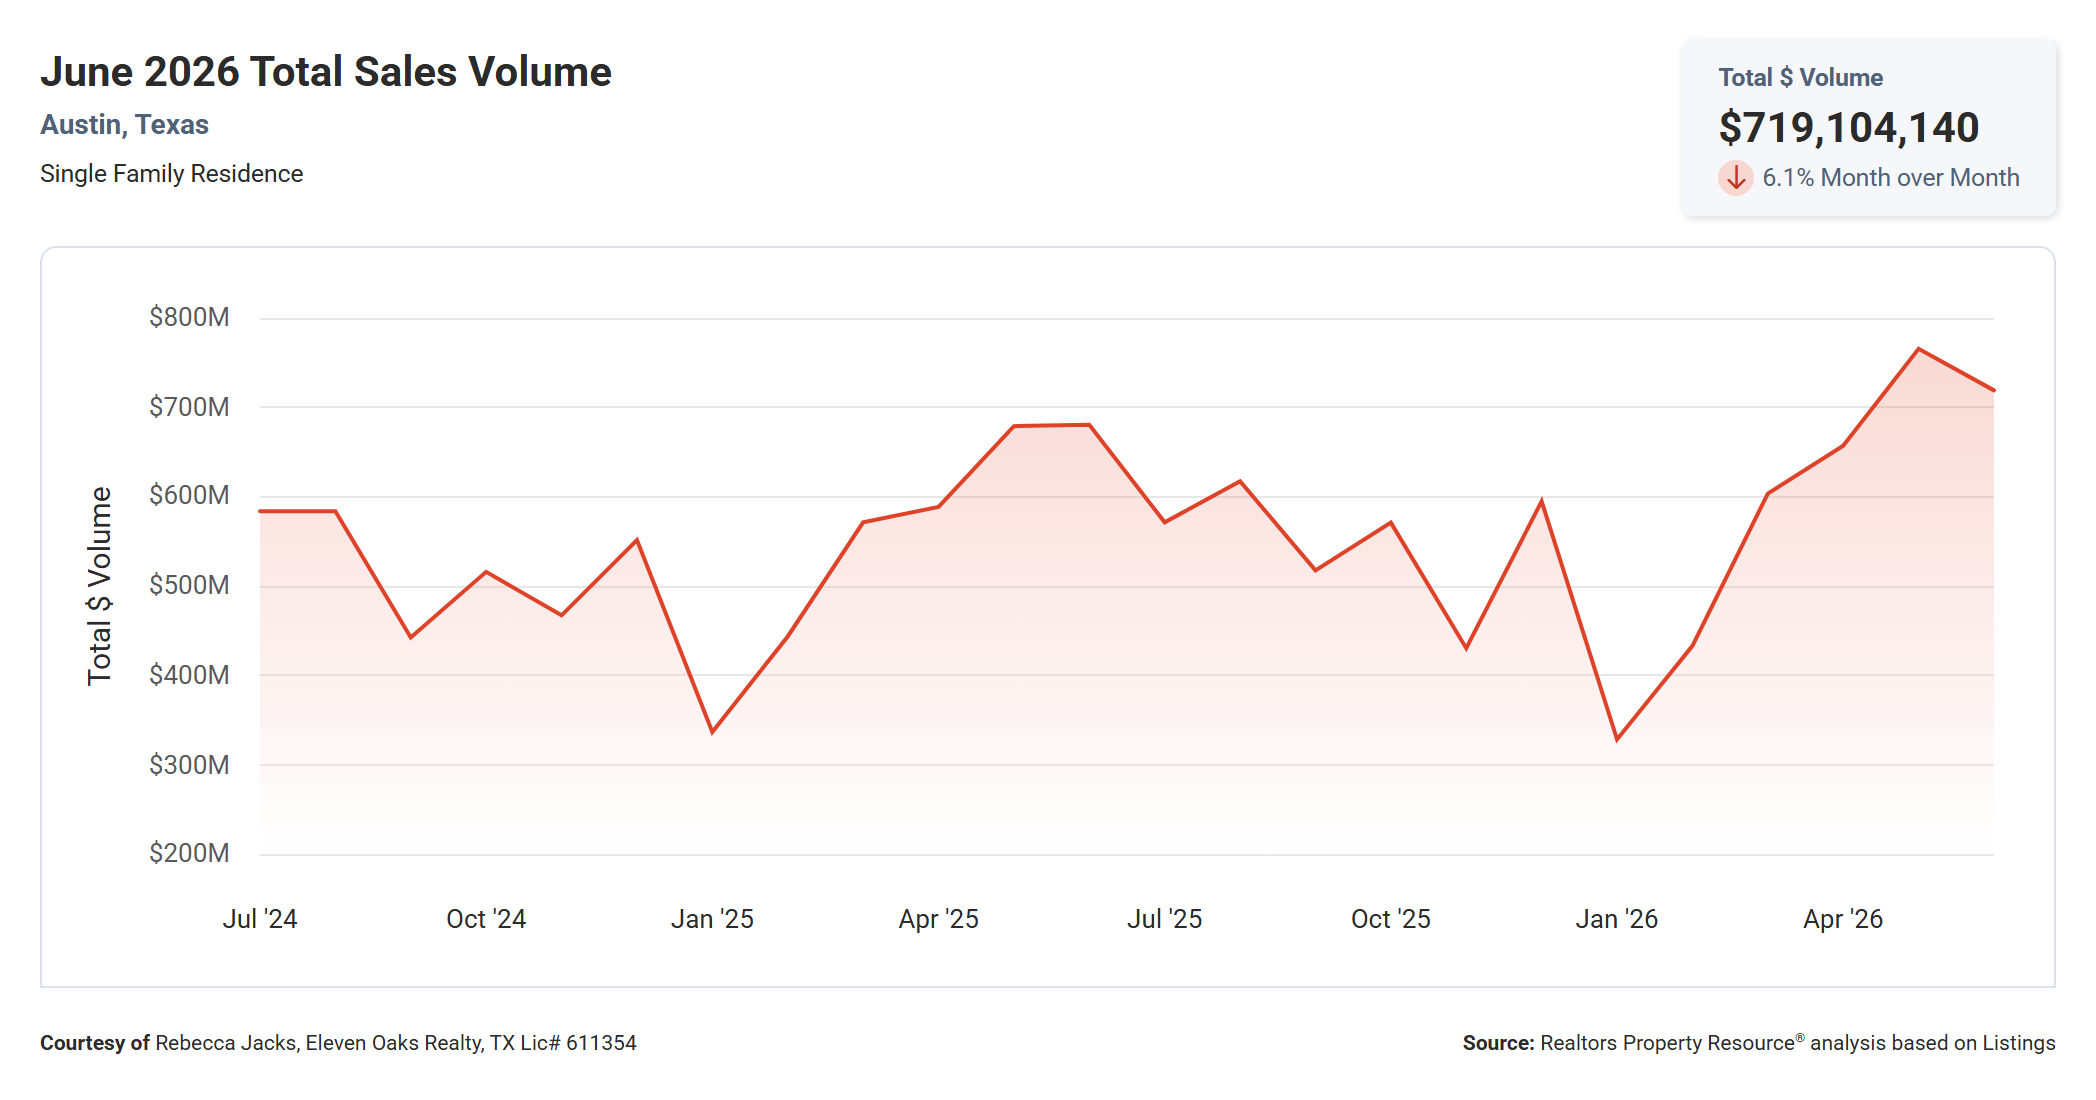
Total sales volume for single-family homes in Austin in June 2026 was $719,104,140, down 6.1% from May 2026’s $765,500,000 and up 5.7% from June 2025’s $680,630,000.
The two-year chart shows the volume curve following the sales count pattern but amplified by price changes. January 2026 was the clear low point at approximately $333 million, while May 2026 at $765.5 million represented the spring peak. June’s $719.1 million sits comfortably in the upper range of the two-year dataset, well above the prior-year reading and more than double the January low. The 5.7% year-over-year gain is a product of essentially flat sales count combined with higher prices, which confirms that the gains in market value are real and not simply a function of more transactions.
For the Austin economy broadly, $719 million in single-family home sales in a single month is a significant figure, supporting related industries from mortgage lending and title to moving services and home improvement. For buyers and sellers, the volume trend confirms that the Austin market remains one of the most active residential markets in Texas, with meaningful transaction depth across all price ranges.
June 2026 Austin Real Estate by the Numbers
The table below is pulled directly from the Austin Board of REALTORS MLS statistics for June 2026 and covers 894 closed single-family residential transactions in the city of Austin.
| Min | Max | Avg | Median | |
|---|---|---|---|---|
| Beds | 1 | 7 | 4 | 4 |
| Baths | 1 | 8 | 3 | 3 |
| Sq Ft | 600 | 8,678 | 2,407 | 2,155 |
| Lot Sq Ft | -- | 217,804 | 12,403 | 8,756 |
| List Price | $165,000 | $8,900,000 | $903,987 | $672,000 |
| LP/Sq Ft | $131.14 | $2,282.49 | $361.26 | $314.17 |
| Acres | 0.000 | 5.000 | 0.285 | 0.201 |
| Close Price | $150,000 | $8,520,000 | $879,183 | $650,000 |
| CP/Sq Ft | $123.76 | $2,147.18 | $352.03 | $306.65 |
| CP/LP% | 61.00% | 132.00% | 97.74% | 98.00% |
| CP/OLP% | 40.00% | 314.00% | 95.54% | 97.00% |
| ADOM | 0 | 896 | 43 | 21 |
The most expensive home that sold in June 2026 sold for $8,520,000 and the least expensive home sold for $150,000. Homes ranged in size from 600 to 8,678 square feet with an average size of 2,407 square feet. The average price per square foot for a home that sold in Austin in June 2026 was $352.03 with the lowest being $123.76 per square foot and the highest being $2,147.18 per square foot. It took, on average, 43 days to sell a home in Austin and sellers received, on average, 95.54% of their original list prices.
The CP/LP% and CP/OLP% figures together reveal an important pattern in how Austin transactions are unfolding. The average CP/LP% of 97.74% tells you that buyers are closing at close to asking price relative to where the home was priced when it went under contract. The average CP/OLP% of 95.54% tells you what buyers are paying relative to where sellers originally listed the home. The 2.2 percentage point gap between those two figures represents the average price reduction sellers accepted before finding a buyer. In dollar terms, if you listed a home at the median list price of $672,000 and followed the average pattern, you would close around $642,000 after accounting for any price adjustments along the way.
The spread between the average ADOM of 43 days and the median ADOM of 21 days also deserves attention. When the mean is significantly higher than the median, it indicates that a subset of listings is sitting on the market for an extended period and pulling the average up. The bulk of Austin transactions are happening in three weeks or less, but a tail of overpriced or difficult-to-sell homes is taking two to three months to close. If your home has been on the market for more than 45 days without an accepted offer, you are likely in that tail, and a price adjustment is almost certainly warranted.
Where Buyers Are Shopping: A Look at Price Ranges
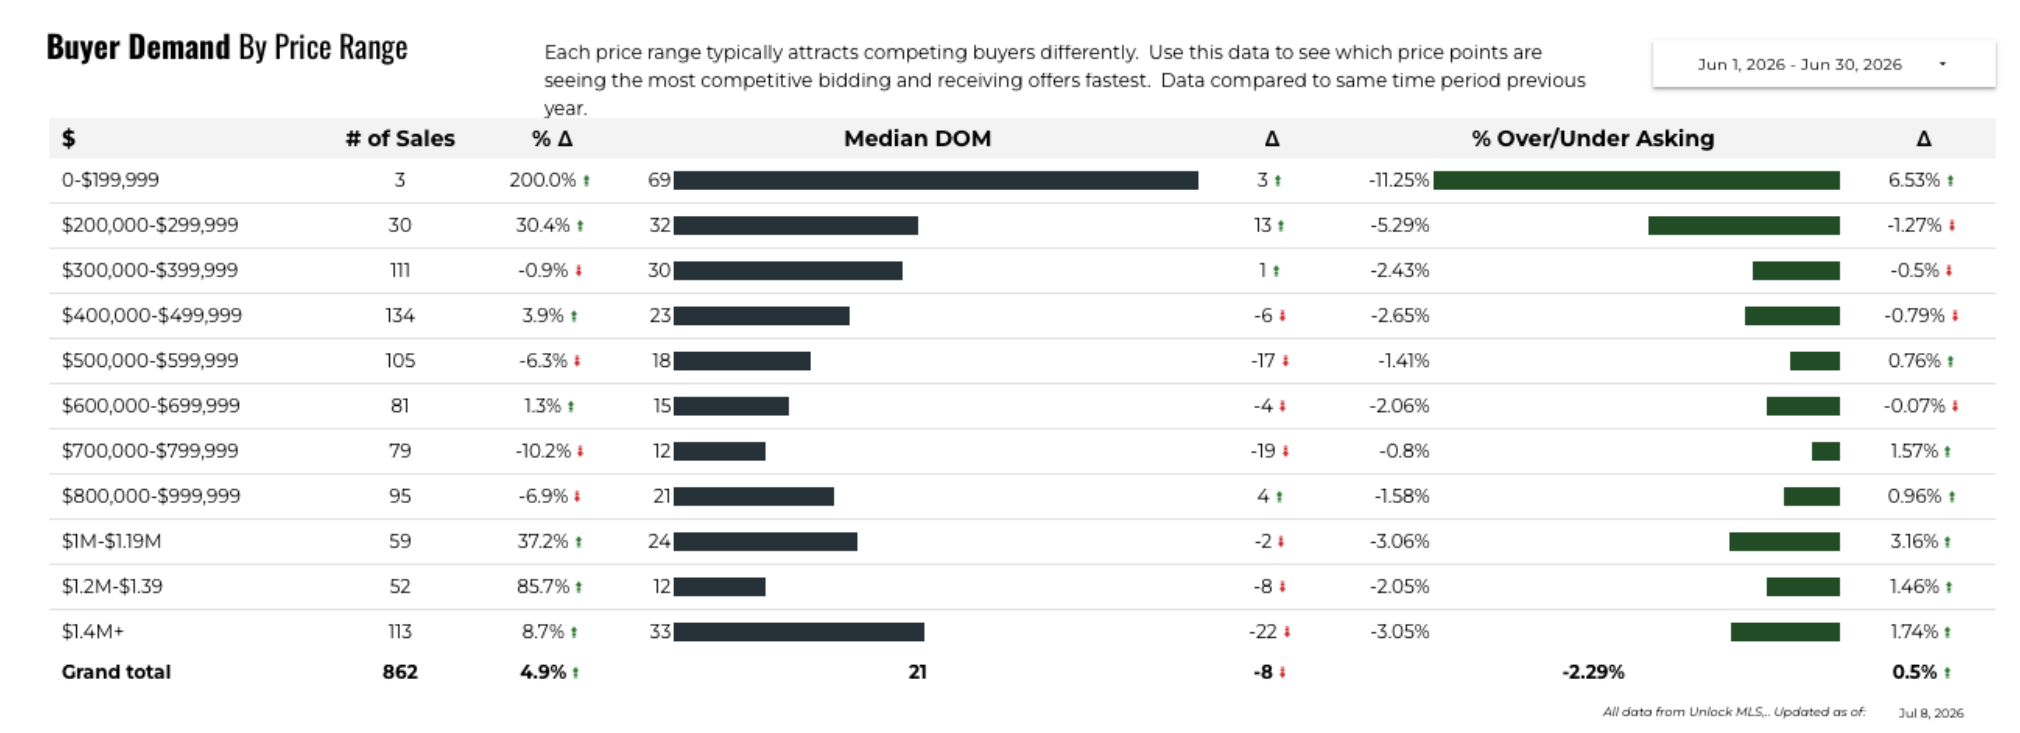
According to Unlock MLS data for June 1 through June 30, 2026, 862 single-family home sales closed in Austin across all price ranges, with buyer activity spread more broadly across the price spectrum than in previous years.
The three most active price brackets were $400,000 to $499,999 (134 sales), $300,000 to $399,999 (111 sales), and $500,000 to $599,999 (105 sales). Together, these three brackets accounted for 350 sales, or 40.6% of all June transactions. The $400,000 to $499,999 bracket has consistently been the single most active range in Austin in 2026, reflecting the concentration of move-up buyers and investors targeting homes in the city’s most accessible price tier. Notably, the $300,000 to $399,999 bracket saw a slight year-over-year decline in sales (-0.9%), suggesting that the supply of homes at that price point in Austin proper continues to shrink.
The middle and upper-middle brackets showed mixed results. The $600,000 to $699,999 range recorded 81 sales, up 1.3% from a year ago, while the $500,000 to $599,999 bracket fell 6.3% and the $700,000 to $799,999 bracket declined 10.2% year over year. The $800,000 to $999,999 range produced 95 sales, also down 6.9% YoY. These declines likely reflect a combination of affordability pressure at those price points and buyers stretching into the $1 million and above range as their budgets have been pushed higher by rising prices.
The luxury segment stood out as a bright spot in June 2026. The $1 million to $1.19 million range recorded 59 sales, up 37.2% from June 2025. The $1.2 million to $1.39 million range nearly doubled with 52 sales, up 85.7% year over year. The $1.4 million and above category produced 113 sales, up 8.7%. Combined, the three luxury brackets accounted for 224 sales, or 26.0% of all June transactions, a striking share for homes priced above seven figures.
Looking at median days on market by price range, the data tells a story of efficiency at mid-tier price points. Homes in the $700,000 to $799,999 range and the $1.2 million to $1.39 million range each had a median DOM of just 12 days, the fastest of any bracket. The $600,000 to $699,999 range was close behind at 15 days. The slowest price range was 0 to $199,999 at 69 median days, though only 3 homes sold in that bracket. At the high end, $1.4 million and above homes took a median of 33 days to sell, which is actually faster than June 2025 by 22 days. All price ranges are selling with buyers paying below asking: the closest to list price is the $700,000 to $799,999 bracket at -0.8%, while the $300,000 to $399,999 and $400,000 to $499,999 ranges are closing at -2.43% and -2.65% below asking, respectively. Buyers in those ranges have a small but real edge at the negotiating table.
The Listing-to-Close Price Gap: What Sellers Need to Know
The gap between the average CP/LP% (97.74%) and the average CP/OLP% (95.54%) reveals one of the most important dynamics in today’s Austin market: on average, sellers are reducing their list price by about 2.2 percentage points before buyers engage and put a home under contract. That gap represents the cost of overpricing. A seller who would have preferred to close at $672,000 (the median list price) but had to reduce before finding a buyer is instead closing around $642,000 on average, a difference of roughly $30,000.
The price drop data from Unlock MLS adds context: 51% of all active listings in Austin have had at least one price reduction as of early July 2026, with an average drop of 7% from the original list price. The median time from listing to price drop is 19 days, and after a reduction, homes are typically going under contract within 20 days. This means the price-reduction cycle is a real and common feature of the current market, not an edge case.
The takeaway for sellers is direct: the market will eventually find the right price for your home, but arriving there through reductions costs you both money and momentum. A home that is priced right from day one avoids the stigma of price cuts and attracts buyers during the critical first 10 to 14 days, when traffic and interest are highest. The sellers who netted the best outcomes in June 2026 were almost certainly the ones who priced accurately at launch rather than testing the market at an aspirational number.
What This Means for Buyers
June 2026 data contains genuine good news for buyers willing to look past the headline price. Yes, the median sold price reached $645,000, but the price per square foot at $309 is only 3% above where it was a year ago, meaning you are getting roughly the same amount of home for your dollar as buyers did in June 2025. The year-over-year change is real, but it is not dramatic.
The negotiation landscape is one of disciplined practicality rather than either buyer panic or buyer opportunity. Average sold-to-list is 97.62%, which means buyers are getting about 2.4% off asking price on average, but the best deals are going to buyers who identify overpriced listings early, before sellers reduce, and make realistic offers. The Unlock MLS price drop data shows that half of all active listings have already had at least one cut, and those homes often have more motivated sellers attached to them.
Inventory is down 20.4% from a year ago, which is the most significant constraint buyers face right now. With 3,312 active listings in Austin, there is still meaningful choice, but it is a different experience than it was in summer 2025 when more than 4,000 homes were available at any given time. Setting up automated alerts for new listings in your target price range and being prepared to move within 48 hours of a home coming to market is not an option in this environment, it is a requirement.
On the financing side, the tighter inventory and rising median prices make the pre-approval conversation more important than ever. Knowing exactly what you can spend, and what your monthly payment looks like at different price points, removes hesitation at the moment of offer. Talk to your lender now if you have not recently, and understand whether buying down your rate makes sense given current levels and your plans for how long you will hold the home.
What This Means for Sellers
Sellers in June 2026 have a meaningful structural advantage: inventory is 20% lower than a year ago, and buyers who are committed to purchasing in Austin have fewer options to choose from. That supply constraint is real, and it is the primary reason why prices have recovered from the January 2026 lows and reached the highest reading in the two-year tracking period. If you have been waiting for conditions to improve before listing, the current window is as favorable as any point in the past 18 months.
The competition challenge is the new listing wave: 1,314 new homes entered the market in June, and that pace is expected to continue into July. While June supply is not dramatically higher than a year ago, each new listing adds a choice for buyers in your price range. A home that sits for two or three weeks without an offer is not just missing buyers, it is collecting a stigma of "why hasn’t this sold" that compounds over time.
The CP/OLP% data is the most important number for any seller planning their pricing strategy: on average, Austin sellers received 95.54% of their original list price in June. That means pricing at $710,000 when the market for your home is $672,000 is likely to result in a reduced-price close around $641,000 or lower, less than you would have netted by pricing correctly from the start. The sellers who protected their net proceeds in June were the ones who trusted the data over their aspirations.
On the positive side, the market is still moving quickly. The median time to sell is 24 days, and even the homes that went through price reductions were typically under contract within 20 days of the cut. A well-priced home in good condition can still generate meaningful interest and a clean transaction in Austin today. The sellers at the greatest risk are those in the $700,000 to $999,999 range, where year-over-year sales declines of 6% to 10% suggest buyer resistance at those price points.
Market Summary and Outlook
June 2026 was, by most measures, a strong month for Austin’s housing market. The median sold price reached $645,000, a two-year high. Inventory remained well below year-ago levels. Homes sold quickly, with a 24-day median time to market. And total sales volume of $719 million was nearly 6% above where it stood in June 2025. The story of the month is less about dramatic change than about a market that has found its footing after the significant corrections of 2023 and 2024.
Year-over-year comparisons show an improving picture across virtually all metrics. Prices are up 2.4%, price per square foot is up 3%, months supply is down 26.6%, and active inventory is down 20.4%. The notable weakness is in the $700,000 to $999,999 price range, where sales fell 7% to 10% from a year ago, suggesting that buyers are sensitive to pricing in that corridor and that sellers there may face more resistance than the headline numbers imply.
The key variable for the second half of 2026 is whether new listings continue to enter the market at a pace that keeps inventory gradually rebuilding, or whether the seasonal slowdown in new supply contracts the active pool again as it did last fall and winter. If active listings stay below 3,500 through the summer, seller conditions are likely to persist. If they push toward 4,000 or above, buyers will gain more options and some of the pricing pressure will ease.
Austin’s underlying fundamentals continue to support long-term housing demand. Population growth, the concentration of technology and healthcare employment, and the relative affordability compared to coastal markets all point toward continued interest from both local and relocating buyers. The challenges of the 2022 to 2024 correction period appear to be largely absorbed, and the trajectory of the first half of 2026 suggests a market that is returning to healthier, more sustainable activity levels.
Time to Buy? Time to Sell?
For buyers, the honest read is this: June 2026 is not a soft buyer’s market, but it is also not the frenzied seller’s market of 2021 or early 2022. You have real negotiating room at roughly 2.4% below asking on average, you have meaningful choice with 3,312 active listings, and you have slightly more time to make decisions than you did in April and May. If you have been sitting on the sidelines waiting for prices to fall sharply, the data does not support that expectation, at least not in the near term. The better play is to define your must-haves, get your financing ready, and act when the right home appears.
For sellers, the window is open. Prices are at a two-year high, inventory is historically tight on a year-over-year basis, and buyers are active. The seasonal slowdown has begun, which means July and August will bring somewhat less buyer traffic than June. If you are thinking about listing, waiting until fall carries meaningful risk because historically, the Austin fall market produces softer prices and longer time on market than the spring and early summer peak. The time to list is now, not in October.
For sellers who have already been on the market for 30 days or more without an accepted offer, the data is clear: you are above market, and the longer you wait, the harder the conversation becomes. The average seller who eventually takes a price cut is still closing at 95.54% of original list. The ones who reprice quickly are recovering faster than those who hold out.
Action Items for Buyers
- Get your pre-approval updated before you tour another home, because June’s 24-day median time to sell means good listings do not wait for buyers who need time to confirm their financing.
- Focus your search on the $400,000 to $599,999 range if that fits your budget, as those brackets are the most active and represent the deepest pool of available inventory and competition.
- Look closely at listings that have had a price reduction in the past 30 days, because those sellers have already demonstrated flexibility and are typically the most motivated to close.
- Set up automated listing alerts with your agent for new properties that match your criteria, and commit to touring or passing on each new listing within 24 to 48 hours of it hitting the market.
- Use $309 per square foot as your baseline when evaluating whether a home is fairly priced for Austin, and ask your agent to pull recent comparable sales within the past 60 days to validate any home you are seriously considering.
- Talk to your lender now about rate buydown options, particularly if you plan to hold the home for five or more years, because buying down your rate at today’s prices can meaningfully reduce your monthly payment and total interest cost.
Action Items for Sellers
- Price your home based on comparable sales from the past 60 days, not what you wish the market would pay, because the CP/OLP% data shows that sellers who overprice are netting 95.54 cents on the dollar rather than the 97.74 cents that well-priced sellers are achieving.
- List now rather than waiting until fall, because June is historically near the peak of Austin’s seasonal price curve and the data shows that fall markets consistently produce lower medians and longer time on market.
- Prepare your home for market before listing, because buyers in June 2026 have enough options that they are moving past homes that need obvious cosmetic work in favor of better-presented alternatives in the same price range.
- Understand which price bracket you are competing in, because the $700,000 to $799,999 and $800,000 to $999,999 ranges saw year-over-year sales declines of 10% and 7% respectively, meaning competition there is meaningfully higher relative to buyer activity than in the sub-$600,000 brackets.
- Set a firm price-reduction schedule before you list, typically after 14 days without an accepted offer, so that you do not lose negotiating momentum by waiting weeks to make a decision that the market has already signaled you need to make.
- Leverage the speed of the current market in your marketing: homes are selling in 24 days median in Austin right now, and that is a genuinely compelling data point for buyers who are worried about overpaying in a slow market.
Final Word on the Market
June 2026 is a market that rewards preparation on both sides of the transaction. For buyers, preparation means financing clarity, clear priorities, and the willingness to act decisively. For sellers, preparation means pricing discipline, presentation, and a realistic timeline for decision-making if the market does not respond as expected. The data does not describe a market at any extreme, but it does describe a market that favors the informed.
The numbers collectively tell a story of gradual recovery and seasonal strength. Prices are rising, but moderately. Inventory is low, but not dangerously so. Sales are flat year over year, but volume is up because prices have improved. The overall picture is of an Austin market that has absorbed a difficult correction period and is performing in a more historically normal way than at any point since 2022.
Whether you are a homeowner trying to understand what your house is worth, a buyer trying to decide when to enter the market, or a seller trying to time your move, the data is your best guide. Every situation is different, and the numbers above describe the median Austin experience, not your specific home, neighborhood, or circumstances. Make the decision that fits your life and your financial situation, and reach out to us if you want to talk through what any of this means for your specific situation.
Questions About the June 2026 Austin Real Estate Price Report?
Have questions about what the June 2026 Austin Real Estate Price Report means for your specific situation? We are happy to help. If you are thinking about buying a home in Austin, our Buyers page has resources to help you understand the process and get started. If you are thinking about selling, our Sellers page walks through what to expect in today’s market.
Reach out to Rebecca Jacks and the team at Eleven Oaks Realty. Call or text (512) 827-8323 or email info@11OaksRealty.com. We have been helping buyers and sellers since 1978 and we are here to help you make the best decision for your situation, whatever that looks like.
Data sources: Realtors Property Resource (RPR), Austin Board of REALTORS MLS, Unlock MLS. All figures are for single-family residential properties in the city of Austin. Reported figures reflect June 1, 2026 through June 30, 2026. Some variation between data sources may exist due to differing methodology and timing of data pulls.




Leave a Reply