
Eleven Oaks Realty is proud to present their May 2026 Austin Condo Price Report measuring activity in the Austin condo market. Our May 2026 Austin Condo Price Report covers all condominiums and townhomes in the City of Austin.
May brought a mixed but meaningful picture for the Austin condo market. The median sold price slipped to $370,000, down 7.5% from April and 6.8% below May 2025, as nearly 10 months of supply kept pressure on sellers. At the same time, new pending listings jumped 13.1% month over month to 225, and condos sold ticked up 2.7%, suggesting that buyers are quietly stepping back into the market as prices soften. The combination of lower prices and rising buyer activity is one to watch heading into summer.
All data below covers condominiums and townhomes in the City of Austin. Data is sourced from Realtors Property Resource (RPR) and the Austin Board of REALTORS MLS. Some metrics may vary slightly between sources due to differing methodology; where differences exist, they are noted.
The Austin Condo Market is a Buyer’s Market
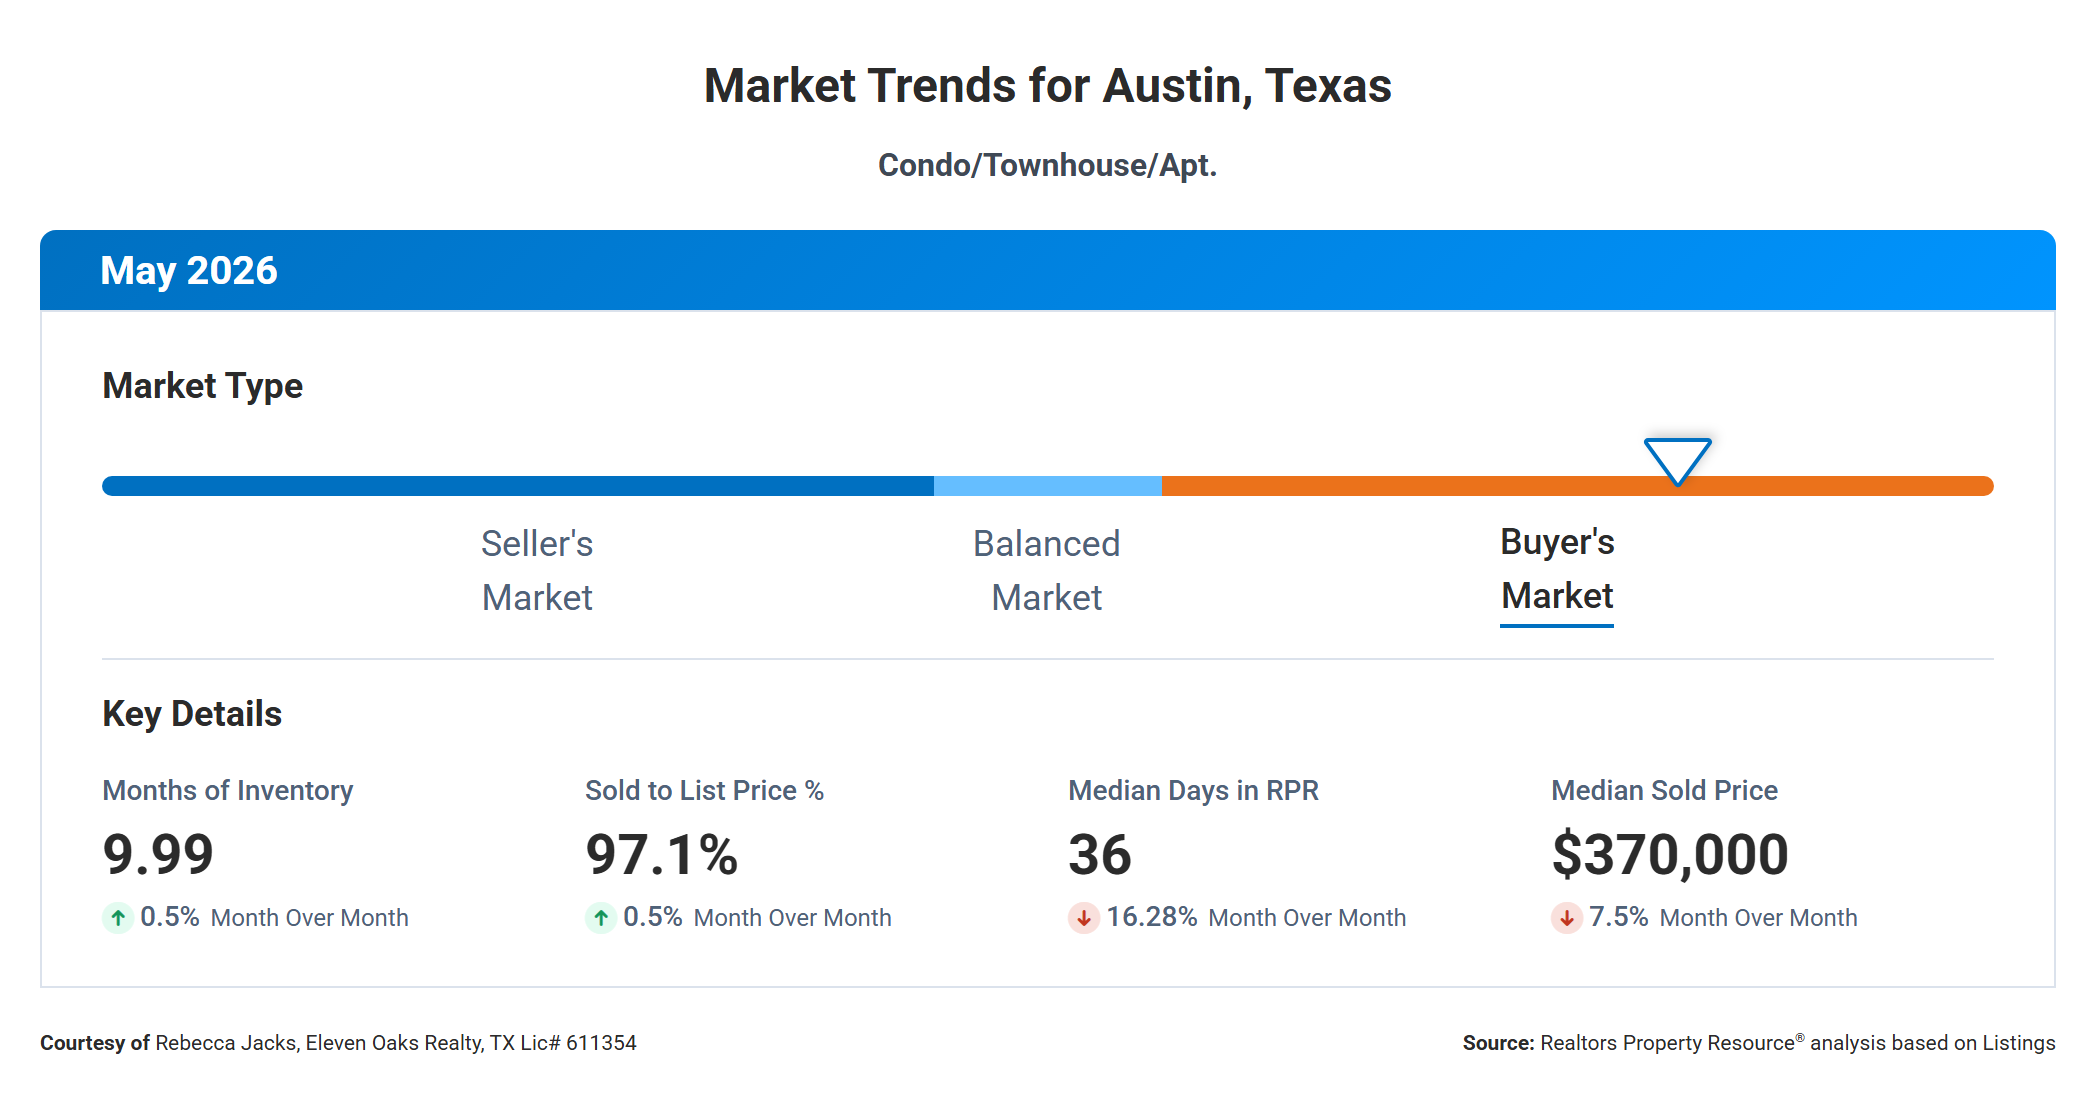
With 9.99 months of supply, the Austin condo market remains firmly in buyer’s market territory in May 2026. The standard benchmark for a balanced market is around five to six months; anything above that tilts conditions toward buyers. At nearly 10 months, sellers are operating in an environment where competition is high, patience from buyers is expected, and pricing discipline is not optional.
The four key metrics from this month’s Market Trends dashboard paint a consistent picture. Months of inventory held near 9.99, essentially flat from April’s 9.94. The sold-to-list price ratio ticked up slightly to 97.1%, a small improvement month over month that signals buyers are not walking away entirely. Median days on market dropped sharply, falling 16.3% from April to land at 36 days, which tells you that the condos that are priced correctly are still moving at a reasonable pace. Median sold price came in at $370,000, down 7.5% from April’s $400,000.
Taken together, these signals point to a market where buyers have real leverage on price and terms, but where well-priced condos are not sitting forever. Sellers who price at market can still find a buyer in a reasonable timeframe. Sellers who overprice are watching their listings age.
What the Numbers Mean For Buyers
Prices have come down meaningfully. The May 2026 median sold price of $370,000 is 6.8% below where it was in May 2025, which translates to roughly $27,000 less for the median condo. On top of that, buyers are closing at an average of 94% of the original list price, meaning the gap between where sellers first listed and where deals are actually closing is running about 6% on average. That is real negotiating room, and it matters most for condos that have been sitting on the market or have already taken a price reduction.
Inventory gives you options. There are 1,689 active condo and townhome listings in Austin right now, and with nearly 10 months of supply, you are not competing against a crowd of other buyers for most properties. The $300,000 to $399,999 and $200,000 to $299,999 price ranges each have more than 330 active listings, giving buyers at those price points a genuine selection. This is a meaningful contrast to the frenzied conditions of 2021 and 2022, when buyers often had to waive inspection contingencies and bid above asking just to have a chance.
Timing signals are turning more positive. New pending listings rose 13.1% month over month, which tells you that other buyers are starting to take action. That does not mean you need to rush, but it does suggest the window of maximum leverage may not stay open indefinitely. If pending volume keeps climbing through the summer, it will eventually start to pull down the months of supply reading. Now is a good time to be pre-approved, to know your price range, and to be ready to move when you find the right unit.
The practical play for buyers right now is to focus on listings that have been on the market longer than 45 to 60 days or that have already taken a price reduction. Data from Unlock MLS shows that 48% of active listings currently carry a price drop, and the median total reduction from original list price to final close price is running 12%. Buyers who identify those motivated sellers and make well-researched offers are the ones finding the best deals in this market.
What the Numbers Mean For Sellers
Demand exists, but it is selective. May saw 189 condos go under contract through RPR, up 2.7% from April, and new pending listings jumped by 13.1% month over month. Buyers are out there. They are just being deliberate about what they will pay. The condos that went under contract fastest had one thing in common: they were priced at or below current market value from day one.
The gap between original list price and final close price is the clearest warning sign for sellers. Buyers in May are closing at an average of 94.02% of the original list price, not the most recent list price. That means that every upward adjustment you made to your initial asking price, or every overpriced start you made before reducing, is being reflected in the final number you walk away with. A seller who lists at $450,000, cuts to $430,000, and accepts $423,000 has effectively handed back $27,000 to get the deal done. Pricing correctly at $430,000 from day one would have produced a much cleaner outcome.
Competition for seller attention is substantial. There are 461 new condo listings that came onto the market in May, though that was down 18.4% from April’s 565. Even with fewer new entrants, 1,689 active listings remain on the market, and your condo is competing against all of them. Condition, staging, and professional photography are no longer advantages in this market; they are table stakes. What separates listings that sell from listings that sit is an honest, data-driven opening price.
The sellers who will do best in this environment are the ones who treat market data as a tool rather than a threat. If you price correctly, the buyers are there. May’s pending activity proves it.
Median Sold Price Down 6.8% Year Over Year
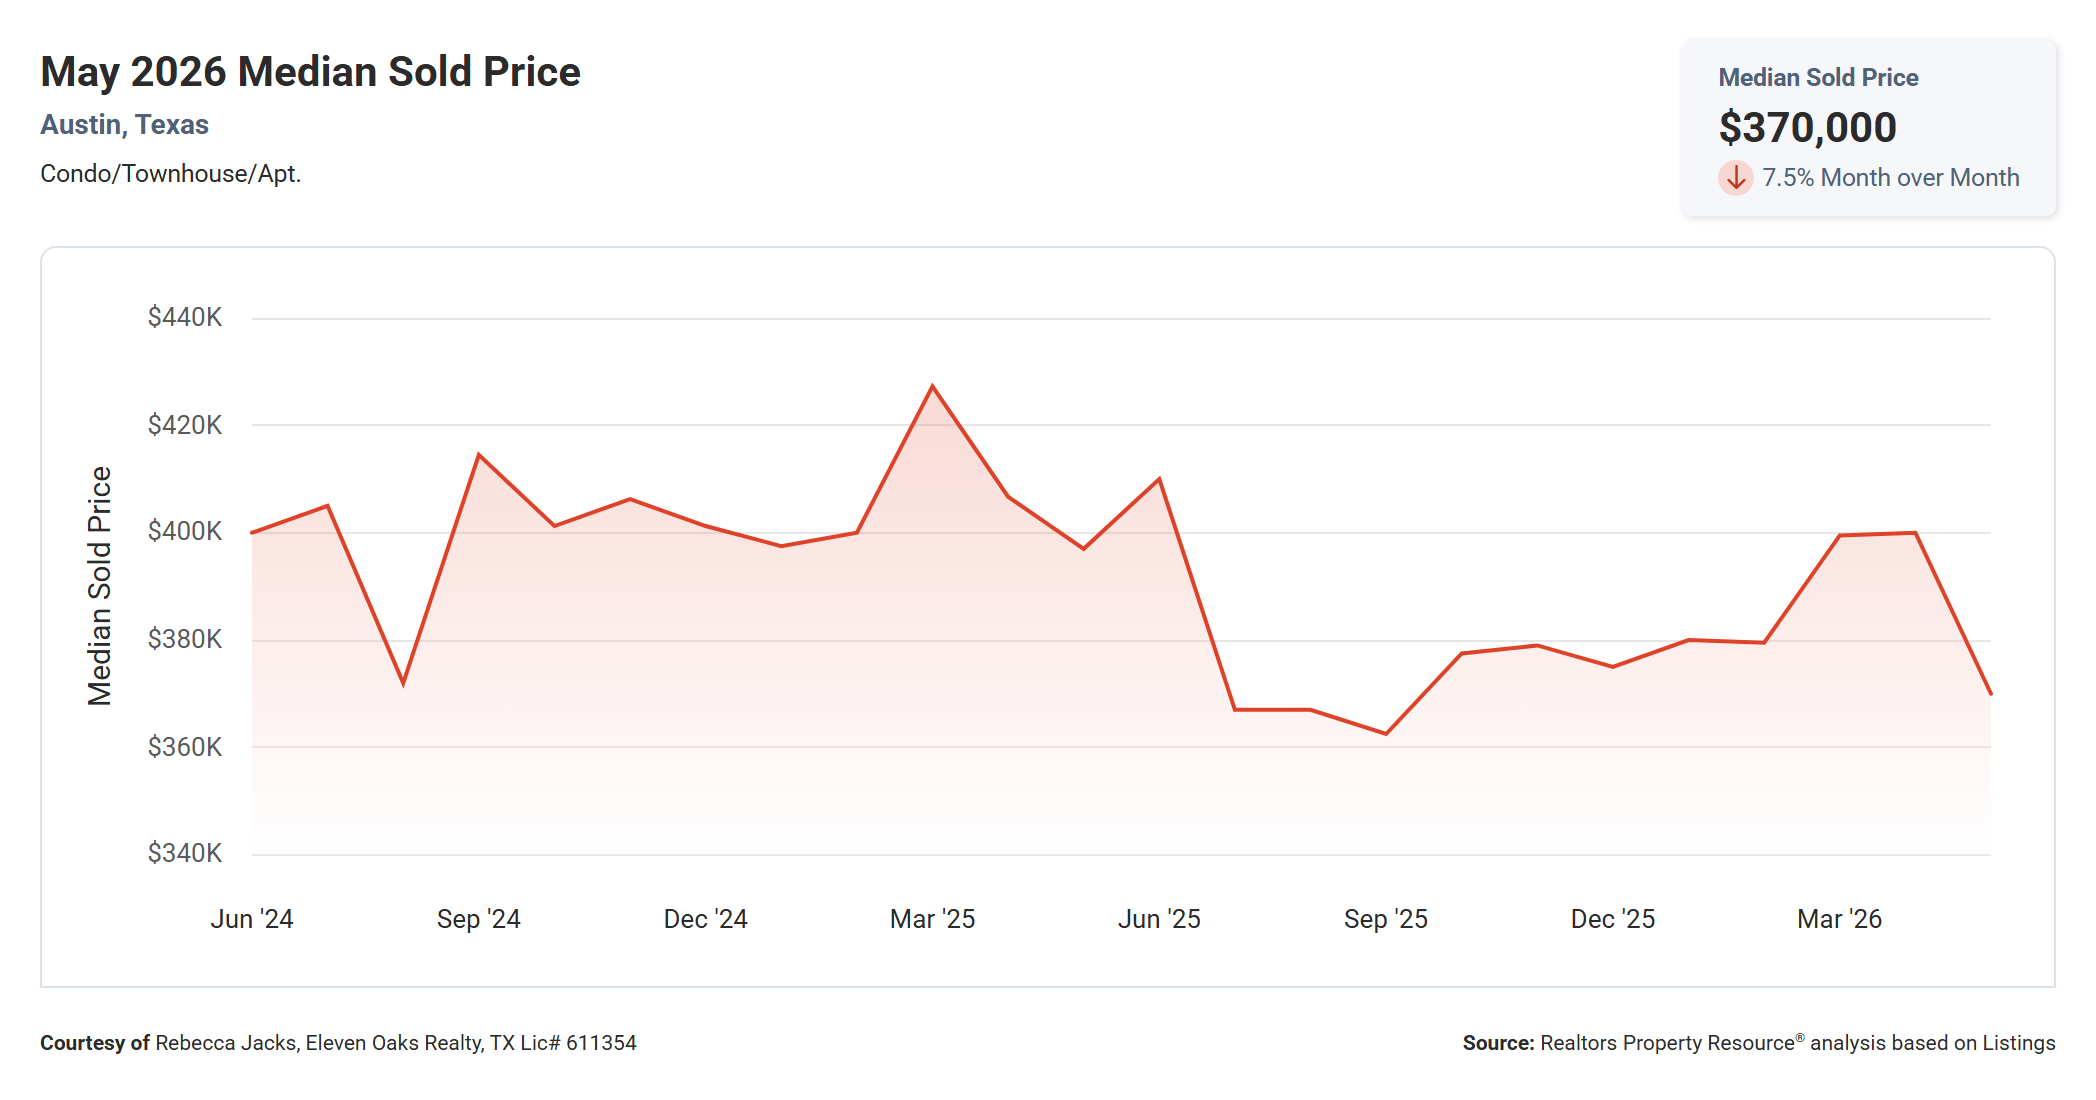
The median sold price for Austin condos and townhomes came in at $370,000 in May 2026, down 7.5% from April 2026’s $400,000 and down 6.8% from May 2025’s $397,000.
The two-year chart tells an important story. The median sold price for Austin condos peaked near $425,000 in March 2025 before spending the next several months declining. By August and September of 2025, the median had pulled back to the low $360,000 range, then partially recovered to the high $390,000 to $400,000 range through the fall and early 2026. May’s $370,000 reading is a dip from that partial recovery, though it is not the lowest point on the chart. Condos are generally trading in a $360,000 to $400,000 band right now, with the peaks requiring a very specific property in a very specific location.
For buyers, a $370,000 median represents real purchasing power compared to two years ago when the median was running closer to $420,000 to $430,000. For sellers, the chart confirms that pricing a condo as if it were still 2025’s spring market is a losing strategy. The reset has happened; the question is whether you price to match it or spend months chasing it downward.
Median Active List Price Down 3.7% Year Over Year
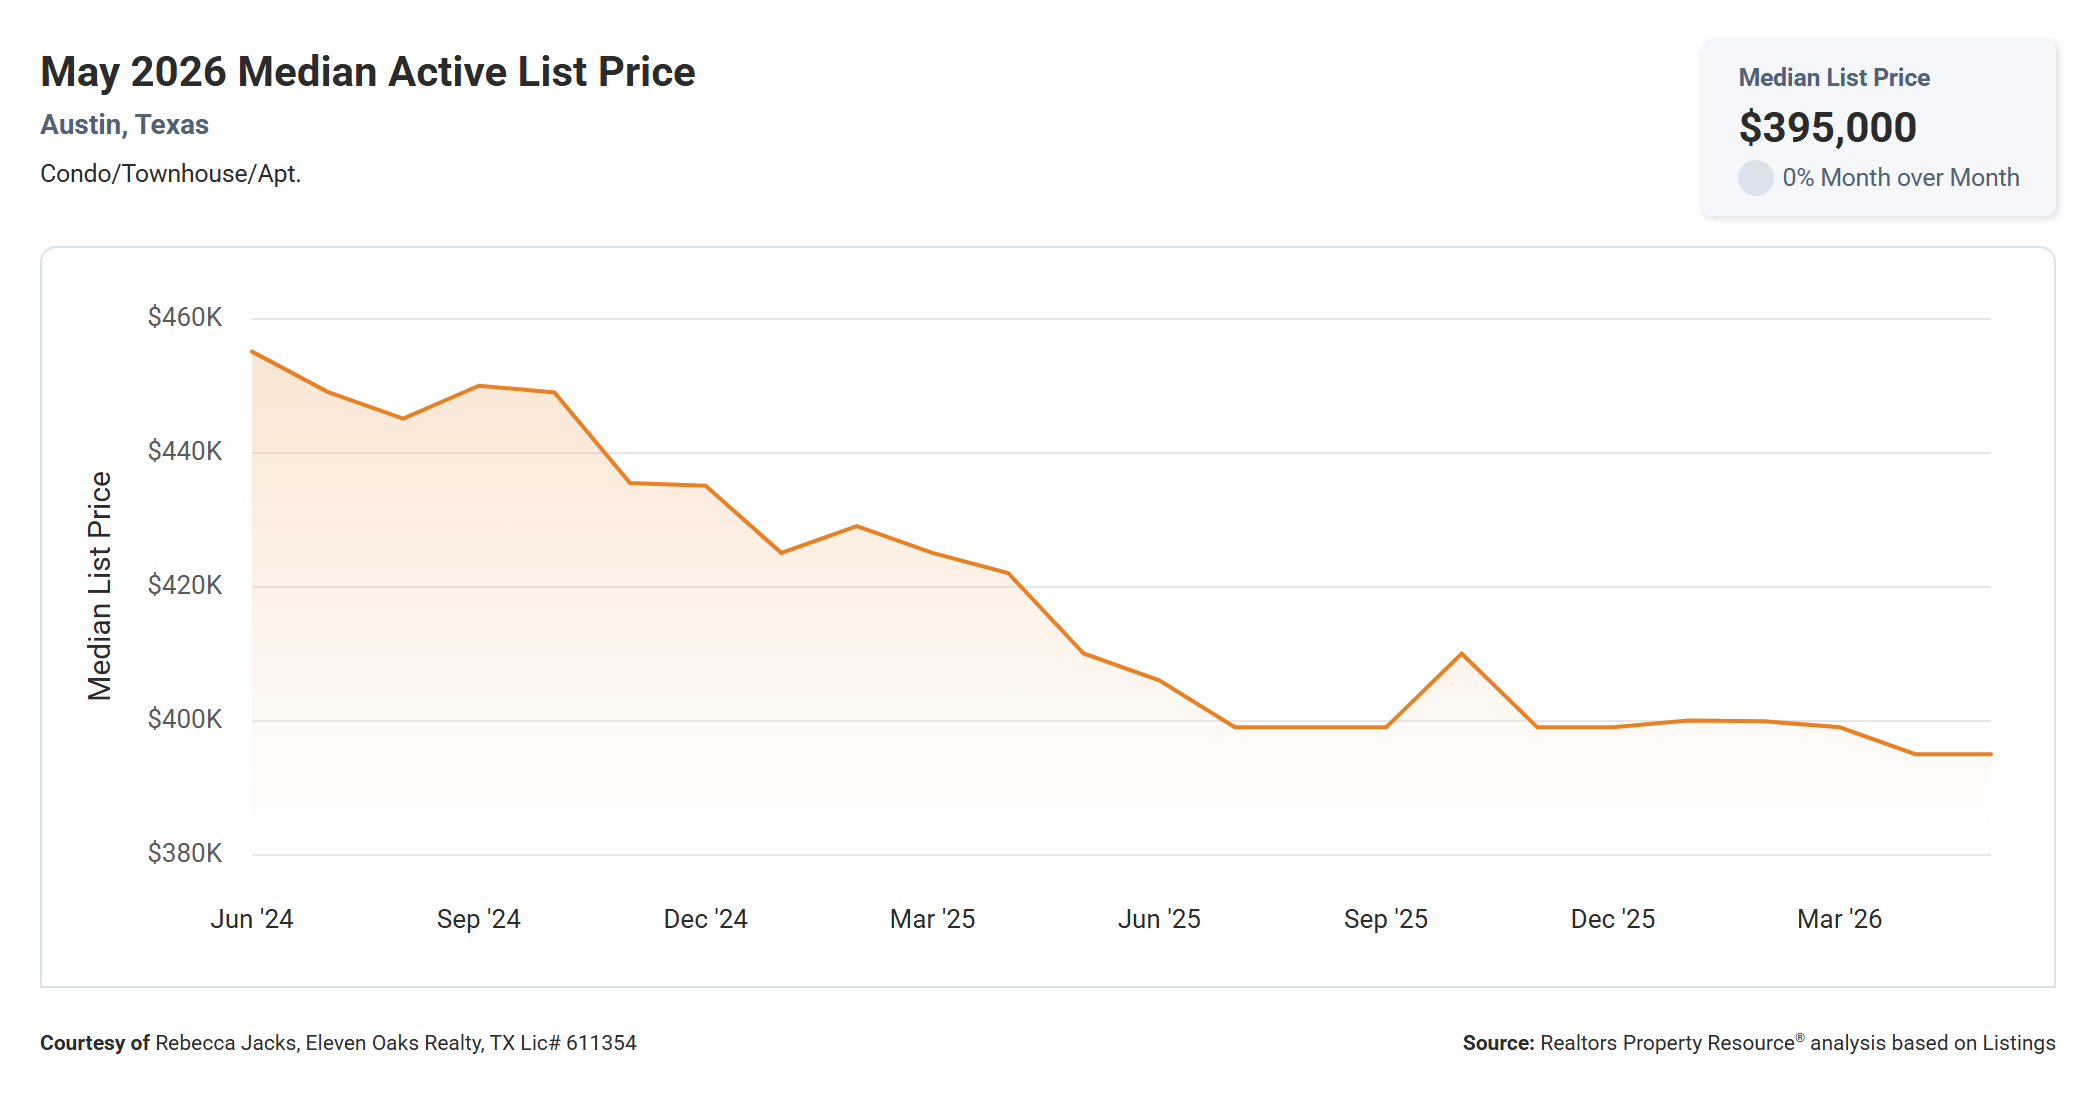
The median active list price for Austin condos held flat in May 2026 at $395,000, unchanged from April 2026 but down 3.7% from May 2025’s $410,000.
The longer-term chart for active list prices shows a consistent and meaningful downtrend. In mid-2024, the median asking price for active condo listings was sitting above $450,000. That figure has declined steadily, dipping into the $395,000 to $400,000 range by mid-2025 and holding roughly there through early 2026. Sellers as a group have gradually adjusted their expectations downward, though individual listings still show a wide range.
The gap between the median active list price ($395,000) and the median sold price ($370,000) is worth noting. A $25,000 difference between what sellers are asking and what buyers are paying is not a sign of a dysfunctional market, but it does confirm that buyers are still negotiating and sellers who price right at or below the median asking price are the ones who close. The listings priced at the top of the range are contributing to that long days-on-market figure and the high rate of price reductions.
Median Price Per Square Foot Down 14.4% Year Over Year
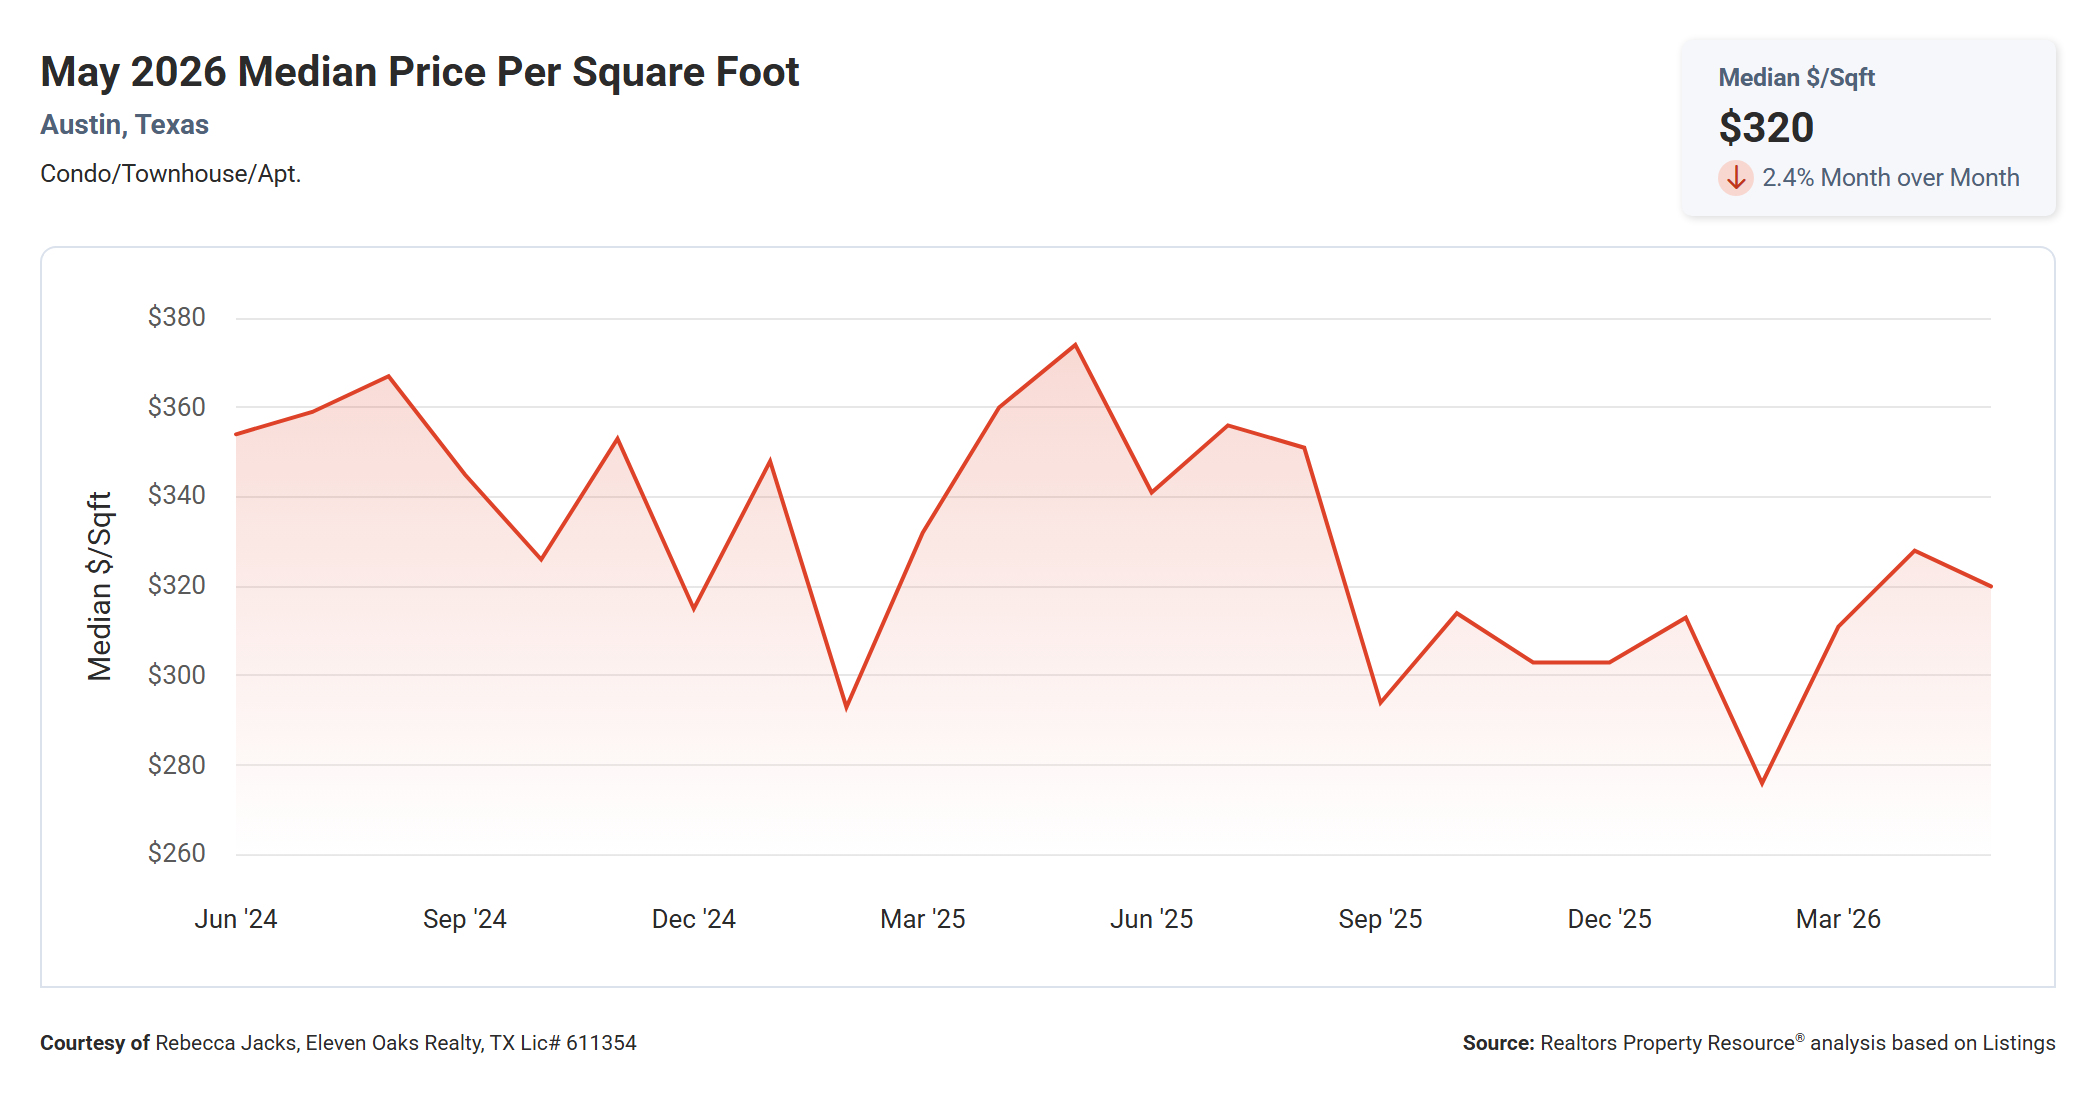
The median price per square foot for Austin condos came in at $320 in May 2026, down 2.4% from April 2026’s $328 and down 14.4% from May 2025’s $374.
The volatility in this metric over the past two years is notable. The chart shows monthly readings swinging between roughly $275 and $375, with the highest reading appearing around spring 2025 and one of the lowest readings hitting near $275 in February and March 2026. The current $320 reading represents a modest recovery from that February trough, but it is well below where prices per square foot were running a year ago.
The sharp year-over-year decline is partly a mix issue. When more entry-level and mid-range condos are selling relative to luxury units, the median per-square-foot figure pulls down even if individual properties within each bracket hold their values. The Unlock MLS data shows an average of $367 per square foot for May, which is higher than the RPR median of $320, confirming that the distribution of sales is pulling the median downward. For buyers, $320 per square foot is the benchmark to evaluate individual listings against; anything meaningfully above that warrants scrutiny on condition, location, and amenities.
Average Sold to List Price Essentially Unchanged Year Over Year
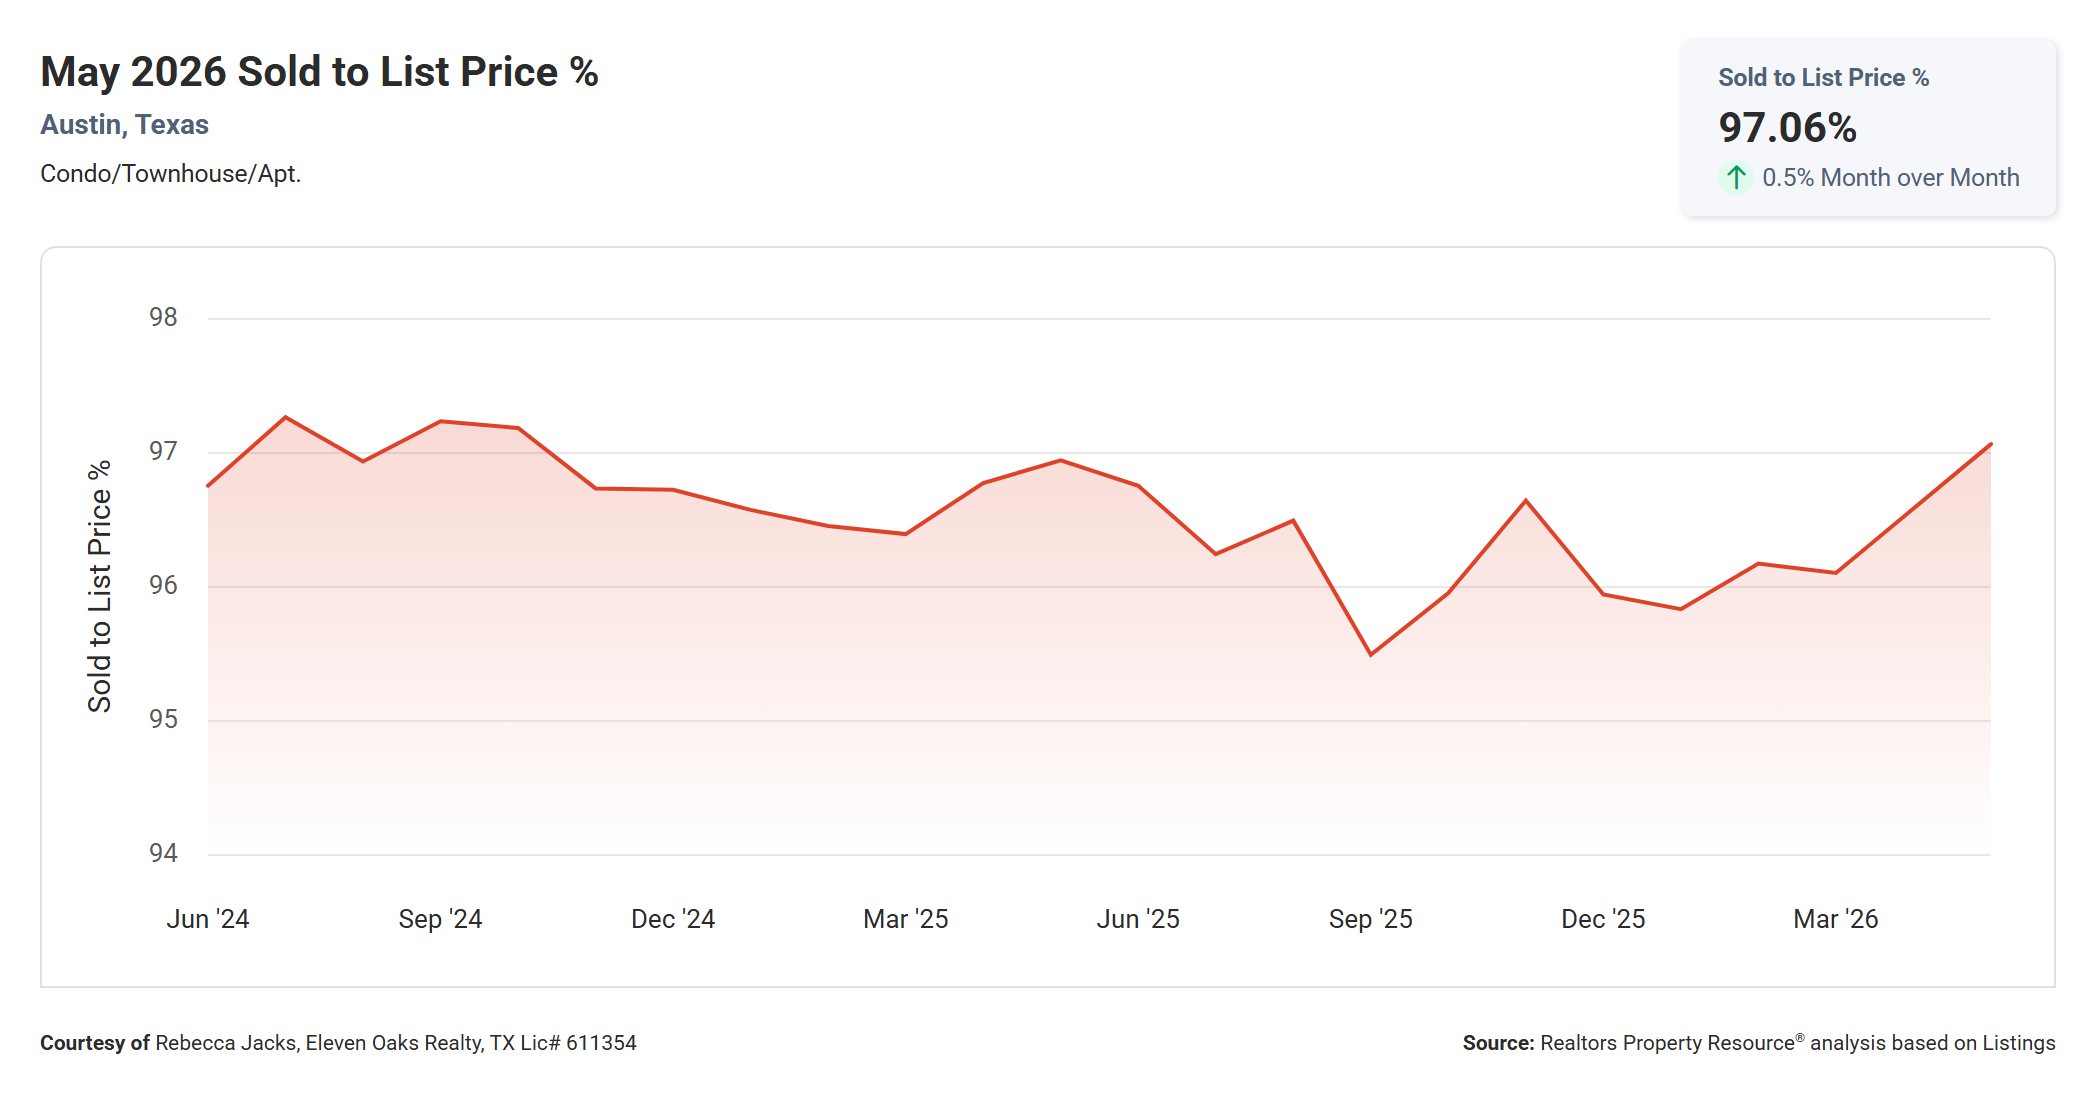
The sold-to-list price ratio for Austin condos came in at 97.06% in May 2026, up 0.5% from April 2026 and essentially unchanged from May 2025’s 96.94%.
The two-year chart shows this metric has been one of the most stable in the Austin condo market. Over the past 24 months, the sold-to-list ratio has generally stayed in a narrow range between approximately 95.7% and 97.3%, with dips in the fall of 2025 and a recovery since. The fact that this ratio has not collapsed, even in a buyer’s market with 10 months of supply, tells you that most condo sellers are arriving at a rational list price at some point in the process, even if it comes after initial overpricing and a reduction.
What this metric does not capture is the gap to the original list price, which is where the real story is. When you compare close price to the most recent list price, buyers are paying 97%. When you compare to the original list price, that number falls to 94.02% on average, per ABoR MLS data. The difference between those two percentages represents price reductions that happened before the home went under contract. A 3-point gap between CP/LP% and CP/OLP% is a meaningful signal that sellers are frequently adjusting before buyers even make an offer.
Median Time to Sell Essentially Flat Year Over Year
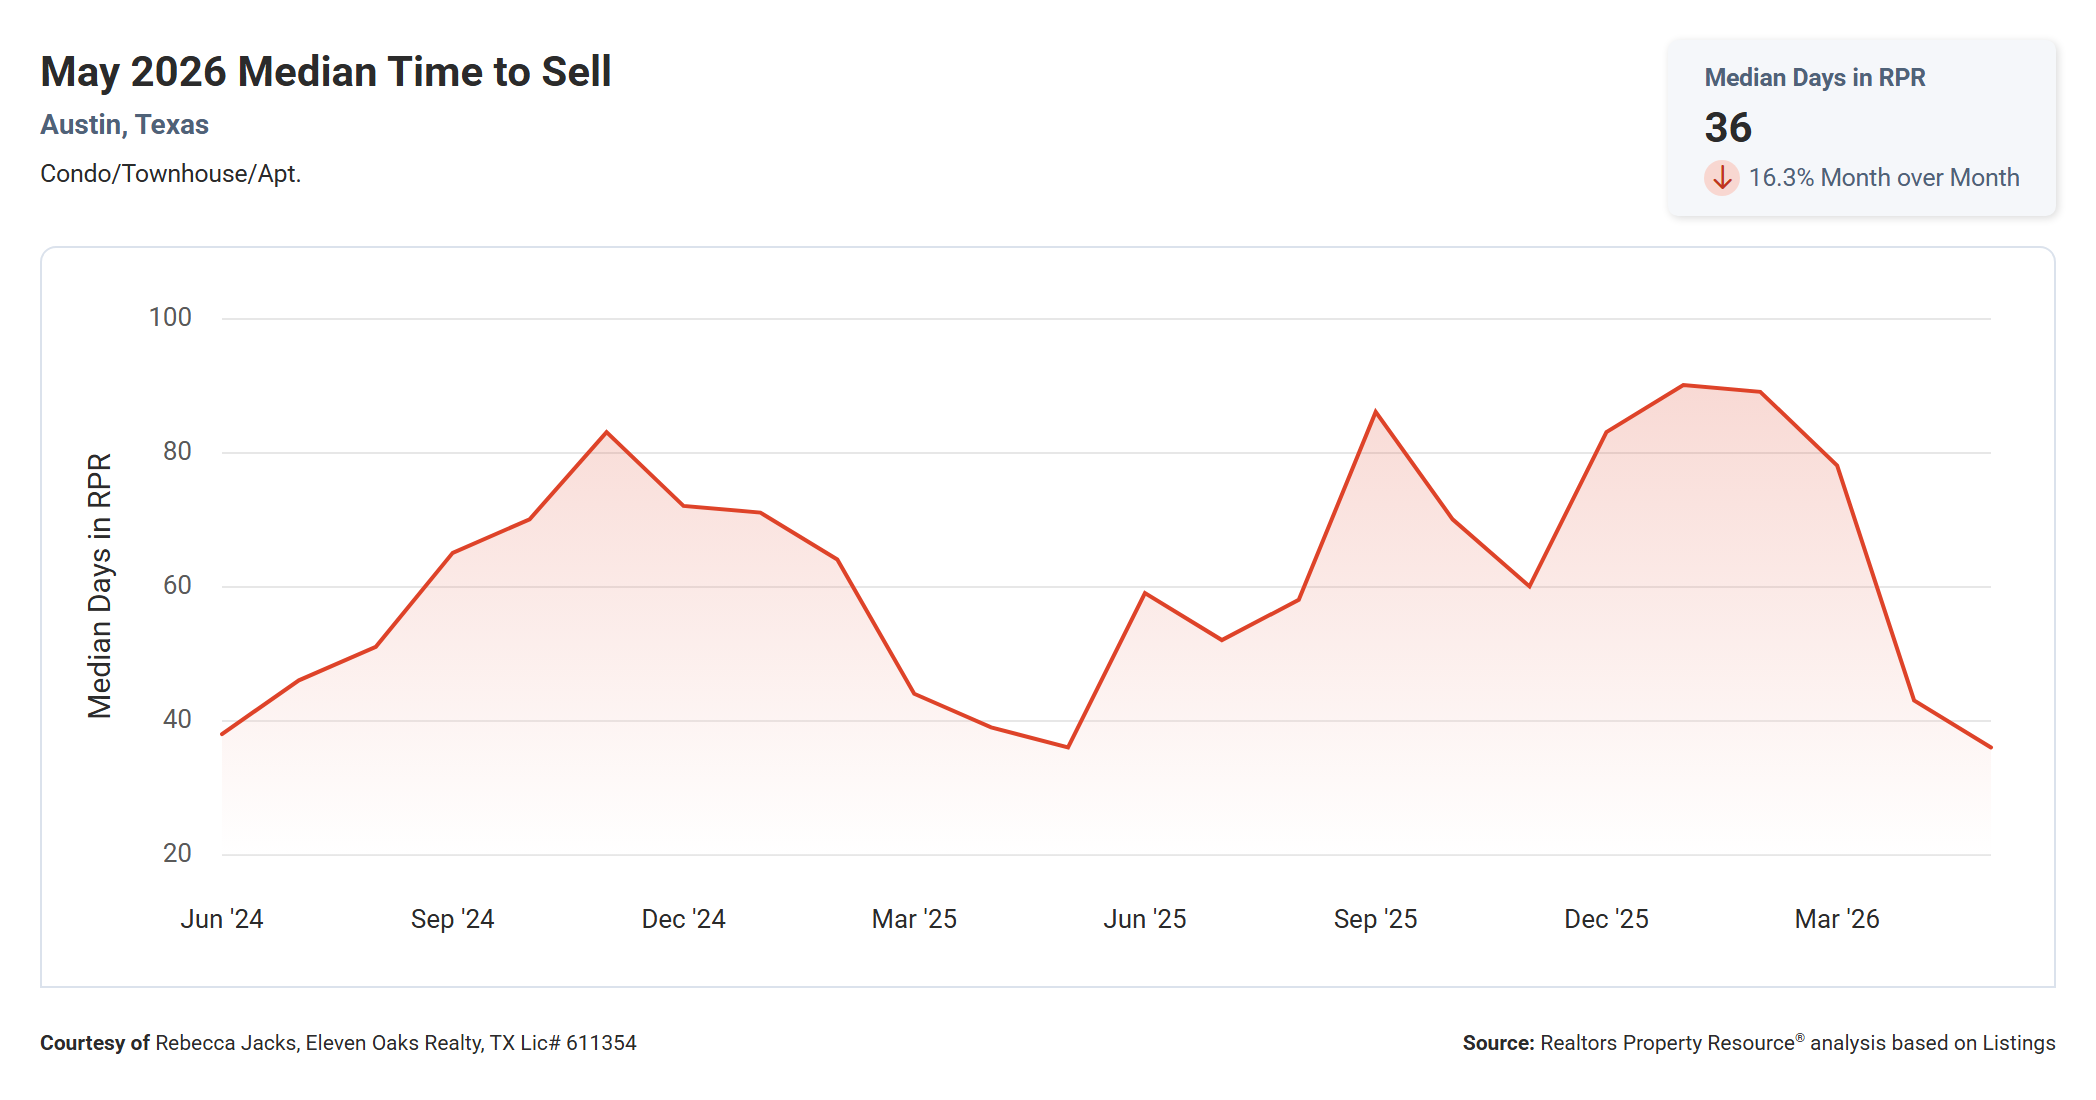
The median days on market for Austin condos came in at 36 days in May 2026, down 16.3% from April 2026’s 43 days and essentially flat compared to May 2025’s 36 days.
The month-over-month improvement is notable. A drop from 43 days to 36 days in one month is a meaningful acceleration, and it aligns with the jump in new pending listings also seen in May. This suggests that buyers who had been sitting on the sidelines came back with more urgency as the month progressed, or that sellers who had been overpricing finally adjusted to meet the market.
The year-over-year picture is notably stable. Despite a buyer’s market with elevated inventory, condos are not taking dramatically longer to sell than they were 12 months ago. The Unlock MLS data confirms a median of 35 days, very close to the RPR figure. What the data does show is a wide spread between median and average days on market: the median is 35 to 36 days, while the average per ABoR is 67 days. That gap tells you the market is not uniformly slow. A subset of overpriced or problematic listings is dragging the average up considerably, while well-priced condos are still moving in five to six weeks.
Months Supply of Inventory Down 4.4% Year Over Year
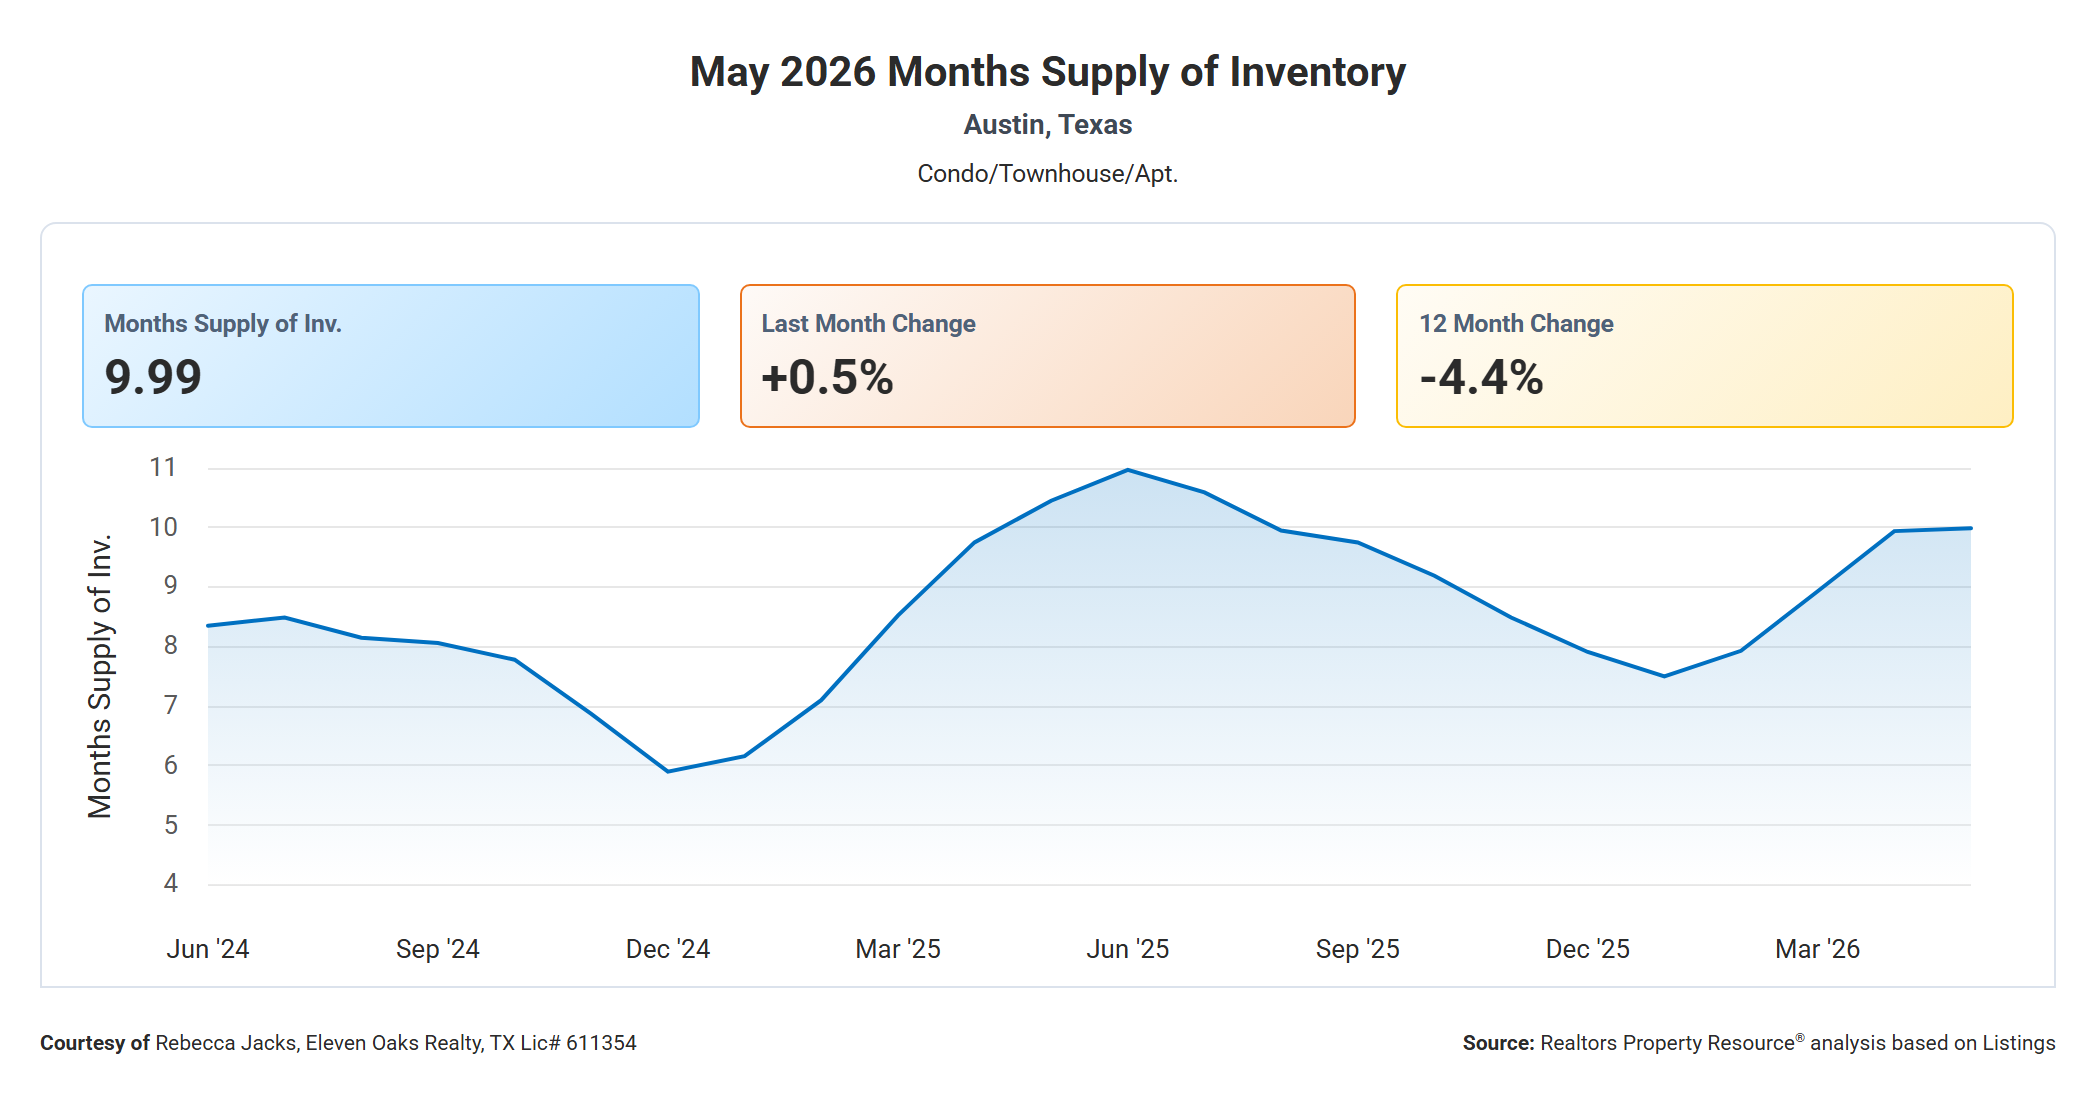
Months supply of inventory for Austin condos came in at 9.99 in May 2026, up 0.5% from April 2026 and down 4.4% from the same period 12 months ago.
The chart shows the full arc of this supply cycle. Inventory was already elevated in mid-2024, running around 8 to 9 months. It climbed further through the first half of 2025, peaking near 10.5 to 11 months around mid-2025 before pulling back modestly to the current level. At just under 10 months, supply remains deeply in buyer’s market territory. The 4.4% year-over-year decline is a modest improvement, but it is not the kind of move that changes the market dynamic. Buyers should expect continued leverage on price and terms.
Sellers who are watching this number for signs of relief should understand what it would take to move the needle. To get to six months of supply, the market would need either a significant decline in active listings or a significant increase in monthly sales, or both. May’s pending activity provides a small positive sign on the demand side, but active inventory also crept up 1.1% month over month. This supply picture is not changing quickly.
Active Listings Down 1.2% Year Over Year
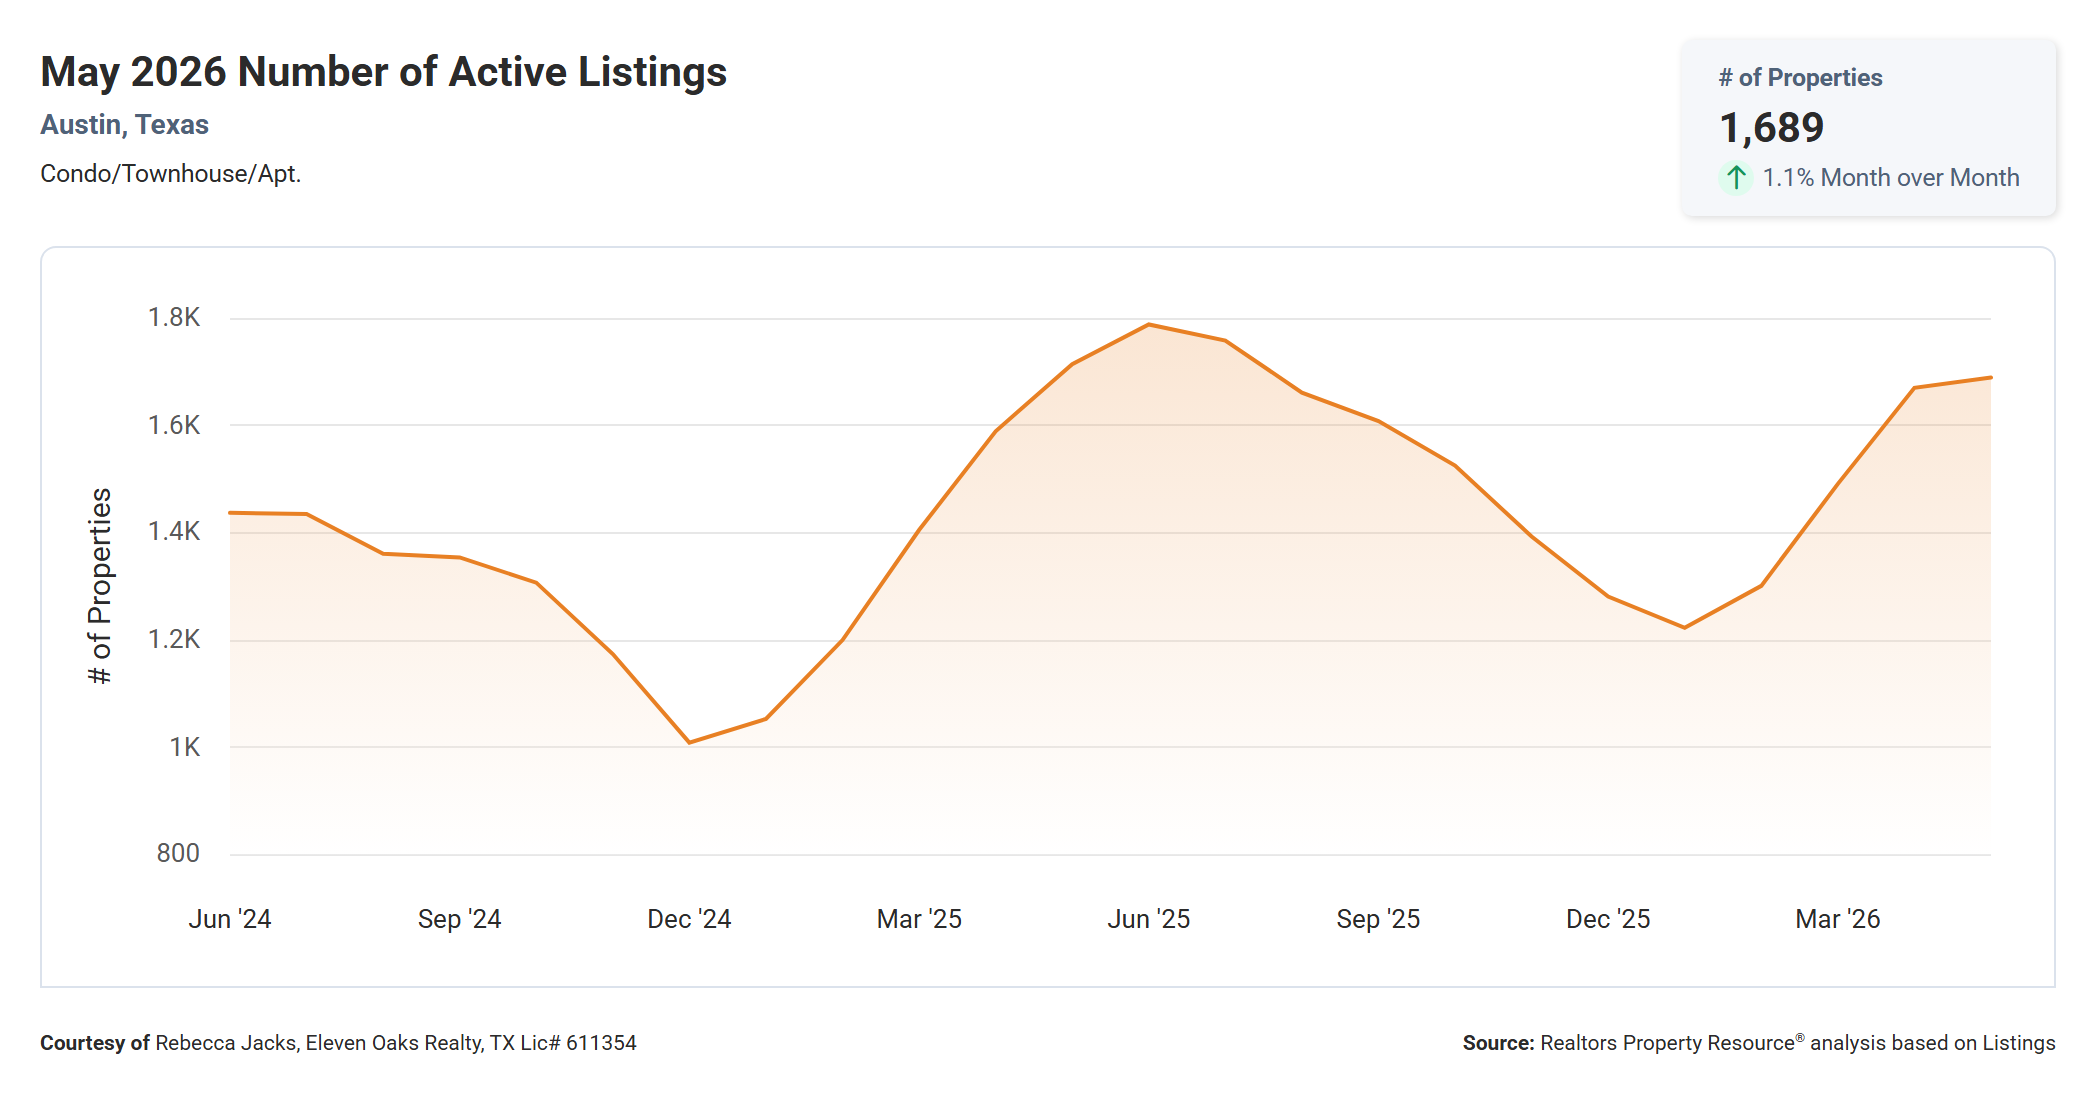
The number of active condo and townhome listings in Austin came in at 1,689 in May 2026, up 1.1% from April 2026 and down 1.2% from May 2025’s 1,710.
The two-year trend in this chart is worth understanding. Active listings dropped sharply from around 1,400 in mid-2024 to a low of approximately 1,000 to 1,050 in December 2024, reflecting the typical seasonal slowdown in new listings. They then climbed back through the spring of 2025, peaking near 1,800 in the summer of 2025, and went through another seasonal decline into late 2025 and early 2026. The current reading of 1,689 represents a return toward those summer 2025 peak levels, which is consistent with the spring listing season producing new inventory.
For buyers, 1,689 active listings means real selection across price points and neighborhoods. The Unlock MLS inventory snapshot confirms 1,596 active listings as of mid-June, which is close to the RPR end-of-month figure and reflects minor timing differences. Either way, this is a market where buyers can take their time, compare properties, and make informed decisions without the urgency that defined 2021 and 2022.
New Listings Down 11.5% Year Over Year
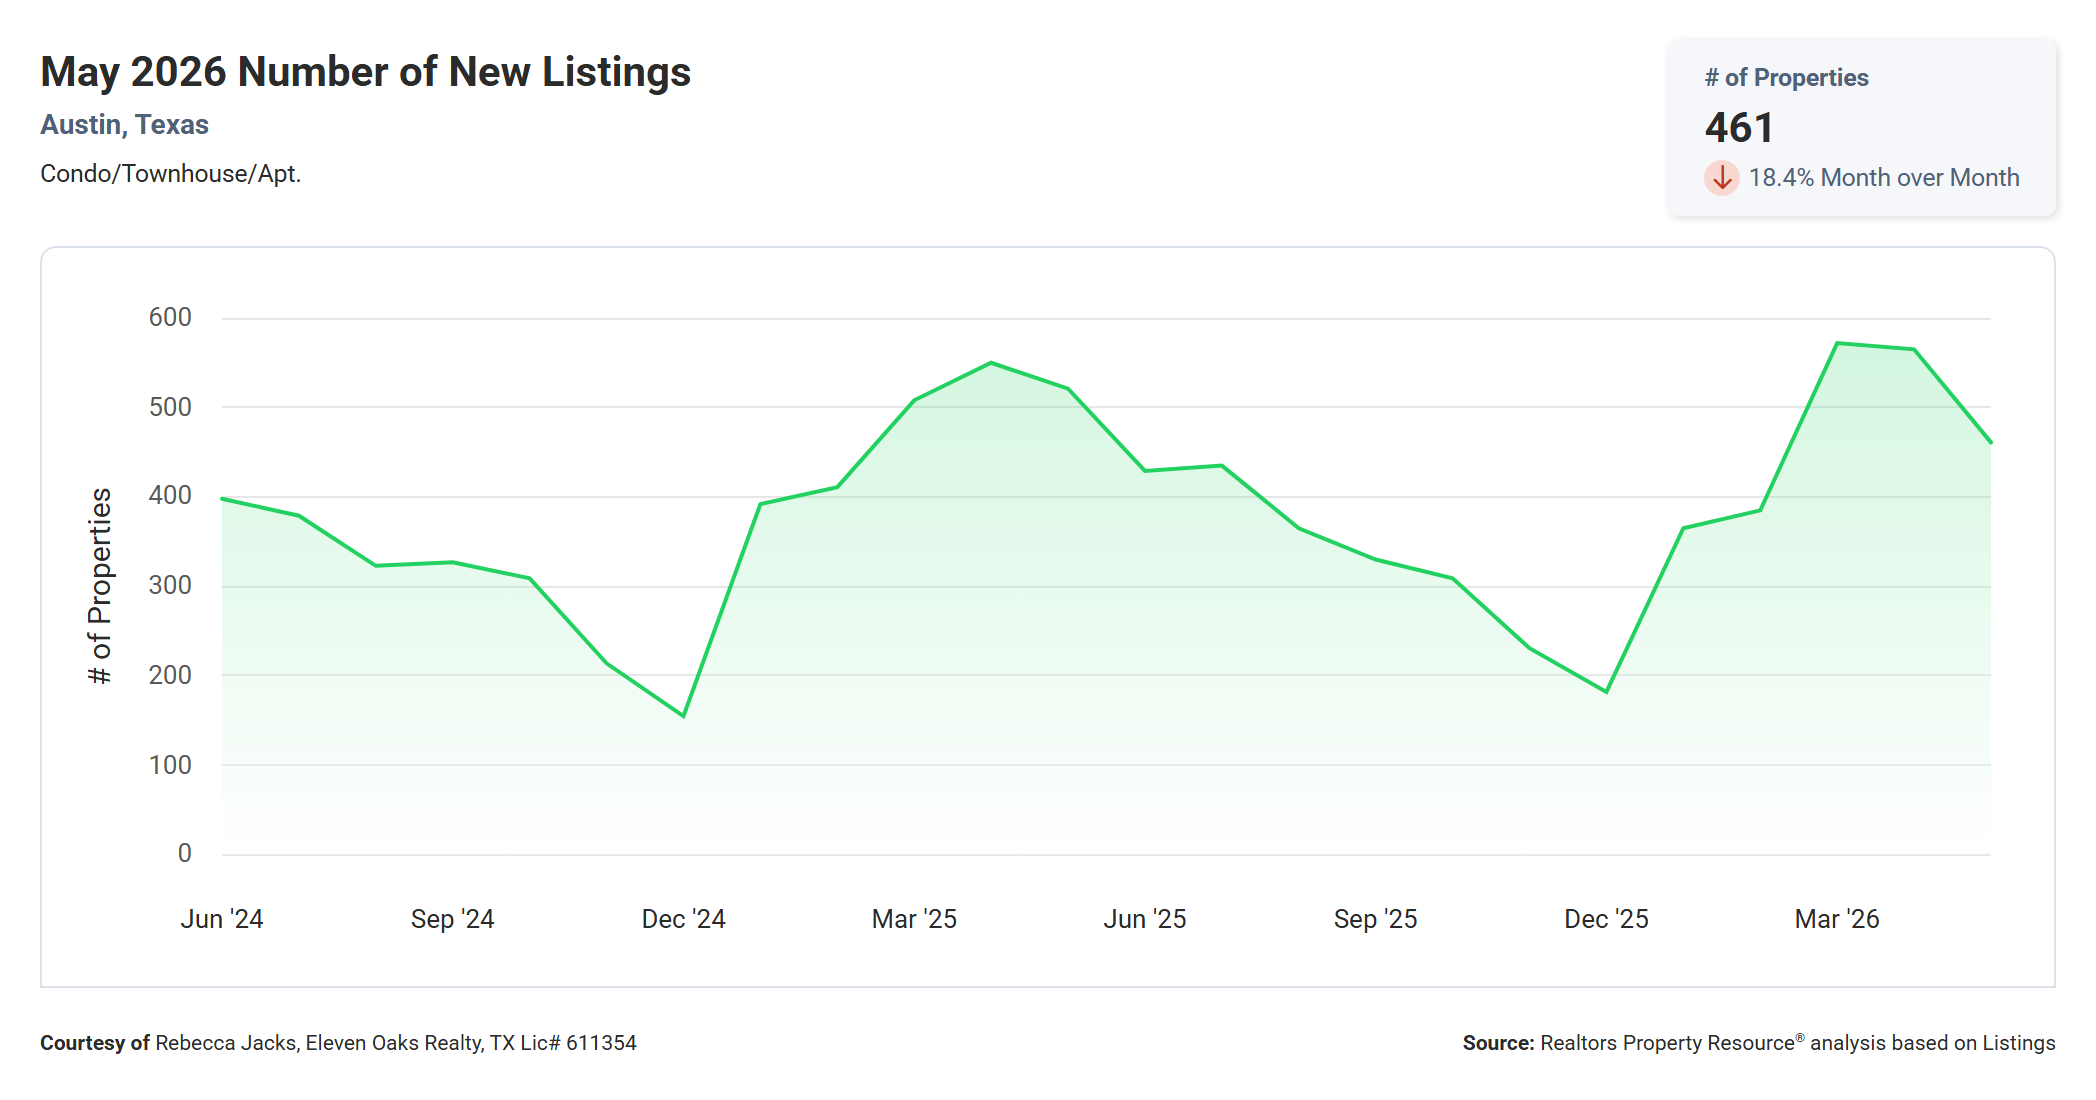
The number of new condo and townhome listings in Austin came in at 461 in May 2026, down 18.4% from April 2026’s 565 and down 11.5% from May 2025’s 521.
The year-over-year decline in new listings is actually a somewhat positive signal for the market’s supply trajectory. If fewer new listings are coming on than a year ago, it puts a natural cap on inventory growth even as existing listings take longer to sell. The seasonal pattern on the chart confirms this is typical timing: new listings tend to peak in March through May and then decline through the summer. The 461 reading for May is below the April peak but still within the normal seasonal range.
Unlock MLS confirms 440 new listings for May, slightly below the RPR figure of 461, and shows new listing volume is down 14.9% from the same period a year ago on a 90-day basis. Fewer new listings entering the market while pending contracts rise is the combination that will eventually bring supply down. It is not happening dramatically yet, but the ingredients are present.
New Pending Listings Up 6.6% Year Over Year
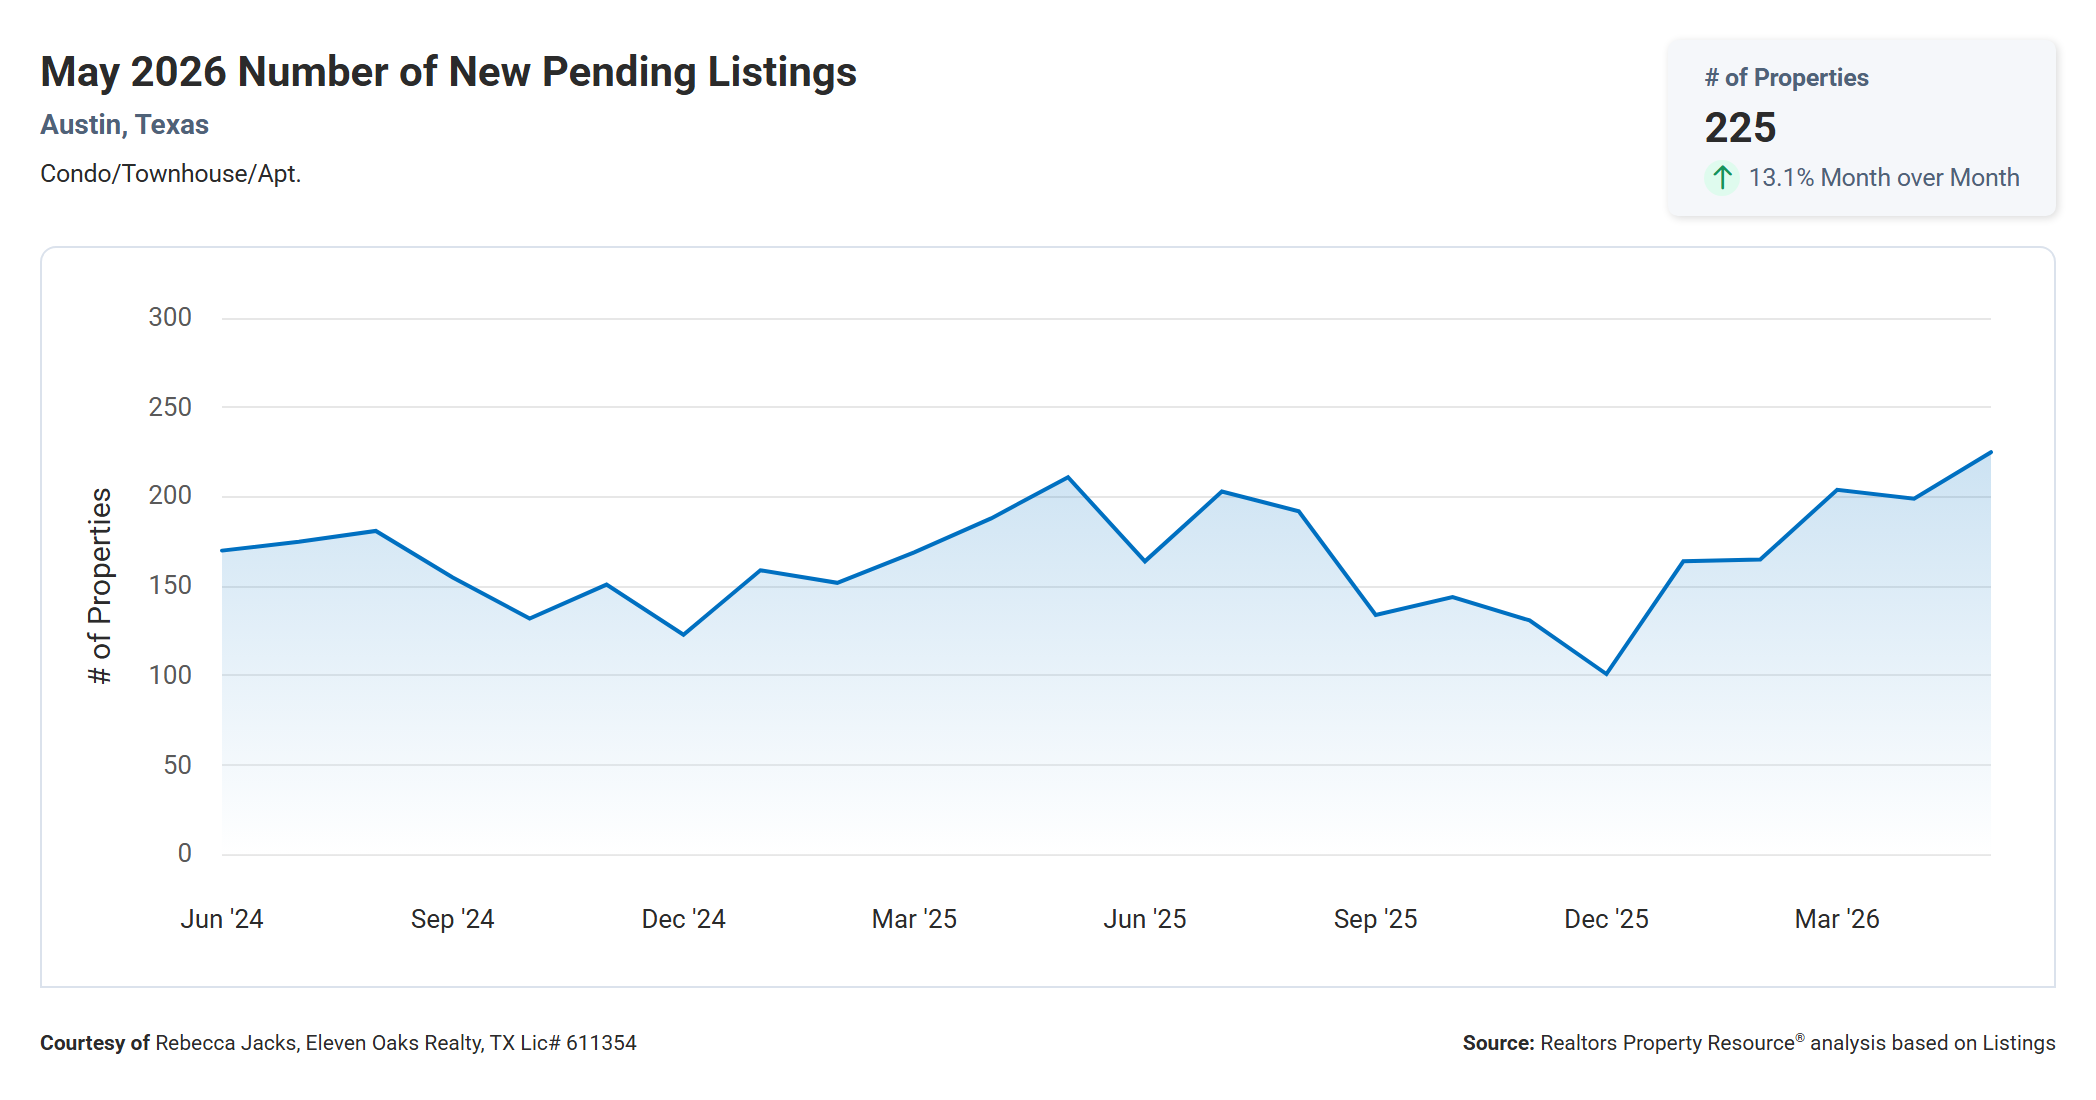
New pending listings for Austin condos came in at 225 in May 2026, up 13.1% from April 2026’s 199 and up 6.6% from May 2025’s 211.
This is one of the more encouraging signals in May’s data. Pending activity is a leading indicator; it captures decisions buyers made this month that will show up as closed sales in four to six weeks. A 13.1% month-over-month jump in new pending listings, combined with a 6.6% year-over-year increase, tells you that buyers are more active than they were at this time last year. Unlock MLS confirms 231 new under contracts for May, up 18.5% from the prior year, which is an even stronger reading.
The two-year chart shows that pending activity has been gradually building from a low point in late 2025. December 2025 was the slowest month on the chart, dipping to around 103 to 105 pending contracts. Since then, pending counts have climbed steadily each month, and May’s 225 is the highest reading in recent months. If this upward trend in pending activity continues into June and July, it will start to pull down the months of supply reading and tighten conditions modestly for buyers.
Condos Sold Down 2.6% Year Over Year
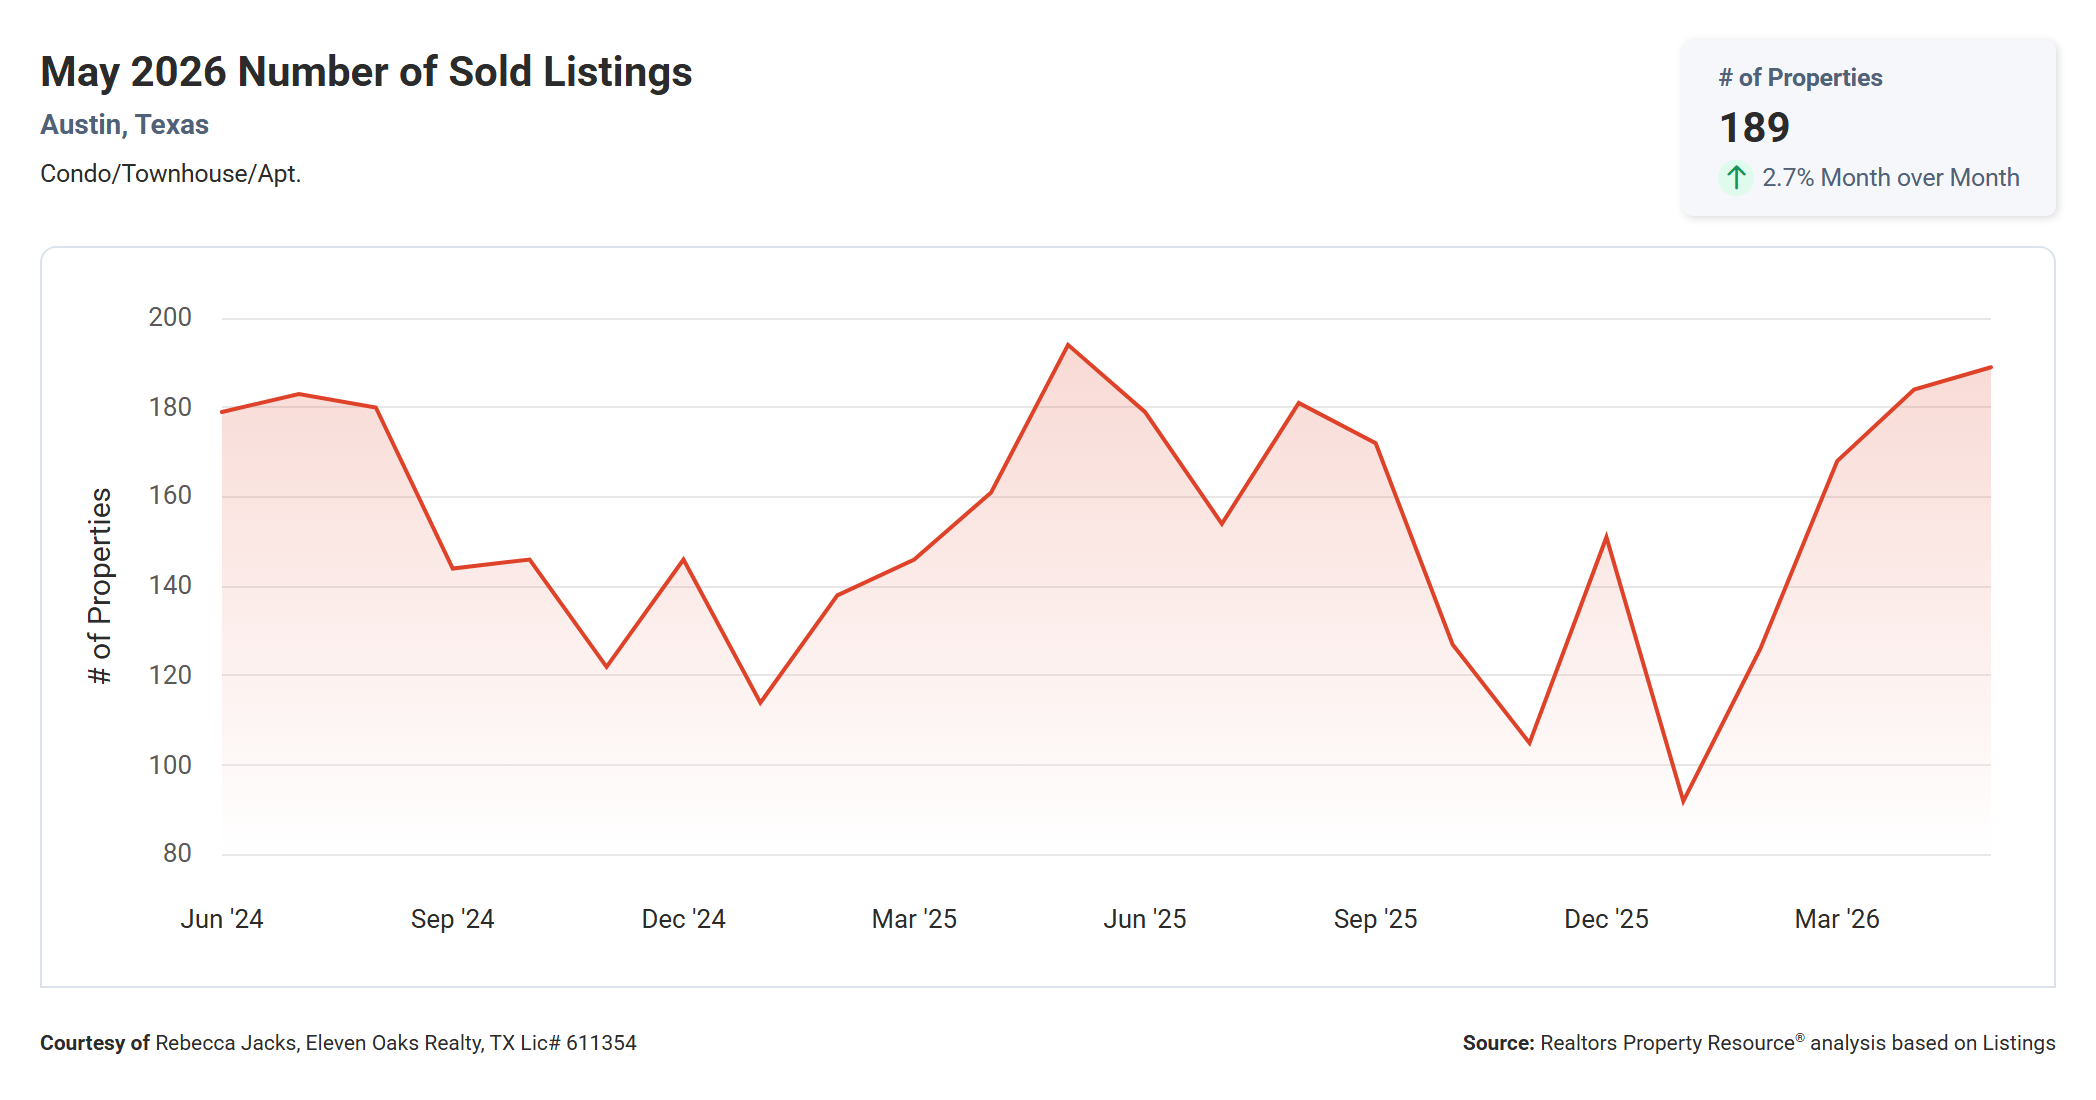
The number of condos and townhomes sold in Austin came in at 189 in May 2026, up 2.7% from April 2026’s 184 and down 2.6% from May 2025’s 194.
The modest year-over-year decline in closed sales puts May in a similar range to what the market has been producing for most of the past 12 to 18 months. Looking at the two-year chart, sales counts have been bouncing between approximately 105 and 194 per month, with the seasonal peaks in spring and summer and the troughs in November through February. May’s 189 is near the higher end of that recent range, which is consistent with spring seasonality.
Unlock MLS shows 191 closed transactions for May, slightly higher than the RPR figure of 189, which reflects minor timing differences between data pulls. The ABoR MLS shows 194 closed condominium and townhome transactions, which is the official MLS figure and is used for the statistics table in this report. All three sources confirm that May 2026 was a solid month for closings relative to the past year, even if volume remains well below the 286 to 380 closings per month seen during the 2021 to 2022 peak.
Total Sales Volume Down 7.9% Year Over Year
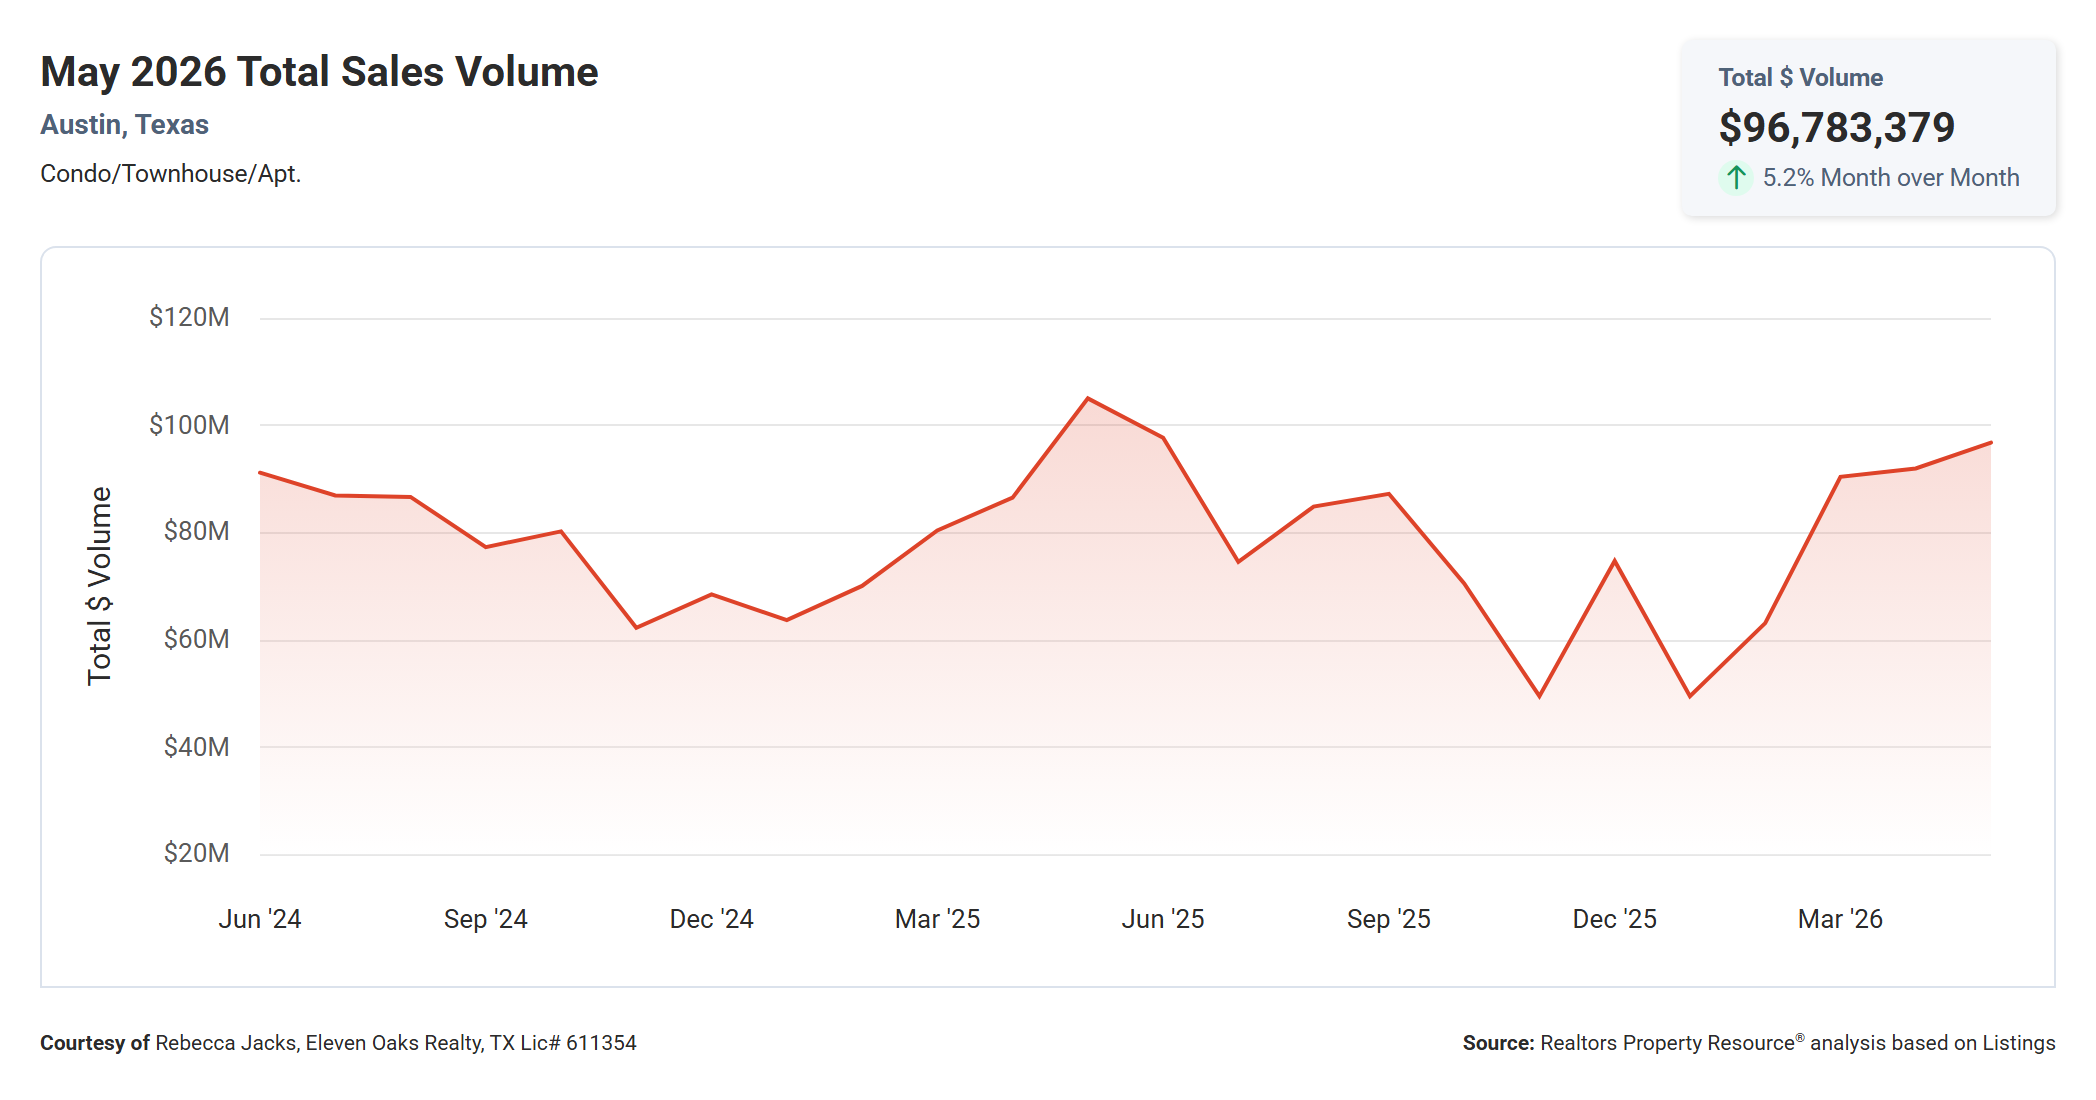
Total sales volume for Austin condos came in at $96,783,379 in May 2026, up 5.2% from April 2026’s $91,970,000 and down 7.9% from May 2025’s $105,030,000.
The month-over-month improvement in volume reflects two things working together: a slight increase in the number of sales and slightly higher dollar amounts on some transactions, even as the median price moved lower. It is worth noting that total volume can rise modestly even when the median falls if the distribution of sales shifts toward more mid-range and upper-range transactions.
The two-year chart shows volume has been running below the highs of spring 2025, when monthly volume briefly touched the $100 million to $107 million range. The current level of $96.8 million is the closest May has come to those spring 2025 peaks in recent months, which is an encouraging trajectory even if year-over-year comparisons still show a decline. Unlock MLS confirms a slightly different figure of $97,799,279 for May, reflecting timing and methodology differences, but both sources agree on the directional story.
May 2026 Austin Condo by the Numbers
The table below is pulled directly from the Austin Board of REALTORS MLS statistics for May 2026 and covers 194 closed condominium and townhome transactions in the City of Austin.
| Min | Max | Avg | Median | |
|---|---|---|---|---|
| Beds | 1 | 4 | 2 | 2 |
| Baths | – | 6 | 2 | 2 |
| Sq Ft | 378 | 3,877 | 1,396 | 1,366 |
| Lot Sq Ft | – | 87,120 | 4,329 | 2,496 |
| List Price | $100,000 | $3,400,000 | $525,880 | $385,000 |
| LP/Sq Ft | $126.70 | $1,446.19 | $378.03 | $328.30 |
| Acres | – | 2.000 | 0.099 | 0.057 |
| Close Price | $92,000 | $3,275,000 | $510,130 | $372,500 |
| CP/Sq Ft | $117.65 | $1,393.02 | $365.84 | $321.15 |
| CP/LP% | 87.00% | 110.00% | 97.04% | 97.00% |
| CP/OLP% | 33.00% | 138.00% | 94.02% | 96.00% |
| ADOM | 0 | 453 | 67 | 36 |
Note: The Baths Min field was blank in the source MLS data. Please verify and update if needed.
The most expensive condo that sold in May 2026 sold for $3,275,000 and the least expensive condo sold for $92,000. Condos ranged in size from 378 to 3,877 square feet with an average size of 1,396 square feet. The average price per square foot for a condo that sold in Austin in May 2026 was $365.84 with the lowest being $117.65 per square foot and the highest being $1,393.02 per square foot. It took, on average, 67 days to sell a condo in Austin and sellers received, on average, 94.02% of their original list prices.
The gap between CP/LP% (97.04%) and CP/OLP% (94.02%) is significant. Those three percentage points represent price reductions that happened before the listing went under contract, not negotiating during the offer process. At a median list price of $385,000, a 3-point gap translates to roughly $11,550 in reductions sellers made just to get buyers to the table. This is not unusual in a buyer’s market, but it is a clear signal that sellers who overprice at launch are paying a meaningful penalty.
The spread between average and median days on market is equally telling. The median of 36 days tells you that half of condos sold in May went under contract in about five weeks, which is not slow. The average of 67 days tells you that a meaningful number of properties are taking much longer, dragging the average up. The maximum of 453 days on market is an extreme example, but it reflects what happens when a listing is persistently overpriced or has a condition issue that buyers are unwilling to accept at the asking price. The market is not uniformly slow; it is unforgiving of pricing and condition mistakes.
Where Buyers Are Shopping: A Look at Price Ranges
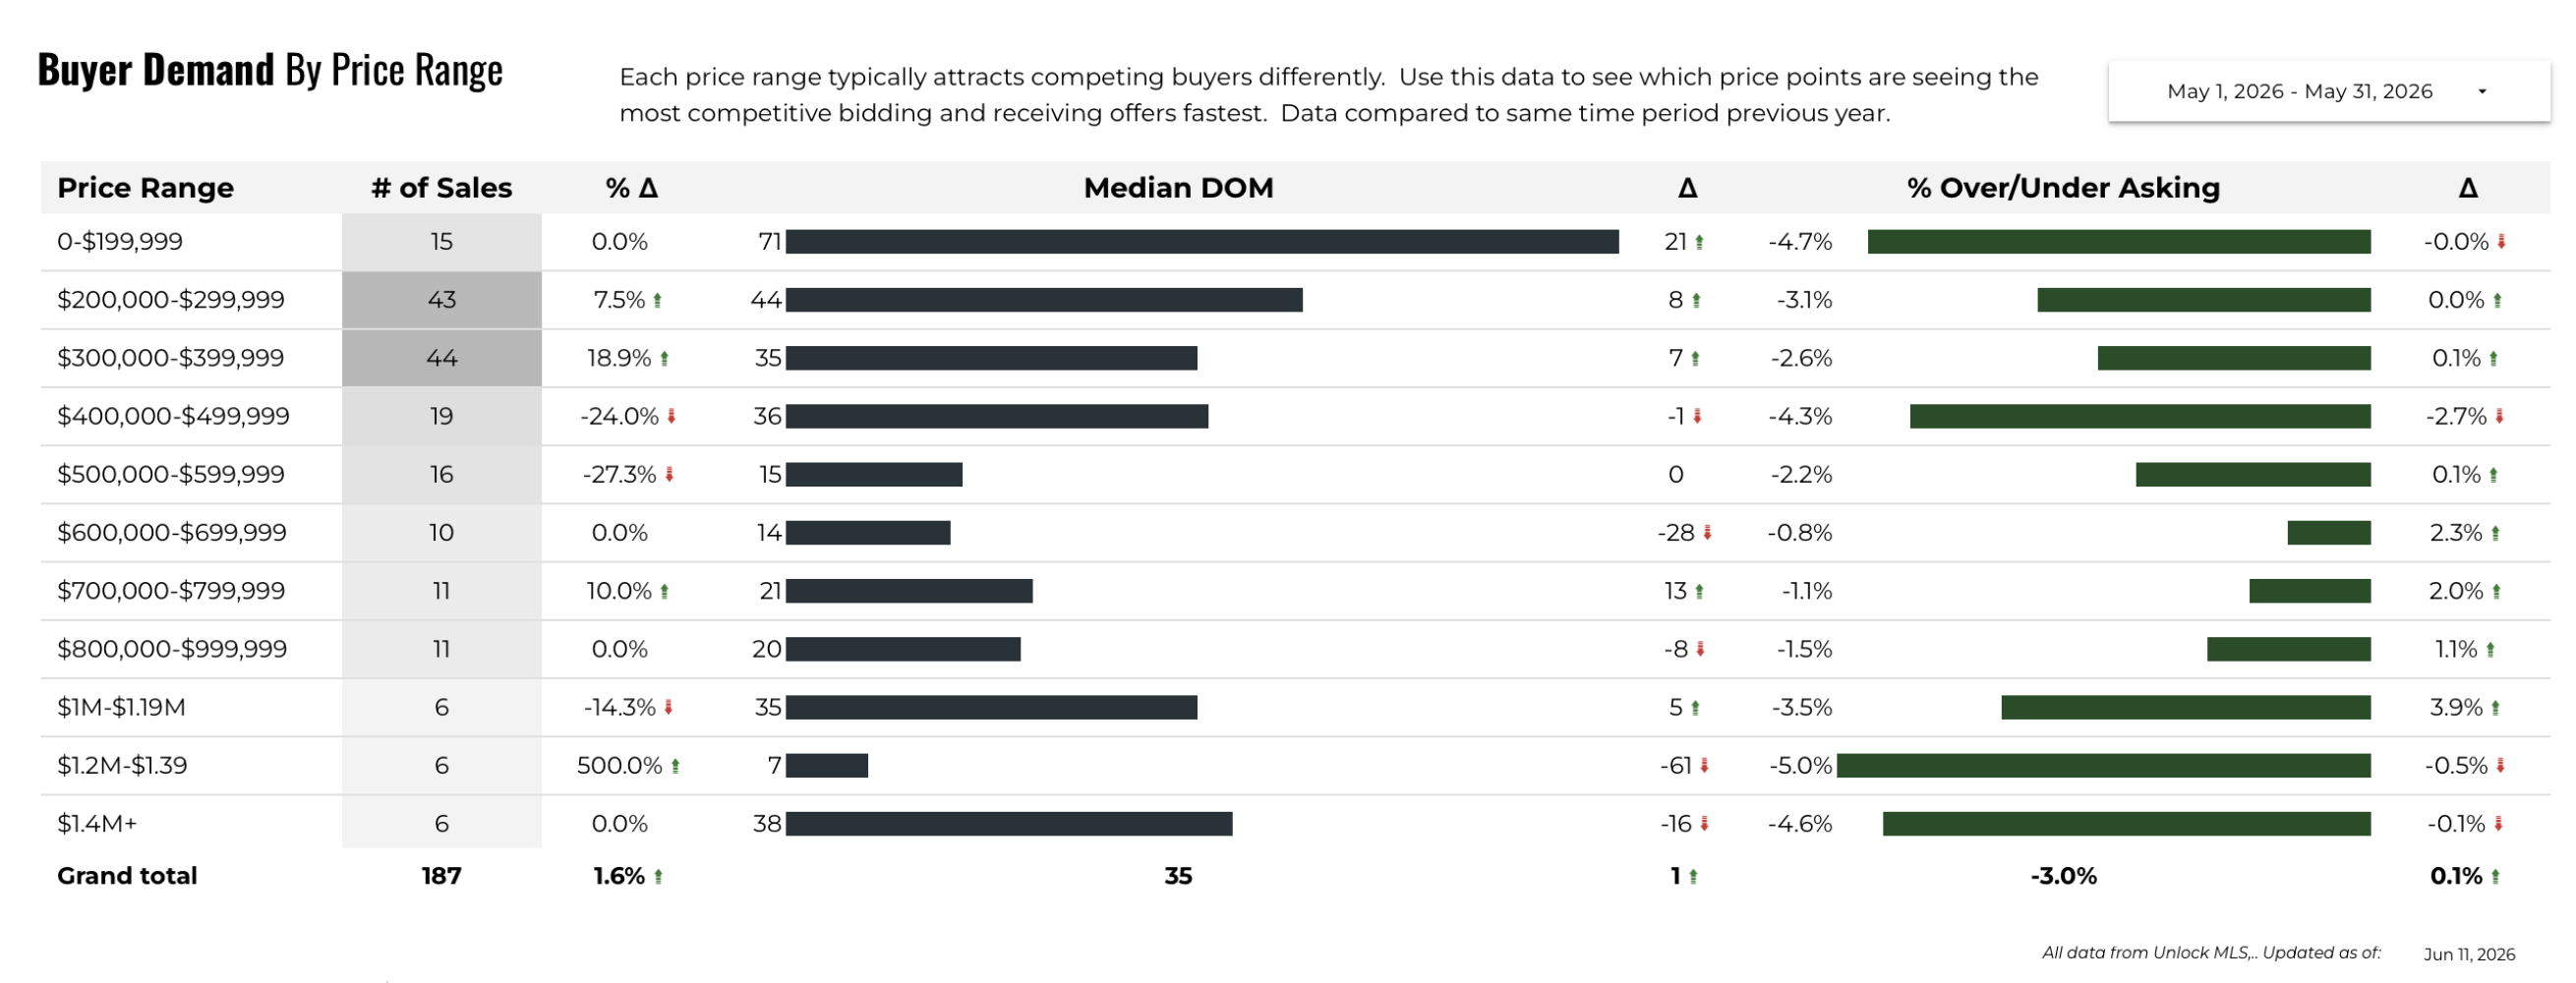
According to Unlock MLS, 191 condo and townhome transactions closed in Austin during May 2026. The buyer demand chart breaks down where those sales occurred by price range and compares activity to May 2025.
The $200,000 to $399,999 range dominated May closings by a wide margin. The $200,000 to $299,999 bracket produced 43 sales and the $300,000 to $399,999 bracket produced 44 sales, combining for 87 transactions and representing roughly 46% of all condo sales in the city. Year over year, the $300,000 to $399,999 bracket was up 18.9% in sales volume, making it the strongest-performing price tier in the market. The $200,000 to $299,999 bracket was also up 7.5% year over year. Buyers are gravitating toward the mid-range in meaningful numbers, and these price bands are where the most active competition exists.
Entry-level activity tells a nuanced story. The sub-$200,000 bracket produced 15 sales with zero year-over-year change, a reflection of how limited the sub-$200K condo supply is in Austin rather than lack of buyer interest. The entry-level pool is simply thin. At the other end, the $400,000 to $499,999 tier saw a sharp 24% year-over-year decline in sales, and the $500,000 to $599,999 bracket dropped 27.3% year over year. Buyers at those price points are clearly finding the sub-$400,000 market more attractive, or are choosing to wait.
Days on market by price range reveal where buyers are moving fastest. The $500,000 to $599,999 range had the shortest median DOM at just 15 days, followed by $600,000 to $699,999 at 14 days. These are counterintuitive results given the overall buyer’s market, but they reflect that well-priced condos in those brackets are still attracting motivated buyers. At the entry level, the sub-$200,000 bracket had a median of 71 days. The grand total median DOM across all brackets was 35 days.
Upper-price activity showed some interesting movement. The $700,000 to $799,999 bracket produced 11 sales, up 10% year over year, and the $1.2M to $1.39M bracket saw a 500% year-over-year jump (from 1 to 6 sales), though that reading is based on a small sample. Both the $1.2M to $1.39M and $1.4M+ brackets had buyers closing at 5% under asking. The $600,000 to $699,999 range was the closest to asking price at just -0.8% under, followed by $700,000 to $799,999 at -1.1% under.
Months of Supply by Price Range
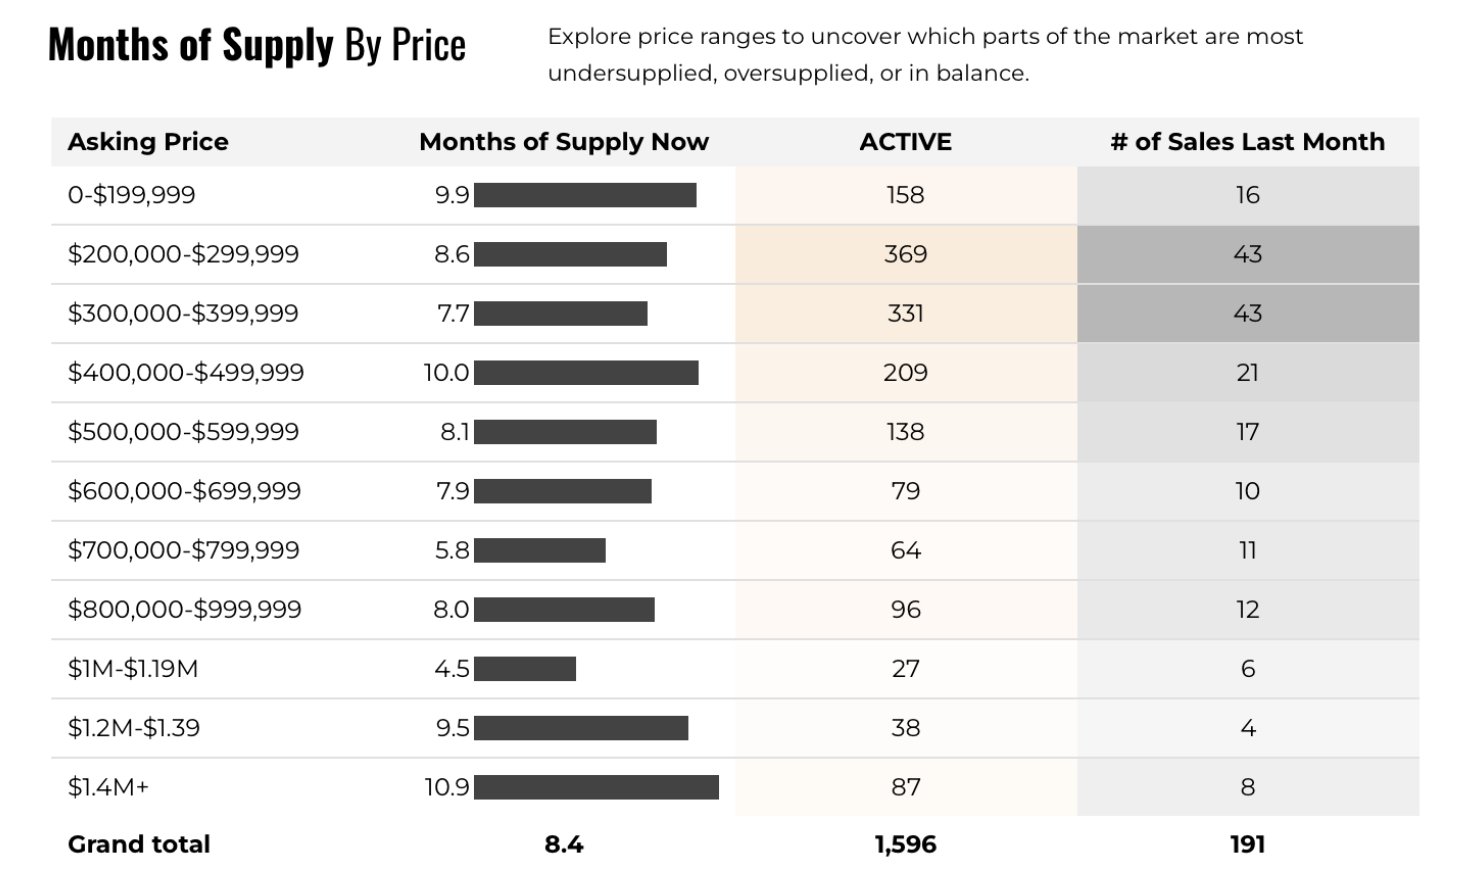
The months of supply chart from Unlock MLS breaks the overall 8.4-month reading into specific price tiers and reveals where buyers have the most and least negotiating leverage.
The $700,000 to $799,999 range is the tightest tier in the market right now, carrying just 5.8 months of supply with 64 active listings and 11 sales last month. While that is still technically a buyer’s market, it is the closest to balanced conditions of any price bracket and suggests buyers at that level face the most competition. The $1M to $1.19M range is also tighter than average at 4.5 months of supply, technically in balanced territory. These pockets of relative tightness are worth knowing if you are a buyer in those price ranges.
The loosest conditions are at the extremes. The $1.4M+ bracket carries a staggering 10.9 months of supply, with 87 active listings producing only 8 sales last month. Luxury condo buyers have the most leverage in this market, both on price and on terms. The $400,000 to $499,999 tier is also notably oversupplied at 10.0 months, with 209 active listings and only 21 sales last month. Buyers in that range have significant options and should negotiate accordingly.
The two core brackets for most buyers, $200,000 to $299,999 and $300,000 to $399,999, carry 8.6 and 7.7 months of supply respectively. Both are solidly in buyer’s market territory but are not extreme. These ranges represent the most transactional activity in the market and, while buyers have leverage, they are also competing with the most active pool of other buyers.
The Listing-to-Close Price Gap: What Sellers Need to Know
The ABoR MLS data for May 2026 shows an average CP/LP% (close price to most recent list price) of 97.04% and an average CP/OLP% (close price to original list price) of 94.02%. The difference between those two figures, approximately 3 percentage points, represents the price reductions sellers made before a buyer even submitted an offer.
Applied to the median list price of $385,000, that 3-point gap equals roughly $11,550. That is the average amount a seller is cutting their asking price before going under contract, on top of whatever the buyer negotiates from the reduced price. A seller who listed at $415,000, reduced to $385,000, and accepted $373,000 did not just negotiate down 3%; they started the process by giving back $30,000 before negotiations began. The math of overpricing is expensive, and it shows up clearly in this data.
The practical lesson for sellers is that the listing price is not a negotiating position; it is a signal to the market. Buyers and their agents are watching how long a listing sits and how many price reductions it has taken. A listing that has been reduced once or twice has already telegraphed seller motivation, and buyers will negotiate harder as a result. A clean, well-priced listing that goes under contract within 30 days at or near ask is far more likely to produce a better net result than a high-priced listing that chases the market downward for months.
Price Drops in the Austin Condo Market
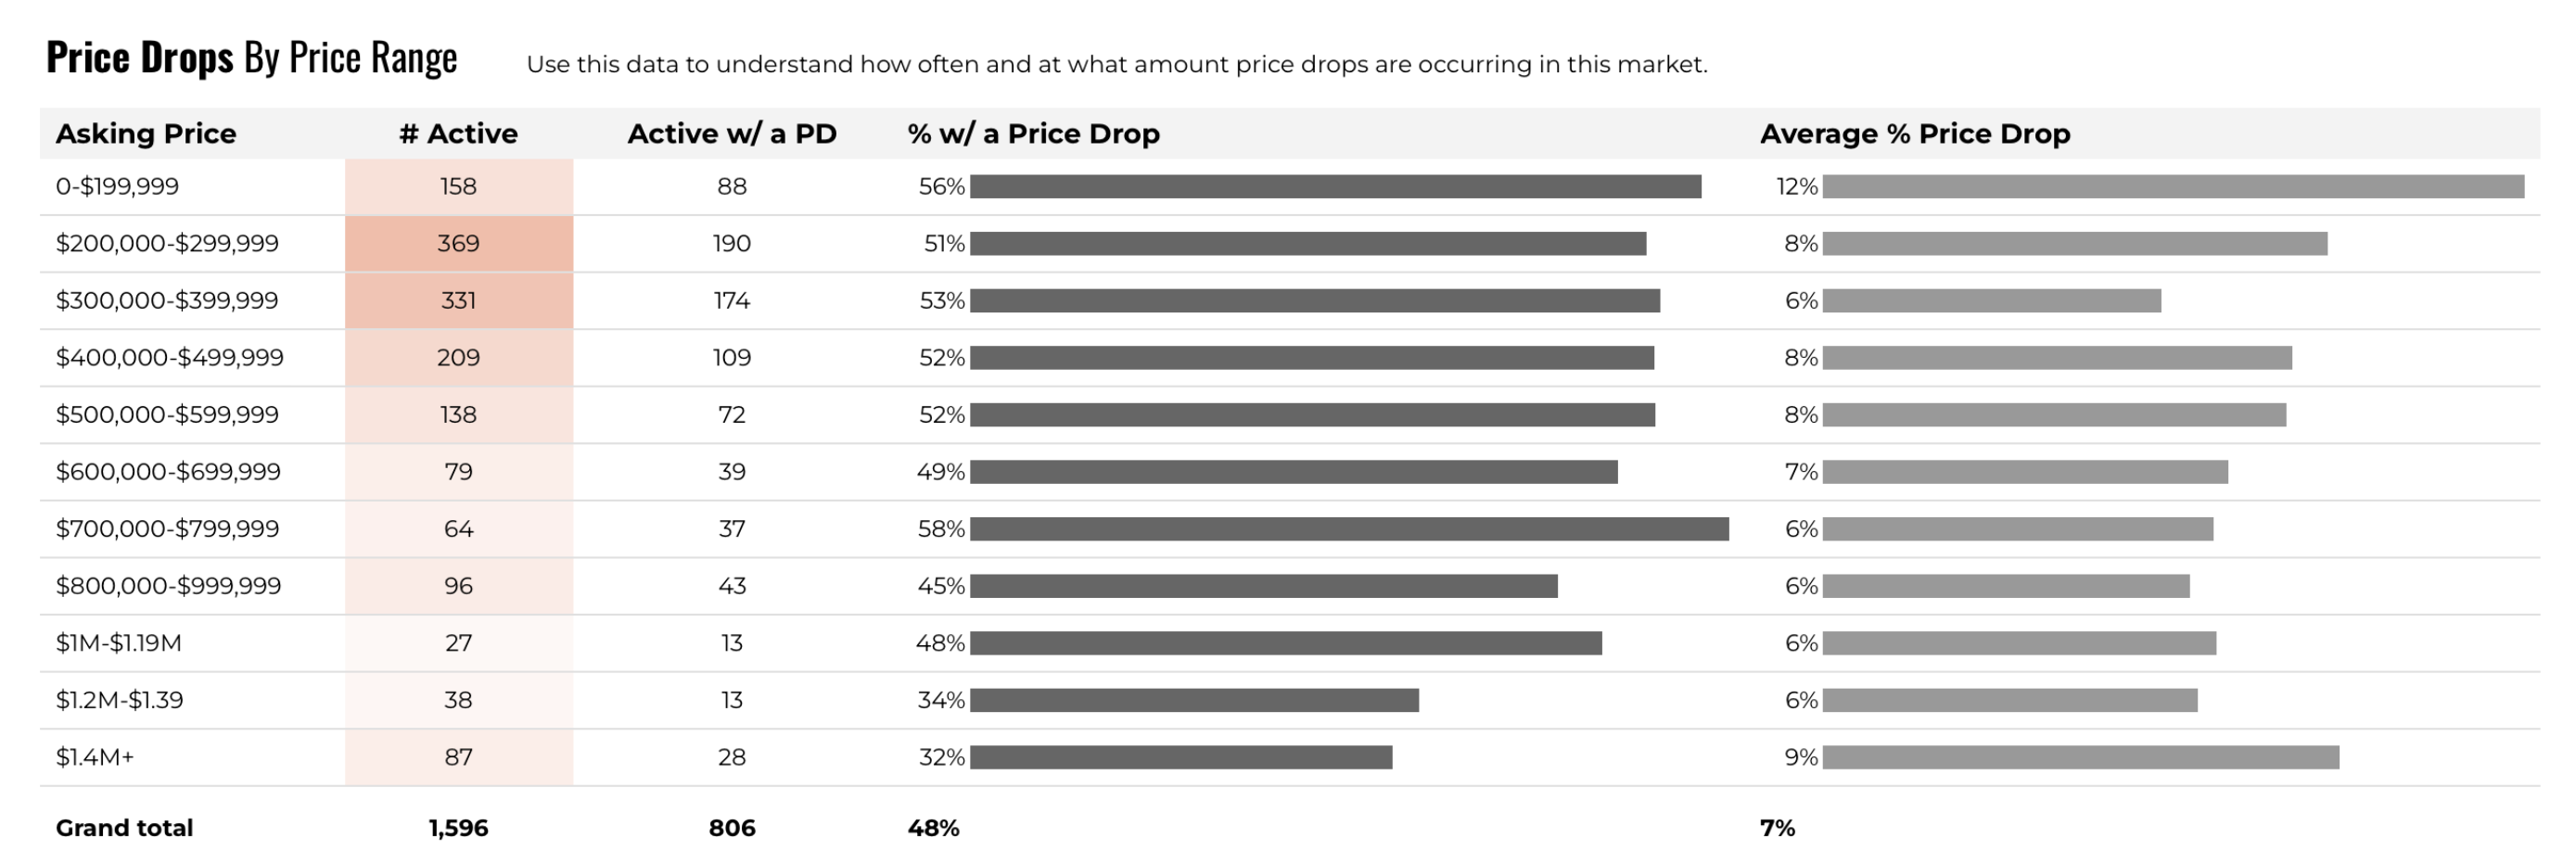
As of mid-June 2026, Unlock MLS shows 806 of 1,596 active condo and townhome listings in Austin carry at least one price reduction. That is 48% to 51% of all active inventory, making price reductions the norm rather than the exception in the current market. The average price reduction is 7%, and the median time from original listing to first price drop is 64 days.
For buyers, this data is a strategic resource. A listing that has been on the market for 60 or more days and has already taken a price reduction is a listing where the seller has demonstrated willingness to adjust. Combined with the median 21 days from price drop to going under contract, you can see that price reductions are working, just not as fast as sellers would like. Buyers who engage with a recently-reduced listing are entering negotiations with a motivated seller, a property that has already been rationalized on price to some degree, and a seller who wants to move on.
By price range, the highest rate of price reductions is in the $700,000 to $799,999 bracket at 58%, followed by the sub-$200,000 bracket at 56% and the $300,000 to $399,999 range at 53%. Even the tightest market segment carries more than half of its active listings with a reduction, which speaks to how broadly the adjustment process has run through the market. The $1.4M+ tier has the lowest rate at 32%, but also carries a 9% average drop, the second-highest average reduction of any bracket.
The closed sales data is equally informative. Of the 191 condos that closed in May, 70 of them (roughly 37%) closed having taken a price reduction at some point. The average total reduction from original list price to final close price for those transactions was 12%. That 12% figure is the real cost of overpricing: not just the reduction you make to get an offer, but the negotiation that happens on top of it. Sellers who price accurately from day one avoid both the public signal of a reduction and the compounding negotiation pressure that follows it.
2025 Full Year Austin Condo Market Recap
Unlock MLS data shows 1,811 condominiums and townhomes sold in Austin in 2025, a 5.2% decline from 2024’s 1,910 closed transactions. The median sold price in 2025 was $391,000, down 4.0% from 2024’s $407,400. Total dollar volume came in at $942.5 million, down 4.6% from the prior year, and the average price per square foot declined 4.9% to $376. Median days on market rose to 56 days in 2025, up from 50 days in 2024, reflecting the longer absorption times that characterize a buyer’s market.
The seasonal pattern within 2025 was notable. Sales were softest in January (113 transactions) and strongest in the spring and early summer, with May producing 192 closings and the market remaining reasonably active through August (182 closings) and September (170 closings). The fall and winter months saw a significant pullback, with November dipping to 105 sales and December recovering modestly to 147. This seasonal arc is consistent with historical norms, though the absolute sales counts were lower than 2023 and 2024 at every comparable month.
The 2025 recap provides useful context for understanding where the 2026 market is tracking. Through May 2026, Unlock MLS shows 818 year-to-date sales, essentially flat with the same five-month period in 2025. That is an encouraging data point: despite a market that feels soft, closings are keeping pace with last year. What has changed is pricing. The year-to-date median of $390,000 is 5.8% below the comparable 2025 period, and year-to-date volume is down 5.2%. The market is moving roughly as many condos as it did a year ago, just at lower prices.
Condo Sales by Bedroom Count
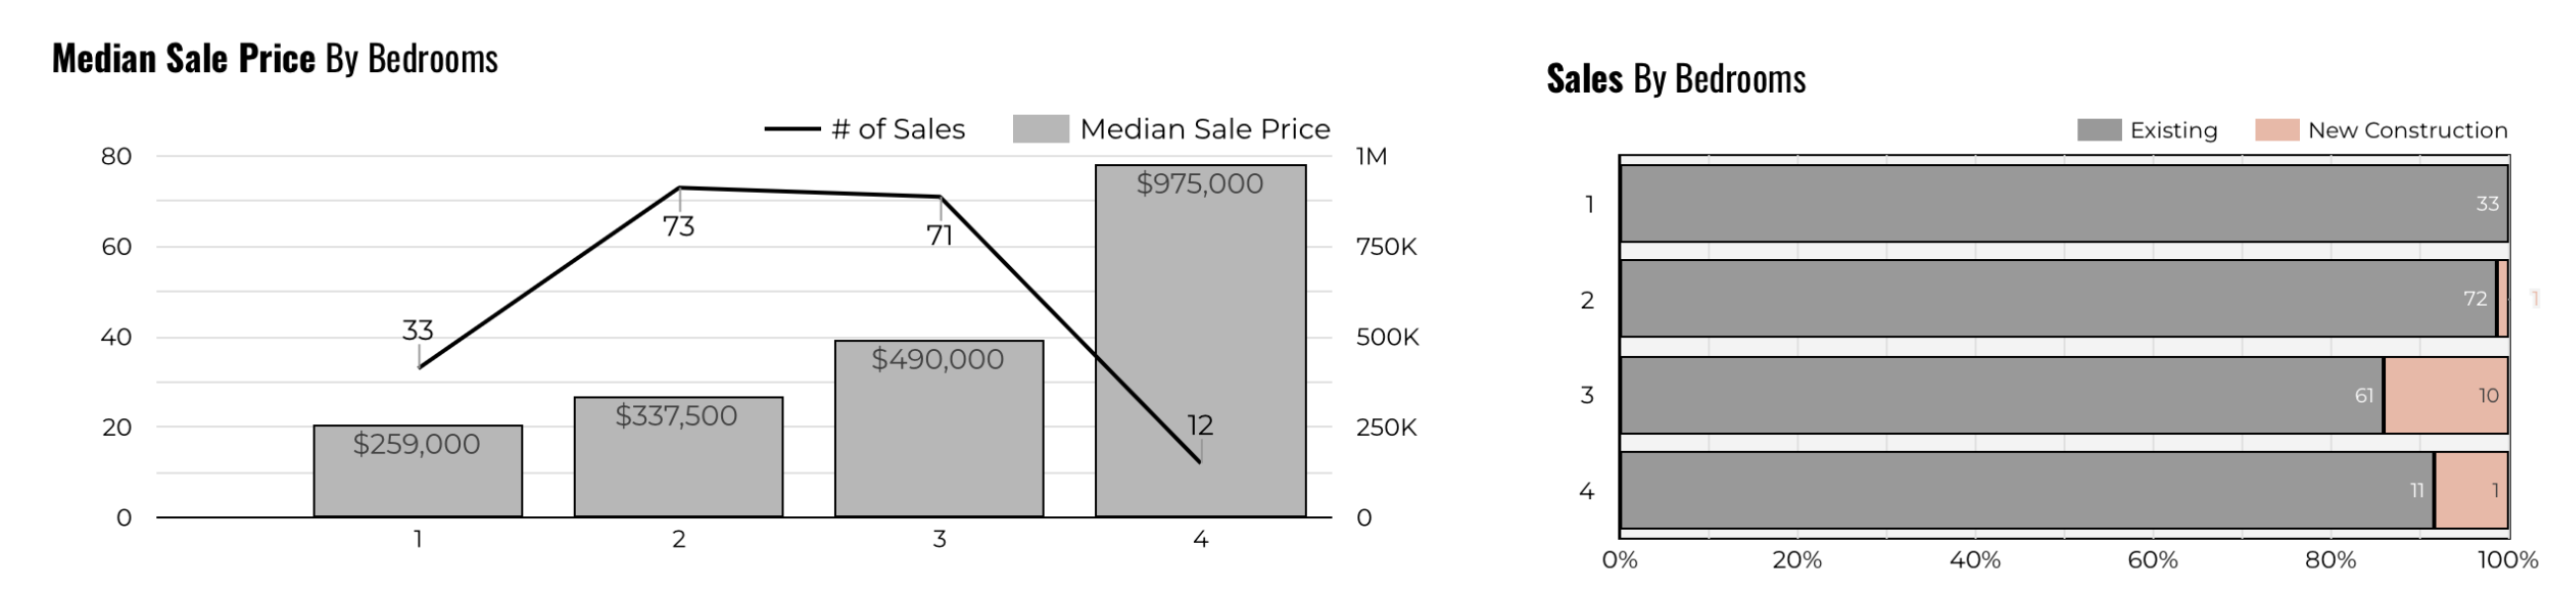
The breakdown of May 2026 sales by bedroom count from Unlock MLS provides useful context for buyers comparing condo configurations and for sellers understanding where their unit competes.
Two-bedroom condos dominated May closings with 73 sales, followed closely by three-bedroom units at 71 sales. One-bedroom condos produced 33 sales, and four-bedroom units accounted for 12 sales. The median sold prices range considerably: one-bedroom condos closed at a median of $259,000, two-bedrooms at $337,500, three-bedrooms at $490,000, and four-bedroom units at $975,000. The jump from three to four bedrooms is particularly significant, with the median nearly doubling, reflecting that four-bedroom condos in Austin tend to be high-end urban units or large townhomes rather than standard inventory.
For buyers, the two-bedroom and three-bedroom markets are the most liquid right now, with the highest transaction counts and the most comparable sales to draw from when evaluating a property’s fair market value. The one-bedroom market at $259,000 median is the most accessible price point but also carries the longest median days on market in the sub-$200,000 range. Four-bedroom units at $975,000 median represent a thin but active slice of the luxury condo market, with 12 transactions giving buyers and sellers enough data to establish a fair range.
For sellers of three-bedroom condos, May’s data is relatively encouraging: 71 sales at a $490,000 median is a healthy volume of activity at that configuration. Ten of those 71 three-bedroom sales were new construction, indicating that buyers at the three-bedroom level are willing to pay for new product, which sets a competitive bar for existing resale units on condition and finish level.
Market Summary and Outlook
May 2026 told a story of a condo market that is still adjusting but showing meaningful signs of stabilization. The headline figure, a $370,000 median sold price down 6.8% year over year, reflects a market that has repriced from its 2025 peaks. But beneath that headline, the pending activity data tells a more encouraging story. New pending listings jumped 13.1% month over month to 225 contracts, the highest reading in several months, and Unlock MLS shows new under contracts up 18.5% year over year. Buyers are re-engaging.
The year-over-year comparisons confirm the market is softer than it was 12 months ago, but not dramatically so in terms of volume. Sales counts are within a few percentage points of last year at both the RPR and Unlock MLS level. What has changed is price. The median sold price, the price per square foot, and the total dollar volume all show meaningful year-over-year declines. This is the market repricing to match the available buyer pool, not collapsing.
The variable to watch most closely heading into summer is whether the May pending surge translates into June and July closings. If it does, months of supply will start to decline from its current 9.99 level, and the balance of leverage between buyers and sellers will begin to shift modestly. If pending activity stalls, inventory will continue to build and pricing pressure on sellers will remain. The spring listing season is drawing to a close; the next 60 days will indicate how much of the May optimism is sustained versus seasonal.
Austin’s condo market fundamentals deserve a longer-term perspective as well. The 2021 to 2022 peak produced median prices near $450,000 to $460,000 and monthly sales north of 350 to 400 units. The current $370,000 median and 189 to 191 monthly closings represent a significant adjustment from that peak but are broadly consistent with where the market was in 2019 to 2020, before the pandemic surge. The question is not whether Austin condos have a long-term market; they do. The question is where within the current price range a specific unit represents fair value.
Time to Buy? Time to Sell?
For buyers, this is one of the more favorable entry points in recent memory. Prices are down meaningfully from 2025 peaks, inventory is abundant, and the data shows real negotiating room, with buyers averaging 94% of original list price on closings. If you have been pre-approved and have been watching the market, the combination of lower prices, higher selection, and motivated sellers is a set of conditions that does not always last. The pending activity surge in May is a reminder that you are not the only buyer who has noticed.
For sellers who need to move, the path to a successful sale is straightforward even in this market: price accurately from day one, invest in preparation and presentation, and be realistic about what the data says your condo is worth right now, not what it was worth in 2024. The sellers who are closing in 35 to 36 days are pricing correctly. The ones sitting at 67 or 100-plus days are not. A skilled listing agent with current, hyperlocal data can tell you the difference.
For sellers who can afford to wait, the pending data suggests the market may be gradually improving. If the May surge in new contracts is sustained through June and July, months of supply will edge down, and seller leverage will improve modestly. That is not a reason to wait indefinitely, but if your timeline is flexible, watching another 60 to 90 days of data before listing could inform a better pricing strategy. The key variables to watch are monthly pending counts, new listing volume, and whether the gap between median list price and median sold price begins to narrow.
Action Items for Buyers
- Get pre-approved before you start looking in earnest, because the listings generating the most interest right now are the well-priced ones that go under contract in under 30 days, and you cannot move quickly without financing in place.
- Target listings that have been on the market for 60 or more days and have taken at least one price reduction, because those sellers have already demonstrated willingness to adjust and the data shows buyers are typically saving an additional percentage on top of the stated reduction.
- Use the price-range breakdown to focus your search: the $300,000 to $399,999 bracket had the most sales in May, the $700,000 to $799,999 range is the tightest in terms of supply, and the $400,000 to $499,999 range is the most oversupplied, giving you the most room to negotiate there.
- Compare asking prices per square foot to the May 2026 median of $321 per square foot from ABoR data and $320 from RPR; anything significantly above that number should have a specific explanation in terms of location, finishes, or amenities.
- Pay attention to HOA fees, reserves, and upcoming special assessments, because at 189 to 194 closings per month, the condo market is active enough that if a specific building has HOA problems, you will have other options.
- Work with an agent who has access to current, zip-code-level pending and days-on-market data so you can see what is happening in the specific neighborhoods and buildings you are targeting, rather than relying solely on citywide medians.
Action Items for Sellers
- Price your condo based on where the market is today, using May 2026 closed comparable sales rather than 2025 data, because the median sold price has declined 6.8% year over year and buyers and their agents will know the difference.
- Understand your competition before you list: pull the active listings in your price range and size bracket, walk through the ones that have been sitting the longest, and then ask yourself honestly whether yours is better, the same, or worse than what buyers are currently passing on.
- Invest in preparation before listing, because the median days on market of 36 days for properties that close tells you the well-prepared listings are still moving, and condition is the primary differentiator between a property that closes and one that accumulates days on market.
- If you are considering a price range between $400,000 and $499,999, know that this bracket has the second-highest months of supply at 10 months and saw a 24% year-over-year decline in sales, which means you need to be more aggressive on pricing and preparation than in other ranges to get a buyer’s attention.
- Do not wait for the market to come to you: with 48% to 51% of active listings currently carrying a price reduction, a proactive, accurate initial price is far more effective than listing high and reducing later, because the reduction signals to buyers that something is wrong even when it is just a pricing correction.
- Pay attention to the pending surge in May as a potential leading indicator: if June closings show improvement, it may indicate better conditions are ahead, but you should not wait for that confirmation before listing if your personal timeline requires selling now.
Final Word on the Austin Condo Market
May 2026 is a buyer’s market. That is not a qualified statement or a nuanced read; it is what nearly 10 months of inventory, a 6.8% year-over-year price decline, and a 48% price reduction rate among active listings collectively demonstrate. Buyers have real options, real negotiating room, and more time to make decisions than at any point in the past four years. That is an unusual and worthwhile set of conditions for anyone who has been waiting to purchase.
What the numbers collectively say about where the market stands is this: the repricing from the 2021 to 2022 peak is largely complete, and the market is operating in a range that is more consistent with its longer-term fundamentals. The $370,000 May median is not a distressed number; it is a rational number for the City of Austin condo and townhome market based on current supply and demand. The question for both buyers and sellers is whether they are making decisions based on that reality or based on what they wish were still true.
The right time to buy or sell a condo in Austin is when it makes sense for your life and your financial situation. If you are a buyer ready to act, the market is offering you meaningful advantages right now. If you are a seller who needs to move, the buyers are there; you just have to price to meet them. Whatever your situation, reach out to Rebecca Jacks and the team at Eleven Oaks Realty. Call or text (512) 827-8323 or email info@11OaksRealty.com.
Questions About the May 2026 Austin Condo Price Report?
Have questions about what the May 2026 Austin Condo Price Report means for your specific situation? We are happy to help. If you are thinking about buying a condo in Austin, our Buyers page has resources to help you understand the process and get started. If you are thinking about selling, our Sellers page walks through what to expect in today’s market.
Reach out to Rebecca Jacks and the team at Eleven Oaks Realty. Call or text (512) 827-8323 or email info@11OaksRealty.com. We have been helping buyers and sellers since 1978 and we are here to help you make the best decision for your situation, whatever that looks like.
Data sources: Realtors Property Resource (RPR), Austin Board of REALTORS MLS, Unlock MLS. All figures are for condominiums and townhomes in the City of Austin. Reported figures reflect May 1, 2026 through May 31, 2026. Some variation between data sources may exist due to differing methodology and timing of data pulls.




Leave a Reply