
Eleven Oaks Realty is proud to present their April 2026 Austin Condo Price Report measuring activity in the Austin condo market. Our April 2026 Austin Condo Price Report covers all condominiums and townhomes in the City of Austin.
April brought a notable shift in momentum for Austin’s condo market. The median sold price edged up 1.3% month over month to $404,306, essentially matching April 2025 levels, while the number of condos sold increased for the second consecutive month to 178, up 11.3% from this time last year. Inventory continued its seasonal climb to 1,639 active listings and 9.81 months of supply, keeping conditions firmly in buyer’s market territory. With new pending contracts holding steady at 201, up 8.6% year over year, and spring activity compressing median days on market from 77 in March to 44 in April, the market is showing early signs of seasonal momentum while remaining structurally favorable for buyers.
All data below covers condominiums and townhomes in the City of Austin. Data is sourced from Realtors Property Resource (RPR) and the Austin Board of REALTORS MLS. Some metrics may vary slightly between sources due to differing methodology; where differences exist, they are noted.
The Austin Condo Market is a Buyer’s Market
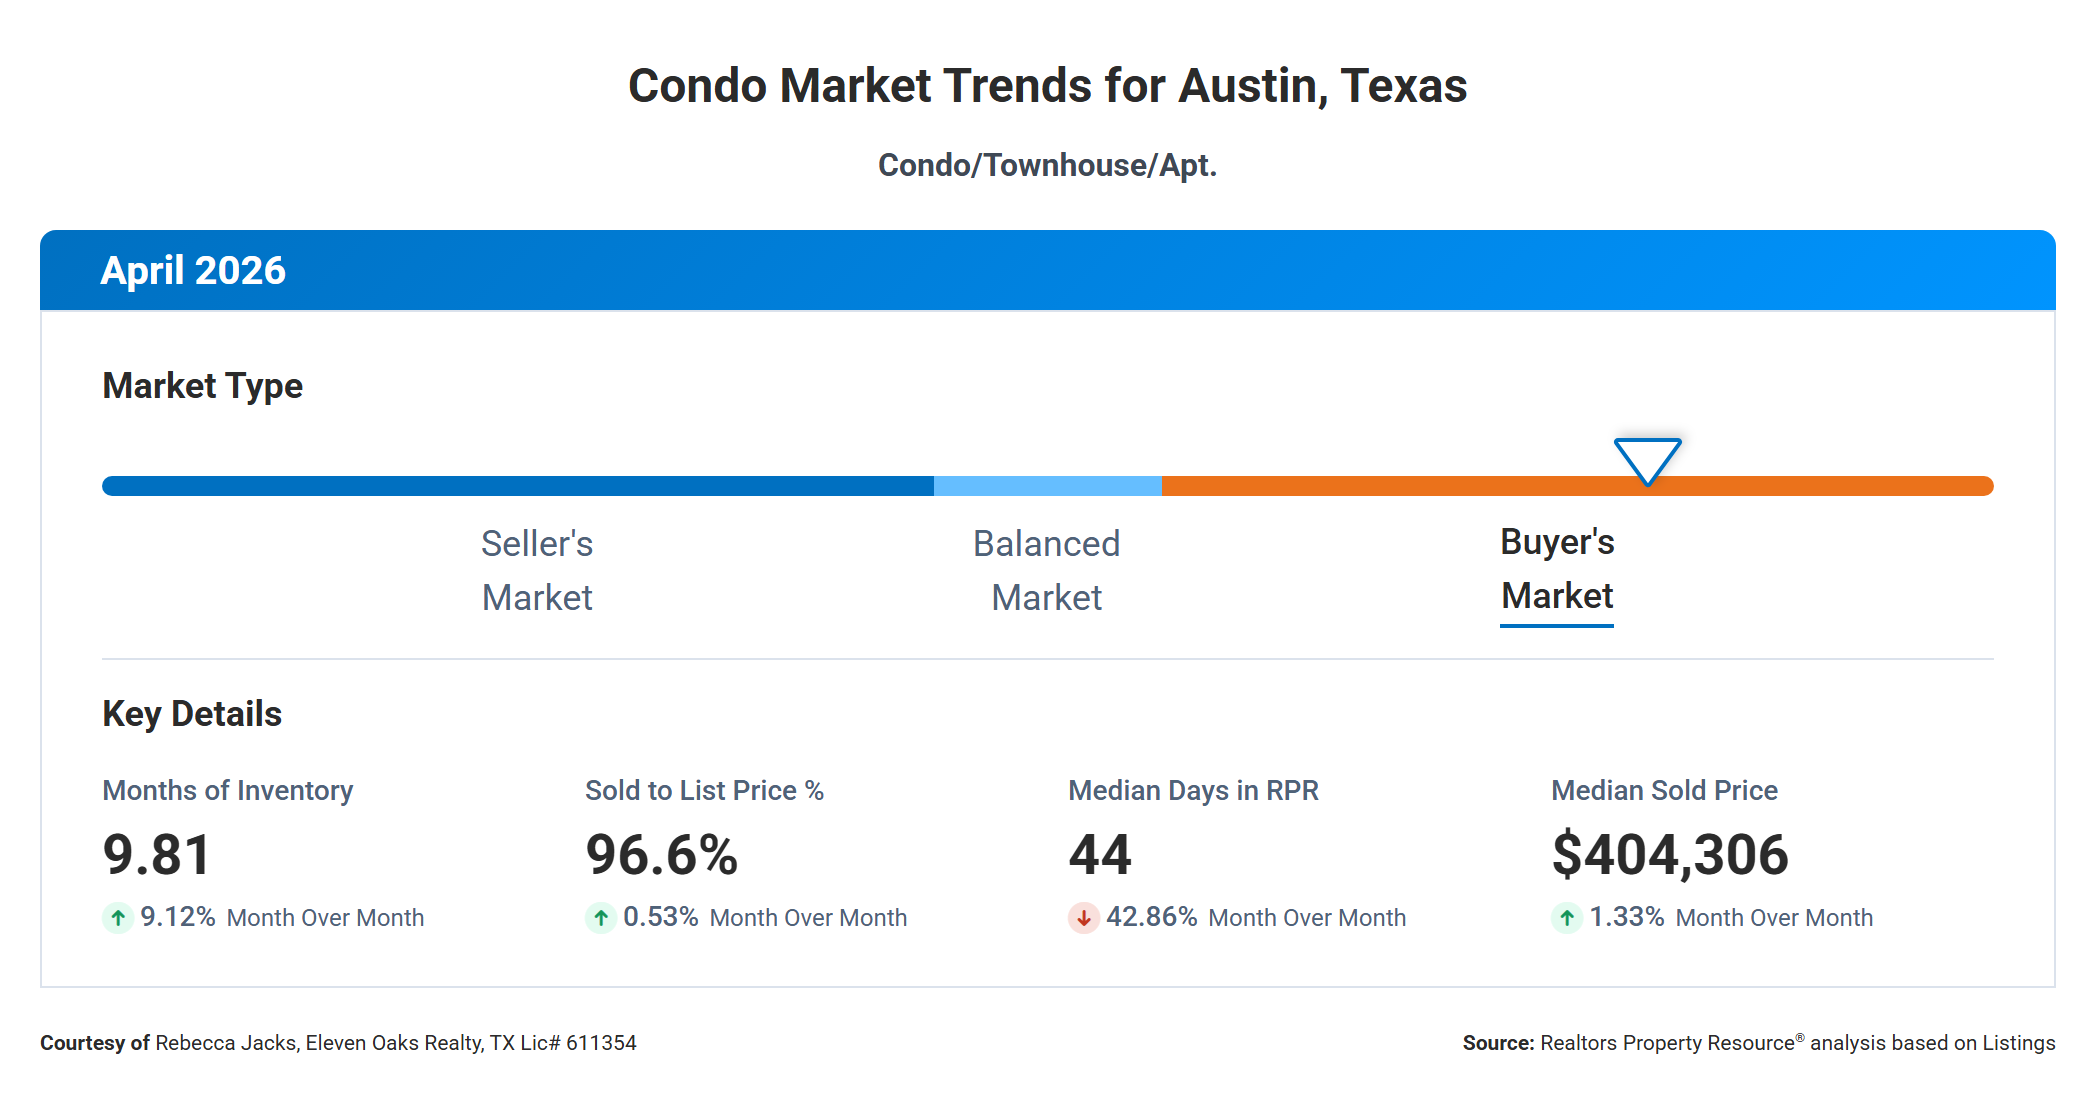
With 9.81 months of supply, Austin’s condo market remains firmly in buyer’s market territory, and has been for well over a year. Anything above roughly six months of inventory generally favors buyers, giving them time to negotiate, compare options, and push back on pricing without fear of losing out to competing offers.
The four key metrics on the Market Trends dashboard tell a nuanced story. Months of inventory increased 9.1% month over month, a significant single-month jump that adds to an already substantial buyer advantage. The sold-to-list price ratio ticked up slightly to 96.6%, up 0.53% from March, suggesting sellers who priced competitively found willing buyers. Median days in RPR fell sharply, dropping 42.9% from 77 days in March to 44 days in April, reflecting seasonal spring activity and a set of well-priced listings closing quickly. Median sold price rose 1.3% month over month to $404,306, a positive sign for sellers who have been navigating a market that spent much of 2025 under pricing pressure.
For buyers, the combination of ample inventory and rising supply is good news. You have choices, time, and room to negotiate. For sellers, the data is more nuanced: while some well-priced condos are moving faster than they were two months ago, the overall market dynamic still favors buyers, and overpriced listings are sitting.
What the Numbers Mean For Buyers
The most direct takeaway from April’s data is that you have more buying power today than at any point in the last several years. With 9.81 months of supply, you are choosing from a large pool of options, and sellers who are motivated understand that competition among buyers is limited. The median sold price came in at $404,306, essentially where it was a year ago, which means prices have not meaningfully recovered from the pullback that began after the 2022 peak. If you have been waiting for prices to stabilize before making a move, the data suggests that stabilization is underway at a level that still offers real value relative to recent years.
Inventory is the central story in April. With 1,639 active listings on the market and months of supply at 9.81, you have more options available now than at virtually any point in the past three years. The $300,000–$399,999 price range carries the most supply at 10.2 months, meaning that is where your negotiating leverage is strongest. The one clear exception is the $700,000–$799,999 range, which has just 5.1 months of supply, meaning competition is meaningfully tighter for condos in that bracket. Understanding where the months of supply sits in your target price range before you start shopping gives you a significant strategic edge.
New pending contracts came in at 201 for the month, flat with March but up 8.6% from April 2025. This uptick in contract activity signals that buyers are beginning to engage more actively as spring gets underway, which could gradually reduce the buyer advantage heading into summer. The data does not yet point to a rapid shift in conditions, but waiting indefinitely carries some risk, particularly if you find the right condo at the right price.
If you are ready to move, the practical approach is clear: get pre-approved before you start shopping, identify your target price range and understand the months of supply there, and use the sharp drop in median days on market as a reminder that the best-priced listings are still moving in 44 days or less. The condos sitting well beyond that mark are the ones that offer the most room to negotiate.
What the Numbers Mean For Sellers
The encouraging signal from April is that condo sales increased month over month. At 178 closed transactions, sales were up 6.6% from March and 11.3% above April 2025. More condos are selling than this time last year, which matters if you are trying to gauge whether buyers are active. They are, just selectively.
The challenge for sellers is pricing discipline. The average seller received 92.99% of their original list price at close, compared to 96.57% of their final (adjusted) list price. That gap reflects sellers who started too high, reduced their price under market pressure, and then closed at a further discount from the reduced price. On a $538,000 original list price, the average seller reduced to approximately $518,000 before going under contract and then closed around $500,000. The full journey from original ask to close cost that seller roughly $38,000, compared to what they would have collected with a well-calibrated initial price and a clean one-step negotiation. Sellers who price at market from day one close faster and at a higher net, and the data backs this up clearly.
New listings came in at 553, down 4.2% from March but up 2.0% from April 2025. You are entering a market with growing inventory, and each new listing is one more option for buyers who already have plenty of choices. Standing out requires hitting the price correctly at launch, not after a reduction. With 46% of all active listings already carrying at least one price drop, the market has clearly communicated what happens when condos come in overpriced.
If your condo is priced correctly, April’s data suggests there is genuine buyer activity ready to respond. Median days on market dropped dramatically to 44 days, and some price ranges are moving faster than others. Working with an agent who understands where the supply-demand balance sits in your price range, and pricing accordingly from day one, is the single biggest lever you control in this market.
Median Sold Price Essentially Unchanged Year Over Year
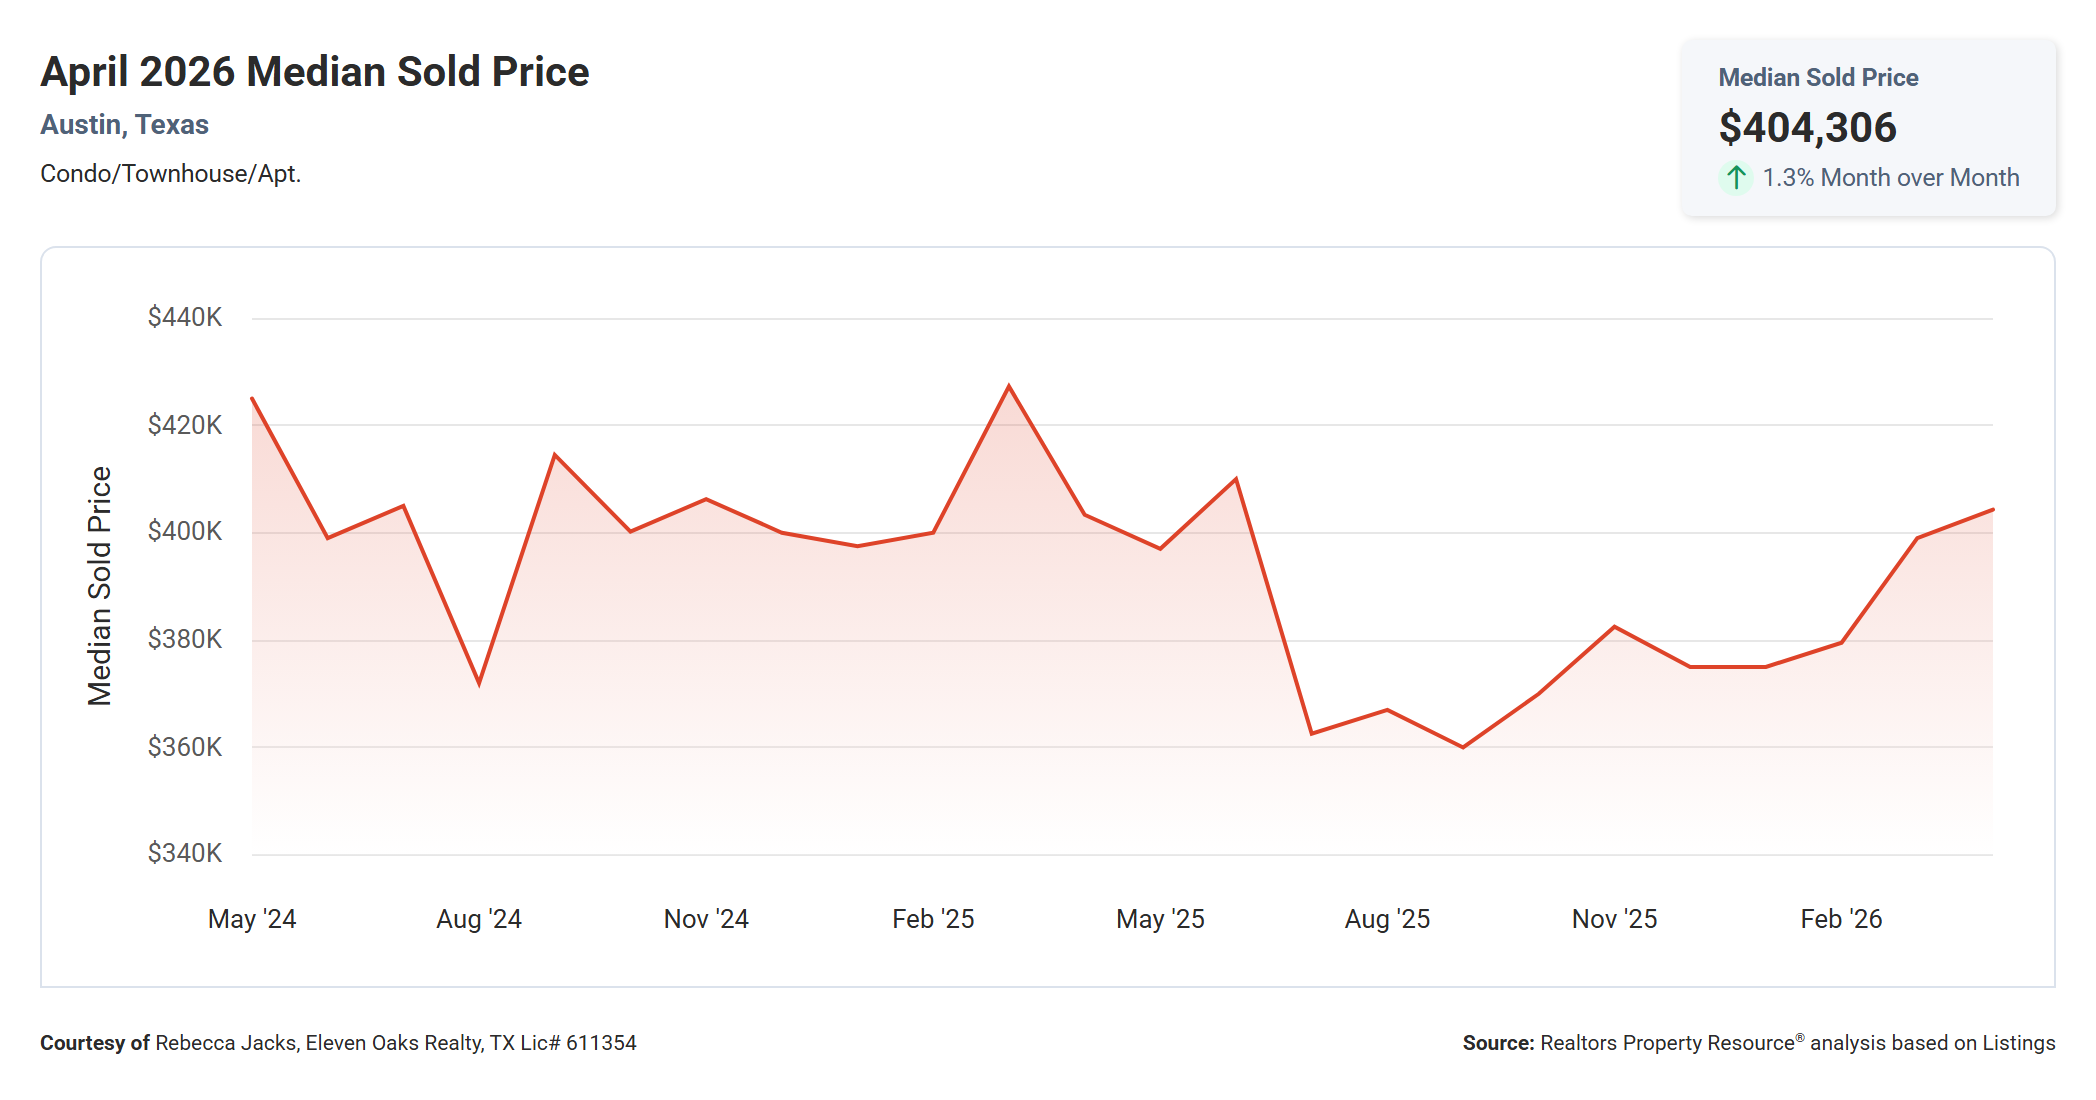
The median sold price for Austin condos in April 2026 came in at $404,306, up 1.3% from March’s $399,000 and essentially flat compared to April 2025’s $403,350.
Looking at the two-year chart, the price trend tells a story of significant volatility followed by gradual stabilization. Prices peaked briefly around $425,000 in early 2025, dropped sharply through the summer and fall to a low near $360,000 by August 2025, and have been recovering steadily since. April’s $404,306 represents the highest point on the chart since that mid-2025 peak, and the recovery from last fall’s trough amounts to a rebound of roughly $44,000 in about eight months.
For buyers, the practical takeaway is that the median condo price appears to have found a floor around $400,000 and is slowly working its way back. You are not buying at the absolute bottom of 2025’s trough, but you are also nowhere near the 2022 peak above $450,000. The current price level offers a reasonable entry point, particularly given the inventory environment. For sellers, flat year-over-year pricing is not the story you would have wanted a few years ago, but after the significant declines of mid-2025, a recovery now underway is a genuinely encouraging signal.
Median Active List Price Down 5.7% Year Over Year
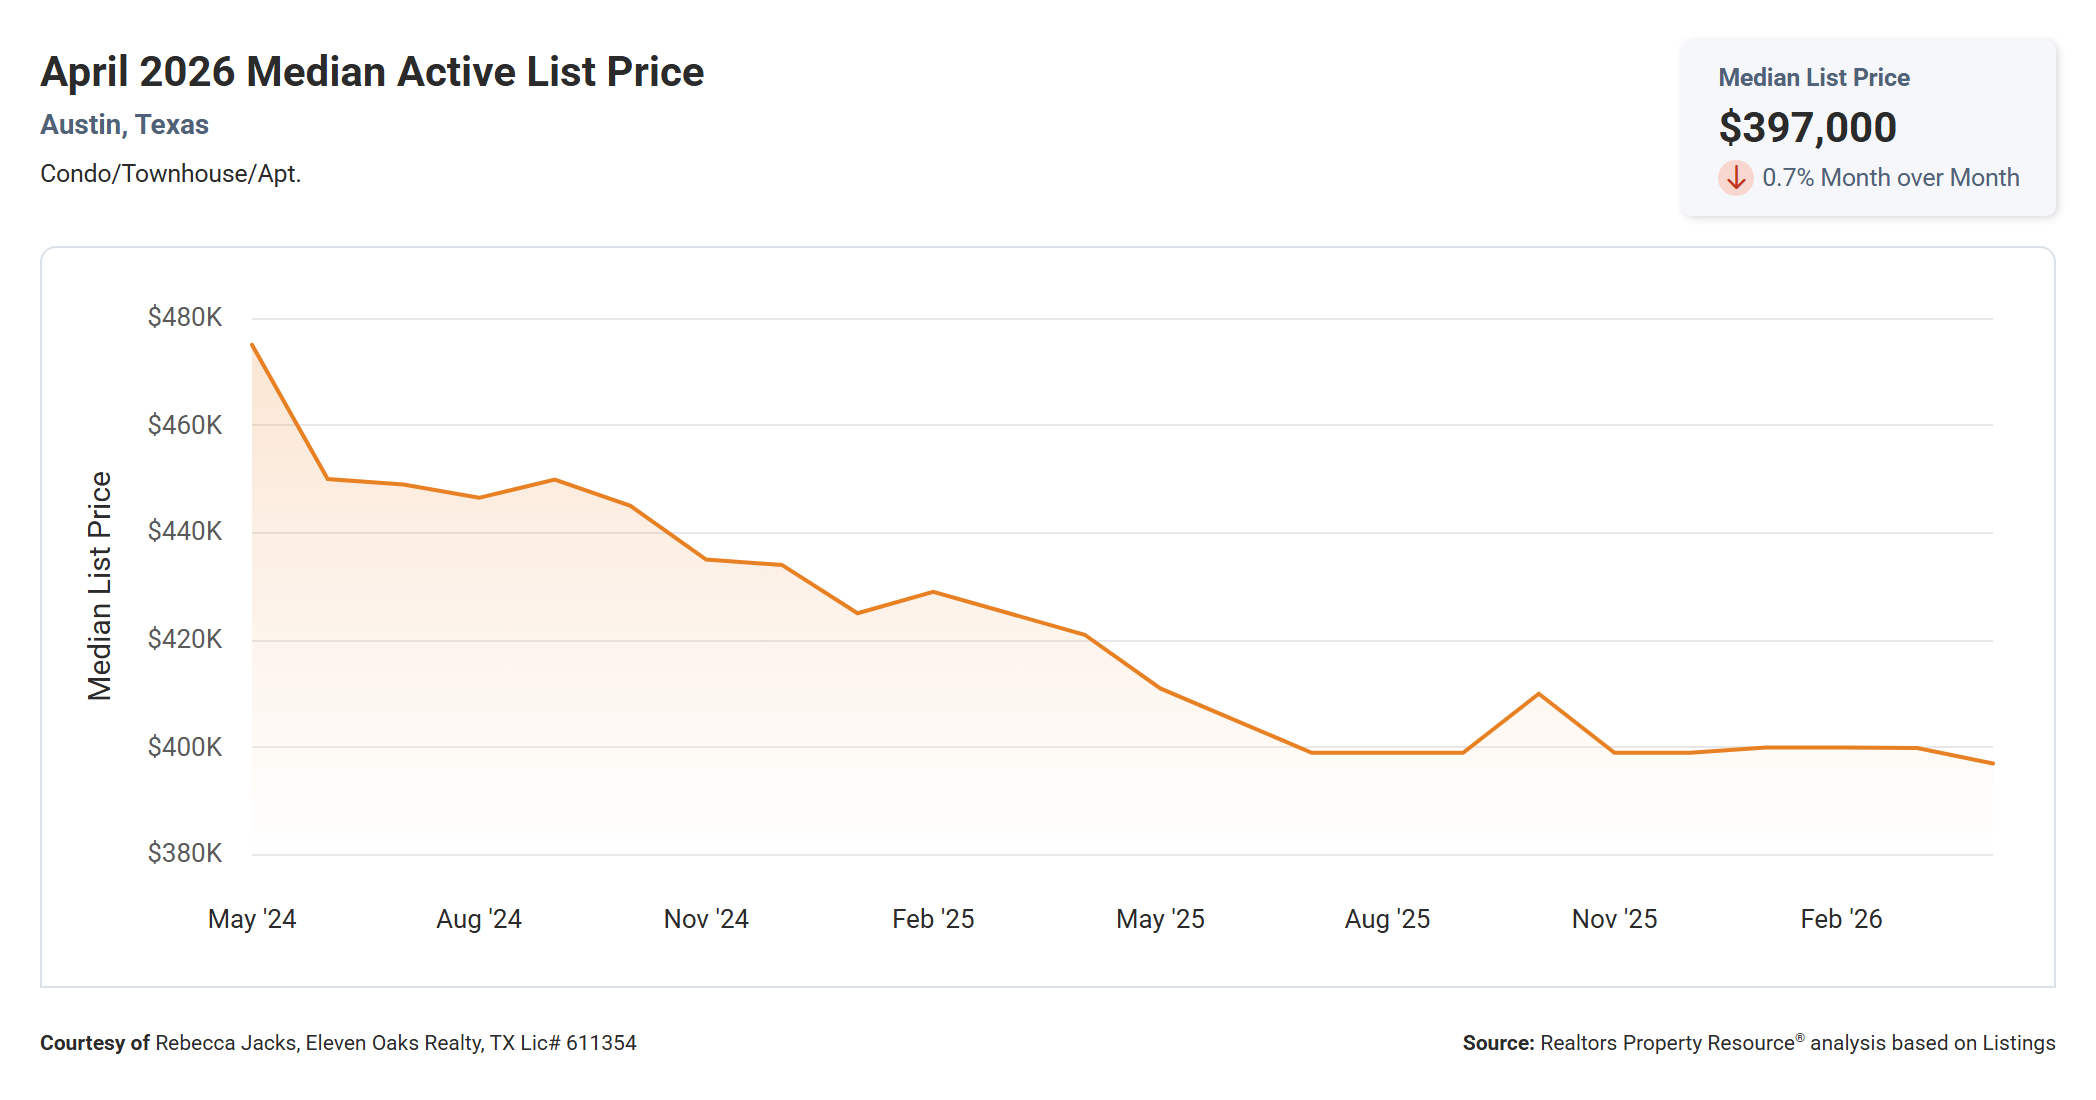
The median active list price for Austin condos in April 2026 was $397,000, down 0.7% from March’s $399,900 and 5.7% below April 2025’s $421,000.
The two-year chart for the active list price is one of the most striking in this month’s report. From a high near $475,000 in May 2024, the median asking price fell almost continuously for nearly two years, settling in the $397,000 range where it appears to have plateaued for the past several months. That is a decline of roughly $78,000 in median asking price, or about 16%, from peak to the current level.
There is an important dynamic visible in April’s data: the median sold price ($404,306) is slightly above the median active list price ($397,000). This reflects a market in which many currently listed condos are priced conservatively or at market, while some of the condos that actually close are newer listings or higher-quality properties that attracted offers. For buyers, this means the inventory you are browsing is generally reasonably priced, not inflated. For sellers, it signals that the era of aspirational list prices well above market is largely over, and pricing at or near comparable sales is where the market has moved.
Median Price Per Square Foot Down 7.2% Year Over Year
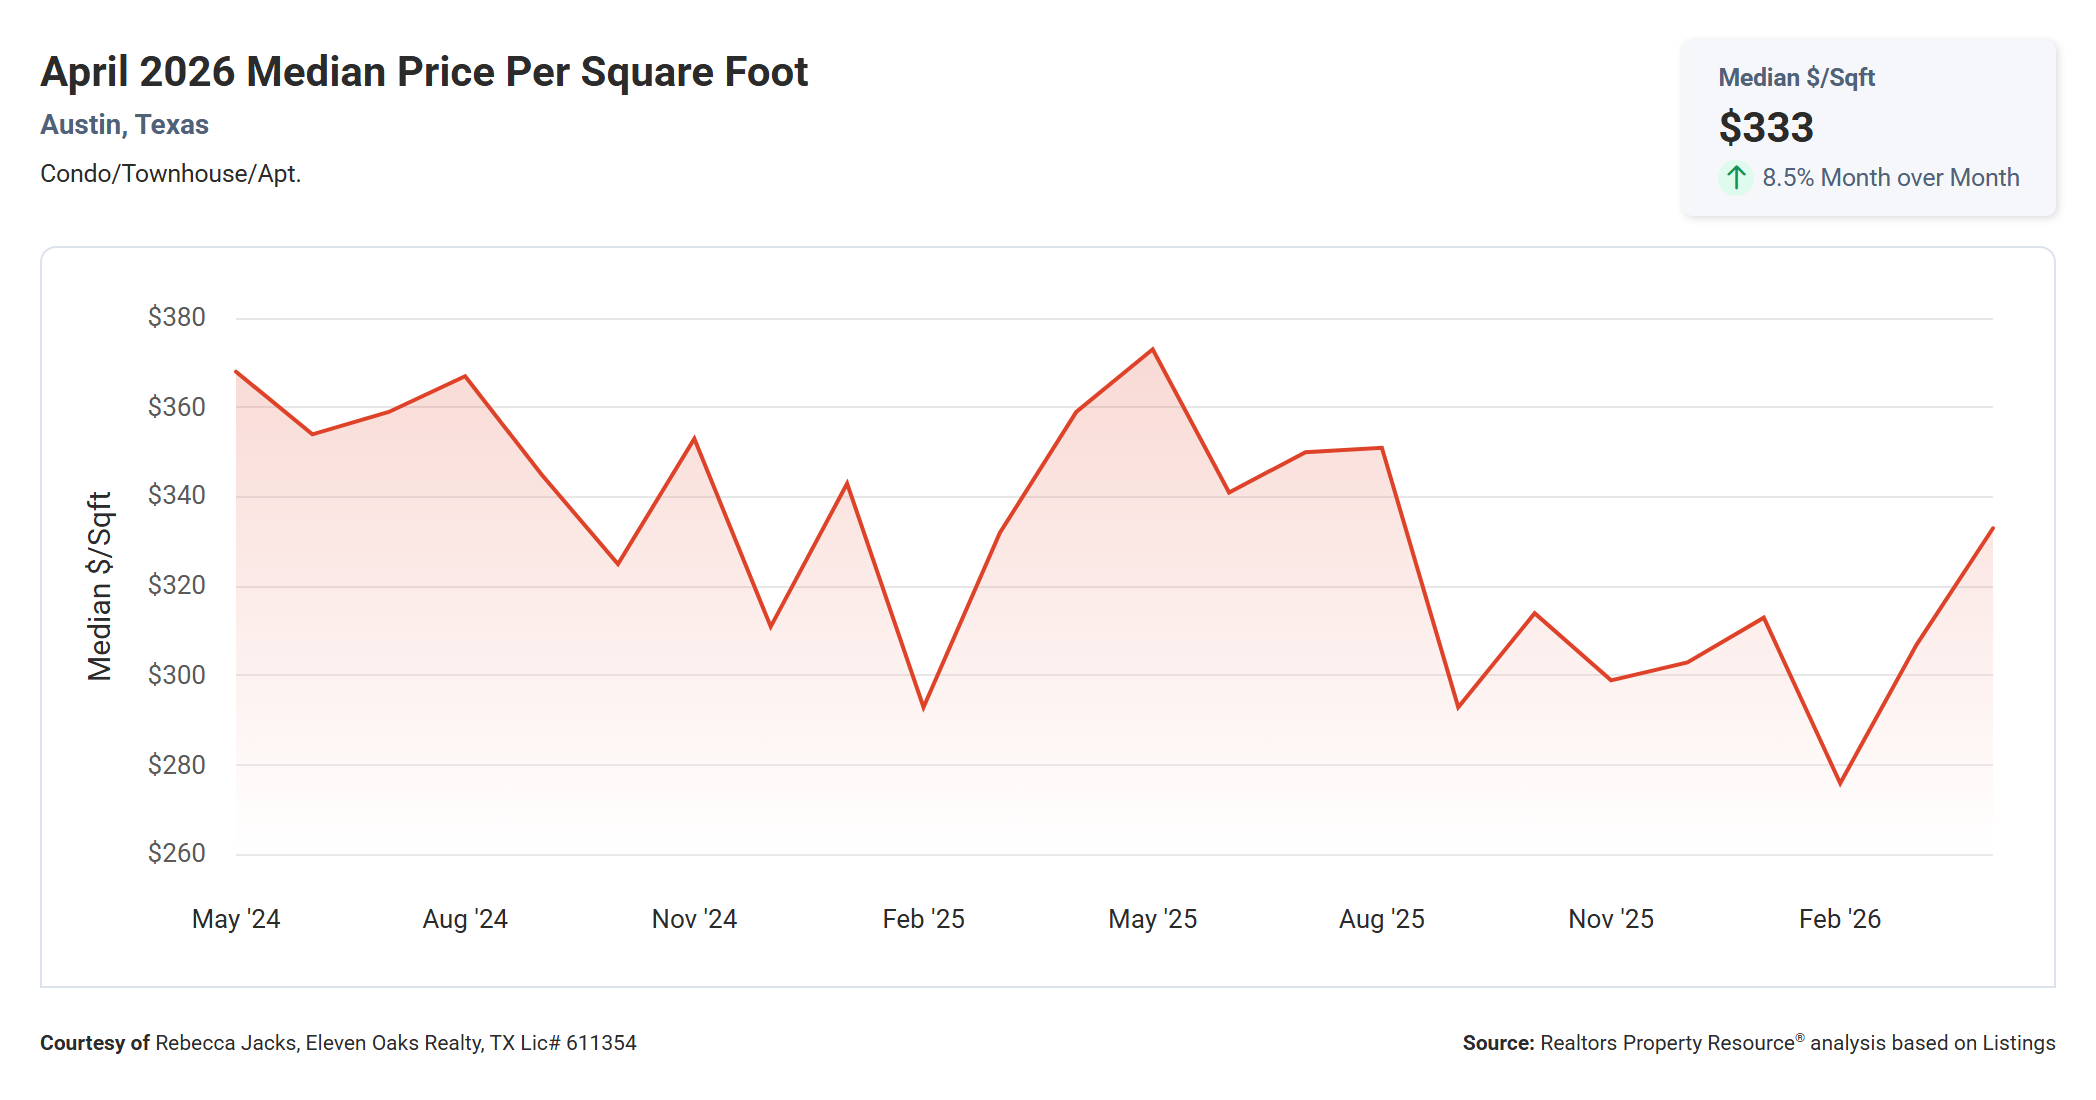
The median price per square foot for Austin condos in April 2026 was $333, up 8.5% from March’s $307 and down 7.2% from April 2025’s $359.
The monthly swing here is notable. Going from $307 in March to $333 in April, an 8.5% jump, reflects the mix of unit types and sizes that closed in April versus March rather than a fundamental shift in market pricing. The two-year chart shows significant month-to-month volatility in this metric, with readings ranging from as low as $275 to as high as $375 over the past two years. The current level of $333 sits roughly in the middle of that range.
Year over year, the $26 drop per square foot from $359 to $333 is meaningful in dollar terms. On a 1,250-square-foot condo (the April median size), that translates to roughly $32,500 less in closing price compared to what buyers were paying for the same space a year ago. For buyers, that embedded savings is real. For sellers, understanding that the price-per-square-foot metric has compressed over the past year is important context for calibrating your expectations on what your condo can reasonably command today.
Average Sold to List Price Essentially Unchanged Year Over Year
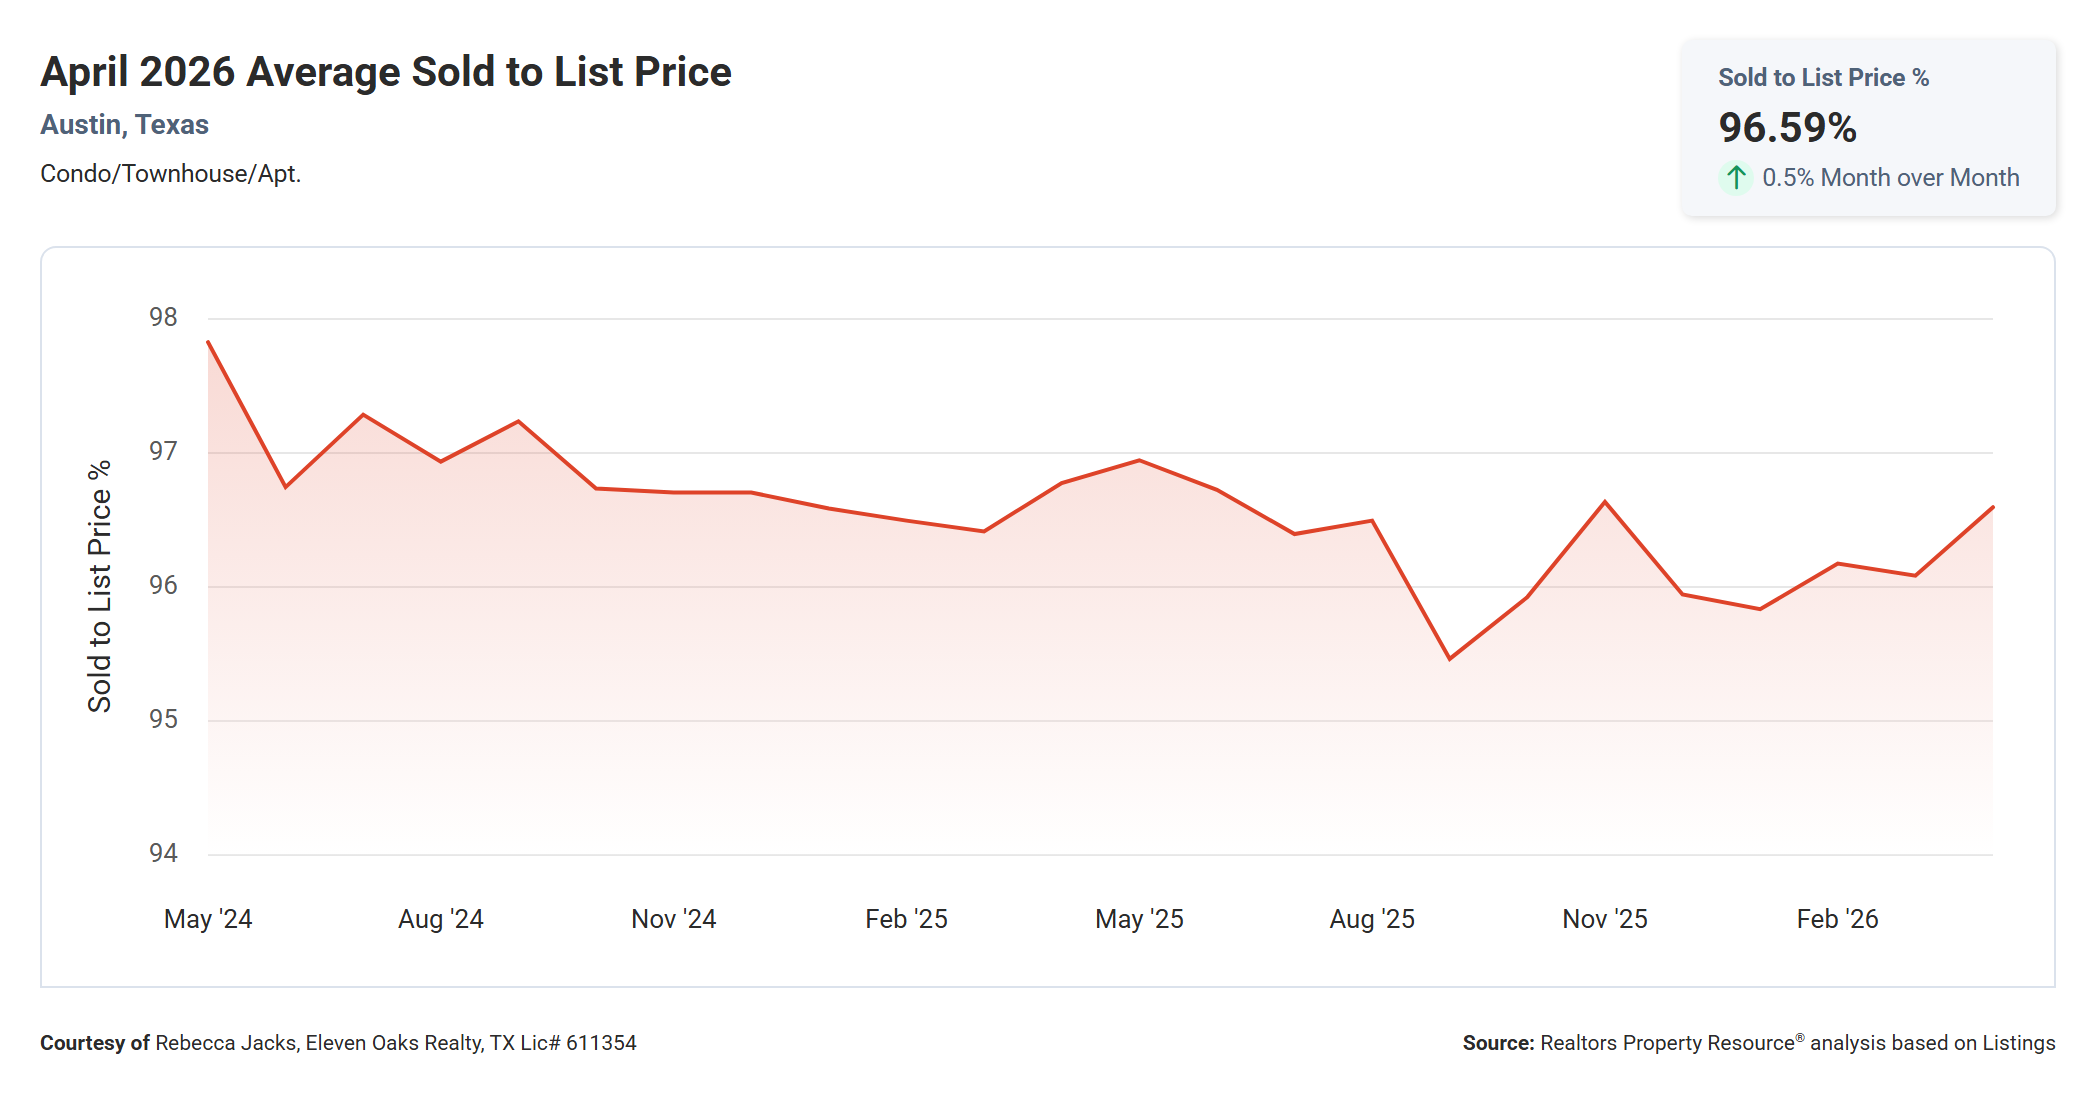
The average sold to list price ratio for Austin condos in April 2026 was 96.59%, up 0.5% from March’s 96.08% and essentially unchanged from April 2025’s 96.77%.
The two-year chart shows a remarkably consistent pattern: the sold-to-list ratio has hovered in the 95.5% to 97.5% range for the entirety of the period shown, with no dramatic spikes or collapses. The narrow range tells you that once a condo reaches its final listed price, buyers and sellers typically settle within about 3.5% of that number. What the chart does not show, but what the CP/OLP% data does reveal, is how much sellers reduce their price before that final list price is ever established.
April’s 96.59% means the average condo sold for about $17,000 less than its final list price on a $500,000 condo. That is modest but real. If you are a buyer, you can reasonably expect to negotiate a few points below list on most condos. If you are a seller, pricing accurately at launch rather than planning to negotiate down from an inflated starting point preserves value at every step of the process.
Median Time to Sell Up 15.8% Year Over Year
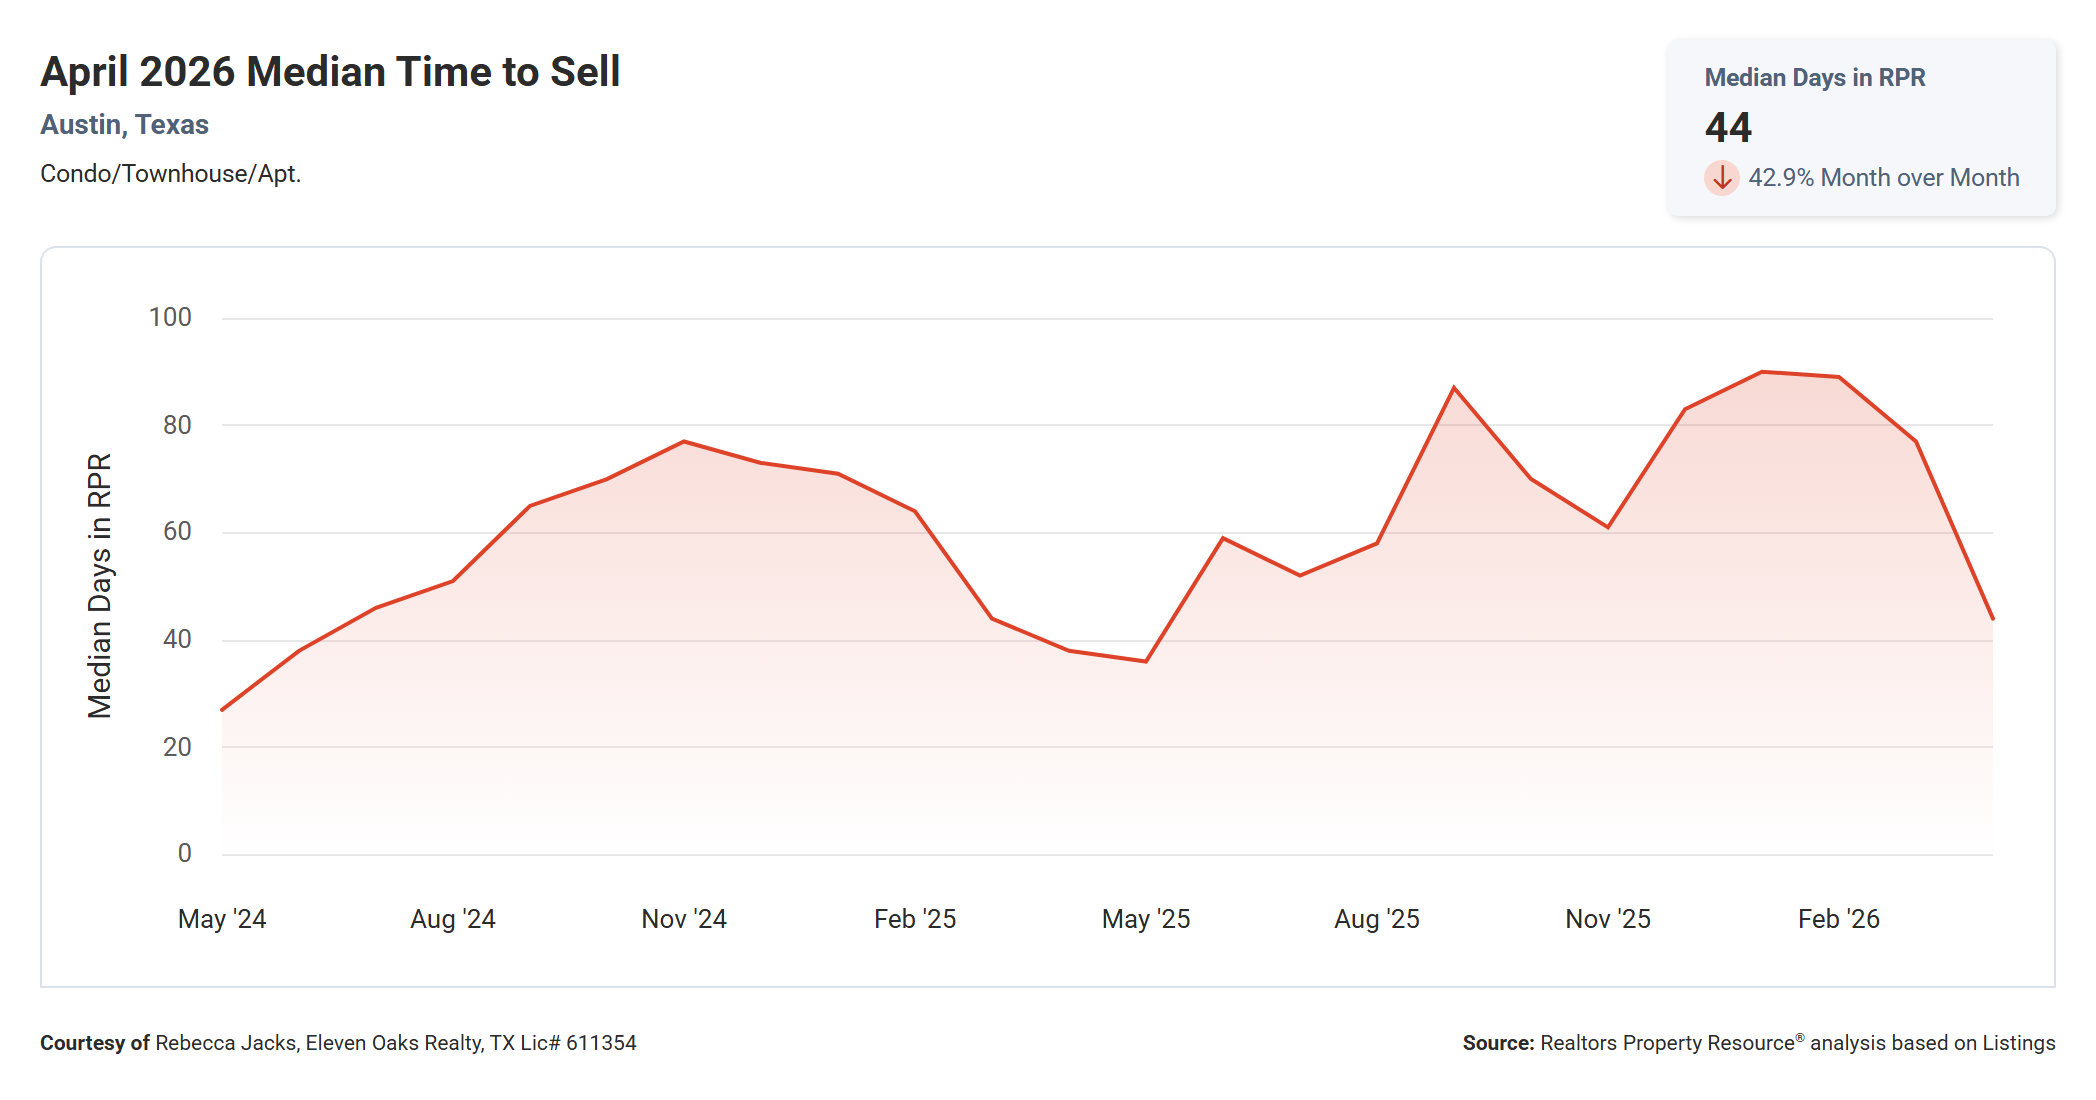
The median time to sell for Austin condos in April 2026 was 44 days, down 42.9% from March’s 77 days and up 15.8% from April 2025’s 38 days.
The month-over-month drop from 77 to 44 days is the most dramatic single-month change in this report and is almost certainly driven by seasonal patterns. Spring is historically when condo sales accelerate, and buyers who were waiting out the slower winter months stepped back into the market during April. The two-year chart confirms this seasonal rhythm clearly, with days on market typically compressing in the spring before expanding again by late summer and into fall.
Year over year, condos are still taking about six more days to sell than they did in April 2025. That gap is moderate rather than dramatic, but it does confirm that this is not quite the same level of activity as last year’s spring market. For sellers, 44 days is a reasonable planning benchmark, with the caveat that well-priced condos in active price ranges are moving considerably faster. For buyers, 44 median days on market means you generally have time to be deliberate, research comparable sales, and make an informed offer without feeling rushed.
Months Supply of Inventory Up 1.1% Year Over Year
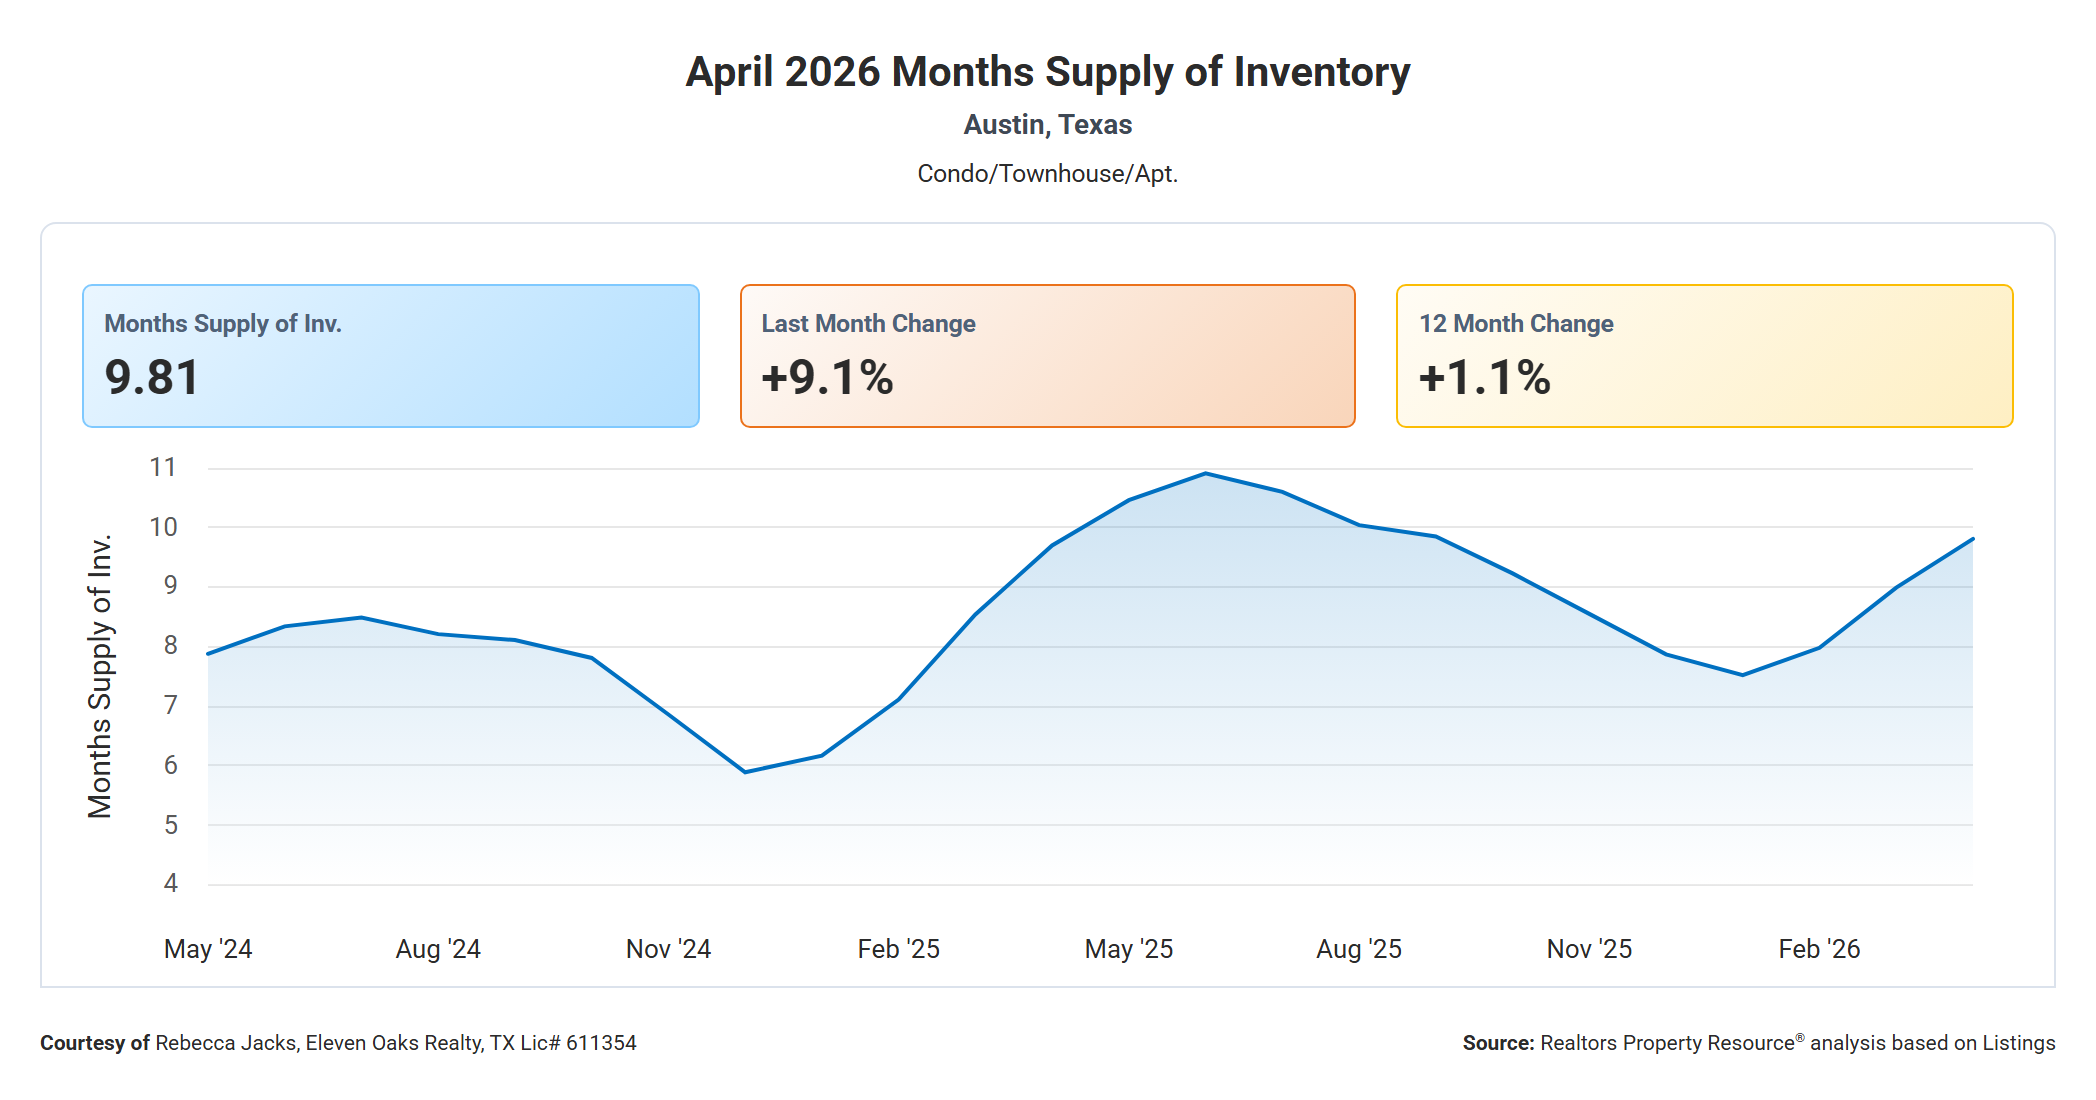
The months supply of inventory for Austin condos in April 2026 was 9.81, up 9.1% from March’s 8.99 and up 1.1% from April 2025’s 9.7.
At 9.81 months, the Austin condo market carries roughly two and a half times the inventory that would be needed to shift to a seller’s market, and about 63% more than what a balanced market would require. The chart shows that months of supply has been elevated and largely rising since mid-2024, spending most of the past year in the 8 to 11 month range. The current reading of 9.81 is near the upper end of that range.
The year-over-year change of just 1.1% suggests the inventory overhang is not dramatically worsening, but it is also not meaningfully improving. Supply is running roughly parallel to where it was a year ago, with slightly more inventory per transaction. For buyers, this means the favorable conditions that have characterized the market since late 2024 are still firmly in place. For sellers, it means planning for a longer marketing period than you might expect if you last sold during the 2021–2022 peak, and pricing discipline remains the most important variable you can control.
Active Listings Up 4.4% Year Over Year
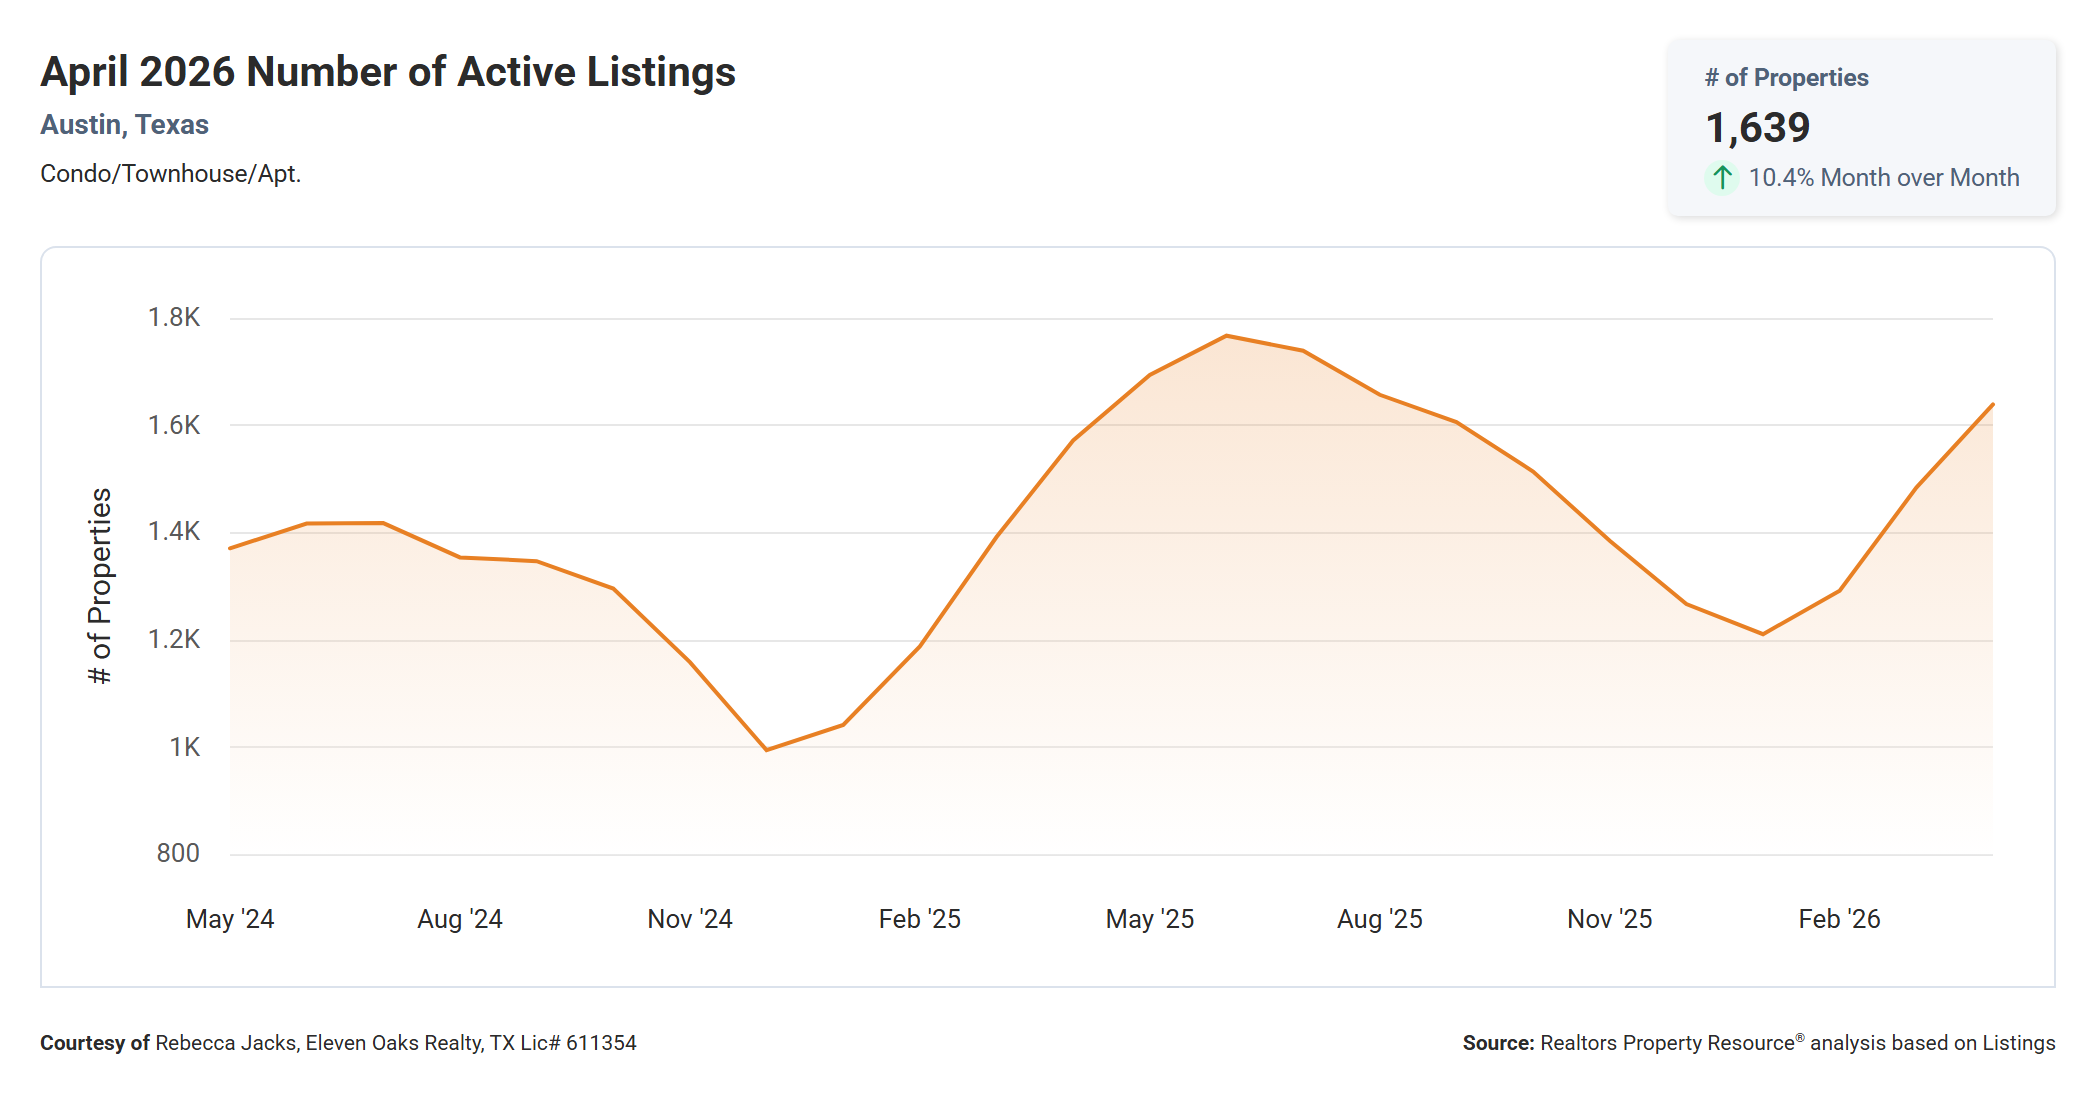
The number of active condo listings in Austin in April 2026 was 1,639, up 10.4% from March’s 1,484 and up 4.4% from April 2025’s 1,570.
The two-year chart shows a clear seasonal and cyclical pattern in active listings. The current level of 1,639 is well above the November 2024 trough of just over 1,000 listings but still meaningfully below the mid-2025 peak near 1,760. The steady climb from January 2026’s low of around 1,220 to April’s 1,639 represents a 34% increase in available inventory in just four months, confirming that spring is actively replenishing the supply that thinned out over the winter.
The 4.4% year-over-year increase is moderate and suggests inventory is growing but not exploding relative to last year’s already elevated levels. For buyers, more listings mean more options and generally more seller motivation. For sellers, more competition means that presentation, pricing, and strategic marketing matter more than they did in lower-inventory environments. Understanding your direct competition in your price range and positioning your condo to stand out is essential when buyers are choosing from 1,639 options.
New Listings Up 2.0% Year Over Year
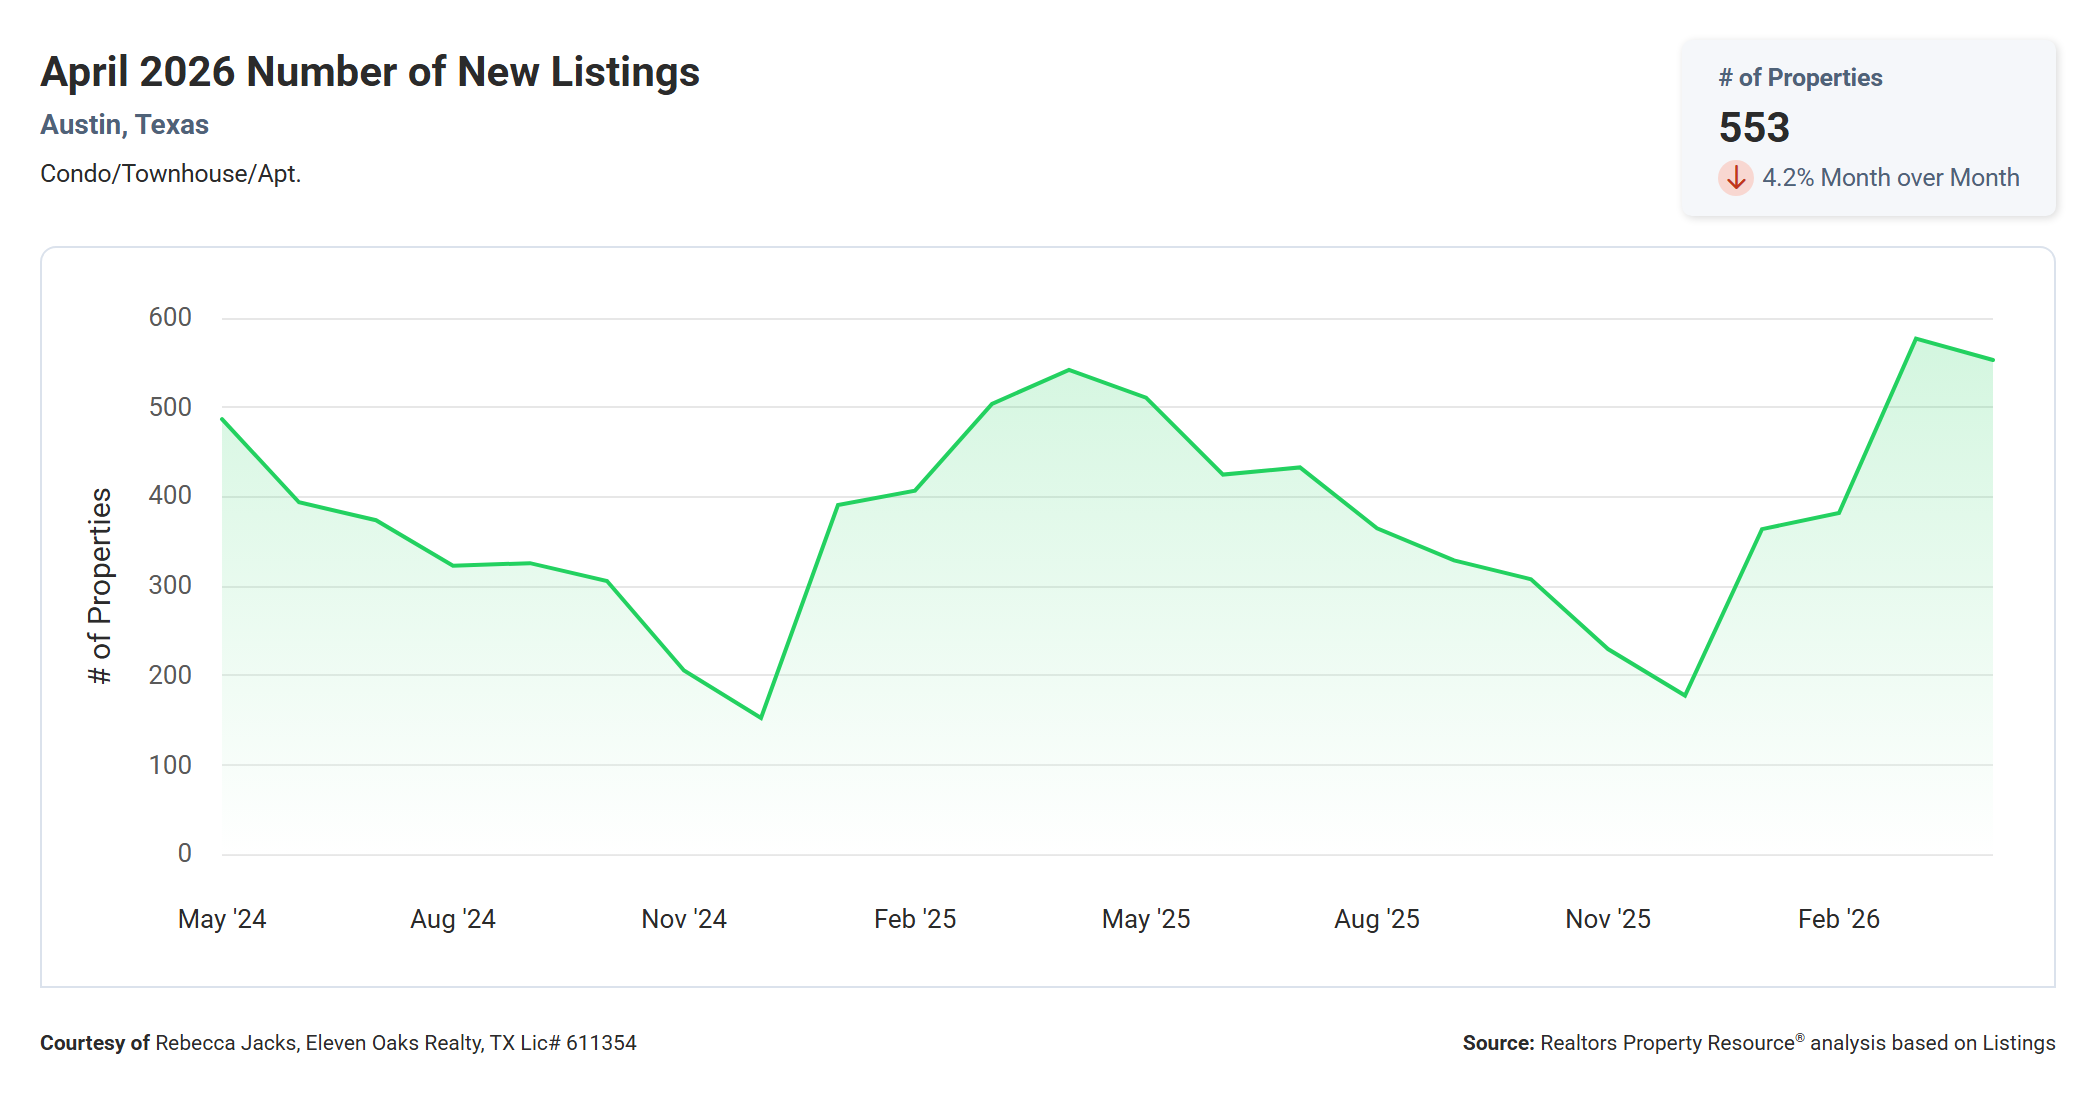
New listings of Austin condos in April 2026 came in at 553, down 4.2% from March’s 577 but up 2.0% from April 2025’s 542.
The two-year chart shows significant month-to-month volatility in new listings, ranging from a low of roughly 155 in December 2024 to highs near 580 in the strong spring months. April’s 553 represents a robust supply input on a seasonal basis, consistent with the spring surge that typically runs from February through May. The visual contrast between winter and spring listing activity is dramatic, and April’s reading confirms that sellers are actively entering the market.
The modest 2.0% year-over-year increase suggests that supply is essentially keeping pace with last year, which was already an elevated supply environment. For buyers, the steady flow of new listings every month means you should monitor new inventory regularly, because fresh listings often represent better opportunities than condos that have been sitting for months with multiple price reductions. For sellers, 553 new listings in a single month means the competition from other sellers is real, and condos that enter the market with a compelling price attract a disproportionate share of buyer attention.
New Pending Listings Up 8.6% Year Over Year
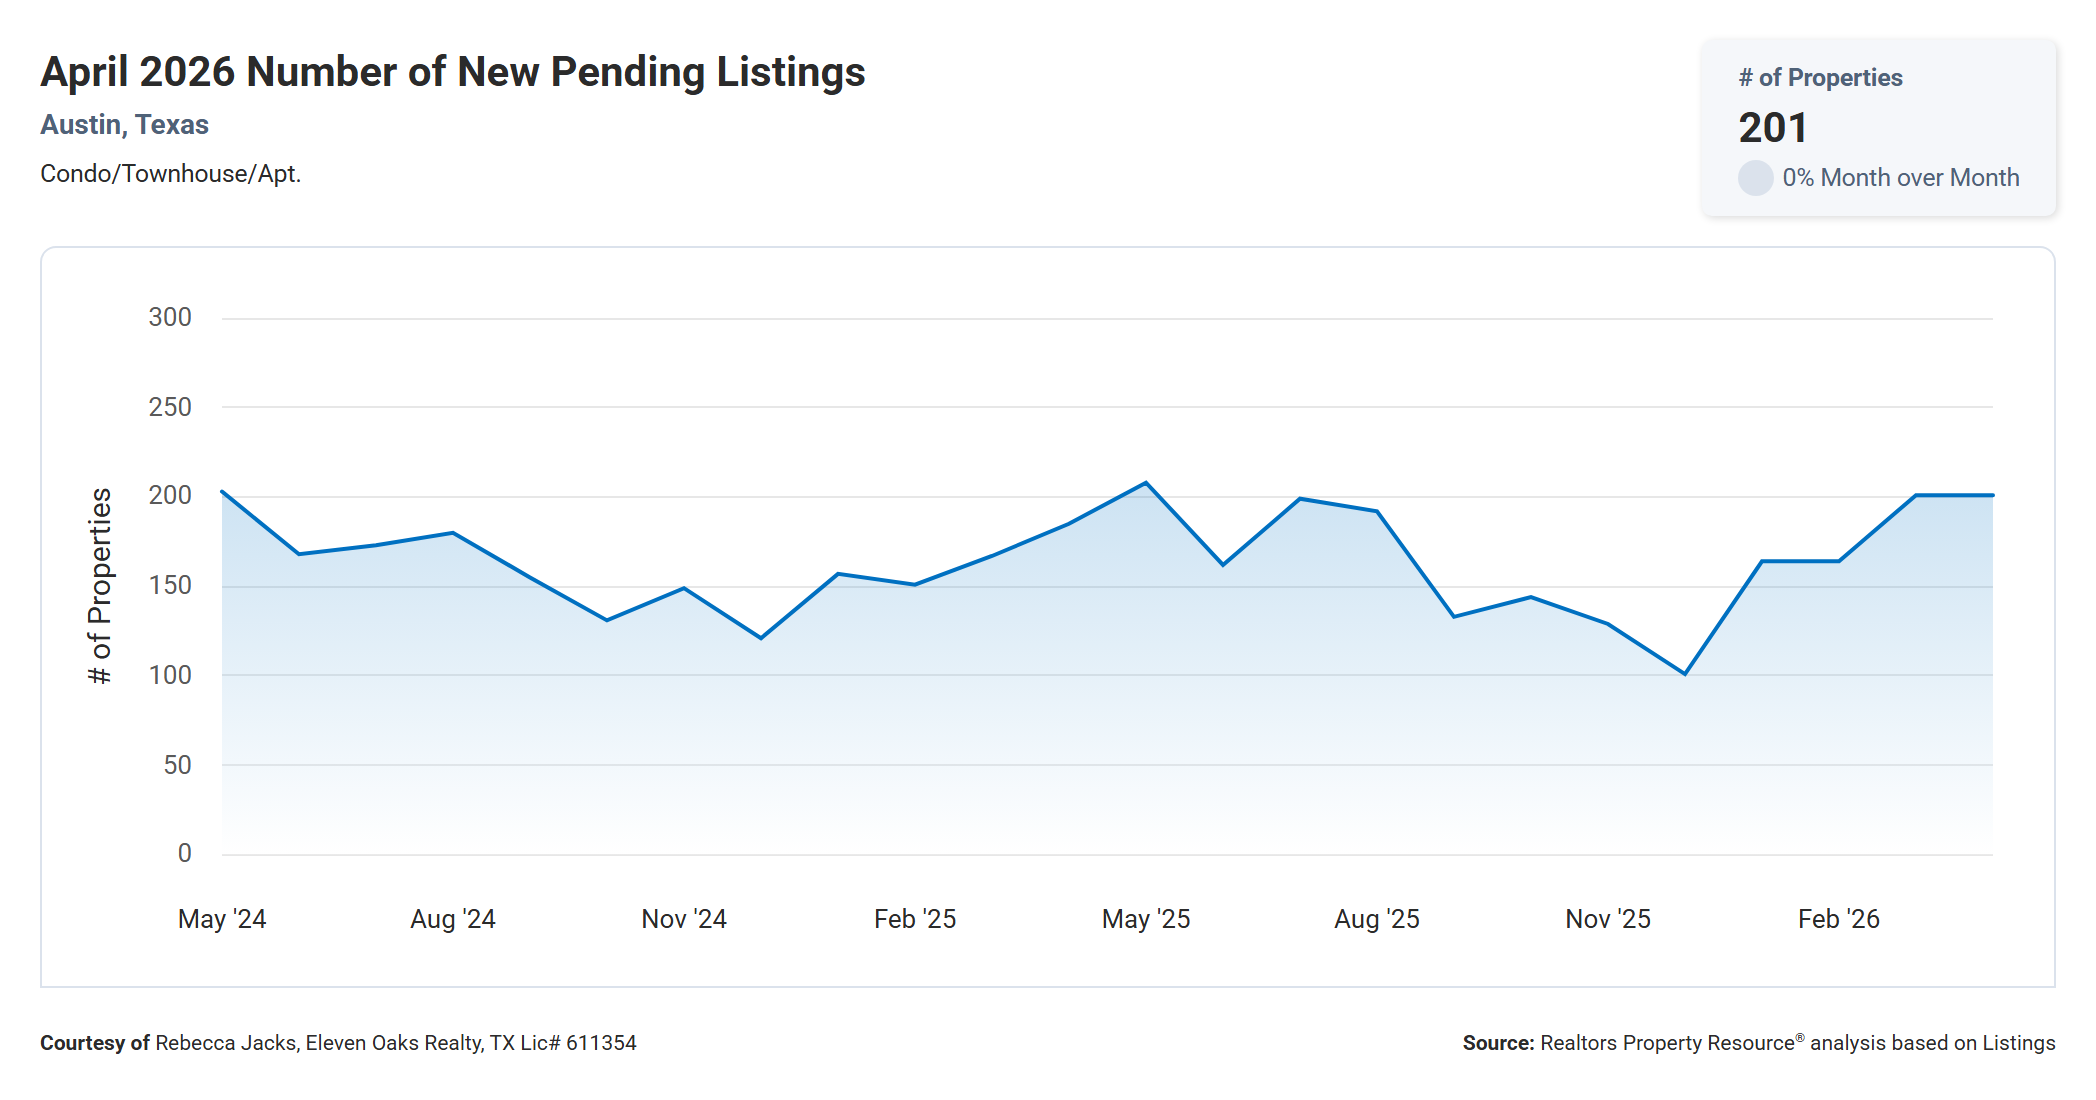
New pending listings for Austin condos in April 2026 came in at 201, flat month over month with March’s 201 and up 8.6% from April 2025’s 185.
The fact that pending contracts held exactly flat month over month while active listings and new supply both rose is worth noting. It suggests that buyer demand is growing, but doing so at a slower pace than incoming supply. The two-year chart shows that pendings have generally ranged between 100 and 210 over the period shown, with the current 201 sitting near the upper end of that range. Comparing to the worst stretches of late 2025, when pendings dipped near 100 to 130, April’s 201 represents genuine improvement.
The 8.6% year-over-year gain in pending contracts is the most encouraging demand signal in this month’s report. More buyers went under contract in April 2026 than in April 2025, which suggests the floor in activity is behind us and demand is cautiously building. For sellers, pending activity is the leading indicator most worth watching because it predicts next month’s closed transactions. For buyers, the uptick in pendings is a reminder that waiting indefinitely is not without risk, particularly if the right condo at the right price presents itself.
Condos Sold Up 11.3% Year Over Year
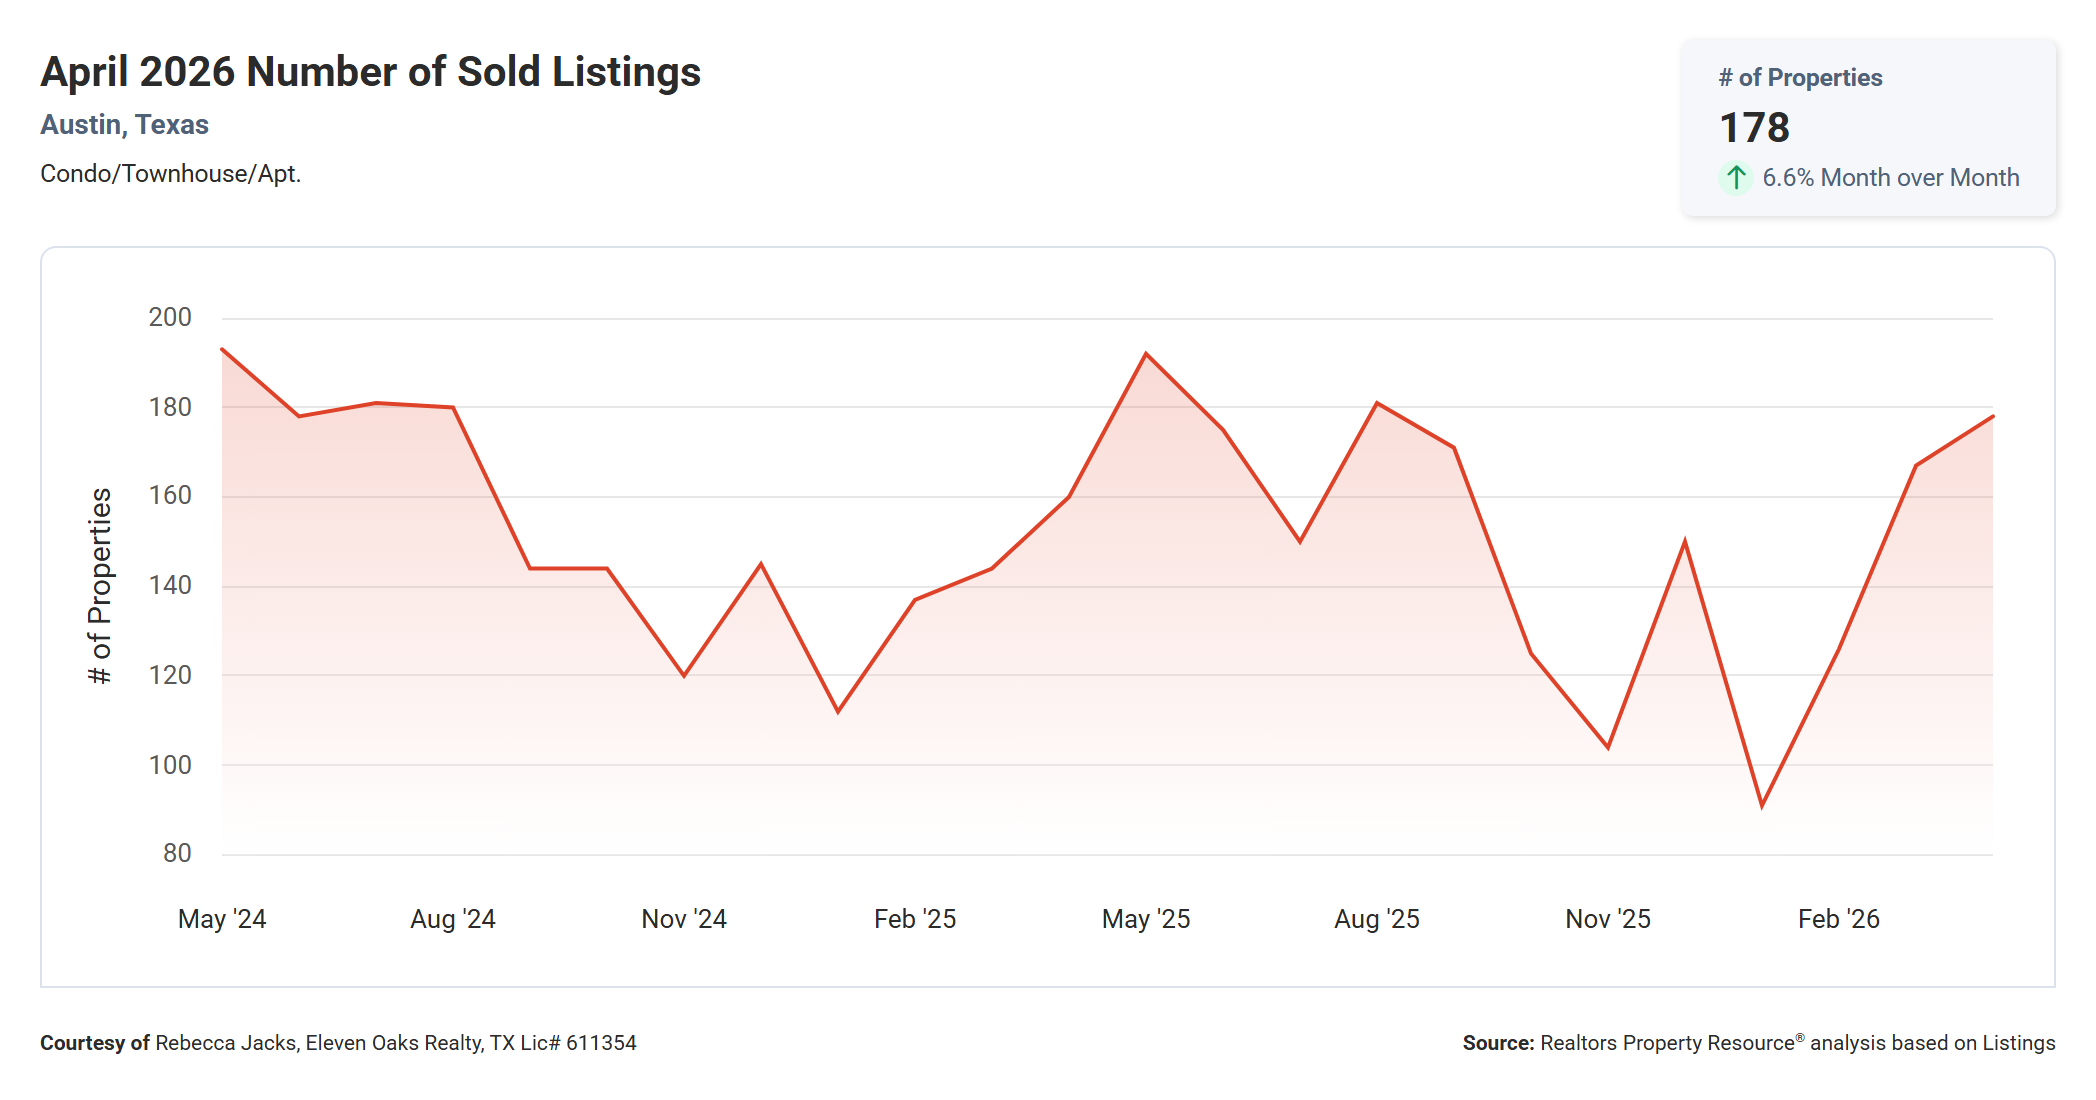
Austin saw 178 condos sold in April 2026, up 6.6% from March’s 167 and up 11.3% from April 2025’s 160.
The two-year chart shows a clear seasonal rhythm in closed sales, with peaks in spring and early summer and troughs in the winter months. April’s 178 represents one of the stronger months over the past year, nearly matching the highs seen in May through August 2025. The deep low of roughly 92 sales in February 2026 now appears to be a winter trough rather than a structural decline, with the sharp acceleration from February through April suggesting the spring buying season is well underway.
Year over year, 11.3% more condos sold in April 2026 than in April 2025. This is a meaningful increase in transaction volume and one of the most encouraging signals in this report. Note that the Austin Board of REALTORS MLS shows 187 closed transactions for April 2026, a slightly higher count than the 178 shown in RPR, reflecting differences in data methodology between the two sources. Both figures point in the same direction: more condos are selling this spring than last spring.
Total Sales Volume Up 4.4% Year Over Year
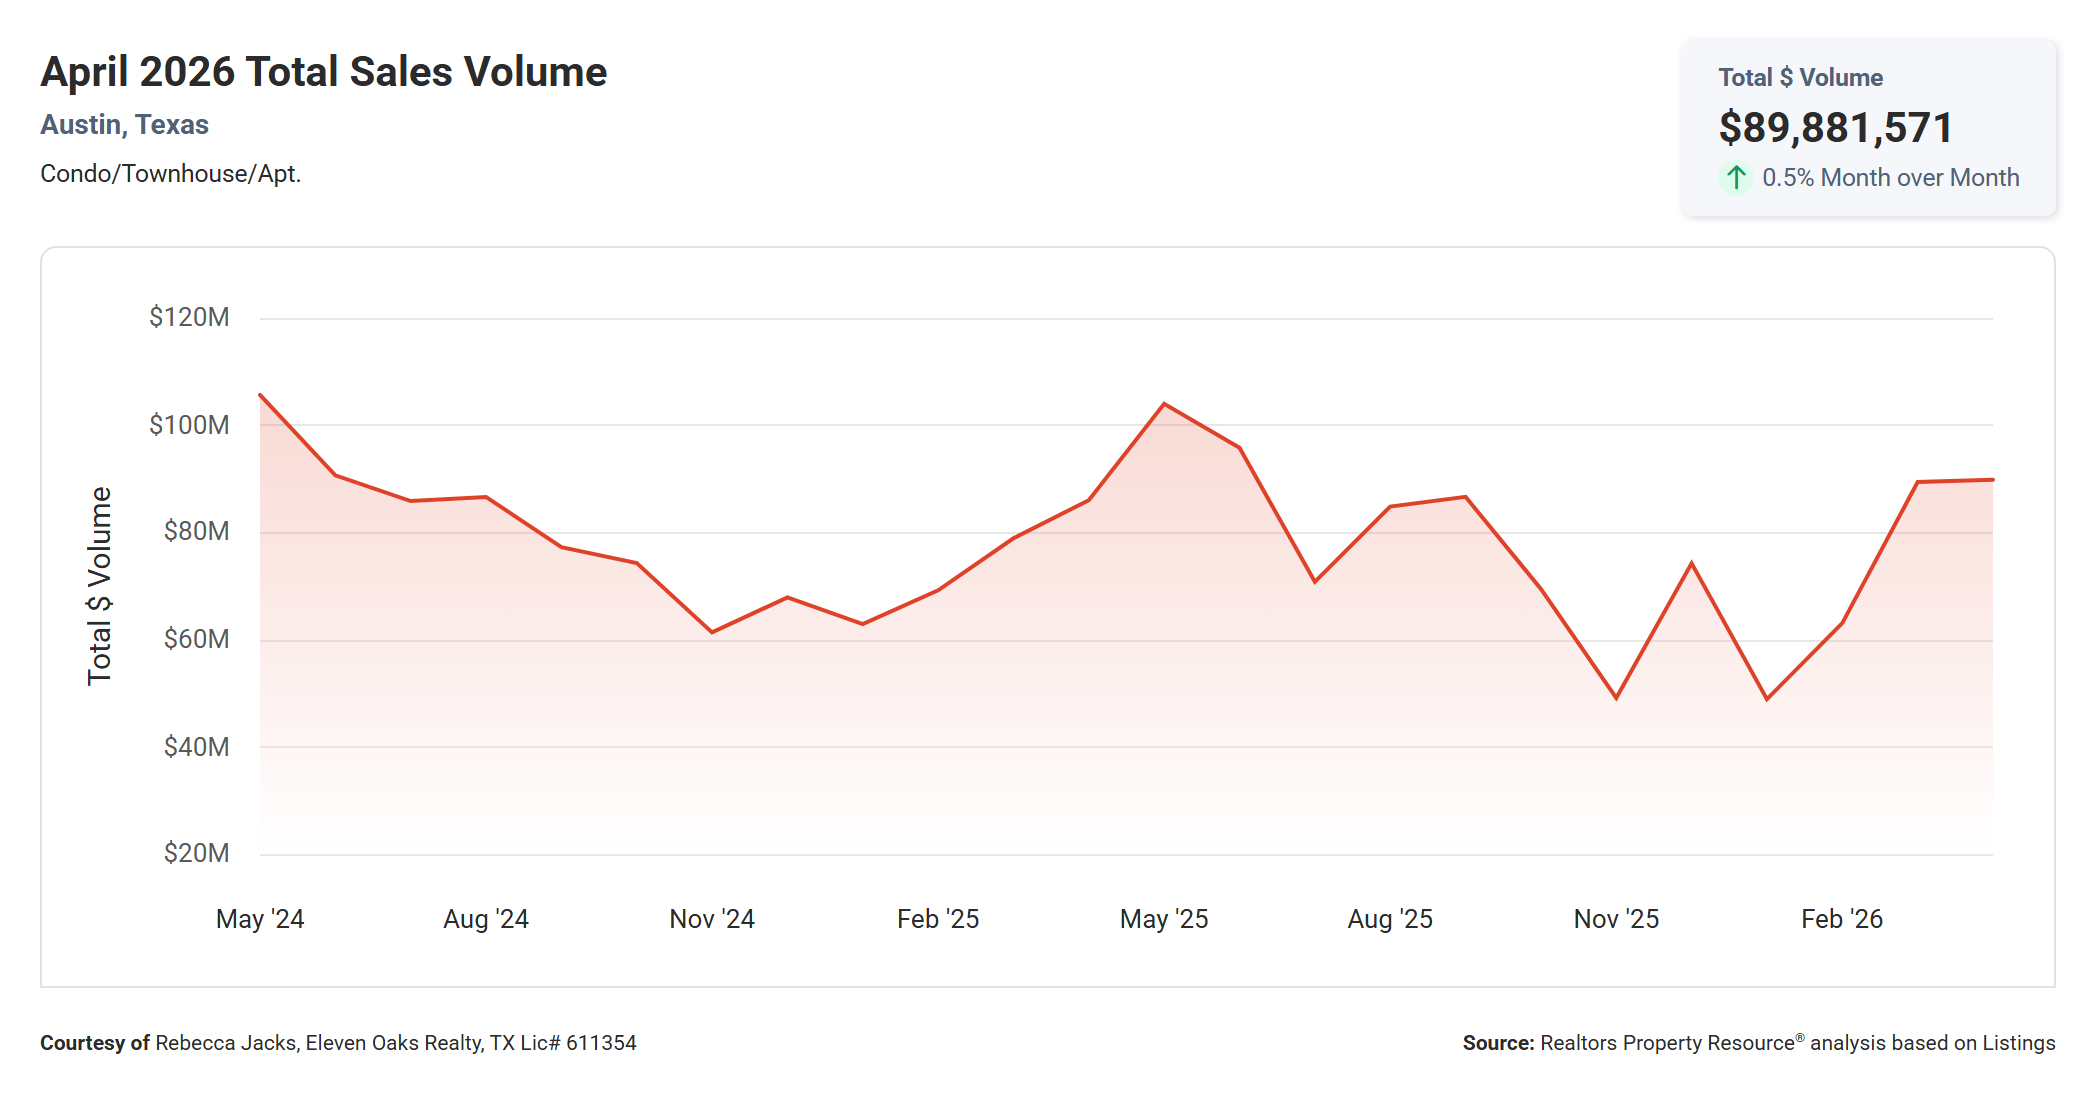
Total sales volume for Austin condos in April 2026 came in at $89,881,571 per RPR, up 0.5% from March’s $89.44 million and up 4.4% from April 2025’s $86.06 million. Unlock MLS reports the April 2026 volume at $91,181,571, reflecting slightly different transaction counts between sources.
The two-year chart shows total volume has been climbing steadily since the winter trough, recovering from a low near $50 million in February 2026 to nearly $90 million in April. The recovery mirrors the seasonal pattern visible in closed transaction counts, with volume building through spring as more condos close at higher price points.
The 4.4% year-over-year increase in total volume reflects both more transactions and stable pricing. With 11.3% more condos sold at a median price that is essentially flat, volume grew modestly. That math is consistent with a market where activity is recovering but prices have not yet moved meaningfully higher. For context, April 2026’s volume remains roughly 14% below the peak months seen in May and June 2025, suggesting there is still meaningful room for volume to recover further if demand strengthens through the summer.
April 2026 Austin Condo by the Numbers
The table below is pulled directly from the Austin Board of REALTORS MLS statistics for April 2026 and covers 187 closed condominium and townhome transactions in the City of Austin.
| Min | Max | Avg | Median | |
|---|---|---|---|---|
| Beds | 1 | 4 | 2 | 2 |
| Baths | 1 | 4 | 2 | 2 |
| Sq Ft | 465 | 3,316 | 1,362 | 1,250 |
| Lot Sq Ft | -- | 172,715 | 6,889 | 2,858 |
| List Price | $109,900 | $2,481,000 | $519,714 | $415,000 |
| LP/Sq Ft | $146.92 | $1,349.84 | $391.96 | $342.30 |
| Acres | -- | 3.965 | 0.158 | 0.066 |
| Close Price | $109,900 | $2,406,570 | $500,083 | $403,612 |
| CP/Sq Ft | $146.92 | $1,309.34 | $377.01 | $337.46 |
| CP/LP% | 69% | 103% | 96.57% | 97% |
| CP/OLP% | 61% | 103% | 92.99% | 96% |
| ADOM | 0 | 957 | 94 | 42 |
The most expensive condo that sold in April 2026 sold for $2,406,570 and the least expensive condo sold for $109,900. Condos ranged in size from 465 to 3,316 square feet with an average size of 1,362 square feet. The average price per square foot for a condo that sold in Austin in April 2026 was $377.01 with the lowest being $146.92 per square foot and the highest being $1,309.34 per square foot. It took, on average, 94 days to sell a condo in Austin and sellers received, on average, 92.99% of their original list prices.
The gap between the CP/LP% (96.57% average) and the CP/OLP% (92.99% average) tells an important story about how the listing-to-close process actually unfolded in April. The 3.58 percentage point difference represents the price reductions that happened between the time a condo was first listed and the time it went under contract. On a condo that originally listed at roughly $538,000, this gap represents approximately $20,000 in price reductions before the final negotiation with a buyer even began. Sellers who start at the right price avoid this loss entirely, while those who list high and reduce tend to close lower in absolute dollar terms than they would have with a well-calibrated original price.
The average days on market of 94 compared to the median of 42 days reveals another layer of the market that raw averages can obscure. The distribution is being pulled upward by a smaller group of condos sitting for a very long time, with the maximum of 957 days representing an extreme case. For buyers, these long-sitting listings represent your best candidates for meaningful negotiation below the already-reduced list price. For sellers, they serve as a clear signal that the market prices promptly when a listing is right and waits indefinitely when it is not.
Where Buyers Are Shopping: A Look at Price Ranges
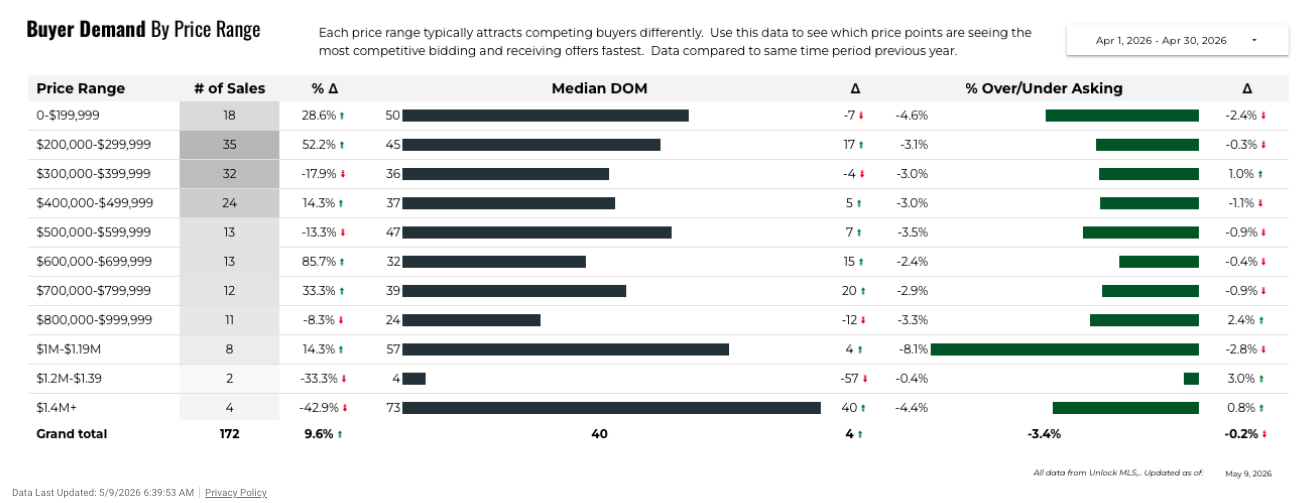
According to Unlock MLS, 172 condos sold in Austin in April 2026 when categorized by price range. The distribution of where buyers actually shopped tells you more about the practical dynamics of this market than any single metric.
The top three price brackets by sales volume were $200,000–$299,999 with 35 sales, $300,000–$399,999 with 32 sales, and $400,000–$499,999 with 24 sales. Together those three brackets accounted for 91 transactions, or about 53% of all April sales. Adding in the entry-level 0–$199,999 bracket with 18 sales, condos priced below $400,000 combined for 85 of 172 transactions, roughly 49% of all activity. The under-$400,000 segment is clearly where the largest concentration of buyer demand sits.
The fastest-moving segment in April was not where you might expect. Condos priced between $800,000 and $999,999 had a median days on market of just 24 days, the lowest of any bracket. The $600,000–$699,999 range was second quickest at 32 days, followed closely by the $300,000–$399,999 bracket at 36 days. The slowest brackets were $1.4 million and above at 73 days, $1 million to $1.19 million at 57 days, and $200,000–$299,999 at 45 days.
Year-over-year sales changes by bracket reveal where buyer interest has shifted most meaningfully. The biggest gain was in the $600,000–$699,999 range, up 85.7% year over year (13 sales versus 7 a year ago), and the $200,000–$299,999 bracket surged 52.2% (35 versus 23). On the other side, the $1.4 million and above bracket was down 42.9% and the $1.2–$1.39 million segment was down 33.3%, continuing a pattern of buyer retreat from the upper end of the market. All price brackets are selling under asking in April, with discounts ranging from 2.4% under asking in the $800,000–$999,999 range to 8.1% under asking in the $1 million to $1.19 million bracket.
The Listing-to-Close Price Gap: What Sellers Need to Know
The gap between CP/LP% and CP/OLP% in April 2026 is one of the most actionable pieces of data in this report for anyone considering selling. The average seller received 96.57% of their final list price at close but only 92.99% of their original list price. That 3.58 percentage point gap represents the average price reduction sellers made between their initial listing and the day they accepted an offer.
The math is direct. On a condo that originally listed at approximately $538,000, the average seller reduced to roughly $518,000 before going under contract, and then closed at $500,083. The full journey from original ask to close cost that average seller about $38,000 compared to what they would have received by pricing correctly from day one and simply negotiating a normal 3.4% discount. This is not an argument for pricing low; it is an argument for pricing accurately. Every dollar of artificial padding at launch tends to cost more than a dollar at the close.
The practical takeaway for sellers preparing to list is that a well-researched initial price beats the drawn-out process of overpriced listings that sit, reduce, sit again, and still close below market. In a market where 46% of active listings already carry a price drop and buyers can see that history the moment they pull up your listing, an overpriced condo carries a stigma that a correctly priced condo does not.
Price Drops in the Austin Condo Market
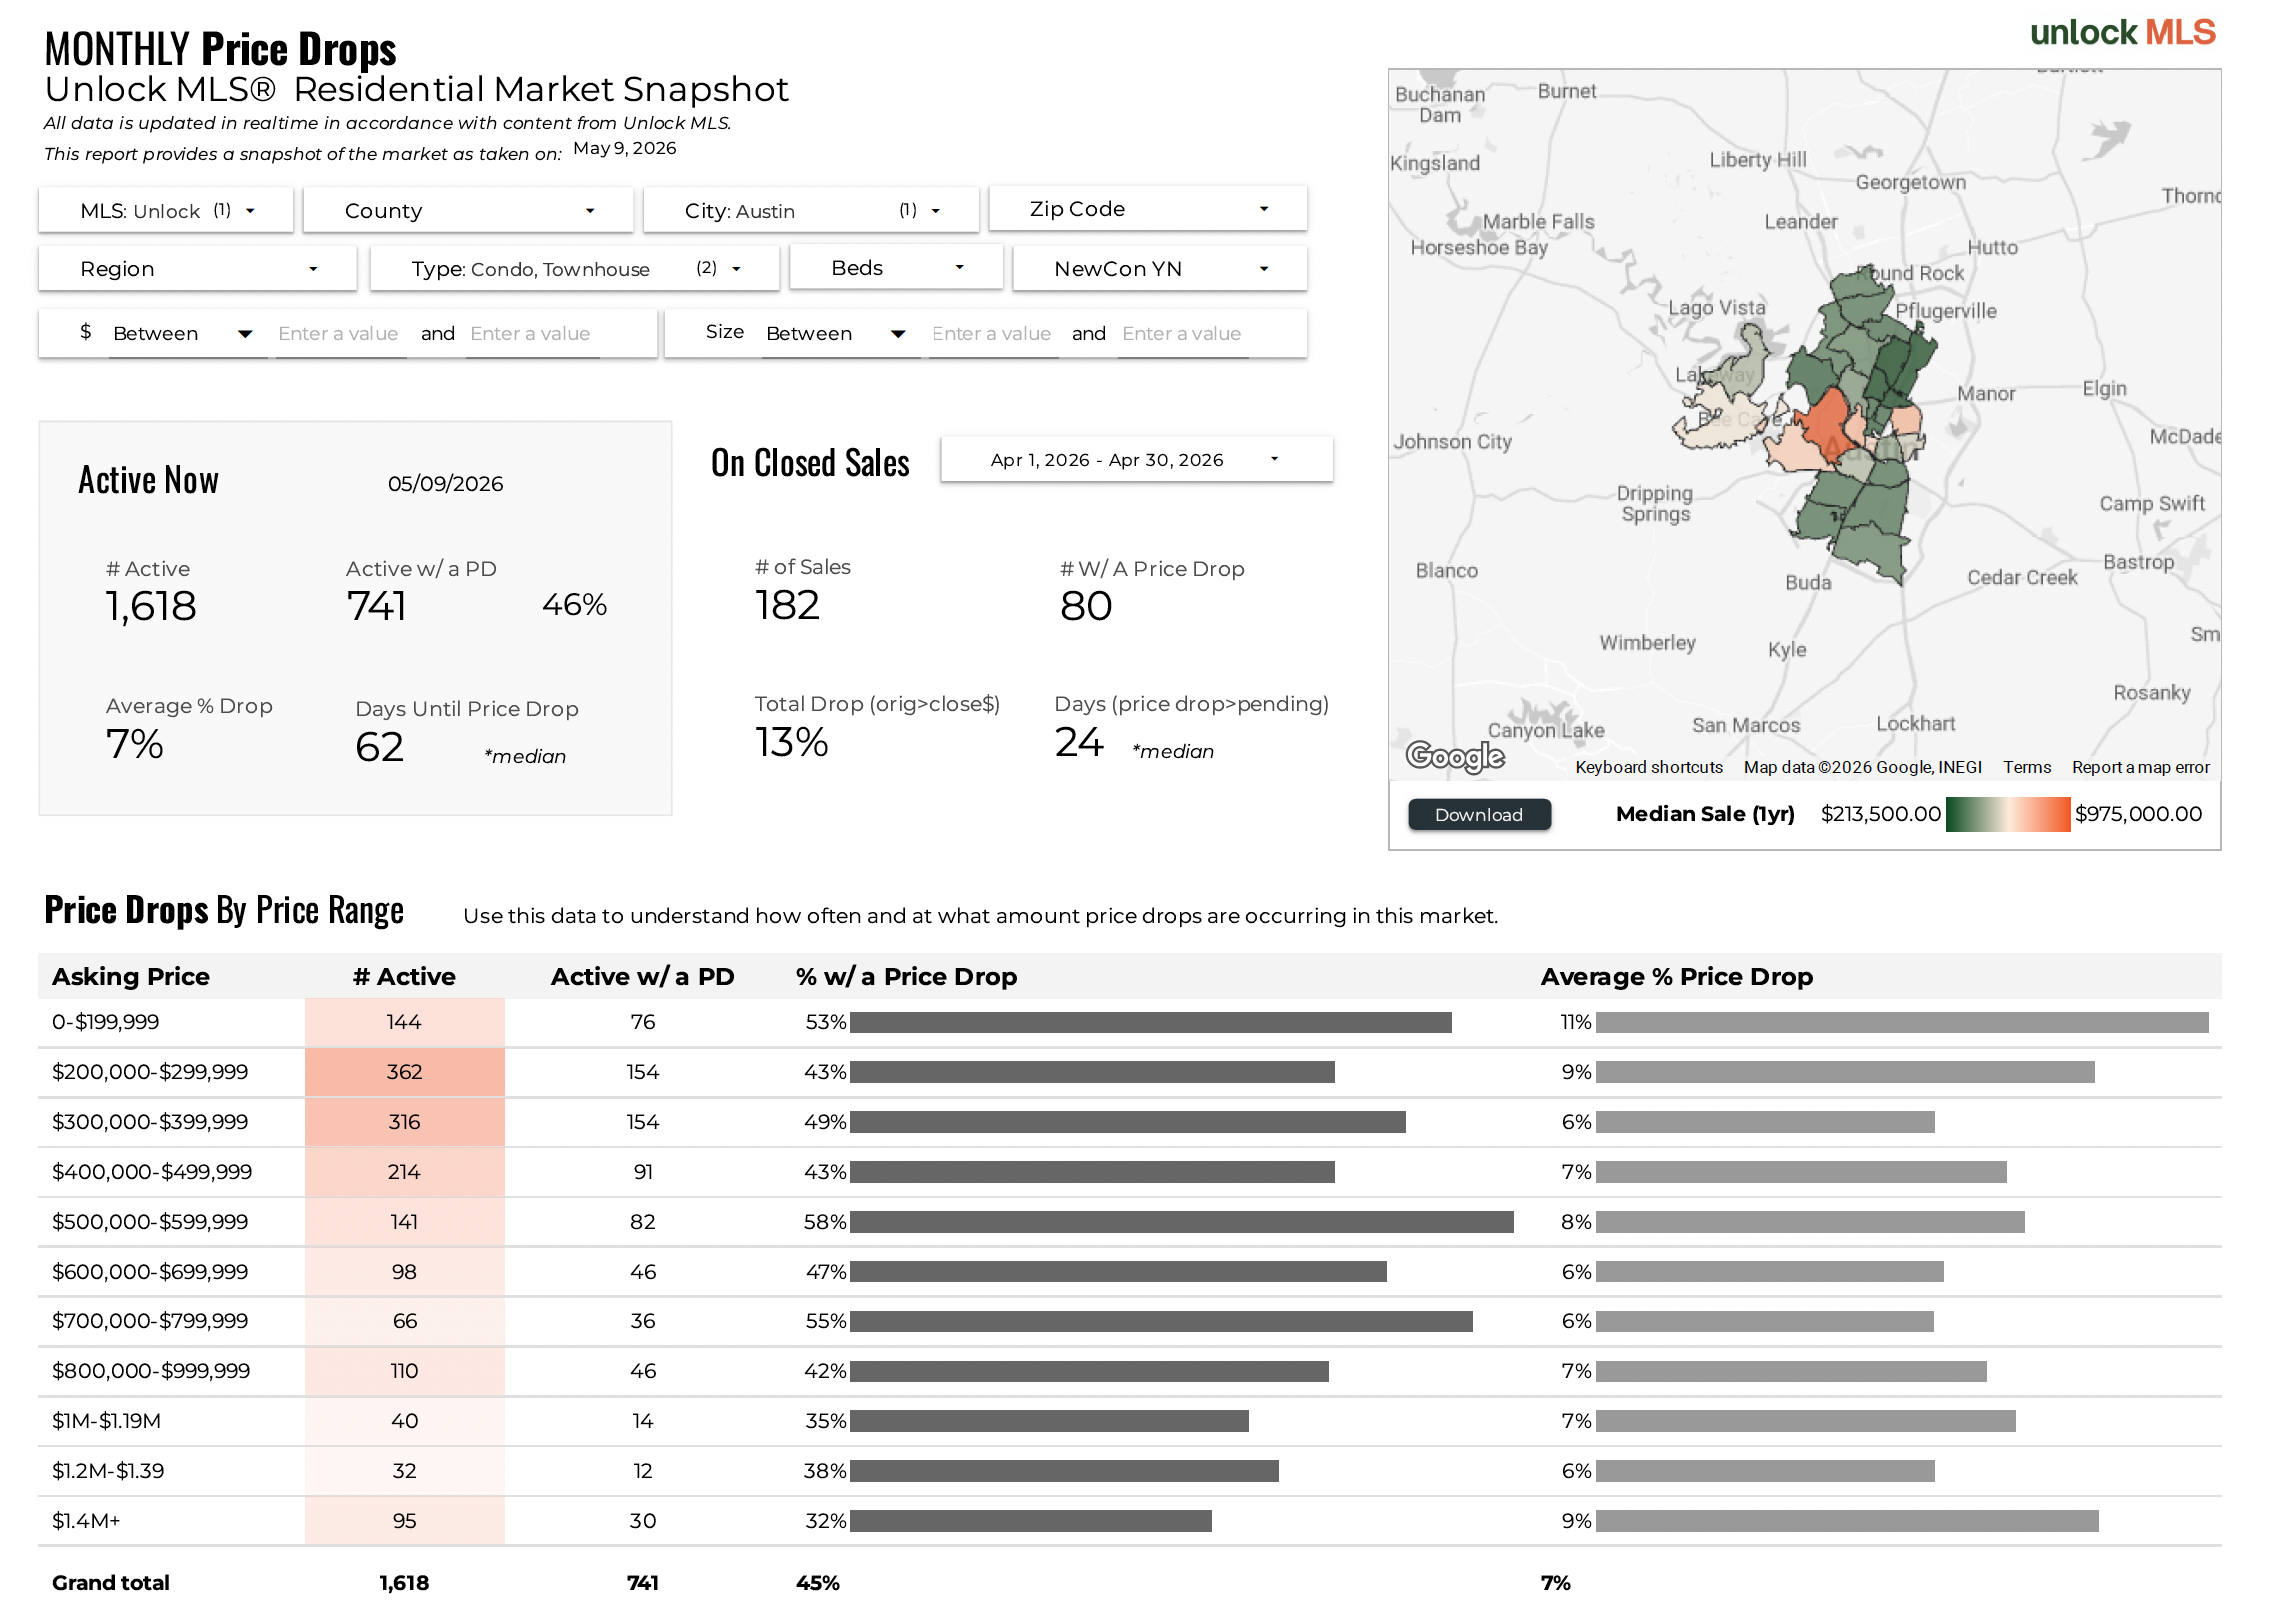
Price drops are not a niche phenomenon in Austin’s condo market right now. Of the 1,618 active listings tracked by Unlock MLS as of early May, 741 carry at least one price reduction, a rate of 46%. The average price drop is 7%, and sellers who drop their price wait a median of 62 days before doing so, meaning they spend roughly two months on the market at an uncompetitive price before adjusting. After the price drop, it takes a median of 24 more days to go under contract, so the total timeline for a listing that requires a reduction is typically around 86 days from list to pending contract.
Among the 182 closed sales in April, 80 involved a price reduction at some point during the listing period, representing 44% of closed transactions. That means nearly half of every condo that sold in April had been reduced before the buyer made an offer. Those sellers still closed at an average total reduction of 13% from their original list price to final close price. On a $500,000 original list price, a 13% total reduction implies closing around $435,000.
The price drop data by bracket reveals some useful patterns. The $500,000–$599,999 range has the highest rate of price reductions, with 58% of active listings in that tier already carrying a drop. The $700,000–$799,999 range is close behind at 55%, and entry-level sub-$200,000 condos come in at 53%. The $1.4 million and above tier shows the lowest rate at 32%, though that bracket also carries 19 months of supply. For buyers, any bracket where more than half of active listings have already been reduced is a bracket where you are negotiating from a position of strength, particularly when combined with a long days-on-market history for individual listings.
2025 Full Year Austin Condo Market Recap
The 2025 Austin condo market closed out as one of the slower years in recent history by transaction volume. A total of 1,810 condos and townhomes sold in Austin across the year, down 5.2% from 1,910 in 2024 and well below the pandemic-era peak of 3,680 transactions in 2021. The median sale price for 2025 came in at $391,000, down 4.0% from 2024’s $398,500, extending a pricing decline that has been underway since the 2022 peak above $450,000. Total annual volume was $942.08 million, down 4.7% year over year, with a median days on market of 56, reflecting a significant lengthening of transaction timelines compared to the sub-20-day medians of the 2021–2022 period.
Within 2025, the seasonal pattern was pronounced. The first quarter produced modest volume, with January’s 113 sales and February’s 138 reflecting typical winter slowdowns. Activity peaked in May at 192 transactions, the year’s single strongest month, before leveling off through the summer. August surprised positively at 182 sales, but the fall brought a sharp deceleration, with October dropping to 124 sales and November falling to 105, the weakest month of the year. December recovered modestly to 147 before winter set in again.
Looking at where 2026 stands year to date through April, the comparison is encouraging. The four-month total for 2026 stands at 560 transactions (89 in January, 124 in February, 165 in March, 182 in April), essentially matching the same period in 2025 which produced 563. The big difference is the trajectory: 2025 started stronger in January and February but decelerated into spring, while 2026 started slow and has been accelerating. April 2026’s 182 closings surpassed April 2025’s 161 by 13%, a meaningful improvement and a sign that this year’s spring market is arriving with more force than last year’s.
Months of Supply by Price Range: Where Buyers Have the Most Leverage
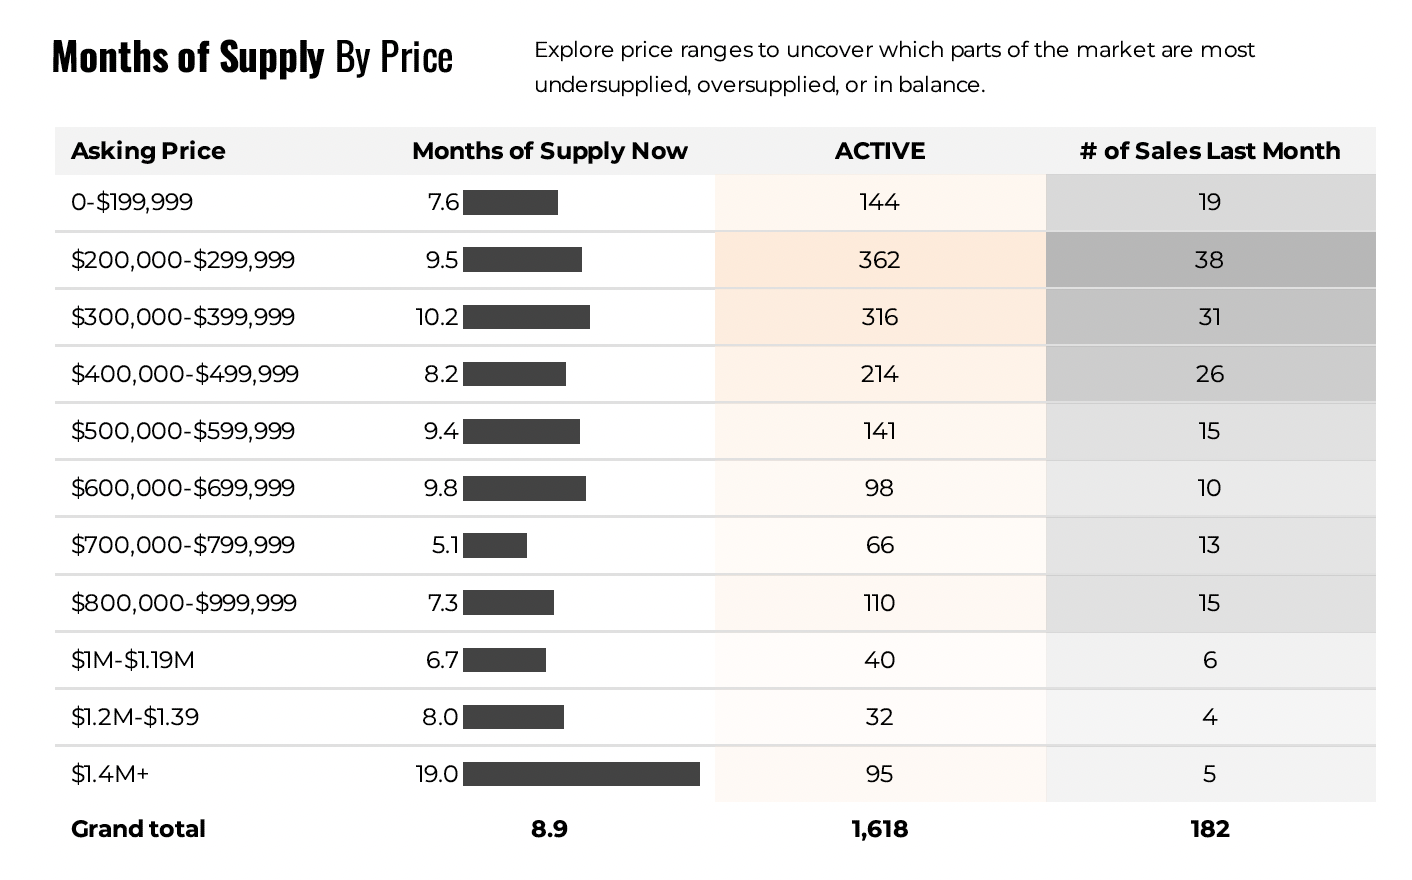
One of the most useful pieces of data for buyers in this market is how months of supply varies by price bracket, because the overall 9.81-month average masks significant variation at the bracket level. This data from Unlock MLS captures the current balance of supply and demand in each price segment.
The most oversupplied bracket by a wide margin is $1.4 million and above, which carries 19.0 months of supply against just 5 sales in the most recent month. That is an extreme imbalance and reflects a segment where buyer demand has largely evaporated while sellers have not yet adjusted their pricing expectations to match. At the opposite end, the $700,000–$799,999 range has just 5.1 months of supply, putting it closest to balanced conditions of any bracket in the market and reflecting the surge in buyer interest that pushed that bracket’s year-over-year sales up 33.3% in April.
The middle of the market, particularly the $300,000–$399,999 range at 10.2 months of supply and the $600,000–$699,999 range at 9.8 months, carries the heaviest inventory burden. Those are the brackets where buyer leverage is greatest, where price reductions are most common, and where sellers face the most direct competition from other listings. For a buyer targeting a two-bedroom condo in the $300,000–$399,999 range, the 10.2 months of supply is a negotiating tool. For a seller in that same range, it is a clear signal that pricing discipline and presentation quality are non-negotiable requirements for a successful sale.
Sale Prices by Bedroom Count: What You Can Expect to Pay
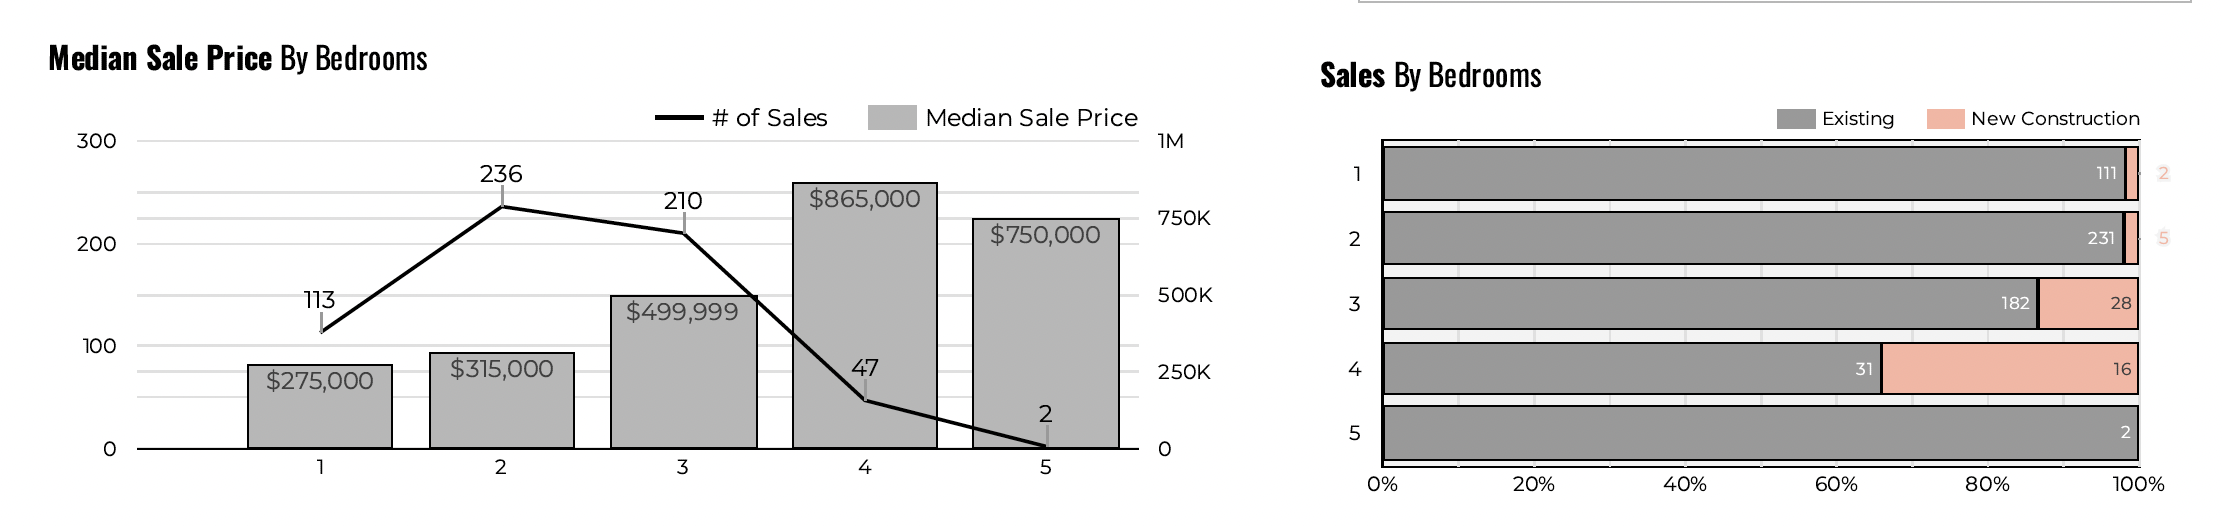
Understanding how the median sale price varies by bedroom count helps buyers frame their options and sellers understand where their specific property fits in the broader market. Based on Unlock MLS data for the first four months of 2026, one-bedroom condos carried a median sale price of approximately $275,000, two-bedroom condos came in near $390,000, and three-bedroom condos settled around $500,000.
The gap between one- and two-bedroom pricing reflects not just bedroom count but average unit size. One-bedroom condos average around 734 square feet, while two-bedroom condos average approximately 1,178 square feet, and three-bedroom units average roughly 1,838 square feet. As you move up in bedroom count, you are effectively buying meaningfully more space, and the price premium reflects that reality.
For buyers, this breakdown helps frame the decision between configurations. The jump from one bedroom to two, at roughly $115,000 at today’s median prices, may be worth examining carefully if your lifestyle or financial goals favor more space or resale flexibility. Two-bedroom condos make up the largest share of the market, meaning more comparable sales, more competition among buyers, and generally better liquidity when you eventually sell.
Market Summary and Outlook
April 2026 delivered a genuinely encouraging set of signals without resolving the fundamental challenge that has defined Austin’s condo market for the past two years. On the positive side: condos sold were up 11.3% year over year, new pending contracts were up 8.6%, median sold price recovered to $404,306 (essentially matching April 2025 after a difficult second half of 2025), and median days on market fell sharply from 77 to 44. Transaction activity is clearly gaining seasonal momentum.
Year-over-year comparisons still show areas of softness that matter. Median price per square foot is down 7.2%, median active list price is down 5.7%, and months of supply at 9.81 remains deeply in buyer’s market territory. The fact that roughly the same number of condos are selling as last year while price per square foot has fallen meaningfully reflects a market in which buyers are engaging on price-adjusted terms. They are transacting, but at values that are lower in per-square-foot terms than a year ago.
The key variable to watch heading into summer is whether the uptick in pending contracts translates into sustained sales momentum over the next 60 to 90 days. If May and June produce pending counts consistently above 200, that would begin to chip away at the inventory overhang and could provide modest upward pressure on pricing. Conversely, if May’s historically peak supply wave adds inventory faster than buyers can absorb it, the 9.81 months of supply figure could remain elevated or push higher.
Austin’s condo market fundamentals reflect a city that added significant multi-family inventory during the 2021–2024 expansion period, much of which is still finding its way to buyers. That structural supply story does not resolve quickly, but April 2026’s data suggests the market is in a slow, grinding recovery rather than a continued decline. Prices are not collapsing, transactions are rising year over year, and buyer engagement for well-priced product is improving month by month.
Time to Buy? Time to Sell?
If you are a buyer, April 2026 is a solid time to be active. You are choosing from 1,639 active listings, negotiating in a market where nearly half of all active condos have already been reduced by an average of 7%, and buying at a median price that is essentially flat year over year but meaningfully below the 2022 peak. The spring season is the best time of year for inventory selection, and the combination of reasonable prices, motivated sellers, and still-favorable supply conditions creates an environment that may look different by fall. That said, the spring activity pickup also means you face some competition, particularly in the $700,000–$799,999 range and other pockets where supply runs below six months.
For sellers, April’s data is nuanced but not discouraging. The market is buying, which is the starting point for everything. If your condo is priced correctly and shows well, the 44-day median time to sell reflects a reasonable marketing timeline with real activity behind it. The risk is entering the market overpriced in an environment where buyers can see the full pricing history on every listing and where 46% of your competition has already taken at least one reduction. A well-priced listing in good condition will find a buyer, particularly in the $600,000–$699,999 range (up 85.7% in buyer activity year over year) and the $200,000–$399,999 core where most of the volume concentrates.
For sellers who have timing flexibility, watching the next 60 to 90 days before committing is a reasonable approach. If pending contracts remain above 200 per month and months of supply begins to ease from 9.81, conditions will gradually improve. The pattern that would shift conditions most meaningfully in sellers’ favor is one where new listing supply stays moderate through the summer while pending demand holds or grows, which could compress inventory meaningfully by Q3 2026.
Action Items for Buyers
- Run the months of supply calculation in your specific target price range before you start touring condos seriously. The overall 9.81-month market average masks meaningful variation by bracket, with the $700,000–$799,999 range at just 5.1 months and the $300,000–$399,999 range exceeding 10 months. Where supply is highest is where your negotiating leverage is greatest.
- Target listings that have been on the market longer than 60 days and carry at least one price reduction. These sellers have already demonstrated a willingness to adjust, and April’s data shows that closed sales with price reductions came in at an average of 13% below original list price. That is where motivated sellers are concentrating.
- Get pre-approved from a lender before making offers. Even in a buyer’s market, sellers with correctly priced condos are seeing genuine activity, and a buyer without pre-approval in hand loses time and credibility at exactly the moment when it matters most.
- Pay close attention to the $600,000–$699,999 bracket if it fits your budget. Sales in that range surged 85.7% year over year in April, suggesting it is one of the more active and liquid segments of the market right now, with a median days on market of just 32 days.
- Use the average days on market of 94 compared to the median of 42 as a research filter. Condos with 100-plus days on the market, especially those with two or more price reductions, are your best candidates for meaningful negotiation below even the already-reduced list price.
- Factor in the price-per-square-foot context when evaluating specific units. At $333 median in April 2026, you are buying at roughly $26 per square foot less than April 2025 buyers paid. On a 1,250-square-foot condo, that represents approximately $32,500 in embedded value compared to what buyers paid a year ago for similar space.
Action Items for Sellers
- Price your condo at or slightly below the current comparable closed sales in your price range from day one. The data is clear: sellers who start high and reduce close at an average of 13% below their original list price, which in most cases produces a worse net than a well-calibrated initial price and a clean, one-step negotiation.
- Review the months of supply in your specific price bracket and set timeline expectations accordingly. If you are in the $300,000–$399,999 range with 10.2 months of supply, plan for a longer marketing period, more showings before receiving an offer, and more buyer requests for concessions than you would face in a tighter bracket.
- Address deferred maintenance and cosmetic issues before listing. In a market where buyers are choosing from 1,639 options, condition matters significantly. A condo that shows well attracts the buyer who closes in 44 days or less; one that needs visible work attracts buyers looking for the deepest discounts.
- Understand that 46% of your competition on the active market already has a price reduction showing in their listing history. Buyers see this data and use it as a negotiating signal. A clean pricing history, even in a buyer’s market, is a competitive advantage worth preserving.
- Monitor your first 21 days on the market closely. If you are not generating showings and serious interest in the first three weeks, that is direct market feedback that your price needs adjustment. Acting on that feedback at 21 days costs far less than waiting 62 days (the median time until a price drop for April’s active listings) and still needing to reduce.
- Consider the current spring window seriously if you have been waiting for a better market to sell. May and June historically bring peak buyer traffic, and pending activity is already running 8.6% above last year. The late 2025 deceleration showed what happens when the spring window closes and fall arrives. This spring is your best opportunity in the current cycle.
Final Word on the Austin Condo Market
April 2026 is a market that rewards preparation above almost any other factor. For buyers, preparation means understanding the supply picture in your target price range, knowing your financing before you make an offer, and identifying the listings that have already been through the market correction process and represent genuine value at today’s prices. For sellers, preparation means an honest assessment of comparable sales, a realistic view of your direct competition, and a willingness to enter the market at a price the data supports rather than the one you were hoping for two years ago.
The numbers from April collectively point to a market in cautious recovery. Transaction volume is up year over year, pricing has stabilized near $400,000 after a difficult 2025, and buyer engagement is incrementally improving. None of that points to a rapid return to 2021 conditions, but it also does not point to continued decline. The floor appears to be in, and the direction of travel measured month by month is slowly but consistently upward.
Whatever your situation, the best decisions in this market come from data, not headlines or sentiment. If the numbers show that your target condo is priced below comparable units that sold last month, that is a buying opportunity worth acting on. If they show your condo would be priced 15% above what buyers are actually paying, that is a conversation to have with your agent before you list. Reach out to Rebecca Jacks and the team at Eleven Oaks Realty. Call or text (512) 827-8323 or email info@11OaksRealty.com.
Questions About the April 2026 Austin Condo Price Report?
Have questions about what the April 2026 Austin Condo Price Report means for your specific situation? We are happy to help. If you are thinking about buying a condo in Austin, our Buyers page has resources to help you understand the process and get started. If you are thinking about selling, our Sellers page walks through what to expect in today’s market.
Reach out to Rebecca Jacks and the team at Eleven Oaks Realty. Call or text (512) 827-8323 or email info@11OaksRealty.com. We have been helping buyers and sellers since 1978 and we are here to help you make the best decision for your situation, whatever that looks like.
Data sources: Realtors Property Resource (RPR), Austin Board of REALTORS MLS, Unlock MLS. All figures are for condominiums and townhomes in the City of Austin. Reported figures reflect April 1, 2026 through April 30, 2026. Some variation between data sources may exist due to differing methodology and timing of data pulls.




Leave a Reply