
Eleven Oaks Realty is proud to present their March 2026 Austin Condo Price Report measuring activity in the Austin condo market. Our March 2026 Austin Condo Price Report covers all condominiums and townhomes in the City of Austin.
March 2026 brought a significant spring pickup in Austin condo activity. Sales climbed 23% from February’s slow pace, new listings surged 47%, and the median sold price rebounded 5.1% month over month to $399,000. Year over year, the picture is softer: prices are down 6.3%, condos are sitting on the market for 73 days compared to 44 days a year ago, and buyers continue to exercise pricing leverage with homes closing at an average of 91.2% of original list prices. With 8.8 months of supply, the Austin condo market remains firmly in buyer’s territory, though the spring uptick in pending contracts and new listings suggests the market is beginning to find its footing heading into the busier season.
All data below covers condominiums and townhomes in the City of Austin. Data is sourced from Realtors Property Resource (RPR) and the Austin Board of REALTORS MLS. Some metrics may vary slightly between sources due to differing methodology; where differences exist, they are noted.
The Austin Condo Market is a Buyer's Market
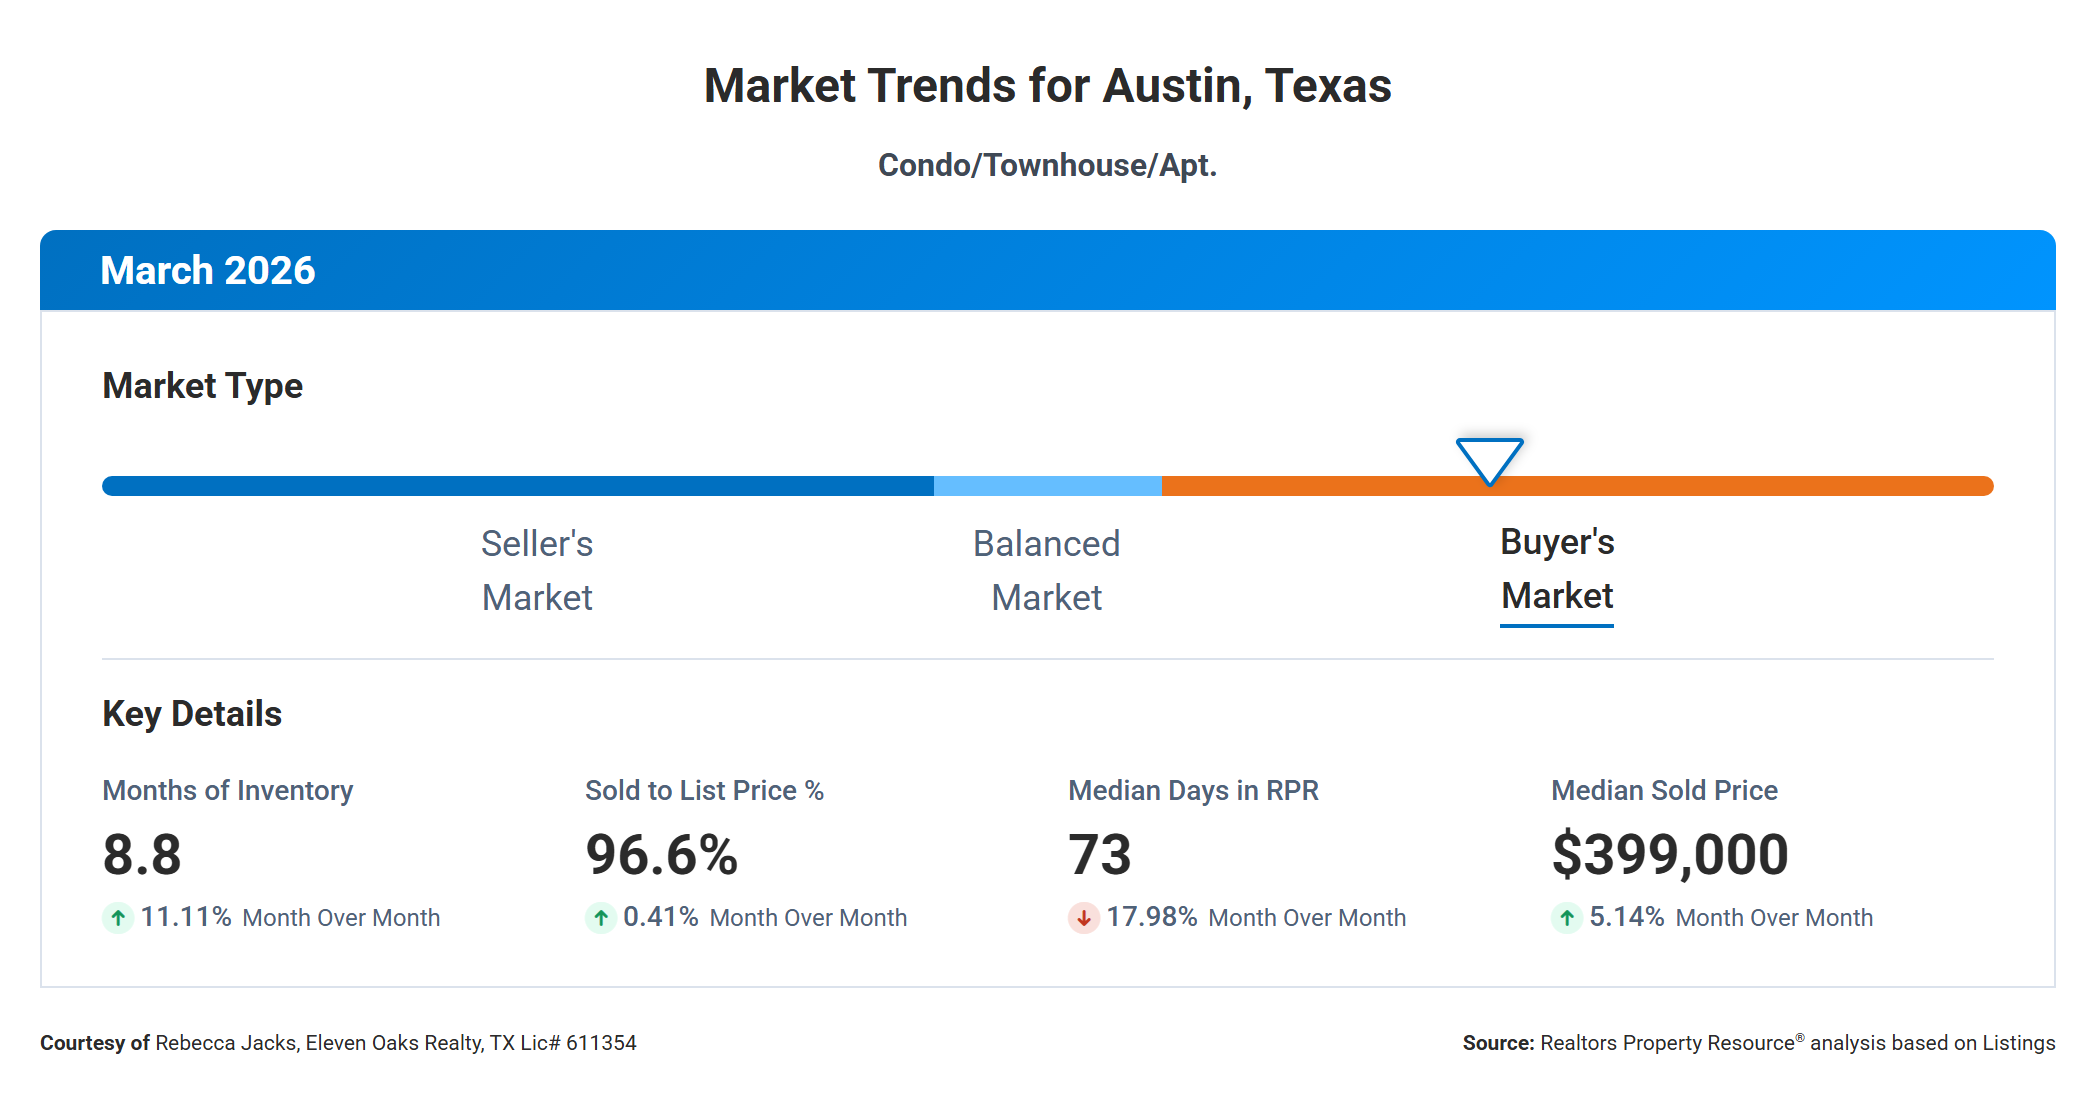
With 8.8 months of supply, Austin condos are firmly in buyer's market territory in March 2026. A balanced market sits around four to six months of supply, and a seller's market falls below four months. At 8.8 months, buyers have ample choices and enough time to be deliberate. That said, the pace is not uniform across all price points, and some segments are tighter than others -- something covered in depth later in this report.
The Market Trends dashboard from RPR shows all four key metrics as of March 2026. Months of inventory sits at 8.8, up 11.1% from February. The average sold to list price ratio is 96.6%, up slightly from 96.2% last month, meaning most condos are selling at or just below the asking price that was in effect at the time of contract. Median days in RPR came in at 73, down 18% from February's elevated pace of 89 days, which is an encouraging sign that spring buyers are moving more quickly than they were during the slower winter months. The median sold price landed at $399,000, up 5.1% month over month after several soft months.
For buyers, these numbers point to continued negotiating room and a broad selection of inventory. For sellers, the data says pricing correctly at launch is the most important factor in getting a timely sale -- overpriced listings are sitting, while well-priced condos are finding buyers.
What the Numbers Mean For Buyers
The price picture has improved for buyers over the past year. The median sold price in March 2026 was $399,000, down 6.3% from $427,250 in March 2025. That year-over-year drop translates to roughly $28,000 less for the median condo, and the average close price as a percentage of original list price sits at 91.2% -- meaning there is real room to negotiate from initial ask to final close. Buyers who identify listings that have been on the market with price reductions have the most leverage, and the data shows plenty of those exist right now.
Inventory is healthy. There are 1,443 active condo listings in Austin, up 3.8% from a year ago and up 13.6% from last month as the spring market kicks in. That level of supply gives you genuine options -- you are not being forced to compete aggressively for a thin pool of homes. With 8.8 months of supply overall, you have time to tour, compare, and negotiate without the urgency that characterized the 2021 and 2022 market.
The timing picture is worth watching closely. New pending listings jumped 22.8% month over month to 199 contracts in March, and new listings surged 47.2% from February to 558. That inventory expansion is meaningful for buyers who want options, but the rise in pending contracts tells you that other buyers are beginning to act. The spring season historically brings more competition for the most desirable listings, and 2026 appears to be following that pattern.
Practically speaking, the best move right now is to get pre-approved, identify your price range, and study the months-of-supply data by price bracket that appears later in this report. Some price points are far more competitive than others. Working with an experienced agent who knows which listings have been sitting and which have multiple offers makes a real difference in this kind of bifurcated market.
What the Numbers Mean For Sellers
The month-over-month improvement in March is a positive signal for sellers. The 23% jump in closed sales, the 22.8% increase in new contracts, and the 5.1% rise in median price all suggest buyers are coming back to the market after a slow winter. If you have been waiting for conditions to improve before listing, the spring 2026 market is more favorable than what we saw from November through January.
Pricing discipline remains critical. The average condo in March 2026 closed at 91.2% of its original list price. That 8.8-point gap between where you price it and where you close it costs a meaningful amount of money on a typical Austin condo -- roughly $28,000 on the average-priced unit. Sellers who price aggressively at launch tend to either chase the market down through a series of reductions, or sit long enough to become stigmatized in the eyes of buyers who wonder why it hasn't sold. The data consistently shows that right-priced listings close faster and at better terms.
The competitive context is real. New listings jumped 47% in March, which means your listing is entering a busier market with more competition from other sellers. Forty percent of all active listings currently carry a price reduction, and 51% of March's closed sales involved at least one price cut. The sellers who succeed in this environment stand out through condition, presentation, and accurate pricing -- not through testing the top of the range and hoping.
Sellers who price correctly in the $300K-$499K sweet spot where the most buyer activity is concentrated are in the best position right now. Condos in that range are selling in about 38 to 57 days, which is meaningfully faster than the market average of 73 days.
Median Sold Price Down 6.3% Year Over Year
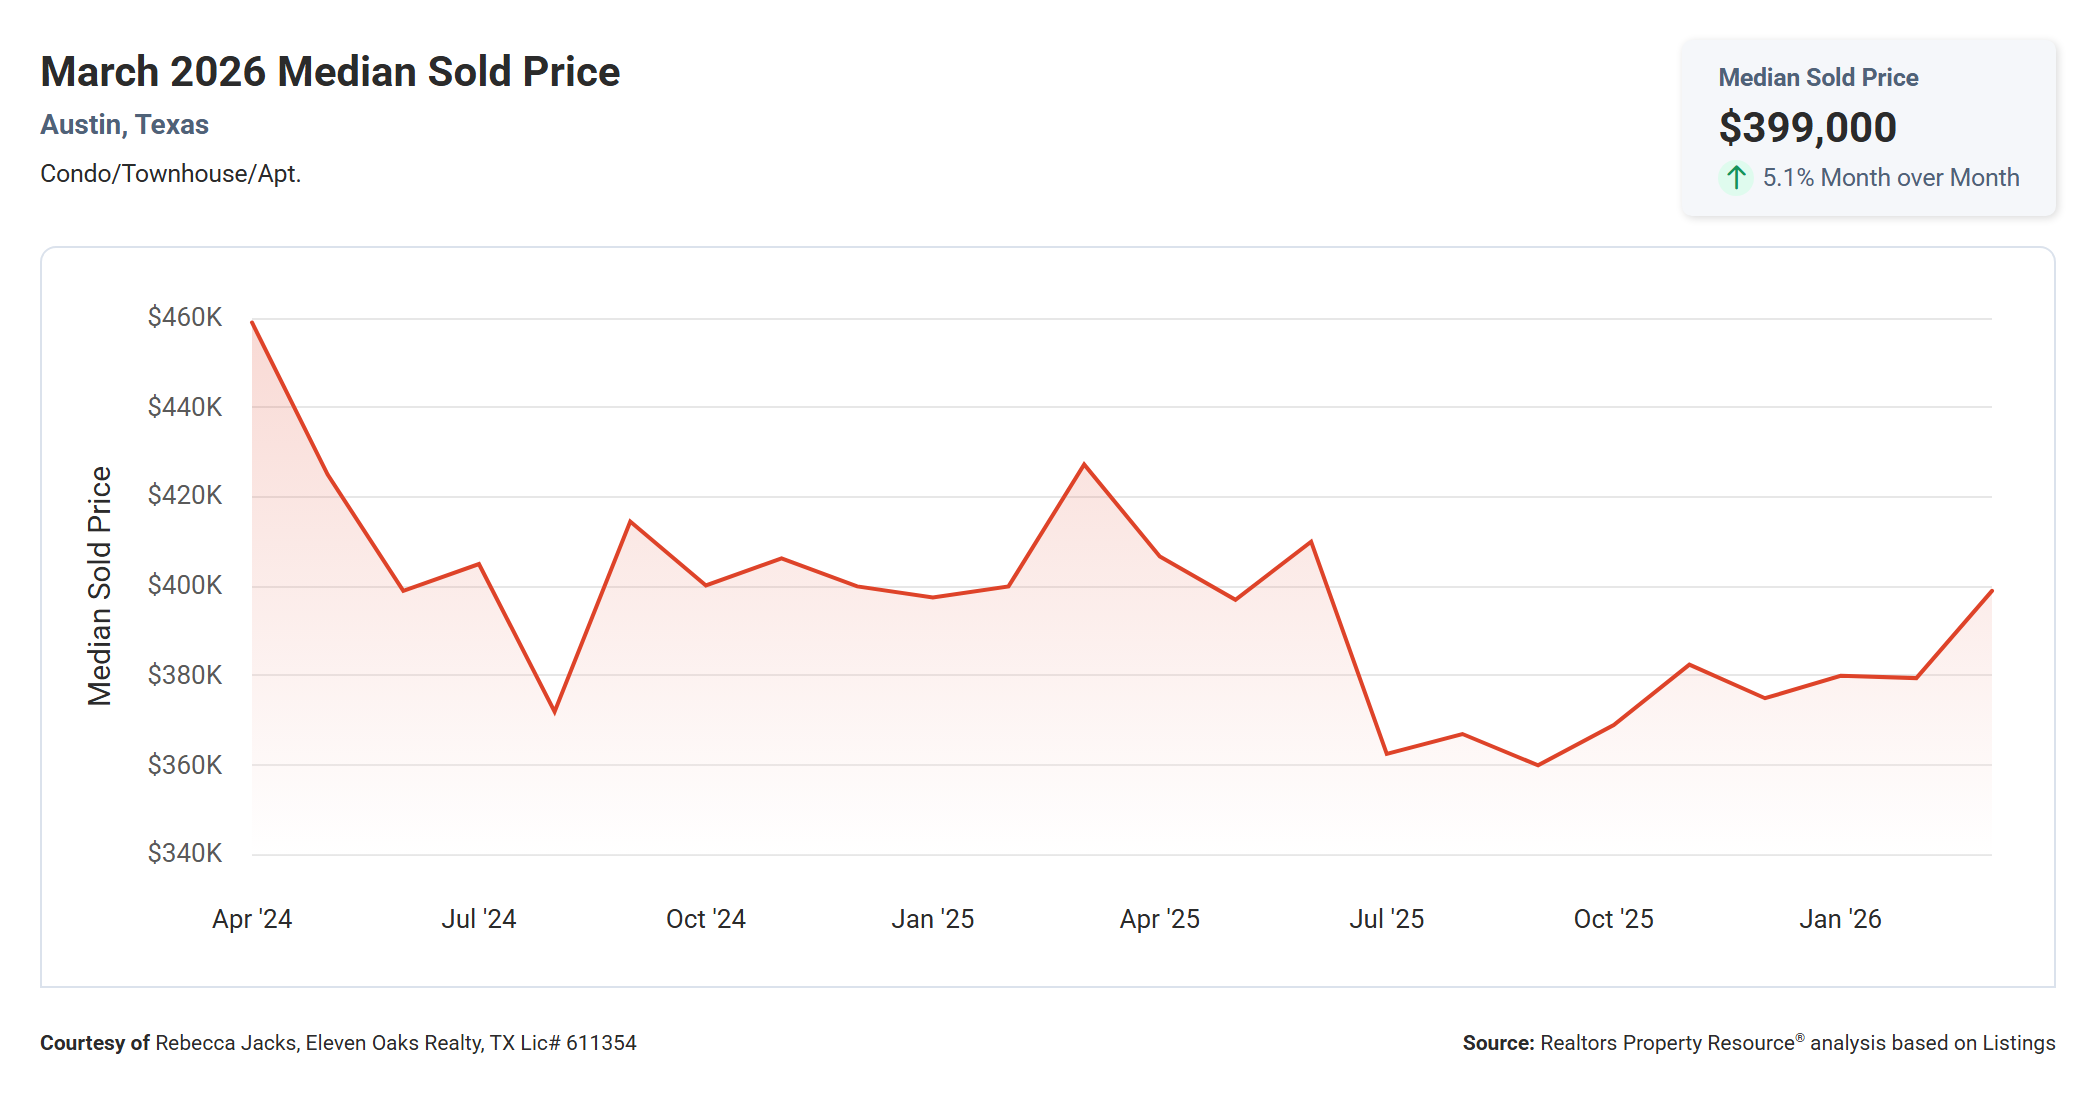
The median sold price for Austin condos in March 2026 was $399,000, up 5.1% from February's $379,500 and down 6.3% from March 2025's $427,250, according to Unlock MLS.
The RPR chart shows a two-year trend that tells a clear story. Prices peaked near $450,000 in spring of 2024, then declined steadily through 2024 and into 2025, reaching a trough in the low-to-mid $360,000 range in summer 2025. Since then, prices have been recovering slowly, and March's $399,000 reading represents the highest median we have seen since early 2025. The year-over-year decline is meaningful but the month-over-month trend is pointing in a constructive direction.
For buyers, a 6.3% year-over-year price reduction means you are getting more condo for your money than you would have a year ago. On a $400,000 purchase, that difference represents roughly $26,000 in value relative to what March 2025 buyers paid. For sellers, the chart makes clear that listing price expectations need to reflect today's market -- not the peak prices of 2024 -- to attract buyers who are watching these trends just as closely as their agents are.
Median Active List Price Down 5.9% Year Over Year
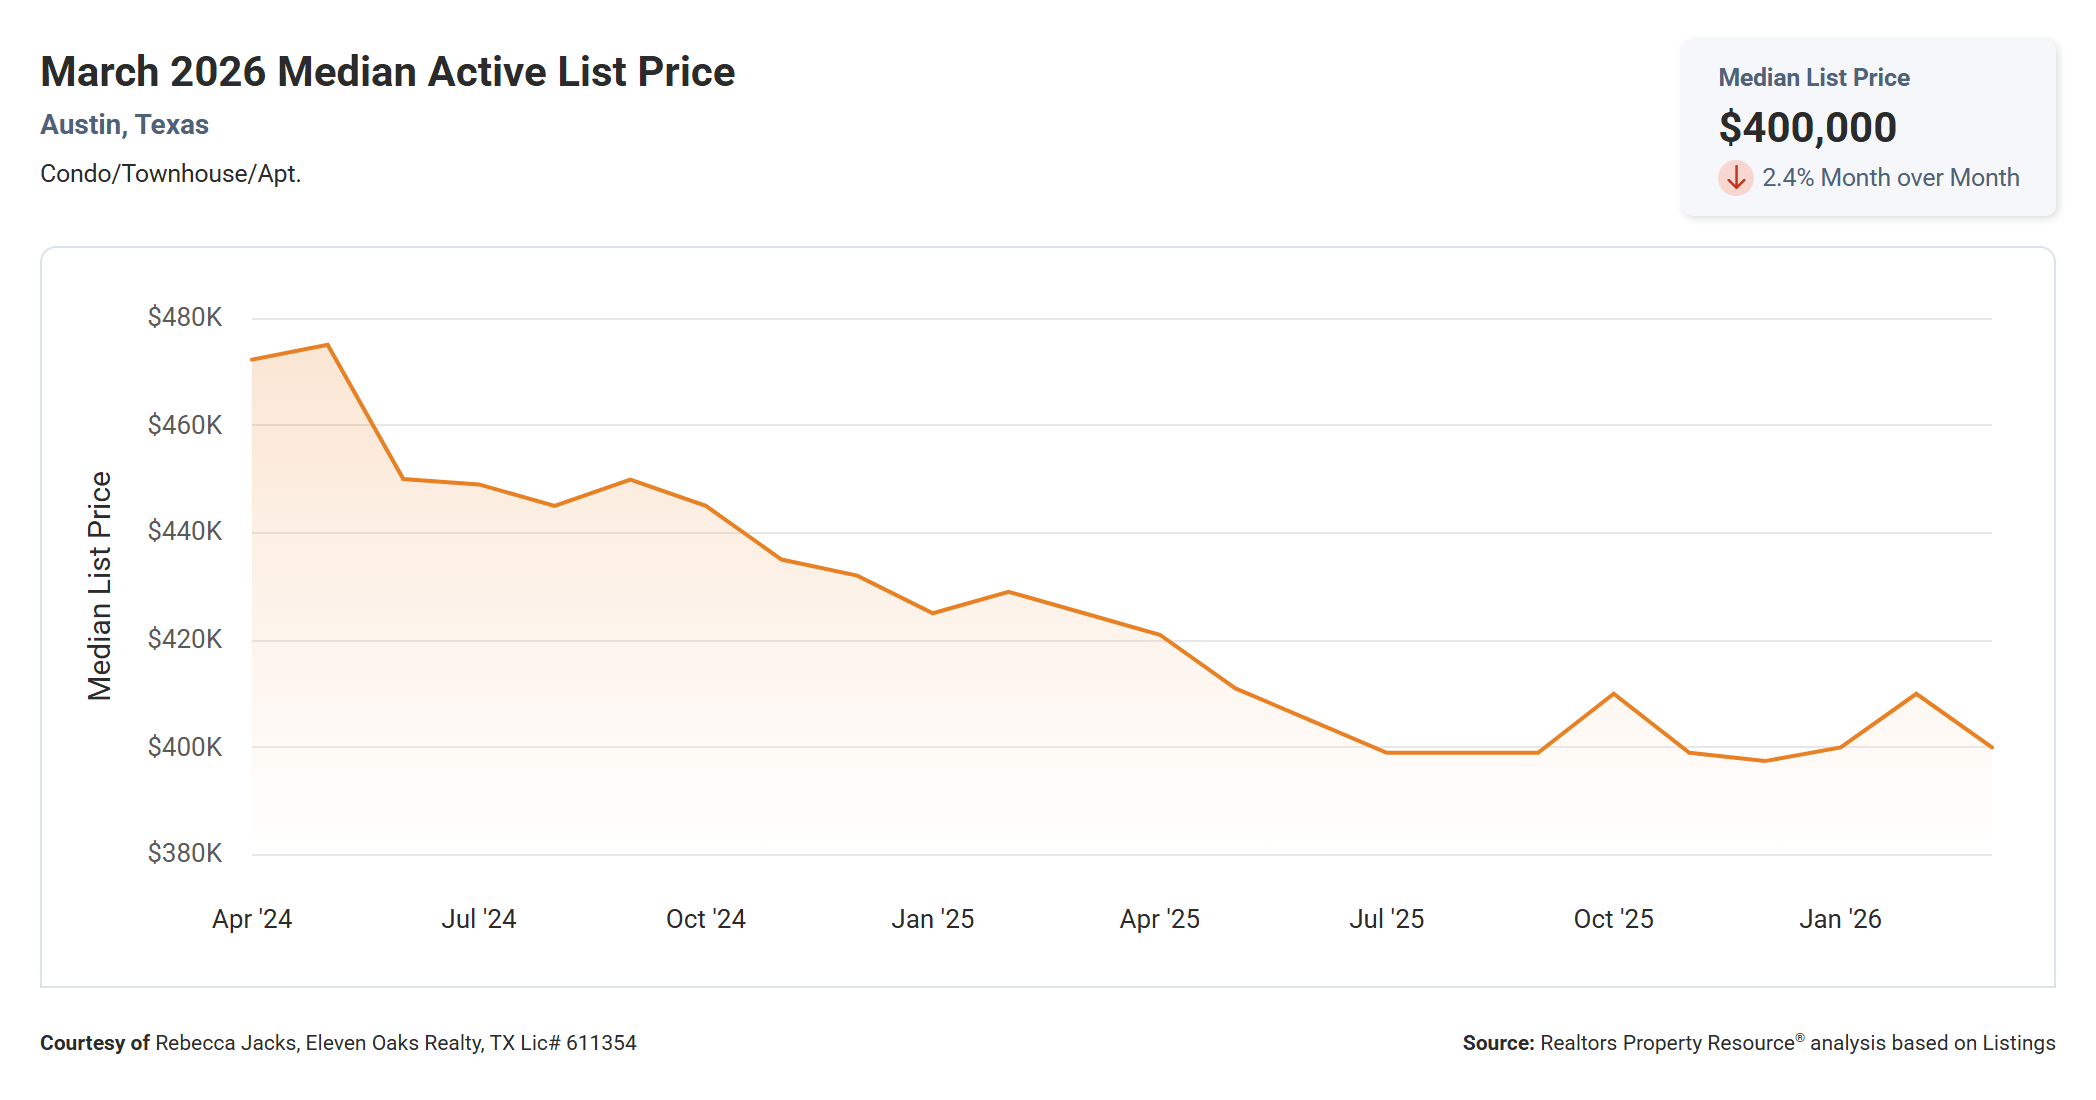
The median active list price in March 2026 was $400,000, down 2.4% from February's $409,990 and down 5.9% from the $425,000 median list price in March 2025.
The two-year chart shows a sustained downward trend in asking prices, which reflects sellers gradually adjusting their expectations to meet the market. The median list price has fallen from roughly $465,000-$475,000 in mid-2024 to $400,000 in March 2026 -- a reset of about 13-15% over that period. That sellers are now listing closer to where the market is actually transacting is a healthier dynamic than the extended standoff we saw in 2024, when the gap between list and close prices was wider.
For buyers, the convergence of the median list price ($400,000) and the median sold price ($399,000) in March tells you that asking prices are now well-calibrated to market reality. There is less need to negotiate large discounts off the initial ask when sellers have already done the pricing work upfront. For sellers, this convergence is a validation that realistic pricing strategies are working -- the market rewards you for meeting buyers where they are.
Median Price Per Square Foot Down 4.8% Year Over Year
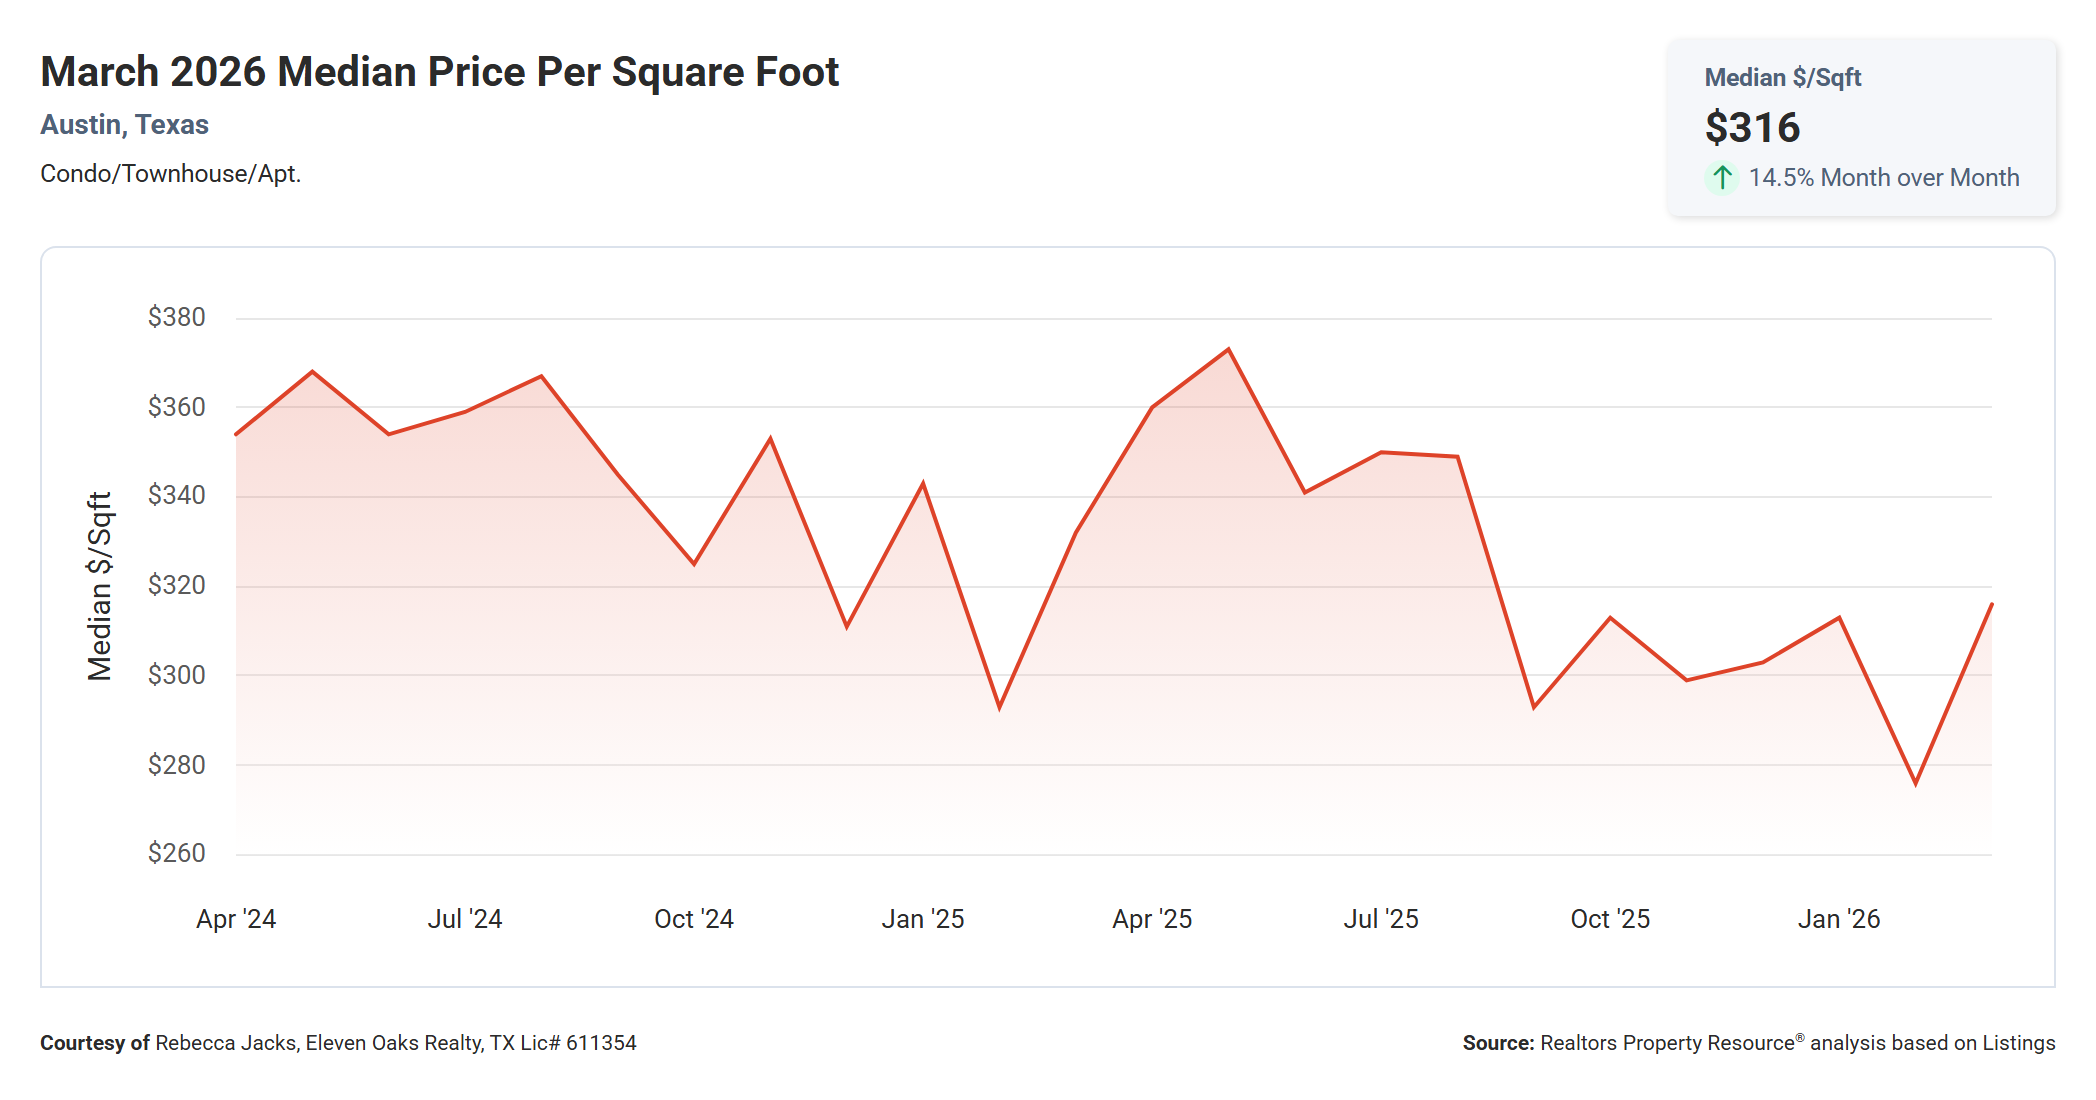
The median price per square foot for Austin condos in March 2026 was $316, up 14.5% from February's $276 and down 4.8% from March 2025's $332.
The month-over-month jump in price per square foot is striking, though it is partly a reflection of a different mix of units selling in March versus February -- a month when fewer condos traded and the mix skewed toward smaller, less expensive units. The two-year trend on the chart shows the median price per square foot has been drifting lower since a peak near $370 in spring-summer 2024. The current $316 reading is near the lower end of the two-year range, though well above the sub-$280 readings seen briefly in early 2026.
For buyers, the lower price per square foot compared to a year ago gives you more space for your dollar. For sellers, this metric matters when you are comparing your condo to nearby alternatives -- a condo priced at a significantly higher price per square foot than comparable units will struggle, regardless of what the broader market is doing.
Average Sold to List Price Essentially Unchanged Year Over Year
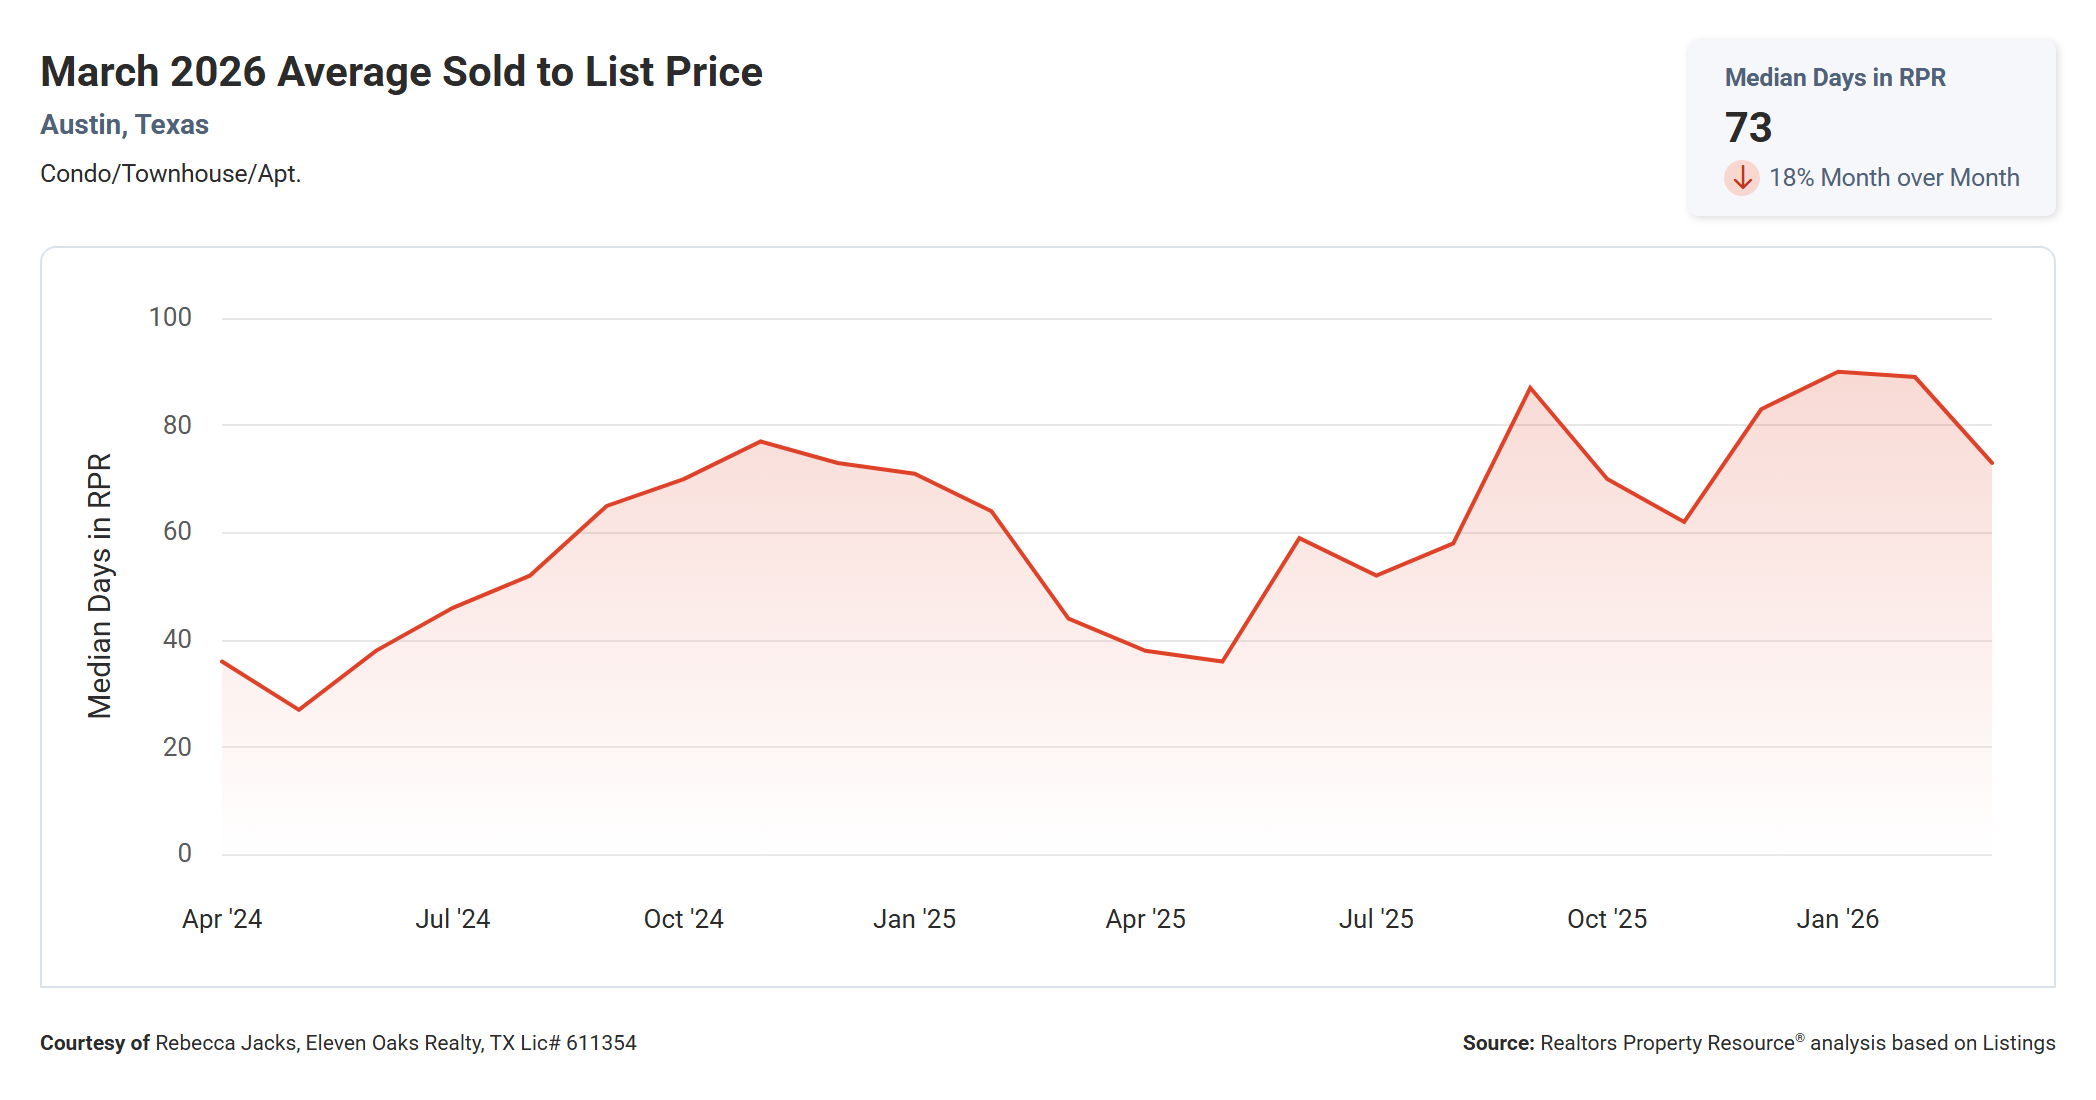
The average sold to list price ratio in March 2026 was 96.6%, up slightly from February's 96.2% and essentially flat compared to 96.4% in March 2025.
This metric measures how close buyers are paying to the active list price at the time of contract -- meaning it reflects the asking price after any seller reductions, not the original price. The narrow change year over year (less than 0.2 percentage points) tells you that the dynamic between buyers and sellers at the contract negotiation stage has been relatively consistent. Buyers are typically receiving about 3-4% off whatever the seller has most recently priced their condo at.
What this metric does not capture is how far the original asking price had already been reduced before the contract was written. The ABoR statistics for March 2026 show that the average condo closed at 91.2% of its original list price, compared to 96.4% of its final list price. That five-point gap tells you most of the negotiation is happening through price reductions before the listing ever goes under contract, not through aggressive buyer offers after the fact. Sellers who start with an accurate price skip that process entirely and come out ahead.
Median Time to Sell Up 65.9% Year Over Year
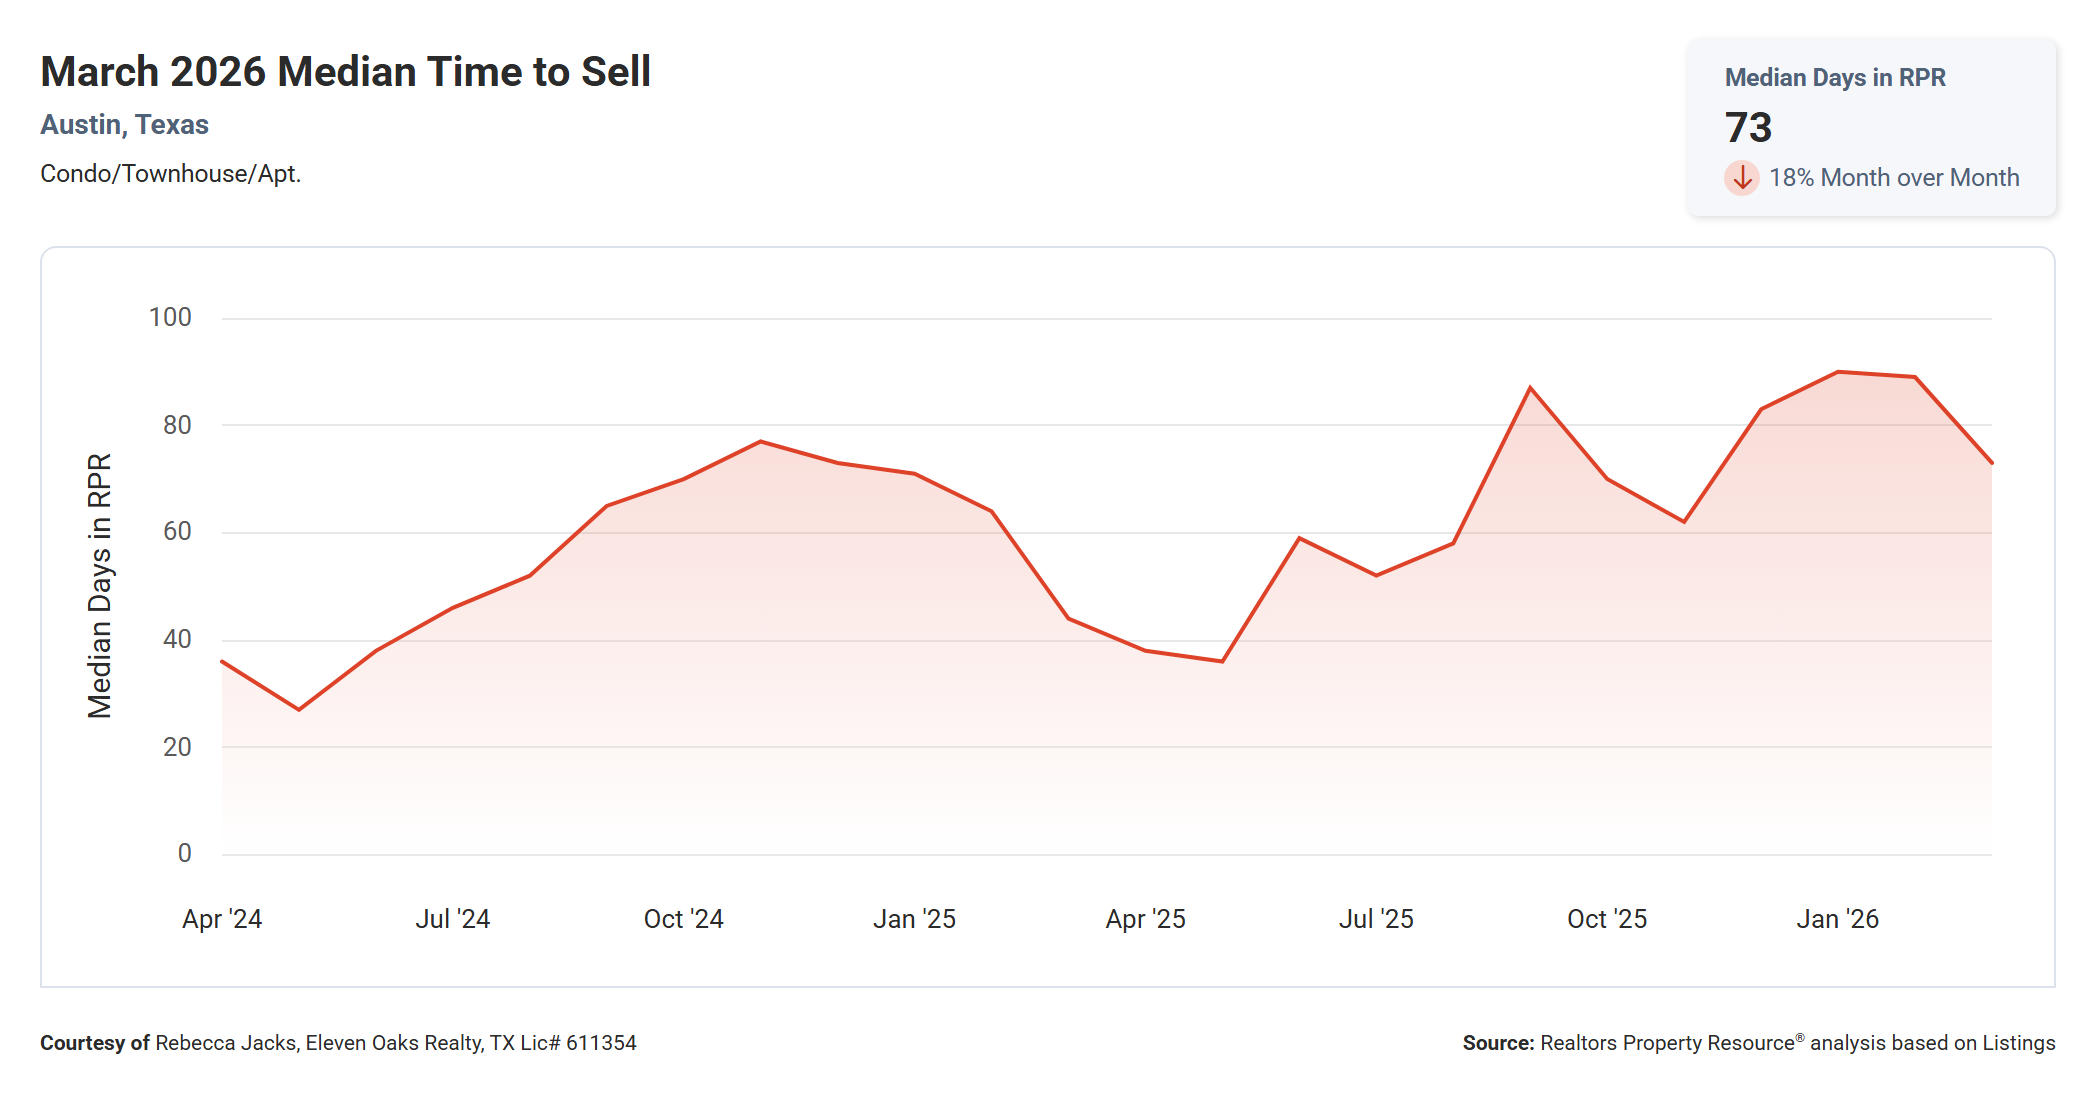
The median time to sell a condo in Austin in March 2026 was 73 days, down 18% from February's 89 days and up 65.9% from 44 days in March 2025.
The two-year chart is a clear picture of a market in transition. In spring and summer of 2024, median days on market were running in the 35-50 day range. By late 2024 and into 2025, the pace began slowing, and by fall 2025 median days had climbed toward 80-85 days. The improvement in March -- dropping from 89 back to 73 -- is meaningful but does not change the fact that condos are sitting about a month and a half longer today than they were a year ago.
For buyers, a 73-day median means you have more time to make thoughtful decisions. The urgency that pushed buyers to waive inspections or skip due diligence in 2021-2022 simply does not exist in this market. For sellers, the year-over-year increase is a clear signal that buyers need more persuading than they did in 2025. Condos that are priced well and presented cleanly are still selling, but patience is required. The sellers who struggle most are those who treat the spring pickup as a signal to test a higher price -- that strategy tends to backfire in a market where days-on-market data is visible to every buyer's agent.
Months Supply of Inventory Up 2.9% Year Over Year
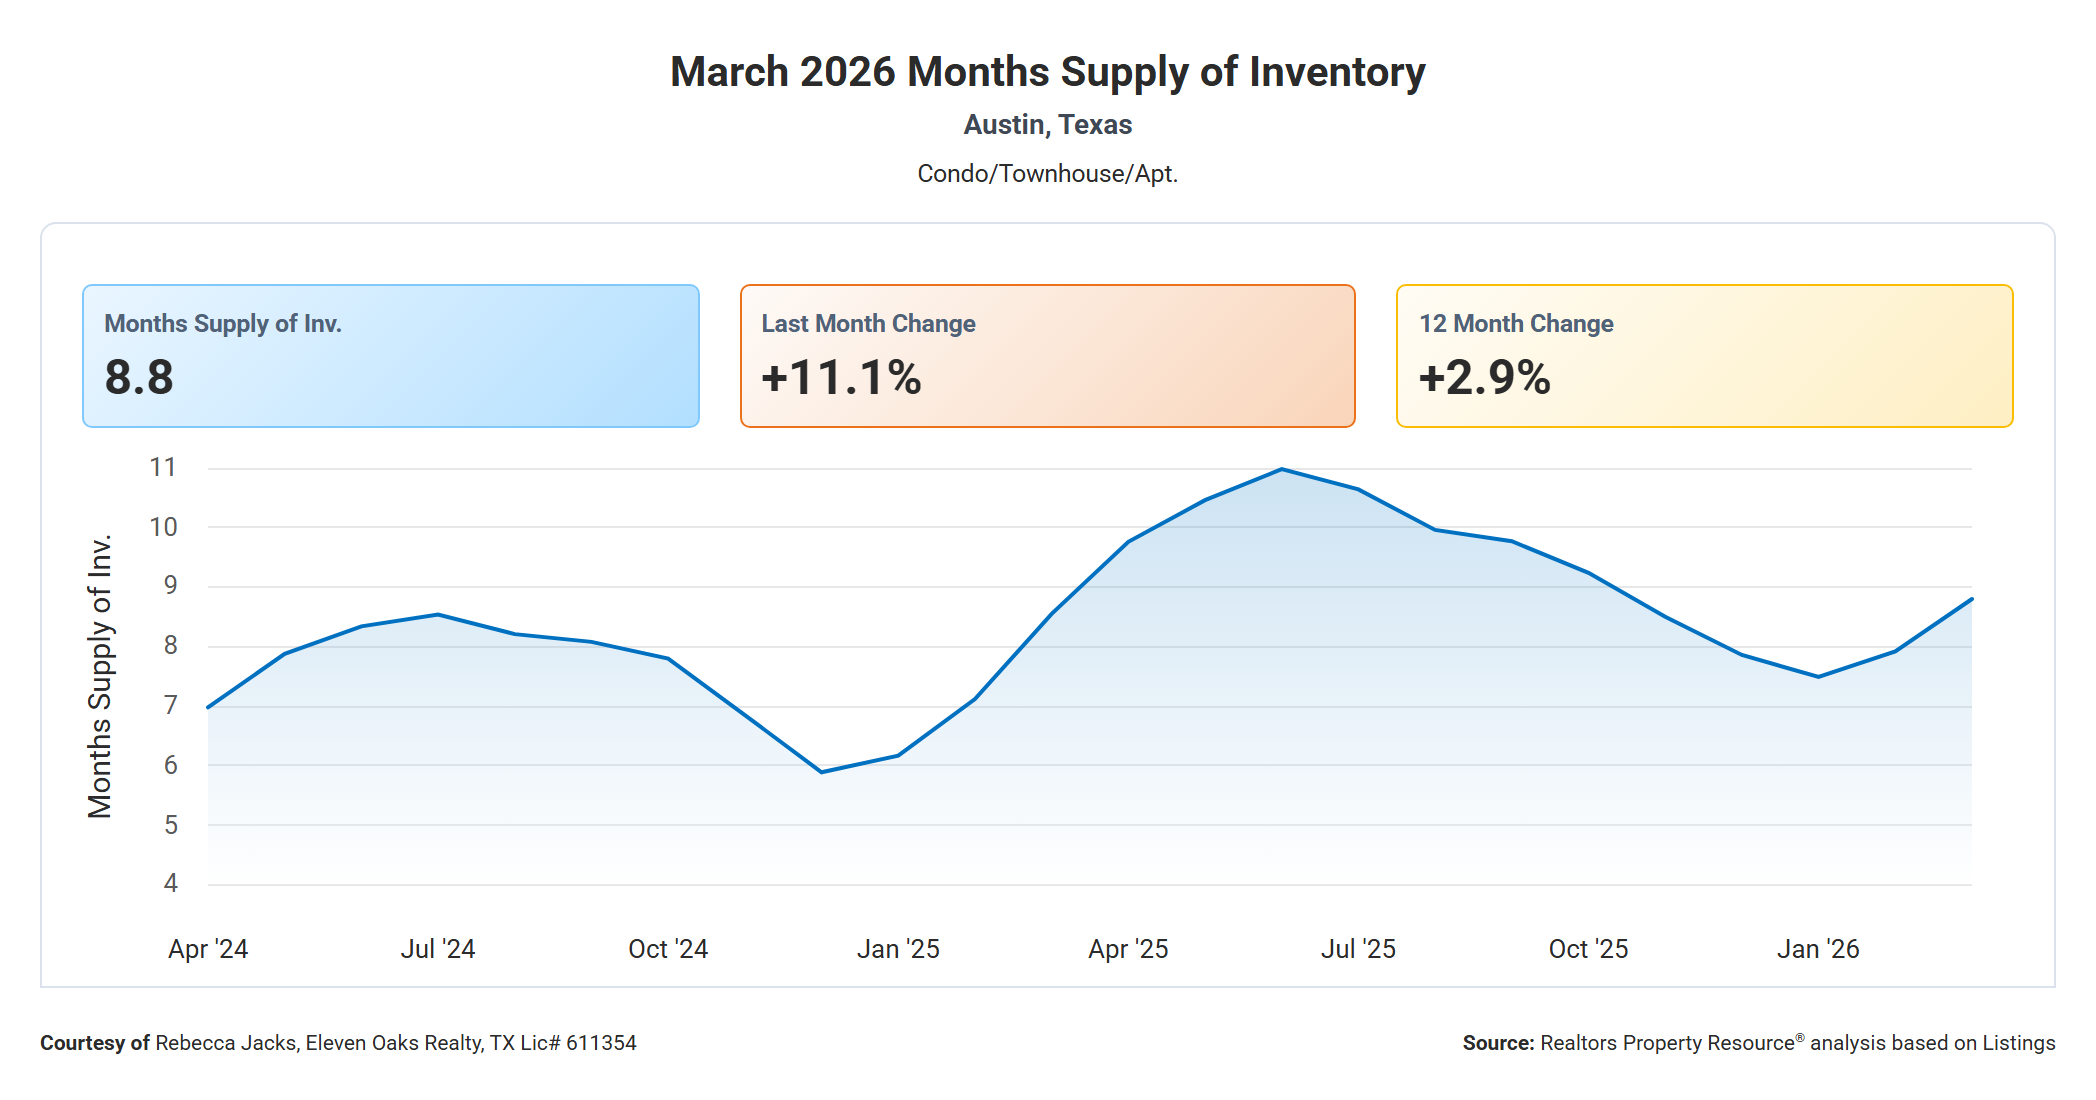
The months supply of inventory for Austin condos in March 2026 was 8.8 months, up 11.1% from February's 7.92 months and up 2.9% from 8.55 months in March 2025. According to Unlock MLS, the current real-time months of supply is 9.2 months as of early April.
The RPR chart shows the trend over the past two years. Inventory supply dipped to its lowest point in late 2024 and early 2025 -- falling as low as roughly five to six months -- before climbing through 2025 and reaching current levels. The 12-month change of +2.9% indicates that while supply is elevated, the year-over-year increase has stabilized compared to the sharper jumps seen earlier in the cycle.
Eight-plus months of supply firmly places this market in buyer's territory. A level above six months generally means buyers have the upper hand in negotiations and can afford to be selective. That said, not every price bracket is equally oversupplied -- the inventory picture varies significantly by price range, which is addressed in a dedicated section below.
Active Listings Up 3.8% Year Over Year

There were 1,443 active condo listings in Austin in March 2026, up 13.6% from 1,270 in February and up 3.8% from 1,390 a year ago.
The two-year RPR chart shows the active listing count bottomed near 1,000 listings in late 2024 and early 2025 before climbing steadily through the spring and summer of 2025. The market pulled back a bit in the winter months before the spring expansion began again in early 2026. The current count of 1,443 is on the higher end of the two-year range and gives buyers one of the strongest selections available in recent memory.
For buyers, that breadth of inventory is an advantage. More listings mean more price points, more locations, and more room to find the right fit without settling. For sellers, more competition means presentation and pricing matter more than ever. A listing that would have attracted multiple offers in a thin-inventory market may sit unnoticed when buyers have 1,400 other options to consider.
New Listings Up 10.7% Year Over Year
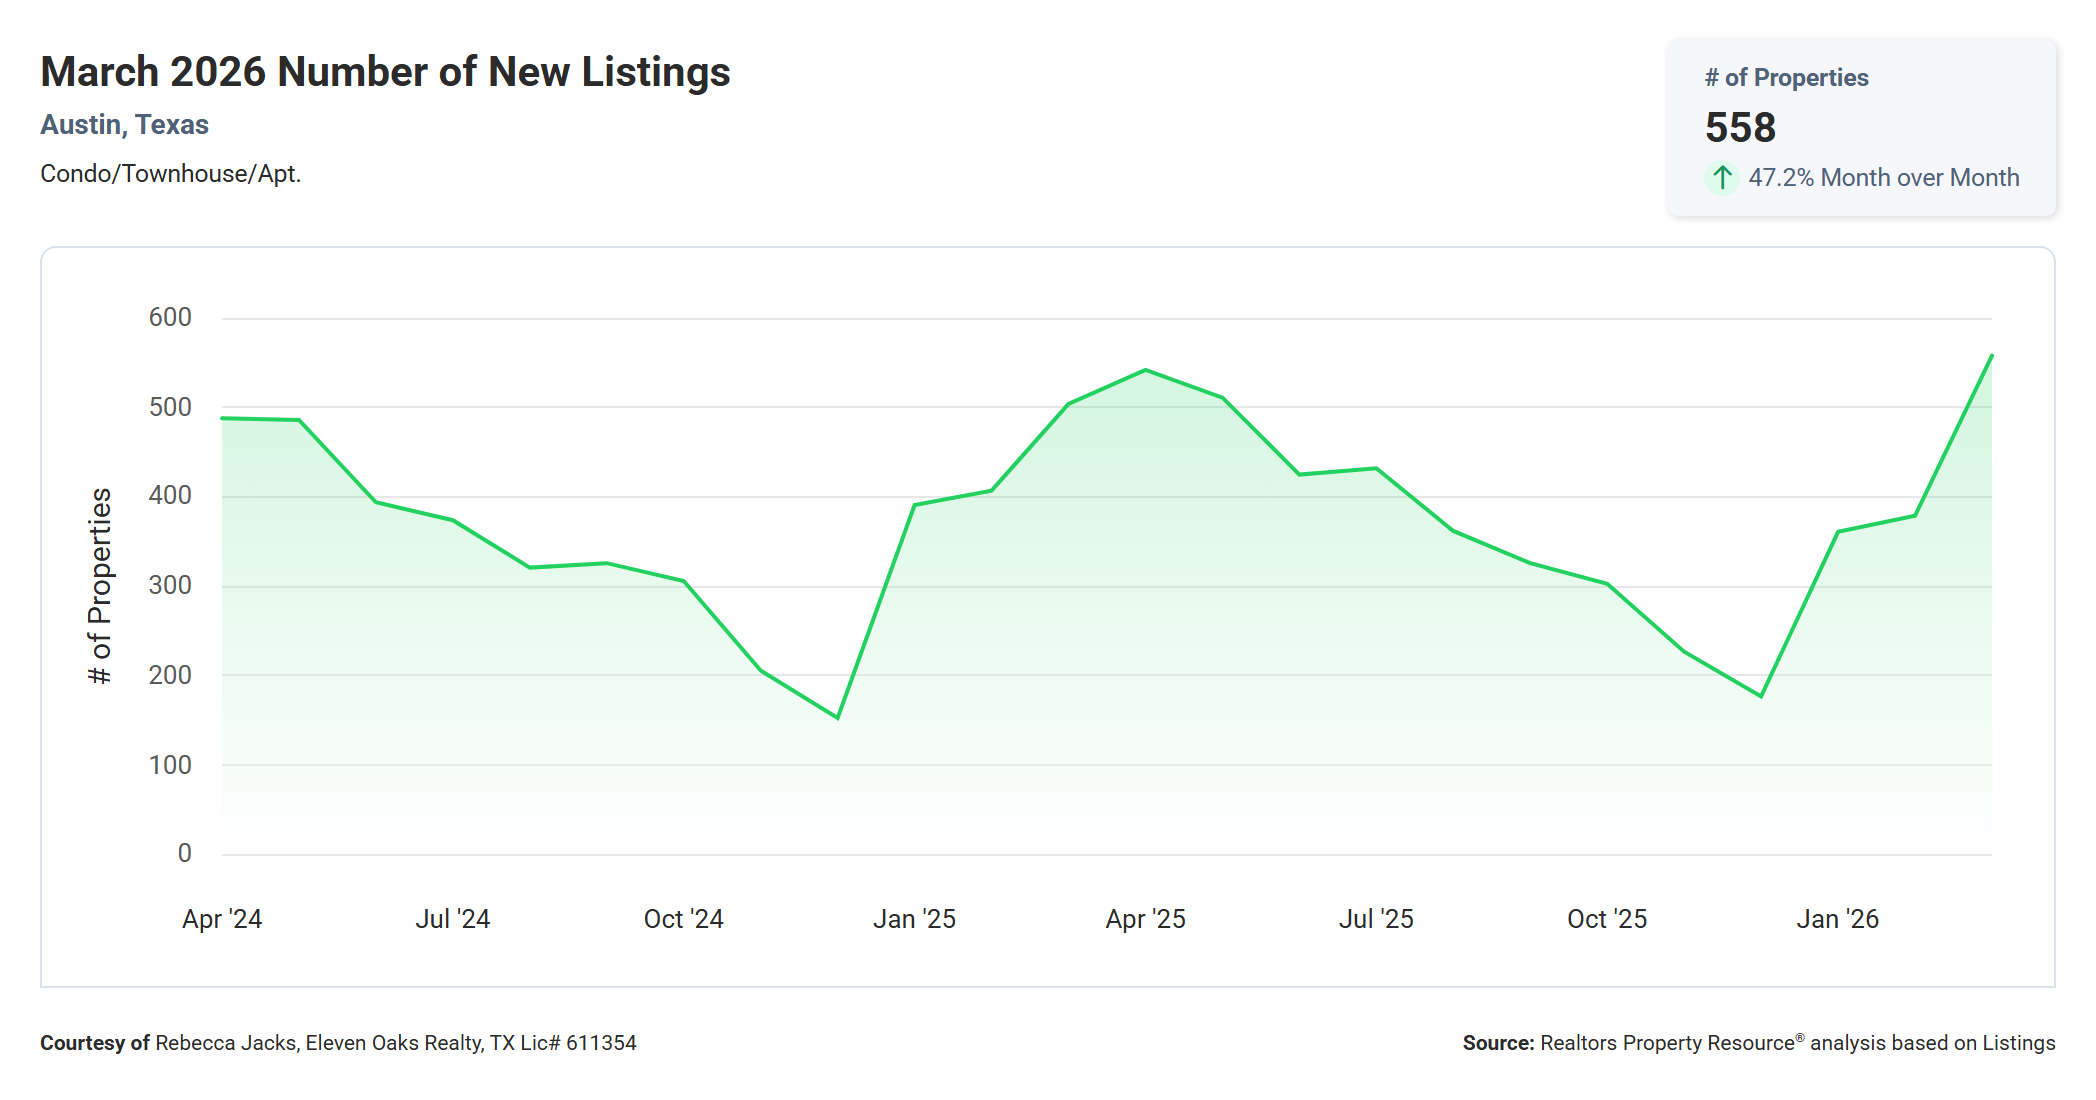
New condo listings hit 558 in March 2026, up 47.2% from February's 379 and up 10.7% from 504 new listings in March 2025. Unlock MLS data confirms a similar trend, showing 521 new listings in March 2026, up 9.0% year over year.
The surge in new listings from February to March is a predictable spring pattern -- sellers who held off during the slow winter months are now entering the market as buyer activity picks up. The two-year chart shows this same seasonal spike happened in March 2025, though the magnitude this year is slightly larger. The year-over-year increase means there are more sellers competing for buyer attention than at this point last year.
For buyers, the wave of new listings is positive news. Fresh inventory gives you first-look opportunities on condos that have not been sitting long enough to carry the stigma of a stale listing. For sellers, the spring flood also means your listing is entering a more crowded field. The condos that get shown and sold early in the season tend to be the ones that are priced and presented well from day one -- the spring window matters.
New Pending Listings Up 19.2% Year Over Year
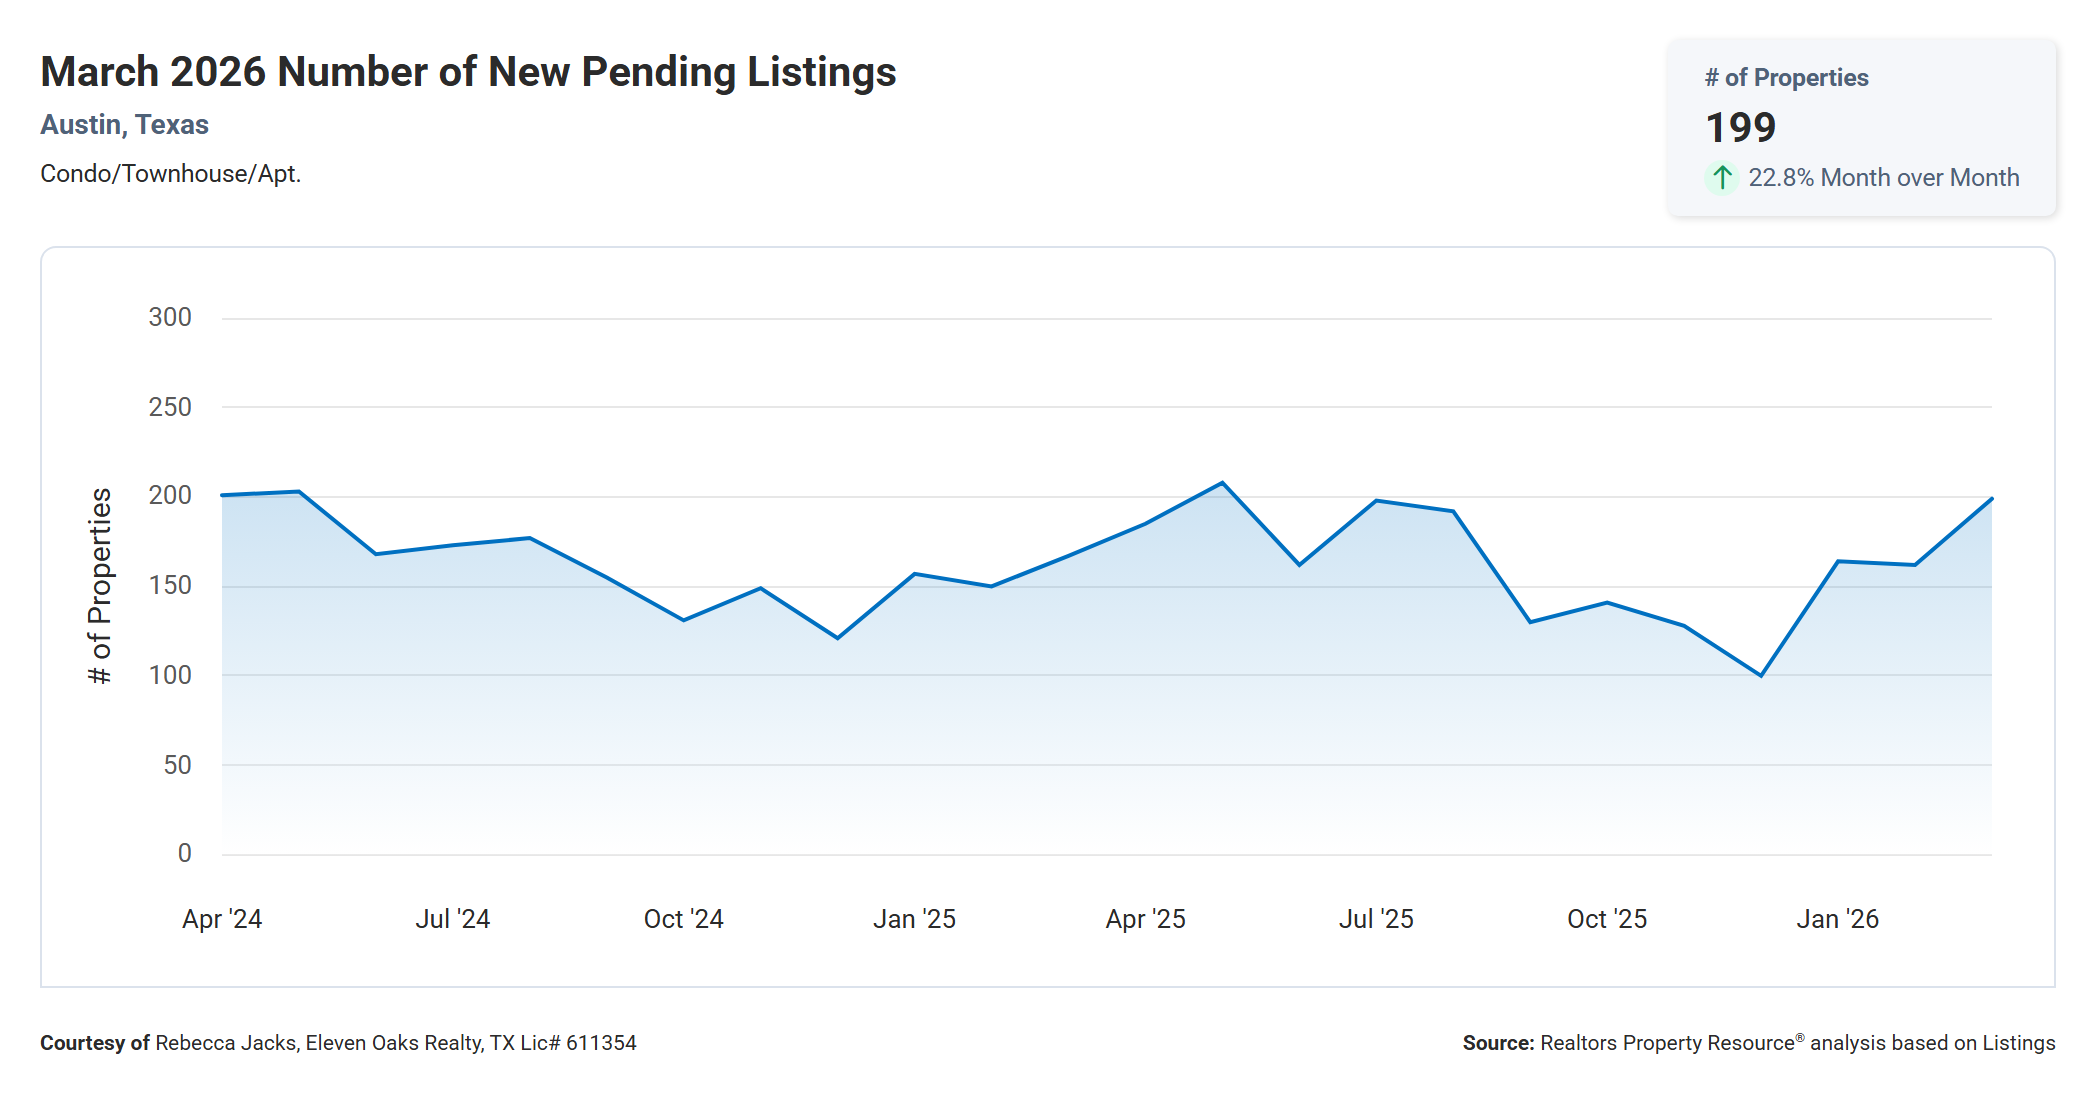
New pending listings reached 199 in March 2026, up 22.8% from 162 in February and up 19.2% from 167 in March 2025. Unlock MLS reports 216 new under-contract properties for March 2026, representing a 33.3% increase from the prior year's count.
This is one of the more encouraging data points in the March report. The year-over-year jump in pending contracts -- regardless of which data source you use, both show a meaningful increase -- indicates that buyer demand is genuinely picking up rather than just appearing to improve because of a favorable comparison month. More buyers going under contract now means more closed sales in April and May, which should support price stability heading into the summer.
For sellers, the rising pending count is validation that buyers are active and willing to commit. For buyers, it is a signal that the window to move deliberately may be narrowing at certain price points. The most popular price brackets are already attracting more competition, as detailed in the "Where Buyers Are Shopping" section below.
Condos Sold Up 7.6% Year Over Year
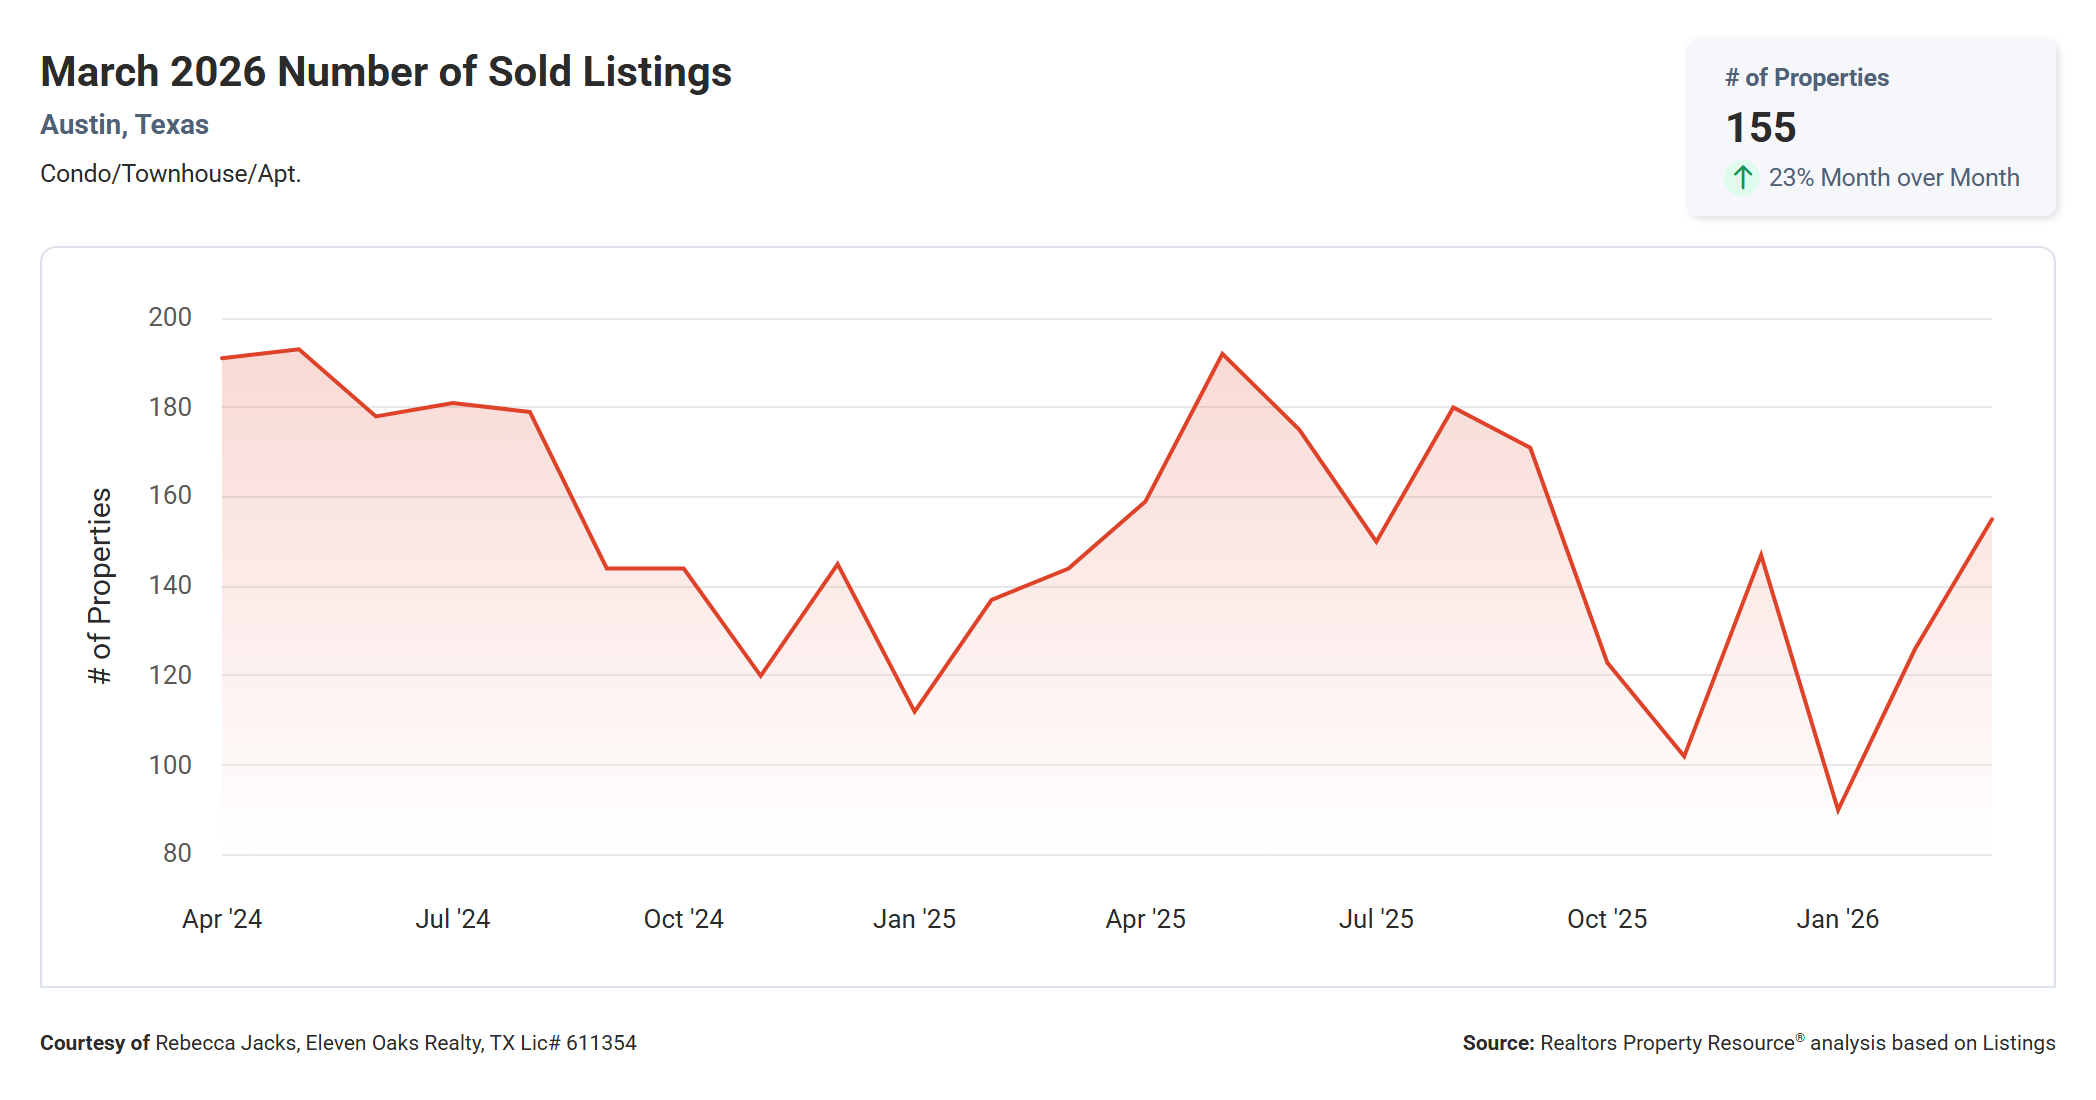
A total of 155 condos sold in Austin in March 2026, according to RPR, up 23% from 126 in February and up 7.6% from 144 in March 2025. Unlock MLS data confirms the positive year-over-year trend, reporting 158 closed transactions in March 2026, up 4.6% from 151 in the same month last year. The ABoR MLS statistics show 160 closed condo and townhome transactions for the month.
The two-year RPR chart tells a story of recovery from a sustained low. Condo sales bottomed in the 100-110 range during the slowest winter months of 2025 and 2026 before rebounding. The spring pickup that began in March is consistent with seasonal patterns, and the year-over-year improvement suggests the market has worked through some of the demand destruction from the 2022-2023 slowdown.
The increase in closed sales is meaningful for the market's overall health. A market with rising sales and broadly flat prices has a better foundation than one where prices appear stable only because activity has dried up. March's combination of more sales, rising pending contracts, and a recovering median price is the healthiest overall picture Austin condos have shown in several months.
Total Sales Volume Up 4.8% Year Over Year
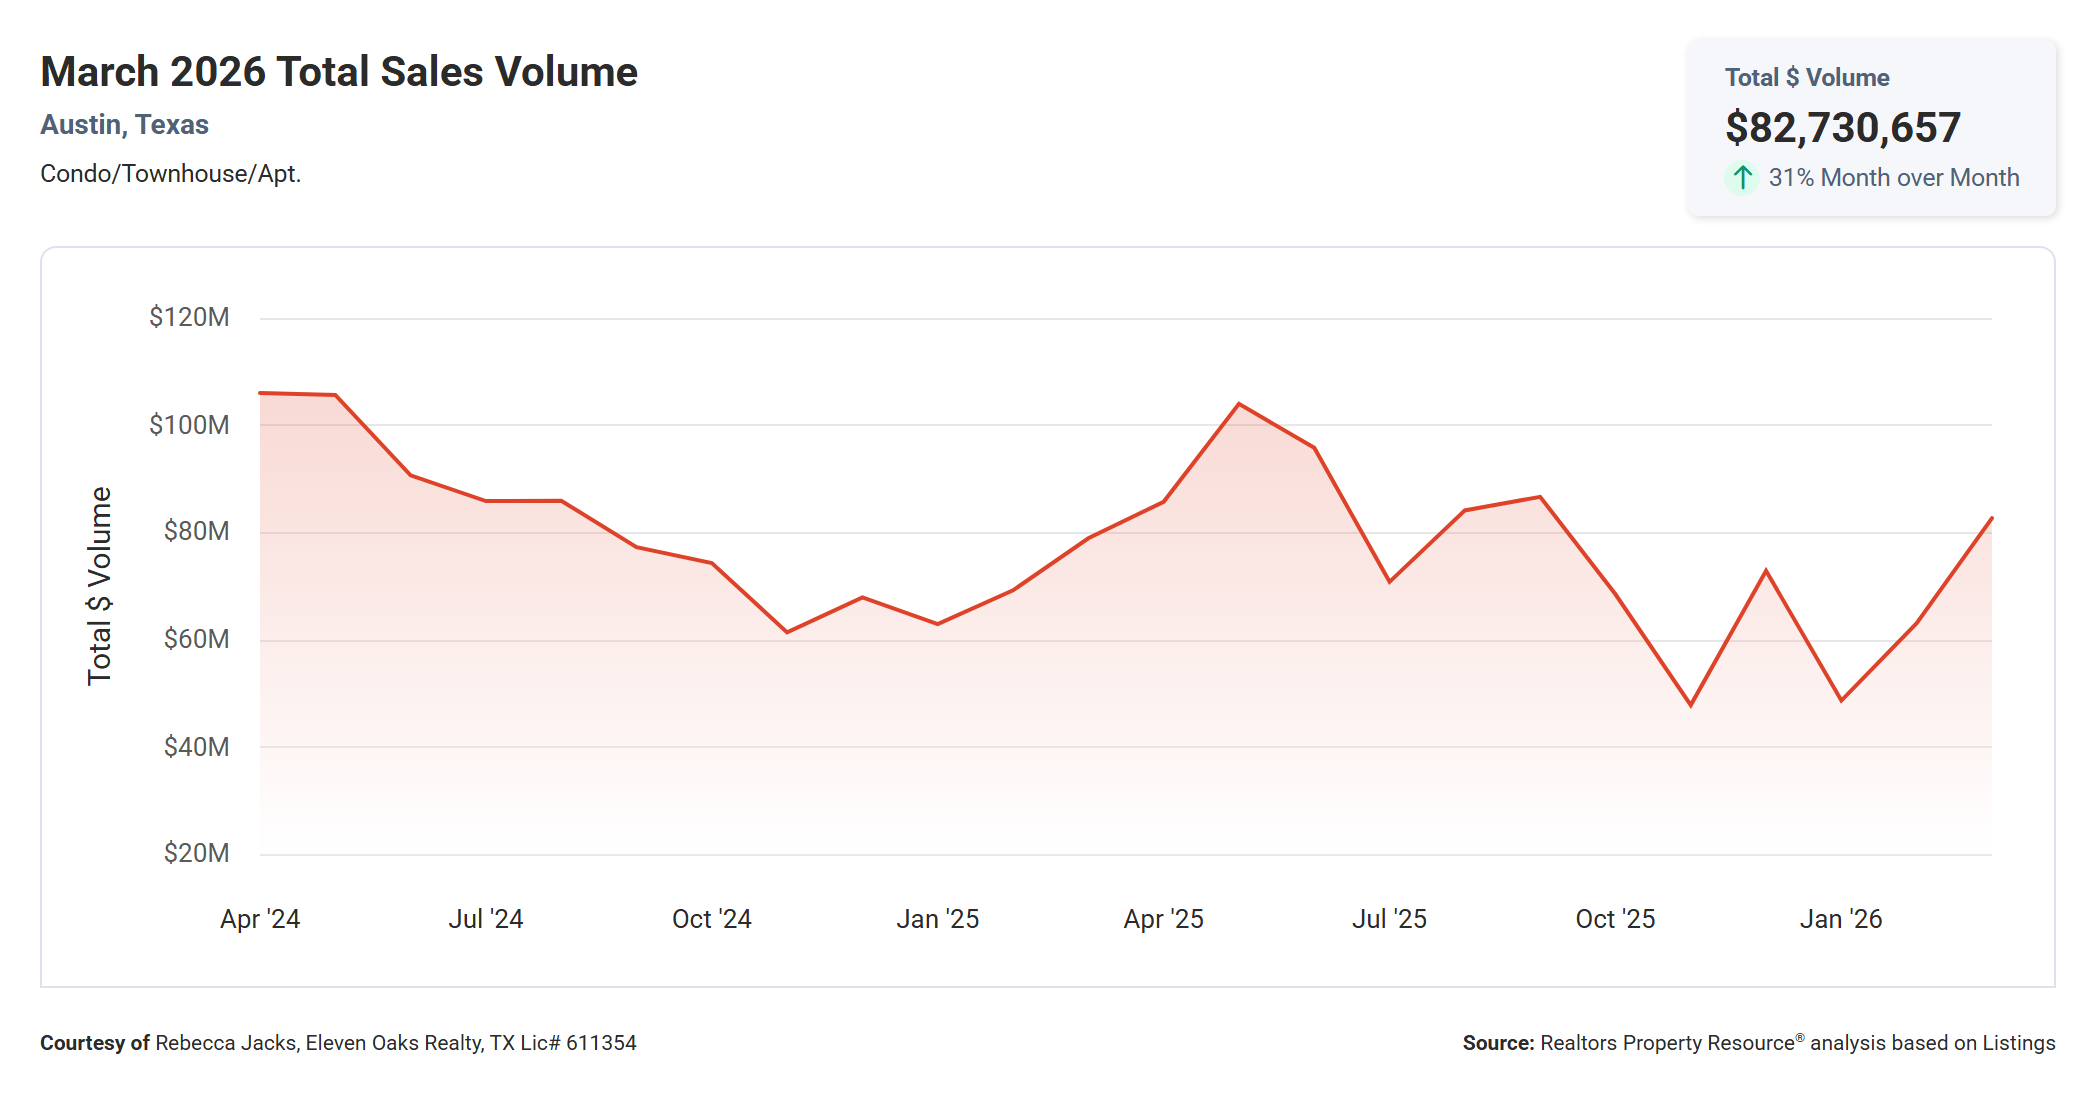
Total sales volume for Austin condos in March 2026 was $82,730,657 per RPR, up 31% from February's approximately $63 million and up 4.8% from March 2025's $78.97 million. Unlock MLS reports a slightly higher total of $82,983,256, while noting that volume was essentially flat year over year based on their own prior-year data. The slight variation between sources reflects differences in transaction counts and methodology, but both sources confirm volume in the low-to-mid $80 million range for March 2026.
The two-year chart shows total volume closely tracking the sales count trend -- volume peaked near $100 million-plus in mid-2024, declined through 2025, and is now recovering. The month-over-month jump from February to March is dramatic in percentage terms but reflects February's unusually slow pace rather than an exceptional March.
For context, reaching $82-$83 million in monthly volume is a reasonable recovery level for the Austin condo market, though it remains below the peak years when monthly volume regularly exceeded $100 million. The combination of more transactions and a recovering median price should push volume figures higher through the spring and summer months if buyer demand continues to build.
March 2026 Austin Condo by the Numbers
The table below is pulled directly from the Austin Board of REALTORS MLS statistics for March 2026 and covers 160 closed condominium and townhome transactions in the City of Austin.
| Min | Max | Avg | Median | |
|---|---|---|---|---|
| Beds | -- | 5 | 2 | 2 |
| Baths | 1 | 6 | 2 | 2 |
| Sq Ft | 301 | 4,096 | 1,483 | 1,310 |
| Lot Sq Ft | -- | 172,715 | 5,900 | 2,570 |
| List Price | $130,000 | $3,195,000 | $544,684 | $402,495 |
| LP/Sq Ft | $137.10 | $1,430.17 | $377.58 | $318.77 |
| Acres | 0.000 | 3.965 | 0.135 | 0.059 |
| Close Price | $145,000 | $3,125,000 | $522,145 | $399,500 |
| CP/Sq Ft | $113.96 | $1,398.84 | $362.42 | $312.07 |
| CP/LP% | 75.00% | 112.00% | 96.41% | 97.00% |
| CP/OLP% | 60.00% | 109.00% | 91.20% | 94.00% |
| ADOM | 0 | 477 | 99 | 73 |
The most expensive condo that sold in March 2026 sold for $3,125,000 and the least expensive condo sold for $145,000. Condos ranged in size from 301 to 4,096 square feet with an average size of 1,483 square feet. The average price per square foot for a condo that sold in Austin in March 2026 was $362.42 with the lowest being $113.96 per square foot and the highest being $1,398.84 per square foot. It took, on average, 99 days to sell a condo in Austin and sellers received, on average, 91.20% of their original list prices.
The difference between the average CP/LP% (96.41%) and the average CP/OLP% (91.20%) reveals where most of the negotiation is really happening. That 5.21-percentage-point gap means sellers are, on average, reducing their asking price by about $28,000 from their original list price before a buyer ever submits an offer. The reduction happens through price drops on the listing, not through buyer negotiation at the contract table. Sellers who start at the right price skip that process and often net more money in the end.
The spread between average and median days on market -- 99 days average versus 73 days median -- tells you the distribution is right-skewed. A meaningful number of condos are sitting well over 100 days, which pulls the average above the median. Most condos that do sell are doing so closer to the 73-day range, but there is a significant tail of difficult-to-sell inventory that is dragging on the market. The presence of that tail reinforces that pricing and presentation matter -- the difference between a 60-day sale and a 200-day sale in this market is almost always a pricing decision made at launch.
Where Buyers Are Shopping: A Look at Price Ranges
The Buyer Demand by Price Range data from Unlock MLS covers 147 closed condo and townhome transactions in March 2026 and shows where buyer activity is concentrated, how quickly different price points are selling, and how much room buyers have to negotiate depending on where they are shopping.
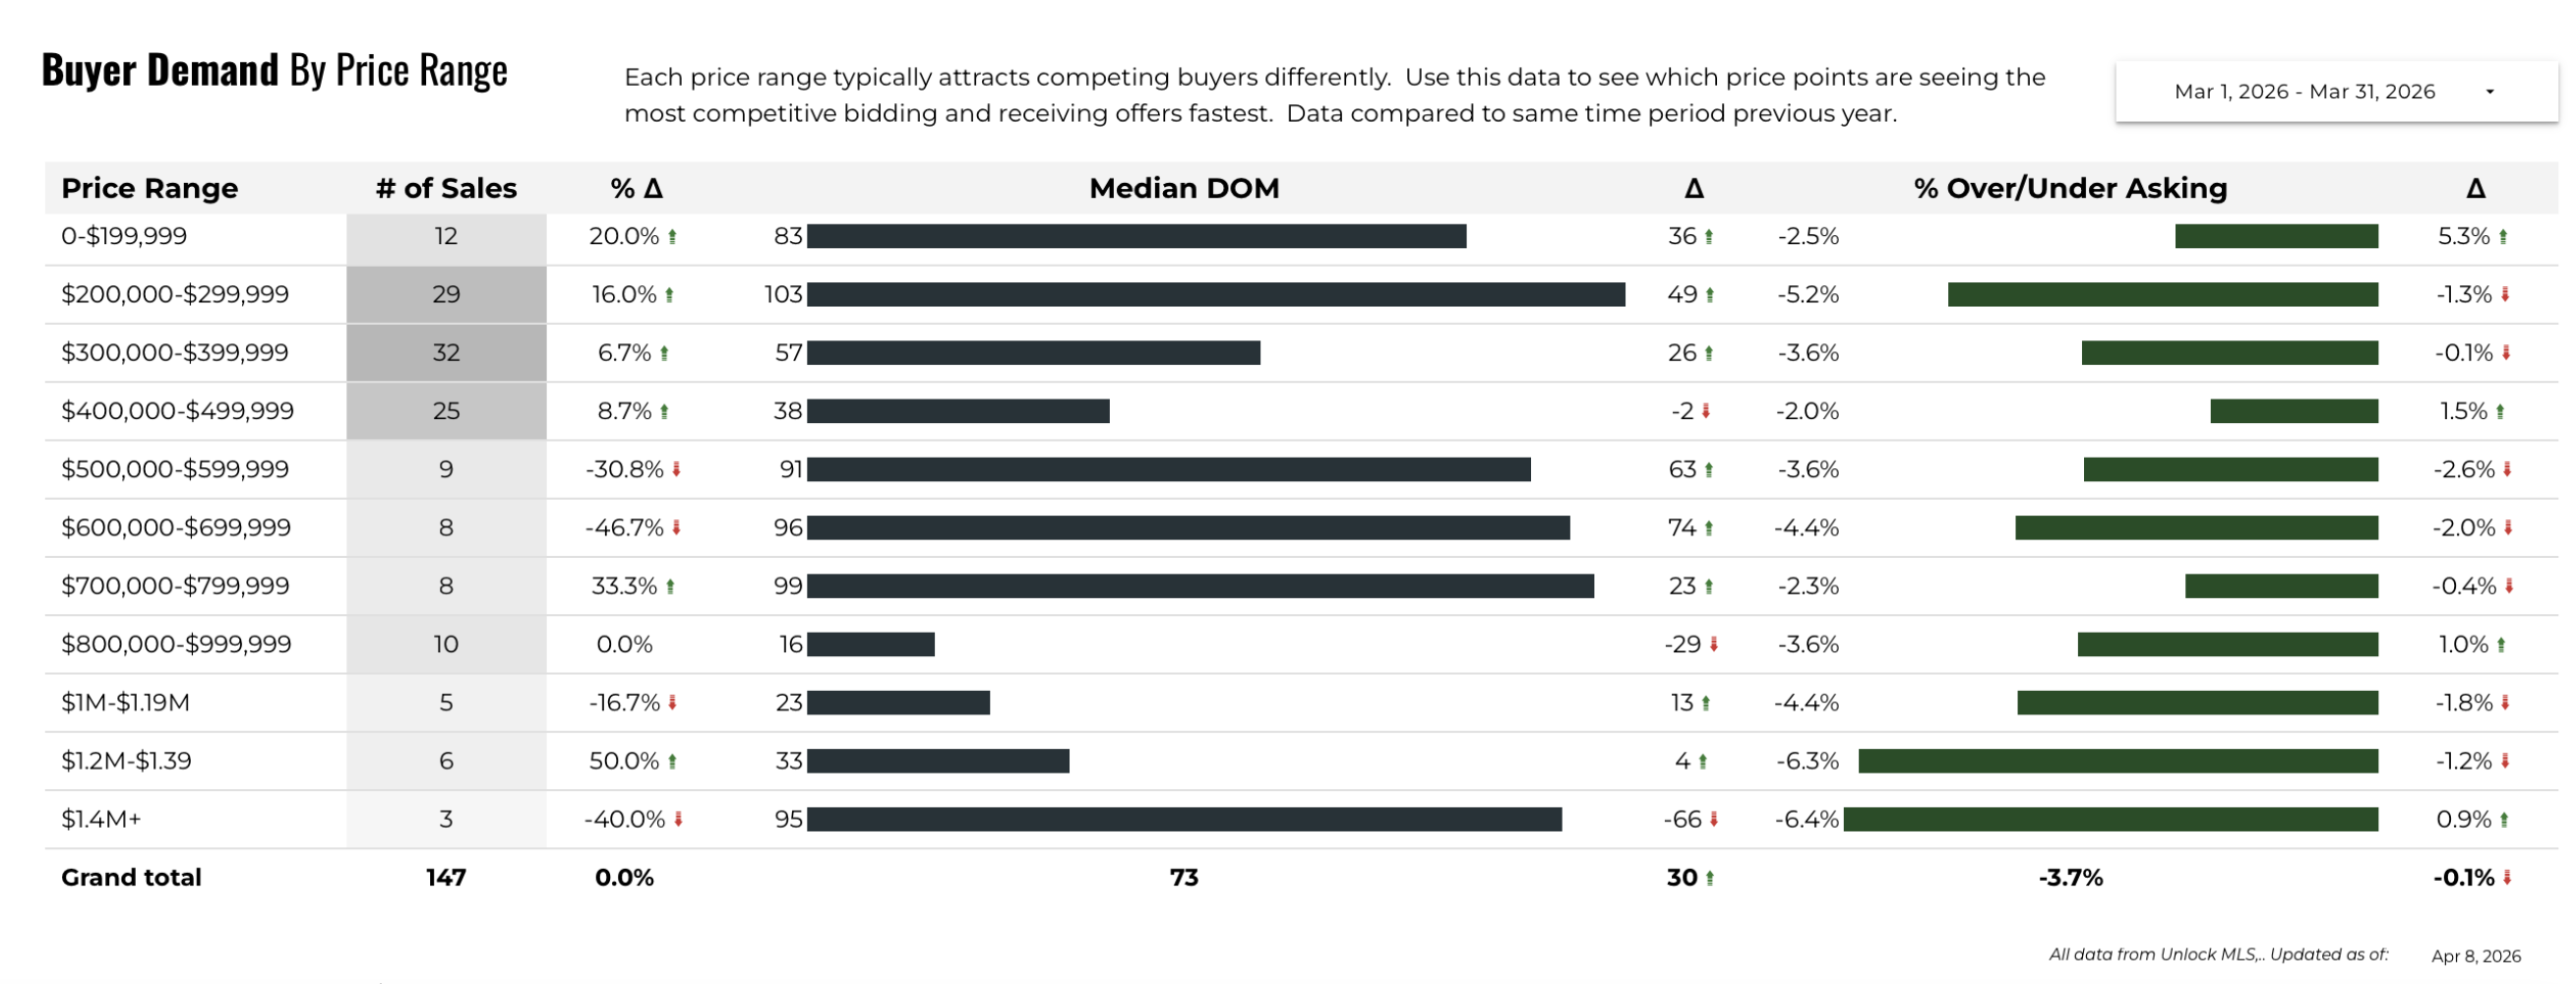
The three most active price brackets were $300,000-$399,999 (32 sales), $200,000-$299,999 (29 sales), and $400,000-$499,999 (25 sales). Those three brackets together accounted for 86 of 147 closed transactions, or about 59% of all condo sales. That concentration tells you where the majority of buyer demand lives: the $200,000-$499,999 range is the core of the Austin condo market right now. Sales in the $300K-$399K range were up 6.7% year over year, and the $200K-$299K bracket was up 16%, indicating that entry-level and mid-tier price points are seeing genuine demand growth.
The fastest-selling price brackets tell an interesting story. The $1.2M-$1.39M range had a median DOM of just 11 days for the 6 transactions that closed, and the $800K-$999K bracket had a median DOM of just 16 days for 10 transactions. These are small sample sizes, but they reflect a pattern where luxury condos with the right pricing can actually move quickly when sellers are realistic. The $400K-$499K range showed a median DOM of 38 days with a year-over-year DOM decrease of 2 days, making it the most efficiently-priced segment of the mainstream market.
The slowest-moving segments are the $200K-$299K range at 103 median days on market and the $600K-$699K range at 96 days. The $600K-$699K bracket was also the hardest hit year over year with a 46.7% drop in sales volume -- less than half the activity from the same period in 2025. Buyers shopping in those two ranges have significant leverage. The $500K-$599K range saw a 30.8% year-over-year decline in sales and a median DOM of 91 days, making it another area where patient buyers can find motivated sellers. On the over/under asking side, the market overall is closing at 3.7% below asking price. The most generous discount available is in the $1.2M+ range at 6.3-6.4% under asking, and the entry-level sub-$200K segment at 2.5% under asking actually worsened for buyers year over year, suggesting modest price competition even at the lowest price points.
The Listing-to-Close Price Gap: What Sellers Need to Know
The difference between what you list a condo for and what it ultimately closes for in this market is larger than most sellers expect -- and understanding it matters before you decide on your launch price. The ABoR statistics for March 2026 show that the average condo closed at 96.41% of its final list price (CP/LP%) but only 91.20% of its original list price (CP/OLP%). That 5.21-point gap between those two figures represents the average price reduction that happened between listing day and contract day.
On a condo originally listed at $544,684 (the average March 2026 list price), a 5.21% reduction from original to close means the seller absorbed roughly $28,378 in price reductions before a buyer made an offer. That is not a reflection of buyer negotiation -- it is the cost of mispricing at launch. The typical pattern is: list high, wait, drop the price once or twice, then accept a contract near the newly-reduced asking price. The seller who starts at market value skips all of that and often nets a similar or better result in less time.
The median figures tell a similar story with less drama. The median CP/LP% was 97% and the median CP/OLP% was 94%, a three-point gap that represents approximately $12,075 on a $402,495 median-list-price condo. Whether you are at the median or the average, the takeaway is the same: the condo market rewards accurate pricing at launch far more than hopeful pricing followed by reductions. In a market where 40% of active listings carry a price drop, standing out as a correctly priced listing from day one is itself a competitive advantage.
Price Drops in the Austin Condo Market
As of early April 2026, 597 of the 1,447 active condo listings in Austin carry at least one price reduction -- that is 41% of all active inventory. The average price drop across those listings is 8%, and sellers are typically waiting a median of 69 days from their original list date before making that first cut. That 69-day wait, followed by an 8% reduction, is a pattern that plays out in hundreds of listings every month and costs sellers time, money, and marketing momentum.
For buyers, the price drop data is a roadmap for finding motivated sellers. Forty percent of active listings have already demonstrated some willingness to move on price, and condos that have been sitting for 60-90 days are often ripe for further negotiation. The $500K-$599K range has the highest price drop rate at 52% of active listings, followed closely by the sub-$200K segment at 49%. These two brackets represent the most seller-motivated inventory in the current market. The $1.4M+ and $1.2M-$1.39M segments have the lowest price drop rates at 22% and 30% respectively, suggesting luxury sellers are more patient -- though those price points also have some of the highest overall supply.
For sellers considering a price reduction, the data on outcomes is sobering. Among the 158 condos that closed in March 2026, 80 of them -- about 51% -- involved at least one price drop from the original asking price to close. The total average reduction from original list to close price among those impacted listings was 14%. Buyers who ultimately purchased these condos paid an average of 86 cents on the original dollar. Listings that dropped their price went under contract after a median of 30 days from the price change, which means cutting price does work -- but it comes at a significant cost. The most effective strategy is the same one the data has supported all year: price it right before the listing goes live.
The "Price Drops Over Time" chart from Unlock MLS adds important context. The average price drop percentage has hovered around 7-8% for much of the last three years with a brief spike toward 10.5% in late 2025. March 2026 came in at 8.0%, roughly in line with the recent range. That consistency tells you this is not a market anomaly -- it is the current operating standard for the Austin condo market, and sellers should plan around it.
2025 Full Year Austin Condo Market Recap
The full year 2025 showed a market working through a prolonged correction. Total condo and townhome sales in Austin came in at 1,809 transactions, down 5.3% from 1,910 in 2024 and continuing a multi-year declining trend from the peak of 3,931 sales reached in 2021. The median sold price for 2025 was $391,000, down 4.0% from 2024's median and marking the third consecutive year of price declines from the 2022 peak of $450,000. Total volume for 2025 was $941.78 million, down 4.7% from the prior year, with the average price per square foot falling to $376 from an implied prior-year figure closer to $395. Median days on market for the year was 56, up from 50 in 2024, as properties took longer to sell across the board.
The seasonal pattern within 2025 was clearly defined. The strongest months were May (192 sales), August (182), June (178), and April (160). The weakest were November (118) and January (113). That pattern is consistent with Austin's typical spring and fall peaks, though the summer strength was somewhat unusual -- generally August cools off, but 2025 saw sustained activity through the summer before the fall pullback arrived earlier than expected. October and November came in below prior-year levels, setting up a soft finish to the year and contributing to the slow winter that carried into early 2026.
Through the first three months of 2026, the trajectory is modestly positive relative to 2025. January recorded 89 sales, February 124, and March 158, for a Q1 total of 371. In the comparable first quarter of 2025, the market logged 95, 138, and 151 sales (January, February, March) for a total of 384 -- so 2026's Q1 is slightly below 2025's pace through February, but March's 158 outpaced March 2025's 151. The improving month-over-month trend suggests the year could track in line with or modestly above 2025 if spring activity holds. The key variable is whether the rise in pending contracts translates into closed sales throughout April and May.
Months of Supply by Price Range
One of the most actionable data points in the March 2026 condo market is how differently supply and demand are balanced across price brackets. Looking at the Unlock MLS inventory data, the overall 9.2 months of supply masks significant variation by price range -- variation that directly affects how buyers should negotiate and how sellers should price.
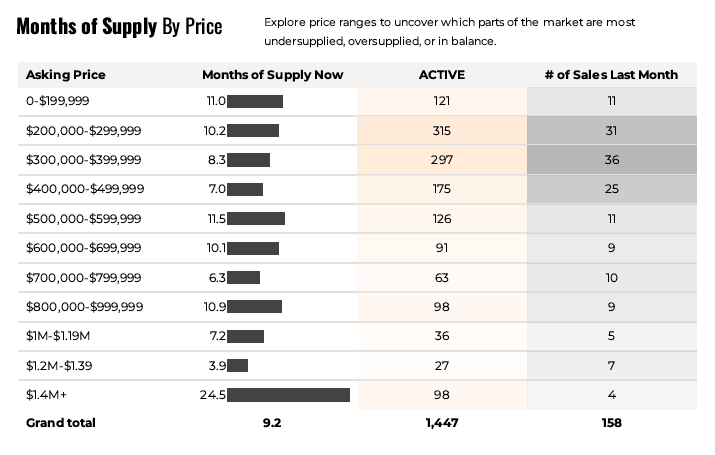
The most competitive segment right now is $1.2M-$1.39M at just 3.9 months of supply. With 27 active listings and 7 sales in the prior month, that bracket is actually in modest seller's market territory. The $700K-$799K segment comes in second at 6.3 months -- roughly balanced -- and the $400K-$499K segment is next at 7.0 months, the tightest of the mainstream price ranges. Buyers shopping in these three brackets should expect less negotiating room and faster-moving competition. The $400K-$499K range in particular is where buyer demand is concentrated, and the 7-month supply level means it is meaningfully tighter than the overall market suggests.
At the other end of the spectrum, the $1.4M+ segment carries a staggering 24.5 months of supply -- more than two years of inventory based on current absorption. There are 98 active listings in that bracket with only 4 sales in the prior month. For buyers willing and able to shop in that range, the leverage is extraordinary. The $500K-$599K range at 11.5 months and the sub-$200K range at 11.0 months are the next most oversupplied segments. The $800K-$999K bracket at 10.9 months and the $200K-$299K range at 10.2 months round out the heavily buyer-favored price points. If you are a buyer in any of those brackets, the data supports patient, strategic negotiating. Sellers in those ranges need to be especially precise on price and condition to stand out in an oversupplied field.
Condo Sale Prices by Bedroom Count
The Housing Breakdown data from Unlock MLS covers 401 closed condo and townhome transactions year-to-date through early April 2026 and provides a useful breakdown of how bedroom count affects pricing in the current market.
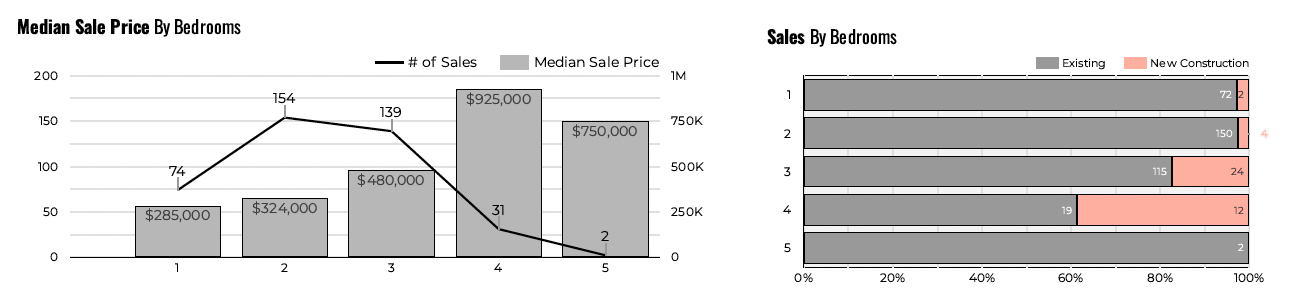
One-bedroom condos had a median sale price of $285,000 based on 74 sales -- the most affordable entry point in the market and a meaningful discount from the overall median. Two-bedroom units were the most popular segment with 154 sales and a median price of $324,000, representing roughly 38% of all transactions. Two-bedroom condos offer the broadest selection, the most consistent trading activity, and the most competitive pricing relative to what buyers are getting in return.
The jump from two bedrooms to three bedrooms is significant: the median price climbs from $324,000 to $480,000, an increase of $156,000 or 48%. For buyers weighing whether to stretch to a three-bedroom unit, that premium buys meaningfully more space -- the average living area for three-bedroom condos is 1,837 square feet compared to 1,192 square feet for two-bedroom units. Whether that trade-off makes sense depends on your specific needs and budget, but the pricing gap is worth understanding before you start touring. Three-bedroom units accounted for 139 sales, nearly as active as the two-bedroom segment.
Four-bedroom condos carry a median price of $750,000 based on 31 transactions, and the five-bedroom units that traded (just 2 sales) came in at a median of $925,000. Those upper-tier units are a small portion of overall activity and represent more unique or luxury condo situations. The Bedrooms Over Time chart from Unlock MLS shows that the long-term price trajectory across all bedroom counts has been declining since the 2022 peak, with the 2026 figures coming in below every comparable year back to at least 2021. One-bedroom units, at $285,000, have actually seen some of the sharpest relative declines and represent a genuine value opportunity for buyers who do not need additional bedrooms.
Market Summary and Outlook
March 2026 was a transitional month for the Austin condo market -- not a breakout, but a meaningful step forward from the slow winter. Sales jumped 23% month over month, pending contracts climbed 22.8%, new listings surged 47%, and the median price recovered to $399,000 after dipping to $379,500 in February. Those are all signs that the spring market is activating as expected and that buyers who were sitting on the sidelines are beginning to move. The market remains in buyer's territory at 8.8 months of supply, but the directional momentum in March was positive.
Year over year, the picture is more mixed. The median sold price is down 6.3%, days on market are up 65.9%, and the average condo is closing at 91.2% of its original list price. That combination tells you the market has repriced from its 2024 highs and has not yet found a new stable floor. Prices appear to be recovering after bottoming in mid-to-late 2025, but the recovery is gradual and uneven across price brackets. The strongest year-over-year performance came in the $200K-$299K and $300K-$399K segments, where demand held up relatively well. The most challenged segments -- $500K-$699K -- saw 30-47% year-over-year declines in closed sales.
The key variable heading into spring is whether the rise in pending contracts from March translates into sustained closed sale volume through April and May. Those are typically the strongest months for Austin condos, and if the 216 under-contract properties from March close as expected, April could post the highest monthly sales figure since mid-2025. The wildcard is how interest rates and broader economic conditions affect buyer confidence over the next 60-90 days. The supply of well-priced condos is growing as sellers respond to the spring demand signal, which creates a healthy competitive environment.
Austin condos are not returning to the hyper-activity of 2021-2022 anytime soon, and the data does not suggest that is the next chapter. What the data does suggest is a market that is slowly stabilizing after a meaningful correction, with prices now closer to sustainable levels relative to income and comparable markets. For buyers, current conditions represent a combination of declining prices, healthy inventory, and less competition than at any point in the last four years. For sellers who price correctly, the spring window is real and the buyer pool is active. The market is rewarding discipline from both sides.
Time to Buy? Time to Sell?
For buyers, the case for acting in the current market is grounded in the data. Prices are down 6.3% year over year, inventory is at one of the highest levels in recent memory with 1,443 active listings, and buyers are closing at an average of 91.2% of original list prices. The combination of lower prices, more selection, and real negotiating room is a profile that has not existed in the Austin condo market since well before the pandemic. If your financial situation supports a purchase, waiting for conditions to improve further carries the risk of rising prices as the market recovers -- the bottom of the price cycle is typically only identifiable in hindsight.
For sellers, the spring 2026 market is the most favorable selling window since mid-2024. Pending contracts are up significantly year over year, buyers are active, and the month-over-month price recovery in March suggests demand is absorbing supply at current price levels. The window is real, but it comes with a condition: your listing needs to be priced at market from day one. The 40% of active listings currently carrying price reductions tells you the market does not forgive optimistic pricing, and the sellers who wait for a buyer to talk them down almost always end up netting less than the sellers who price accurately at launch.
For sellers who can wait, the next 60-90 days will be telling. If April and May close volume comes in above 150-170 sales per month, and the pending contract pipeline holds, there is a reasonable case that prices in the $350K-$450K range could firm up modestly by summer. The data to watch is the months-of-supply figure -- if it pulls back from 8.8 toward the six-to-seven-month range by May, it signals that supply and demand are rebalancing. If supply keeps climbing while pending volume softens, the current recovery may stall. Either way, the spring window is open now, and the data suggests acting on it rather than waiting for certainty that may not arrive.
Action Items for Buyers
- Get pre-approved before you start touring, because the $400K-$499K and $700K-$799K price brackets are moving faster than the overall market average, and pre-approval lets you move quickly when the right listing appears.
- Study the months-of-supply data by price bracket and target your search toward the oversupplied segments -- particularly $500K-$599K (11.5 months), $200K-$299K (10.2 months), and $1.4M+ (24.5 months) -- where you have the most negotiating leverage and the fewest competing buyers.
- Look specifically at listings that have been on the market for 60-plus days with at least one price reduction, because 41% of active inventory currently fits that description and those sellers have already demonstrated willingness to move on price.
- Use the median DOM by price bracket as a guide for how urgently to act: the $400K-$499K segment has a median DOM of 38 days and you should move decisively in that range, while in the $200K-$299K segment (103 median DOM) you have more time to be deliberate.
- Check whether your target listings closed within the last 90 days and compare their close-to-original-list-price ratio against the 91.2% market average, because listings that are priced above that implied value are good candidates for negotiating offers below asking.
- Consider the bedroom configuration carefully given the pricing data: two-bedroom condos at a $324,000 median represent the strongest value-to-activity combination in the market right now, while the jump to a three-bedroom unit carries a $156,000 premium that may or may not be justified depending on your space needs.
Action Items for Sellers
- Price your condo based on March 2026 closed sales data -- not 2024 peak prices -- because the market has repriced downward 6.3% year over year and buyers are well-informed about where condos are actually trading.
- Commit to your launch price and avoid starting high with a plan to reduce, because the data shows sellers who cut price wait a median of 69 days before doing so and then close at an average of 86% of their original ask, while correctly priced listings avoid all of that.
- Identify your competition in the active listing pool and differentiate on condition and presentation, because there are currently 1,443 active condos competing for buyers and yours needs to stand out from day one.
- List before the spring wave peaks -- typically mid-May in Austin -- because new listings surged 47% in March and competition from other sellers will only increase through April, while buyer demand is strongest early in the spring season.
- If you are in the $300K-$499K price range, lean into the data showing those brackets have the highest buyer activity and the lowest months of supply relative to the overall market, because a well-priced condo in that range should realistically sell within 40-60 days.
- Prepare for the negotiation on original list price, not just the final asking price, because buyers are researching CP/OLP% data and know the market average is 91.2% -- understanding your pricing strategy on that metric will help you negotiate confidently when offers come in.
Final Word on the Austin Condo Market
The Austin condo market in March 2026 rewarded buyers who were patient enough to wait for this moment. Prices are down meaningfully from 2024 highs, inventory is abundant, and the negotiating environment is among the most favorable buyers have seen in years. It is not a market that punishes buyers for being thoughtful or deliberate -- a 73-day median time to sell means most condos are available long enough for you to do your research and make an informed decision.
The numbers collectively tell a story of a market that overshot on the upside through 2021-2022, corrected more aggressively than most predicted, and is now in the early stages of stabilizing. The 2025 full-year median of $391,000 and the March 2026 median of $399,000 suggest prices have found a floor somewhere in the $375,000-$400,000 range. The question of whether prices recover meaningfully from here, hold steady, or continue lower will be answered by the supply-demand balance over the next two to three quarters. Based on the data available today, the balance is improving -- slowly, unevenly, and with meaningful differences by price bracket -- but improving.
For both buyers and sellers, the most important thing right now is to make the decision that fits your life and your financial situation, and to make it based on the data rather than on hope or fear. If buying a condo in Austin is the right move for you, this market has real advantages that may not exist in 12 months. If selling is the right move, the spring window is open and buyers are active. Reach out to Rebecca Jacks and the team at Eleven Oaks Realty to talk through your specific situation. Call or text (512) 827-8323 or email info@11OaksRealty.com.
Questions About the March 2026 Austin Condo Price Report?
Have questions about what the March 2026 Austin Condo Price Report means for your specific situation? We are happy to help. If you are thinking about buying a condo in Austin, our Buyers page has resources to help you understand the process and get started. If you are thinking about selling, our Sellers page walks through what to expect in today's market.
Reach out to Rebecca Jacks and the team at Eleven Oaks Realty. Call or text (512) 827-8323 or email info@11OaksRealty.com. We have been helping buyers and sellers since 1978 and we are here to help you make the best decision for your situation, whatever that looks like.
Data sources: Realtors Property Resource (RPR), Austin Board of REALTORS MLS, Unlock MLS. All figures are for condominiums and townhomes in the City of Austin. Reported figures reflect March 1, 2026 through March 31, 2026. Some variation between data sources may exist due to differing methodology and timing of data pulls.




Leave a Reply