
Eleven Oaks Realty is proud to present their August 2026 Austin Real Estate Price Report measuring activity in the single family home market.
August brought a clear slowdown after a busy summer. Sales fell 12.4% from July, new listings dropped 15.9%, and the typical home sat on the market for 66 days, 40.4% longer than the month before. At the same time, the median sold price held its ground and even rose 2.5% to $615,000. Below, we break down what happened across pricing, inventory, and buyer demand across Austin last month, and what each of these numbers means if you are buying or selling right now.
All data below covers single-family residential homes in the city of Austin. Data is sourced from Realtors Property Resource (RPR) and the Austin Board of REALTORS MLS. Some metrics may vary slightly between sources due to differing methodology; where differences exist, they are noted.
The Austin Real Estate Market is a Seller’s Market
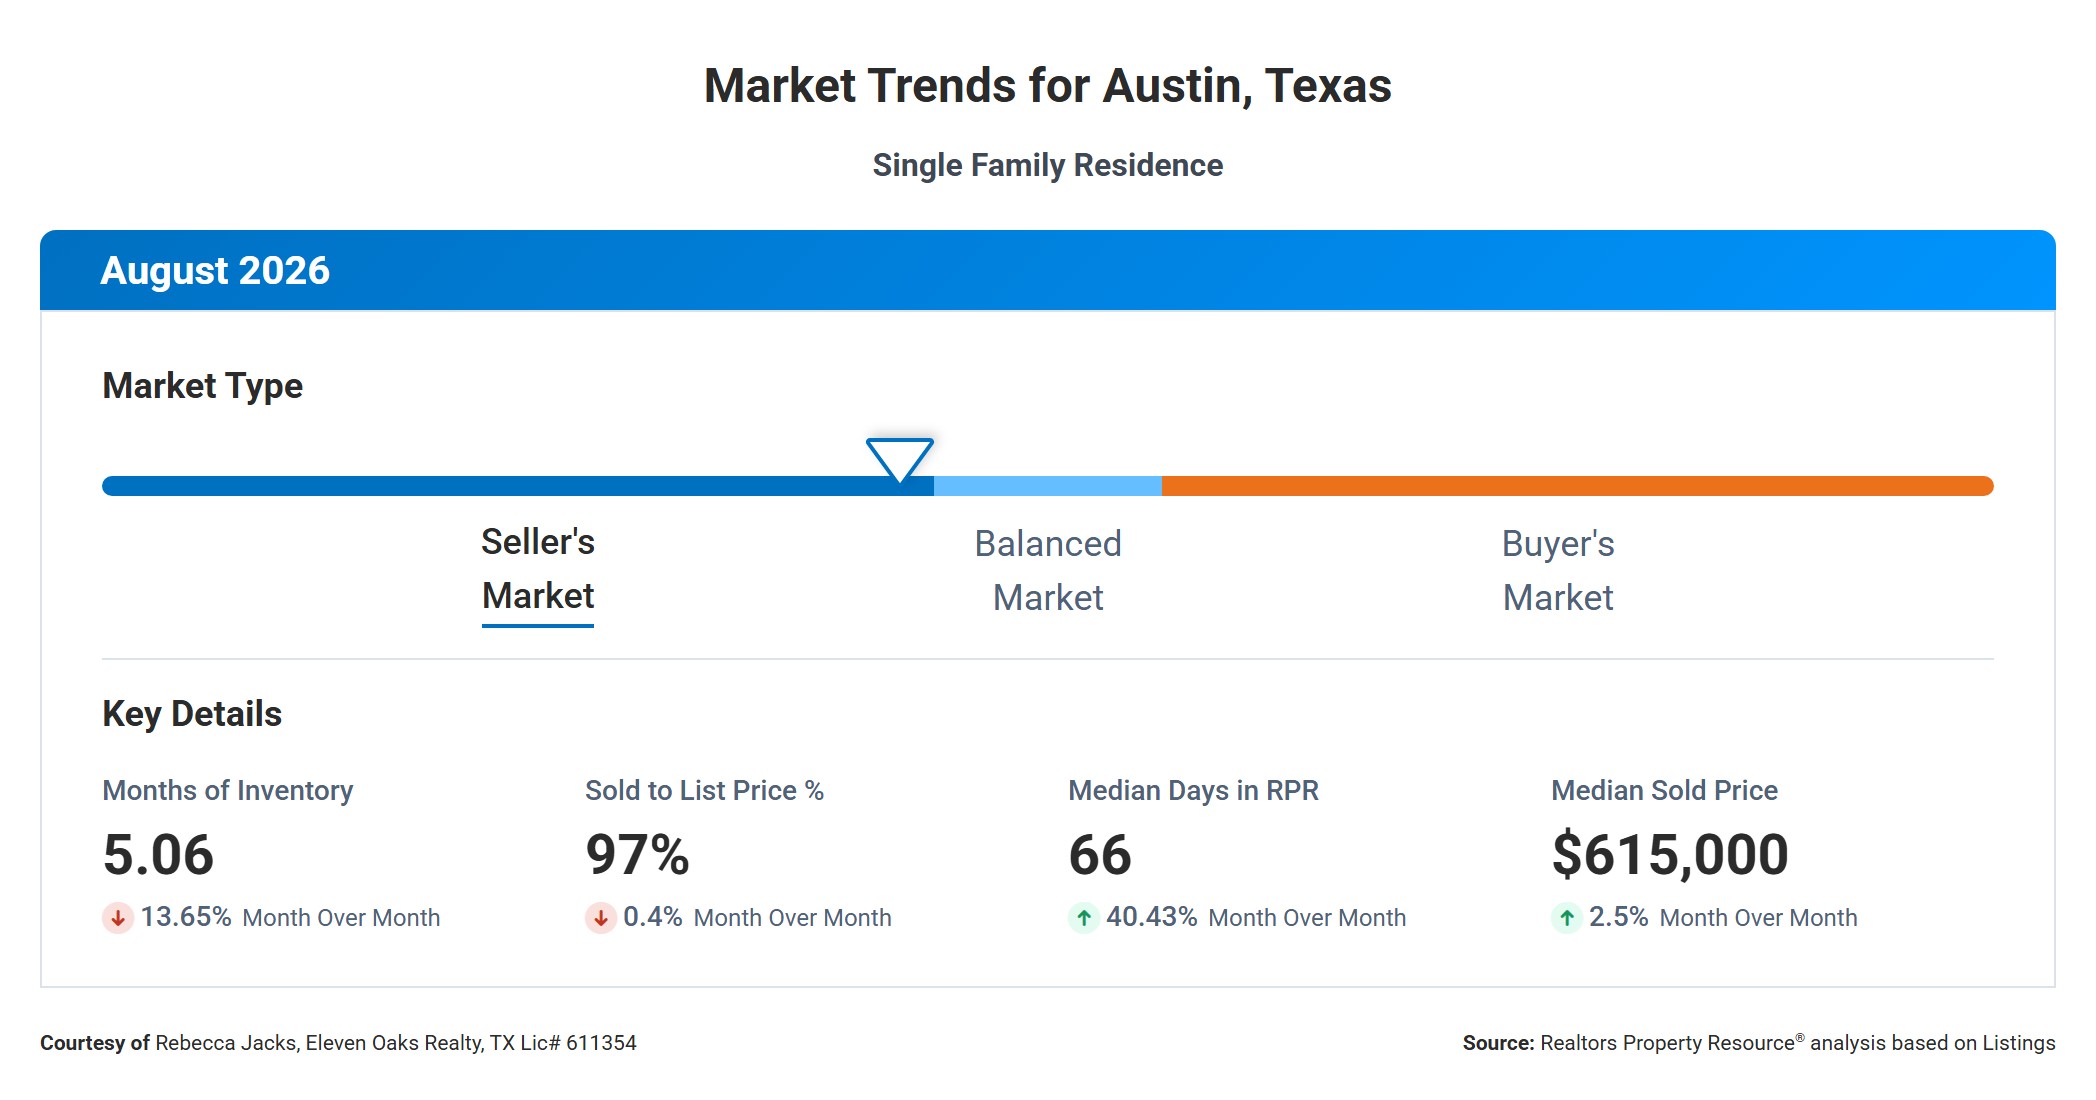
RPR classifies Austin as a Seller’s Market heading into fall, with 5.06 months of supply on the ground for single family homes. That figure dropped 13.7% from July, meaning the pool of available homes shrank even as fewer buyers were closing deals, a sign that new listings pulled back faster than demand did.
The other three dashboard metrics tell a mixed story. Homes sold for 97% of list price on average, down just 0.4% from July and essentially flat compared to a year ago. The median days a home spent on the market before an offer jumped 40.4% month over month to 66 days, and the median sold price rose 2.5% to $615,000.
Put together, these four numbers describe a market that cooled its pace without cooling its prices. Fewer homes changed hands and they took longer to do it, but sellers who priced correctly still got close to full asking value.
Median Sold Price Down 2.4% Year Over Year
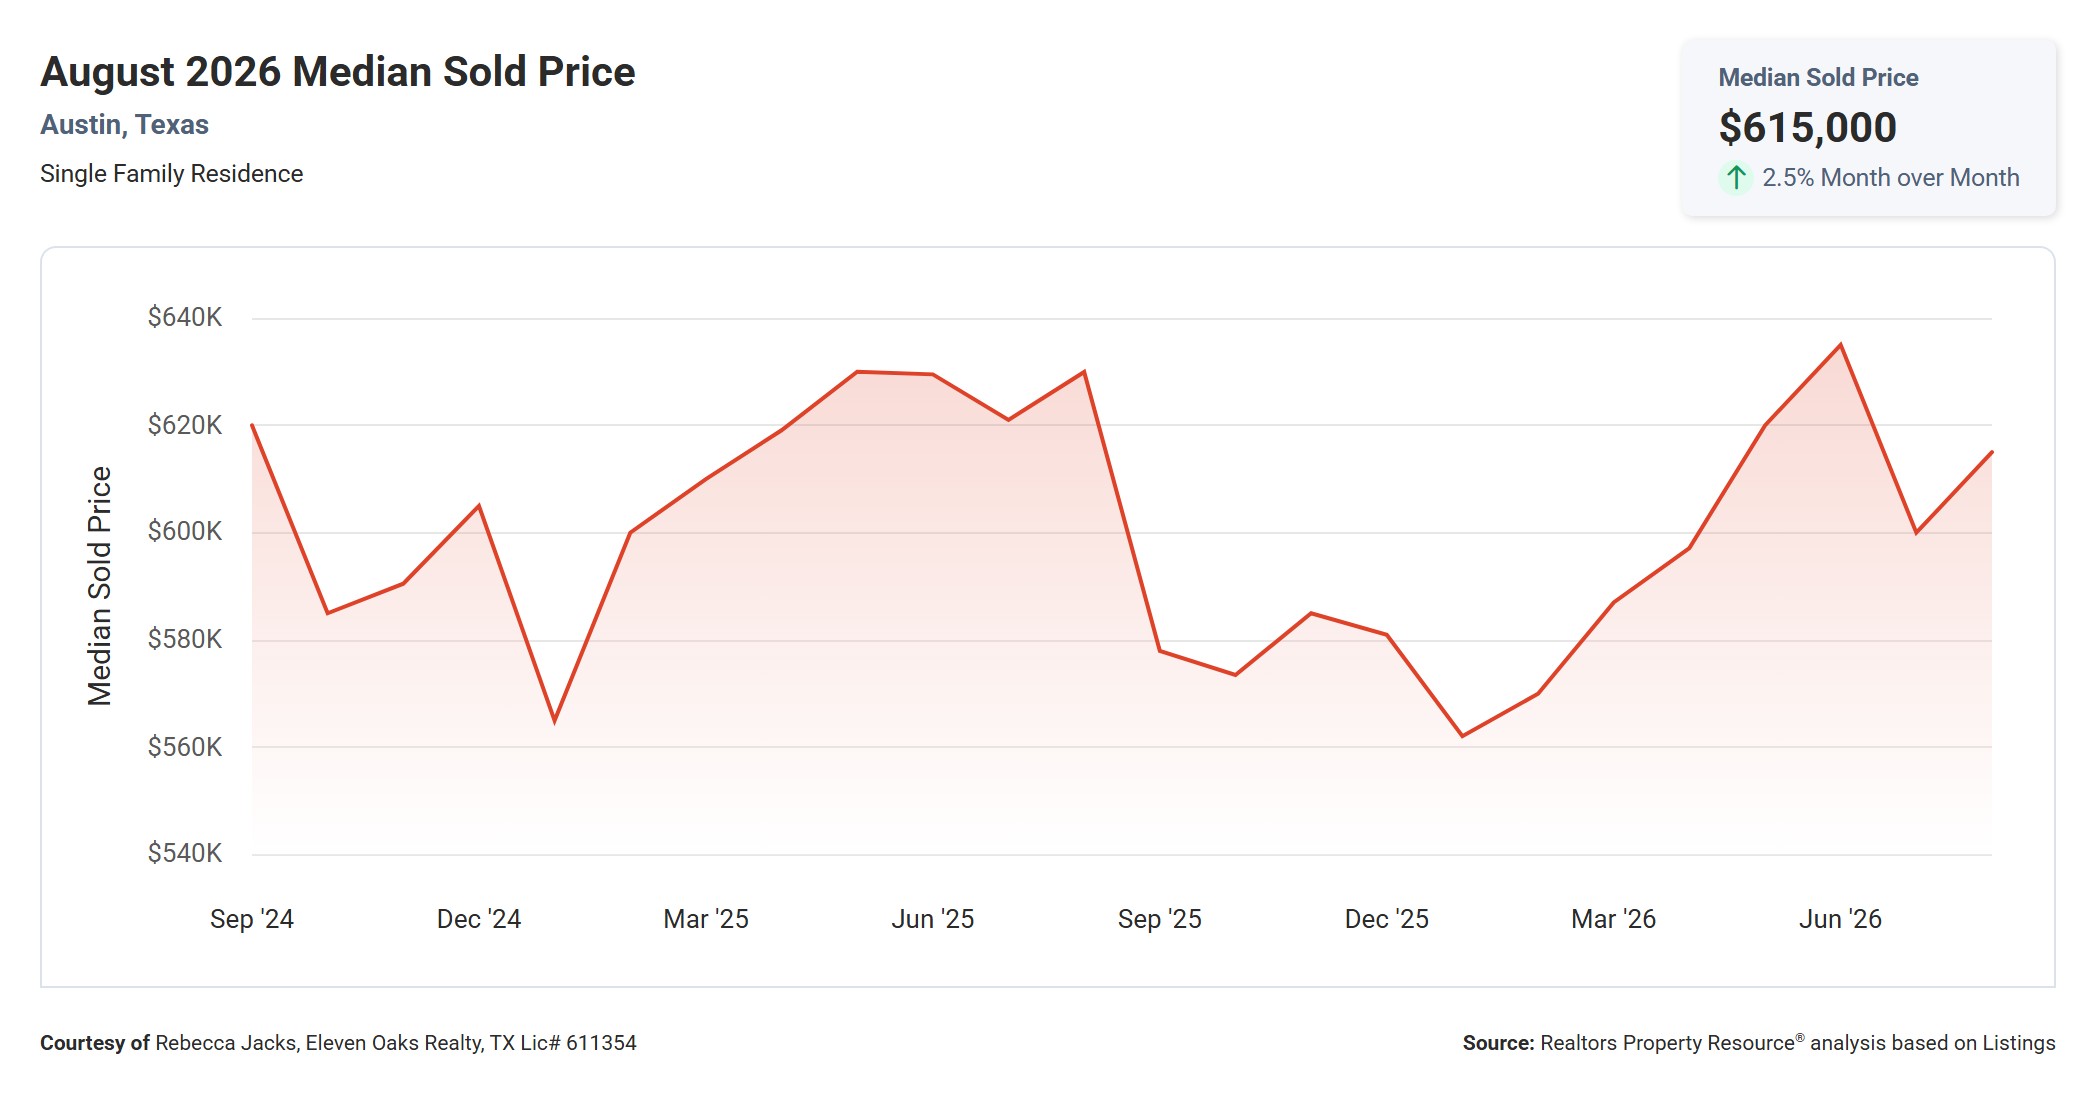
The median sold price for a single family home in Austin was $615,000 in August, up 2.5% from July and down 2.4% from $629,950 a year ago.
Looking back over the past two years, August’s price sits in the middle of a familiar seasonal pattern, well below the $635,000 peak from June but above the $600,000 to $605,000 lows seen at the start of this year and last December. For buyers, the year over year dip means Austin homes are still priced a bit below where they stood in August 2025, even with the monthly bounce.
The month over month increase suggests the properties that did close in August skewed toward higher price points, which lines up with the drop in overall sales volume. Watch this number closely heading into the fall; if it keeps climbing while sales volume keeps falling, that points to a market where fewer, pricier homes are driving the average.
Median Active List Price Down 4.8% Year Over Year
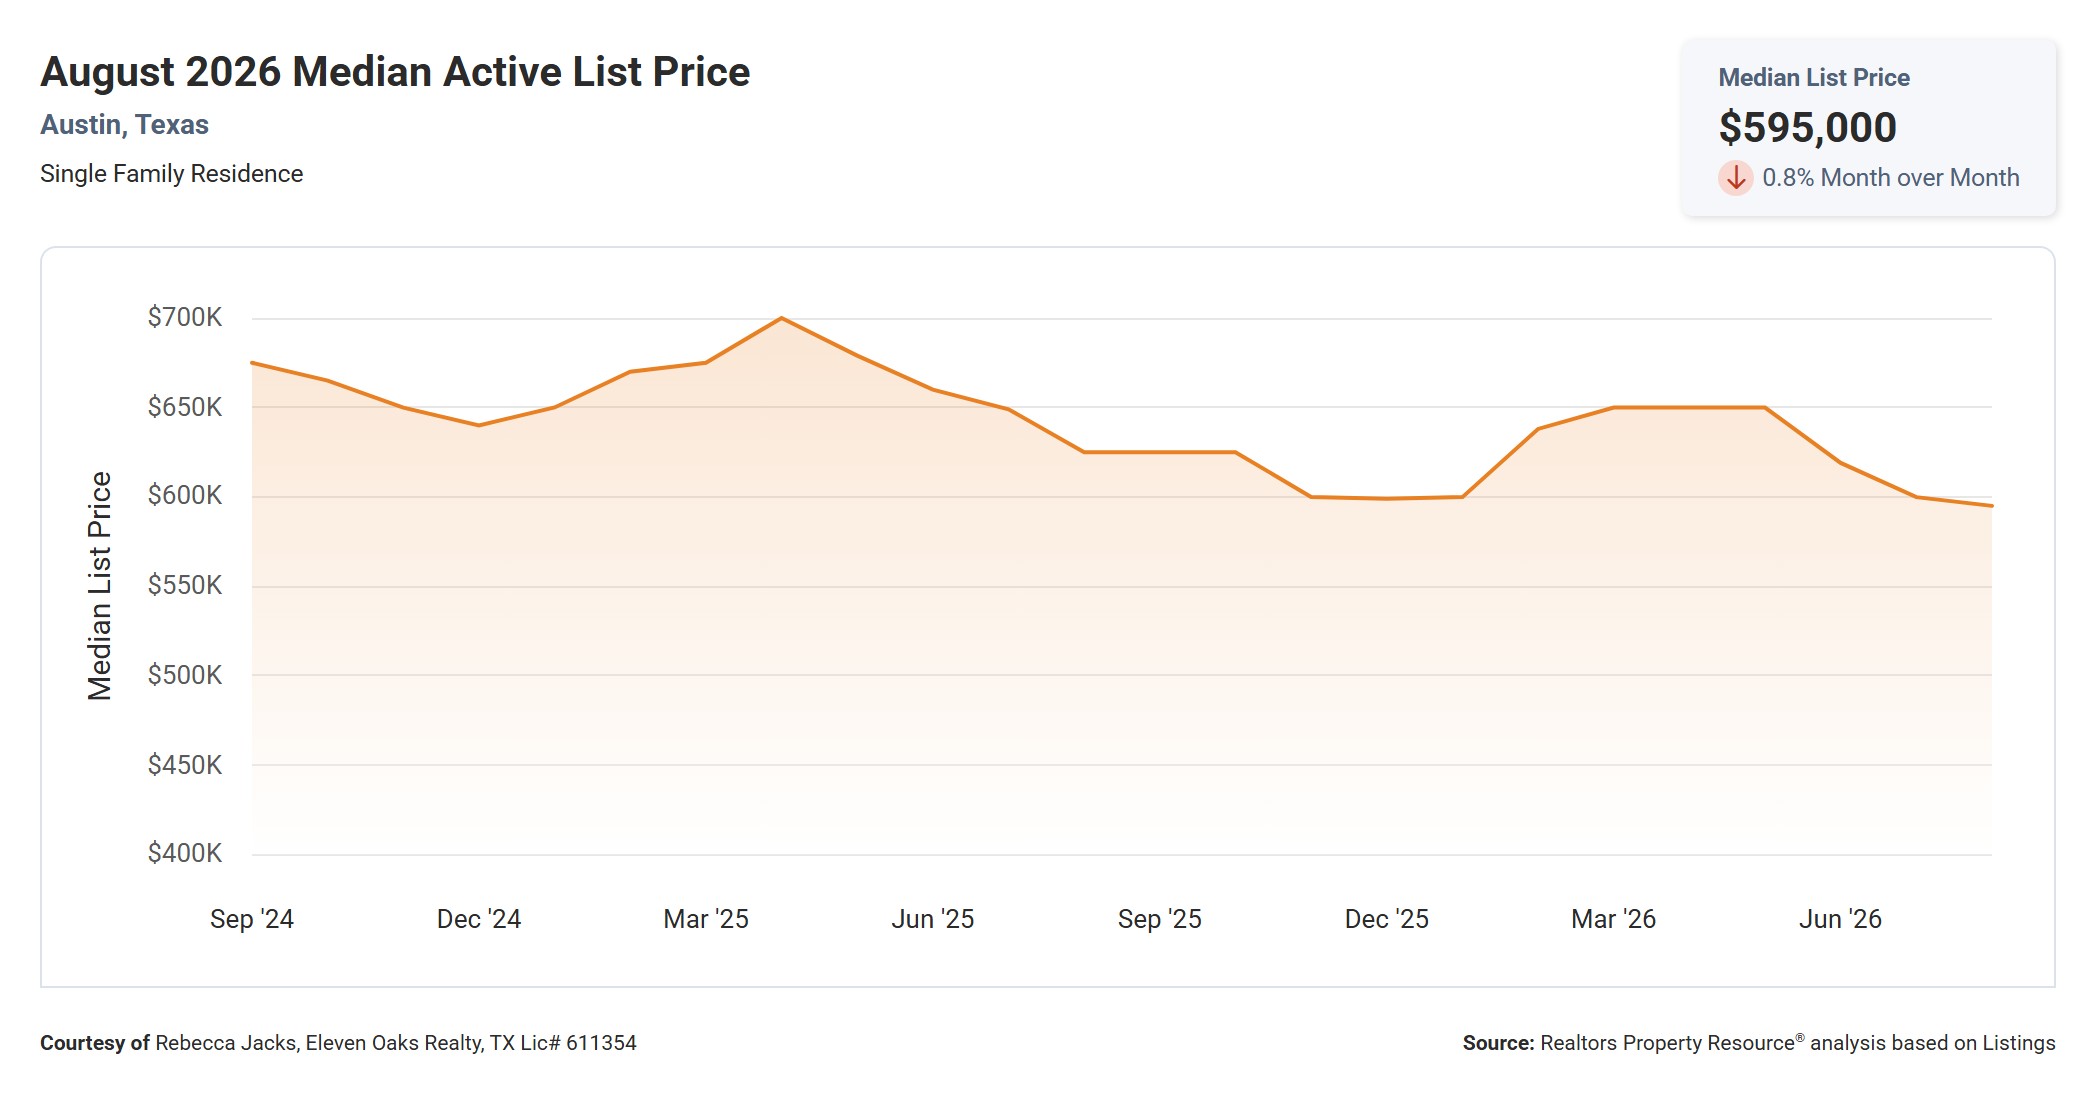
Active listings carried a median asking price of $595,000 in August, down 0.8% from July’s $599,900 and down 4.8% from $625,000 in August 2025.
Over the trailing two years, list prices peaked near $700,000 last spring and have drifted lower since, settling into the $595,000 to $625,000 range for most of this year. August’s figure is at the low end of that band.
For sellers, a list price that is 4.8% below where it stood a year ago is a signal to lean on recent, comparable closings rather than what a home might have commanded in 2025. For buyers, it means the homes currently on the market are asking less than similar homes did last summer, even before any negotiation.
Median Price Per Square Foot Down 1.7% Year Over Year
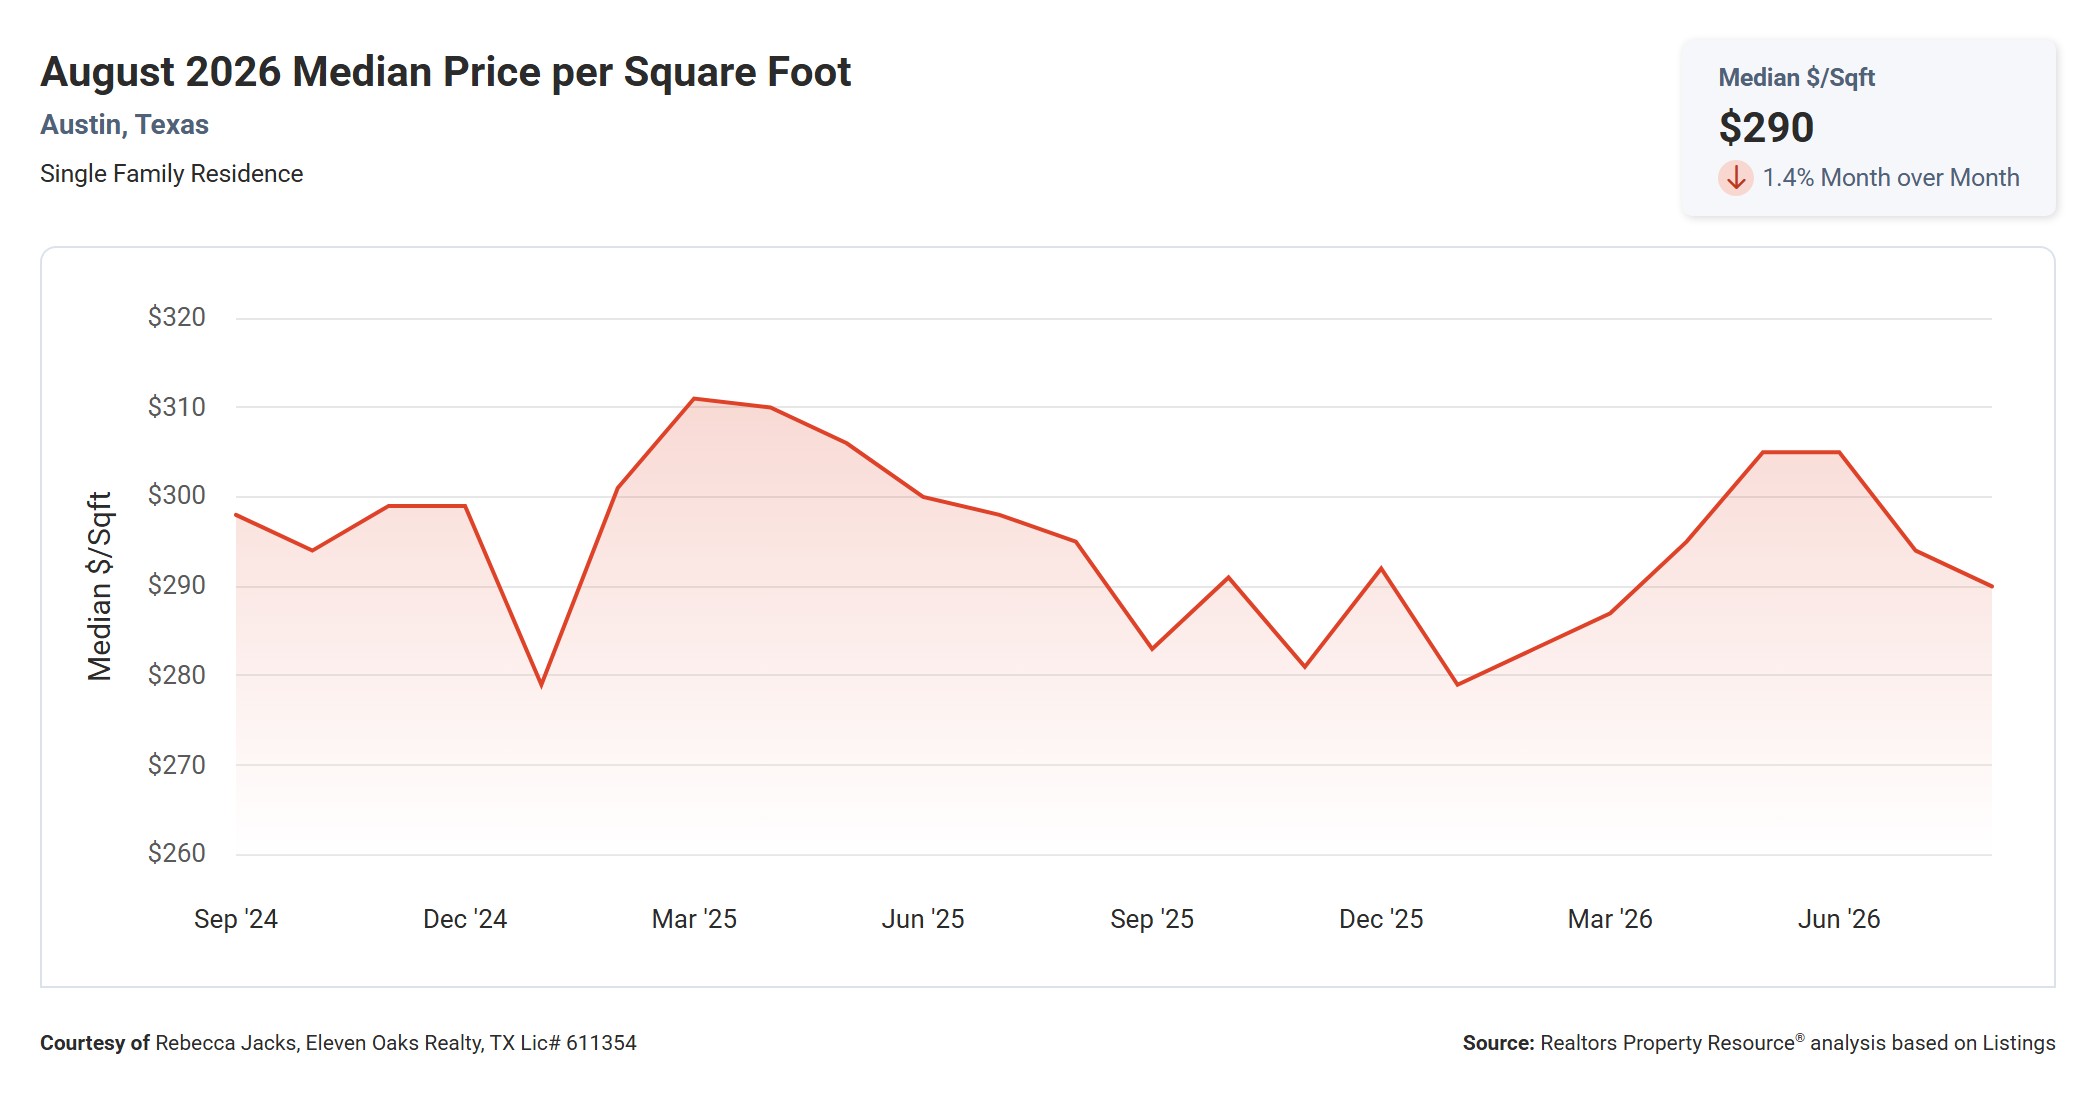
Homes sold for a median of $290 per square foot in August, down 1.4% from July’s $294 and down 1.7% from $295 a year ago.
The two year chart shows this figure oscillating in a fairly tight $280 to $311 band, with a spring 2025 high near $310 and a summer 2026 high near $305 in June and July. August’s reading is a step down from both of those peaks.
For buyers comparing homes of different sizes, this dip in price per square foot means more house for the money than a year ago, even though the overall median sold price is close to flat. For sellers, it is worth pricing new listings against the most recent per square foot comps rather than a listing from earlier this year.
Average Sold to List Price Essentially Unchanged Year Over Year
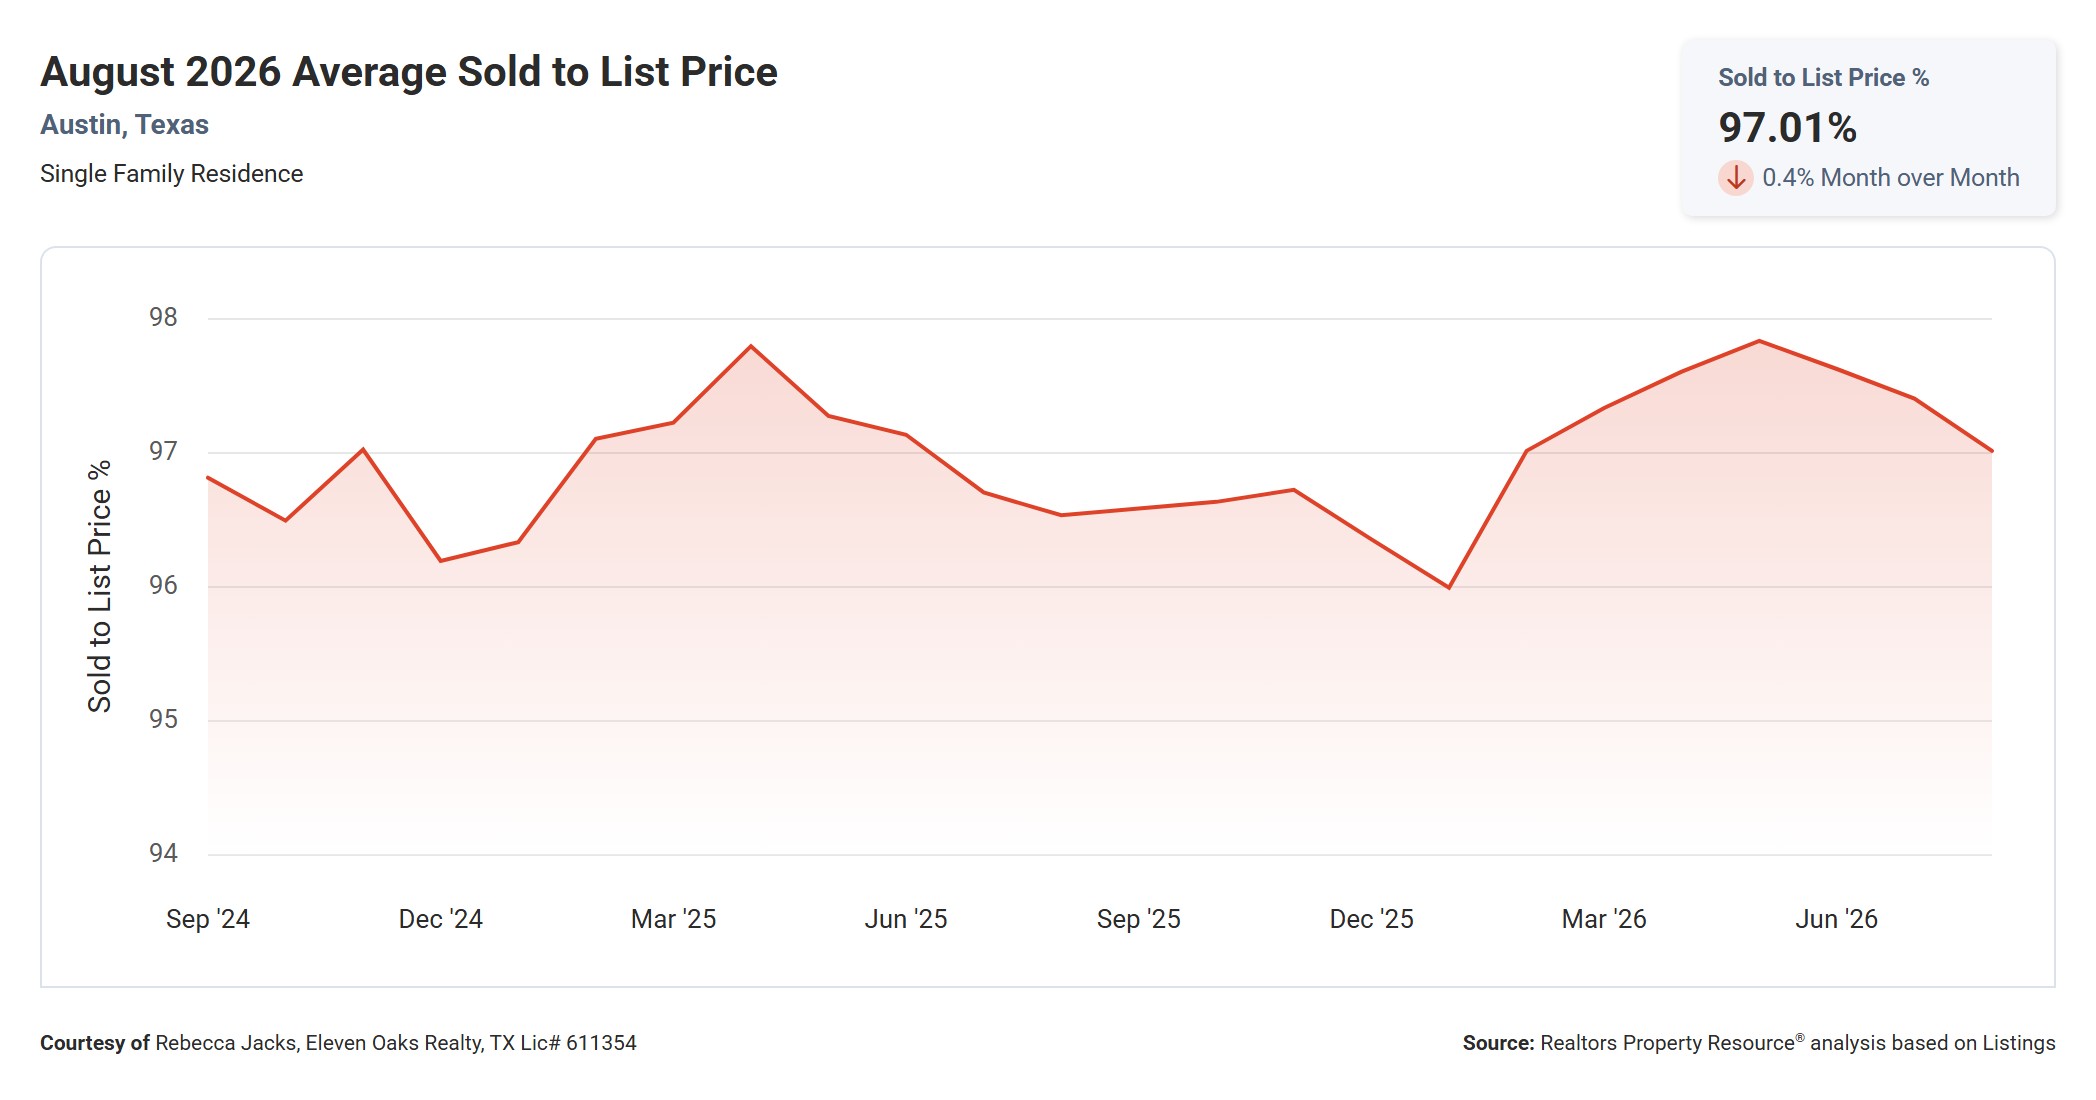
Homes that sold in August closed at 97.01% of list price on average, down 0.4% from July and essentially unchanged from 96.53% in August 2025.
This ratio has stayed in a narrow band between 96% and 97.8% for the past two years, with the strongest seller leverage showing up each spring, most recently in June 2026 when the average hit 97.8%. August’s 97.01% sits just below that seasonal high point.
For sellers, a sold to list ratio near 97% still means well priced homes are closing close to asking, but the summer peak has passed. For buyers, there is a little more room to negotiate than there was three months ago, even if it is not dramatic.
Median Time to Sell Up 34.7% Year Over Year
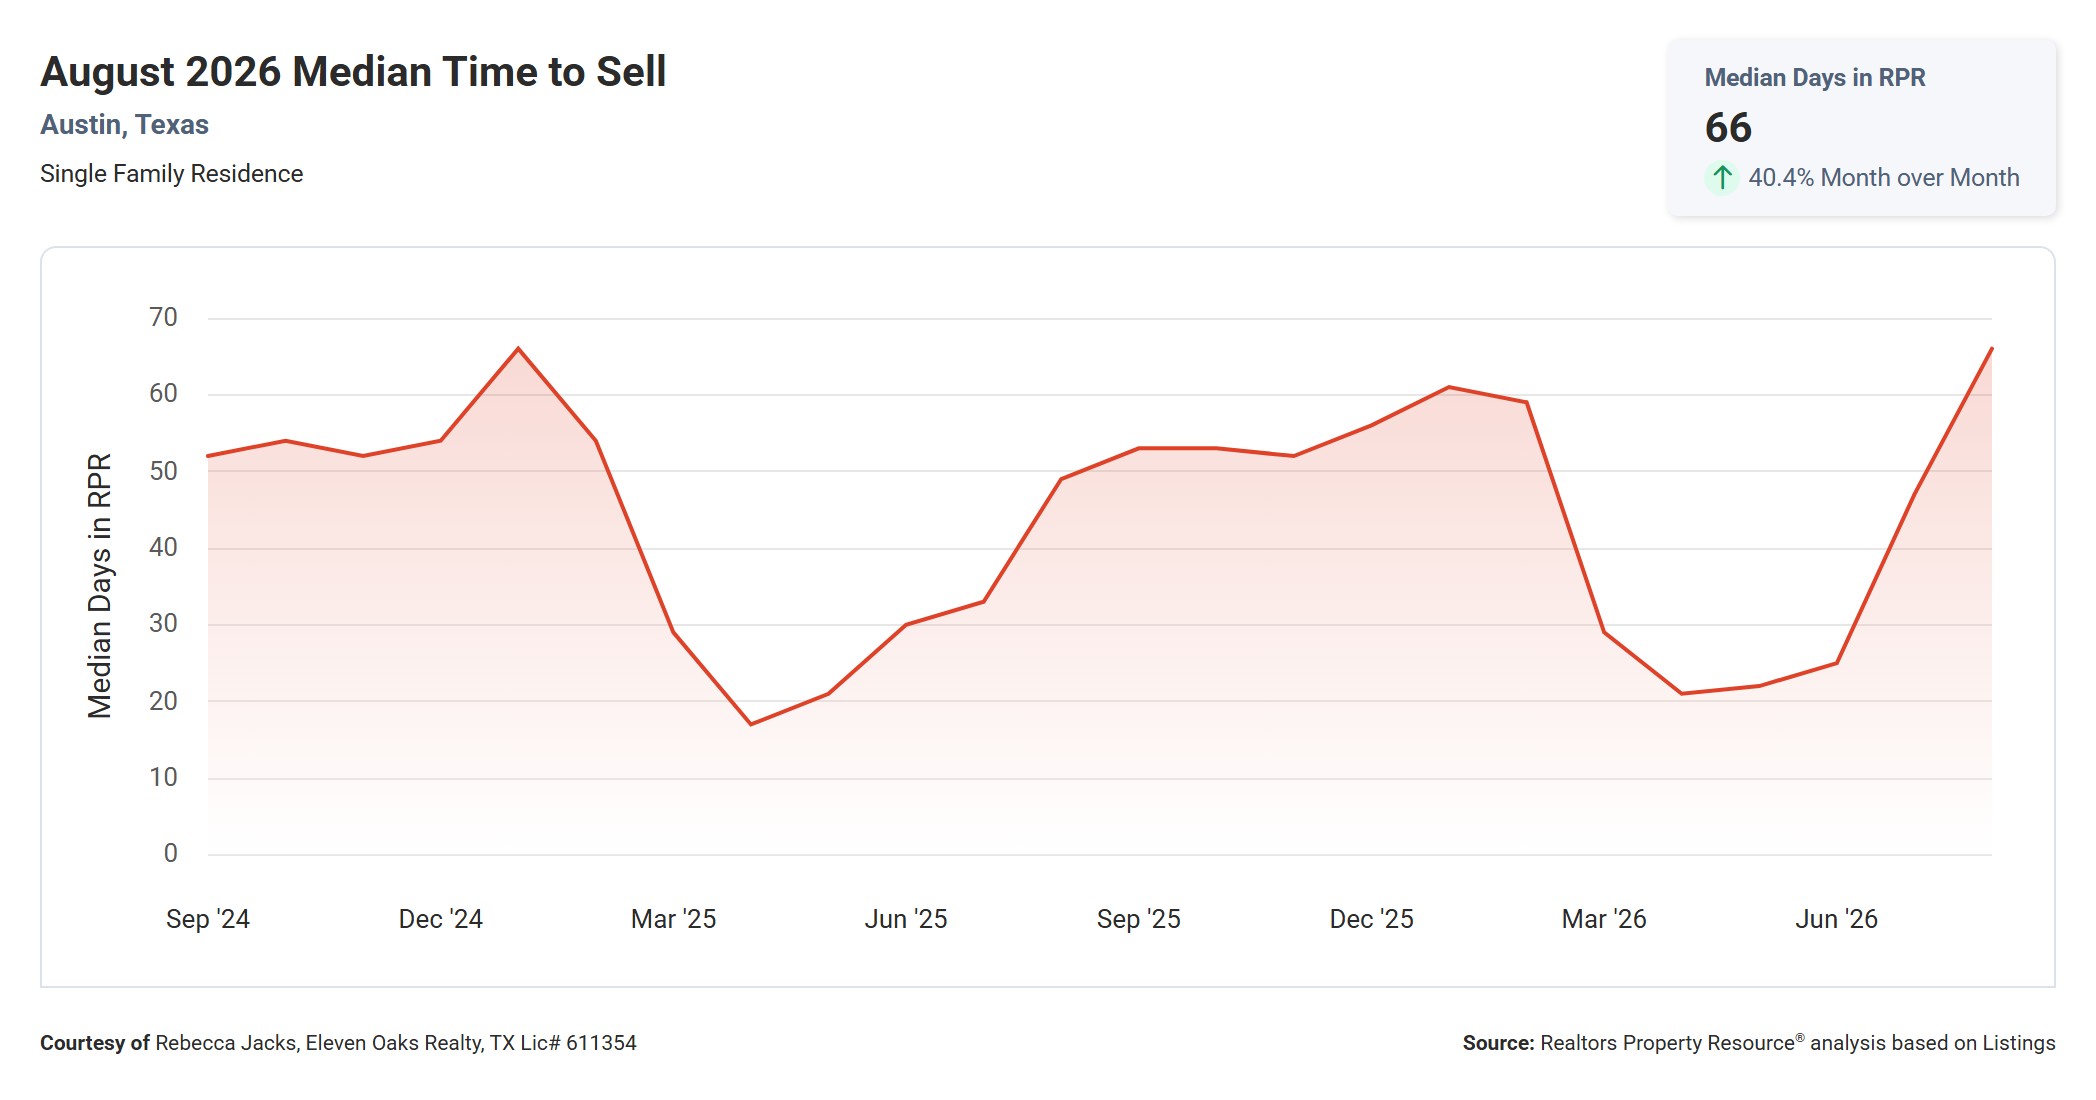
The median home in Austin took 66 days to sell in August, up sharply from 47 days in July, a 40.4% jump, and up 34.7% from 49 days in August 2025.
This is the most dramatic shift in this month’s data. The two year chart shows a clear seasonal rhythm, with time to sell bottoming out in the 17 to 25 day range each spring and climbing toward 60 or more days by late summer and fall. August 2026’s jump to 66 days pushes past last year’s comparable summer readings and lands close to the two year high.
For buyers, a longer time to sell means less urgency to make a rushed offer, and more room to negotiate on price or terms once a home has been listed for a few weeks. For sellers, it is a reminder that August buyers are moving more deliberately, and homes priced even slightly high risk sitting for an extended stretch.
Months Supply of Inventory Down 5.1% Year Over Year
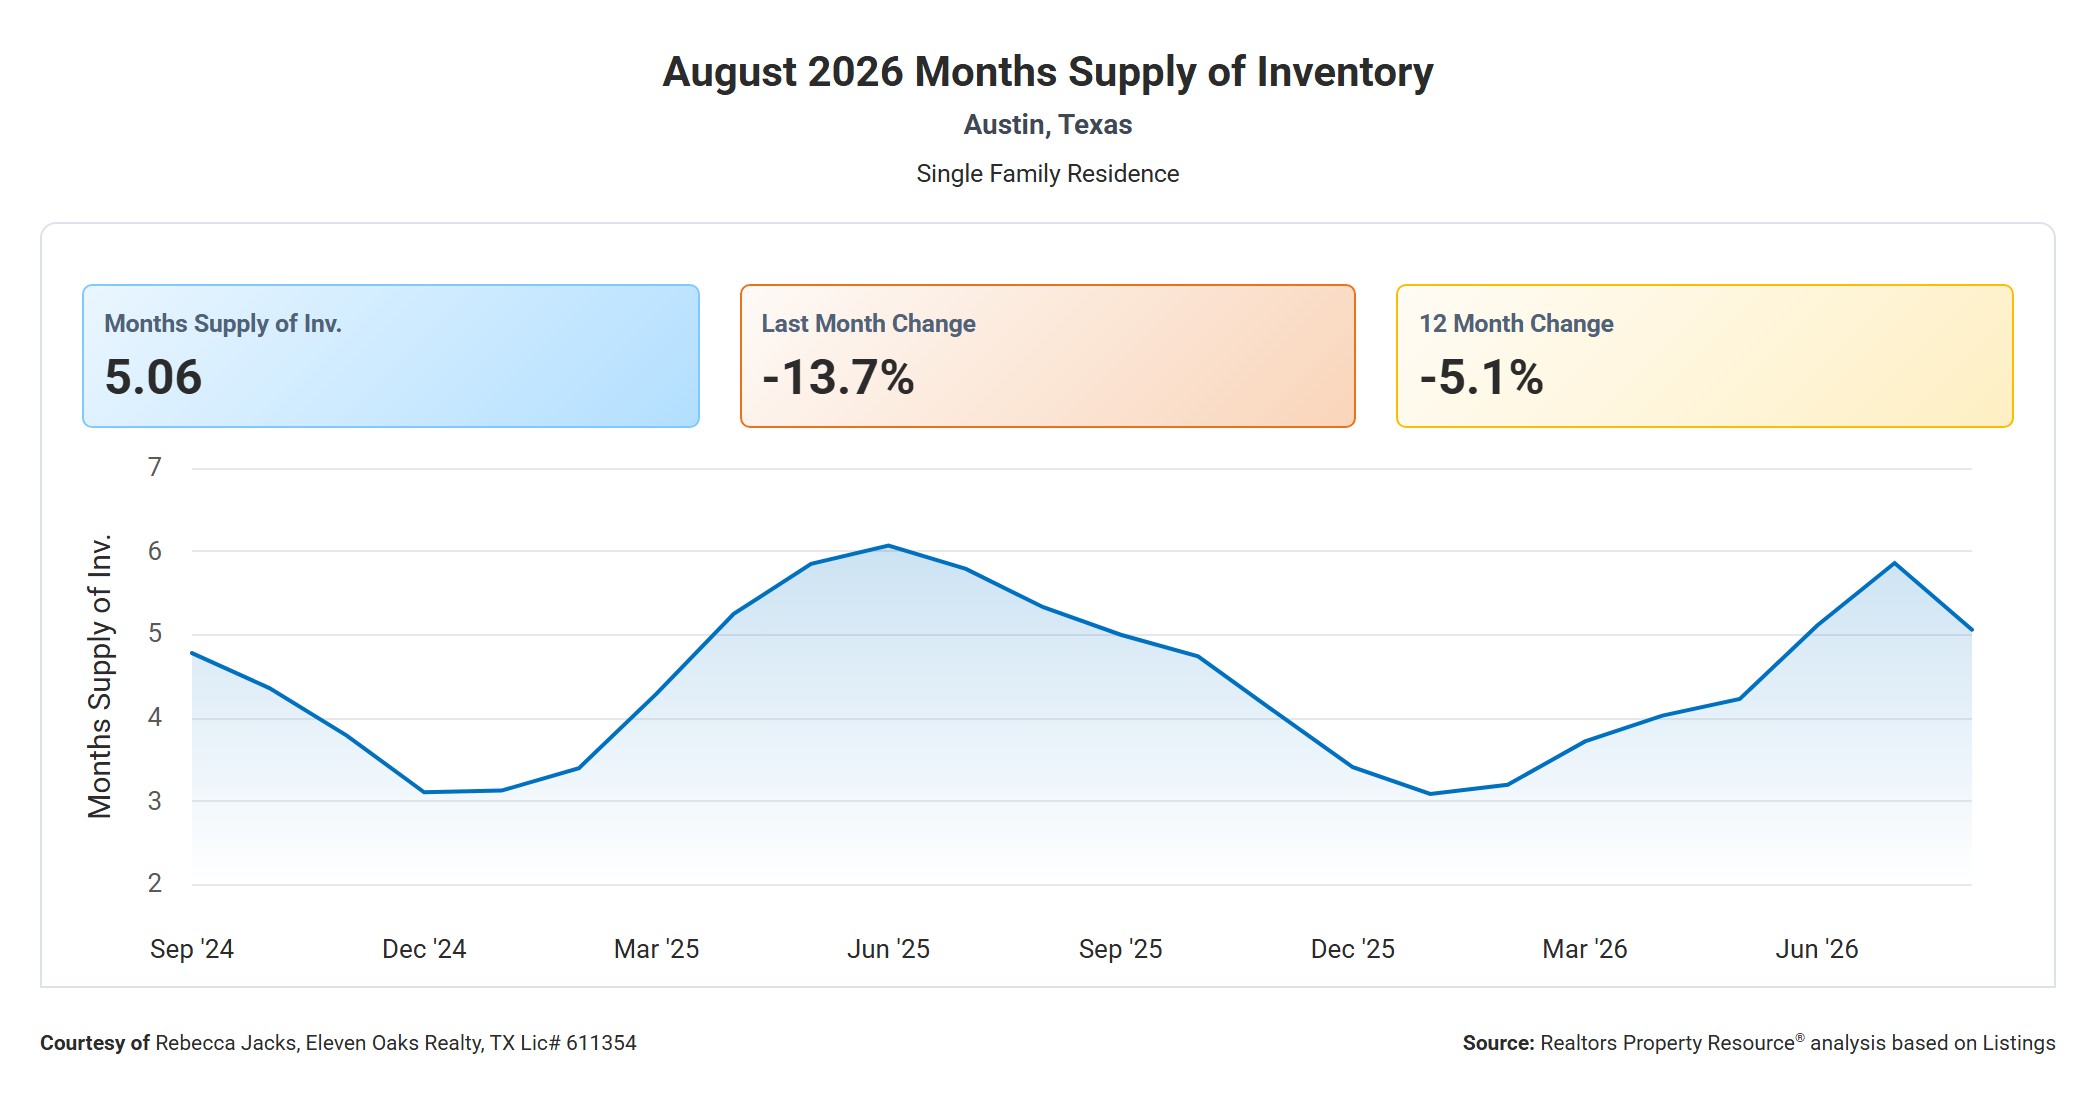
Months supply of inventory stood at 5.06 in August, down 13.7% from July’s 5.86 and down 5.1% from 5.33 a year ago.
The two year trend shows this number swinging between roughly 3 and 6 months, generally bottoming out each winter and peaking each early summer. August’s reading of 5.06 comes down from a June 2026 high near 5.85, tracking the same seasonal pullback seen in prior years.
A months supply figure just above 5 keeps Austin in seller’s market territory for now, though it is close enough to the balanced market threshold that a slower fall could tip the scale. Sellers still have the advantage, but not by a wide margin.
Active Listings Down 13.2% Year Over Year
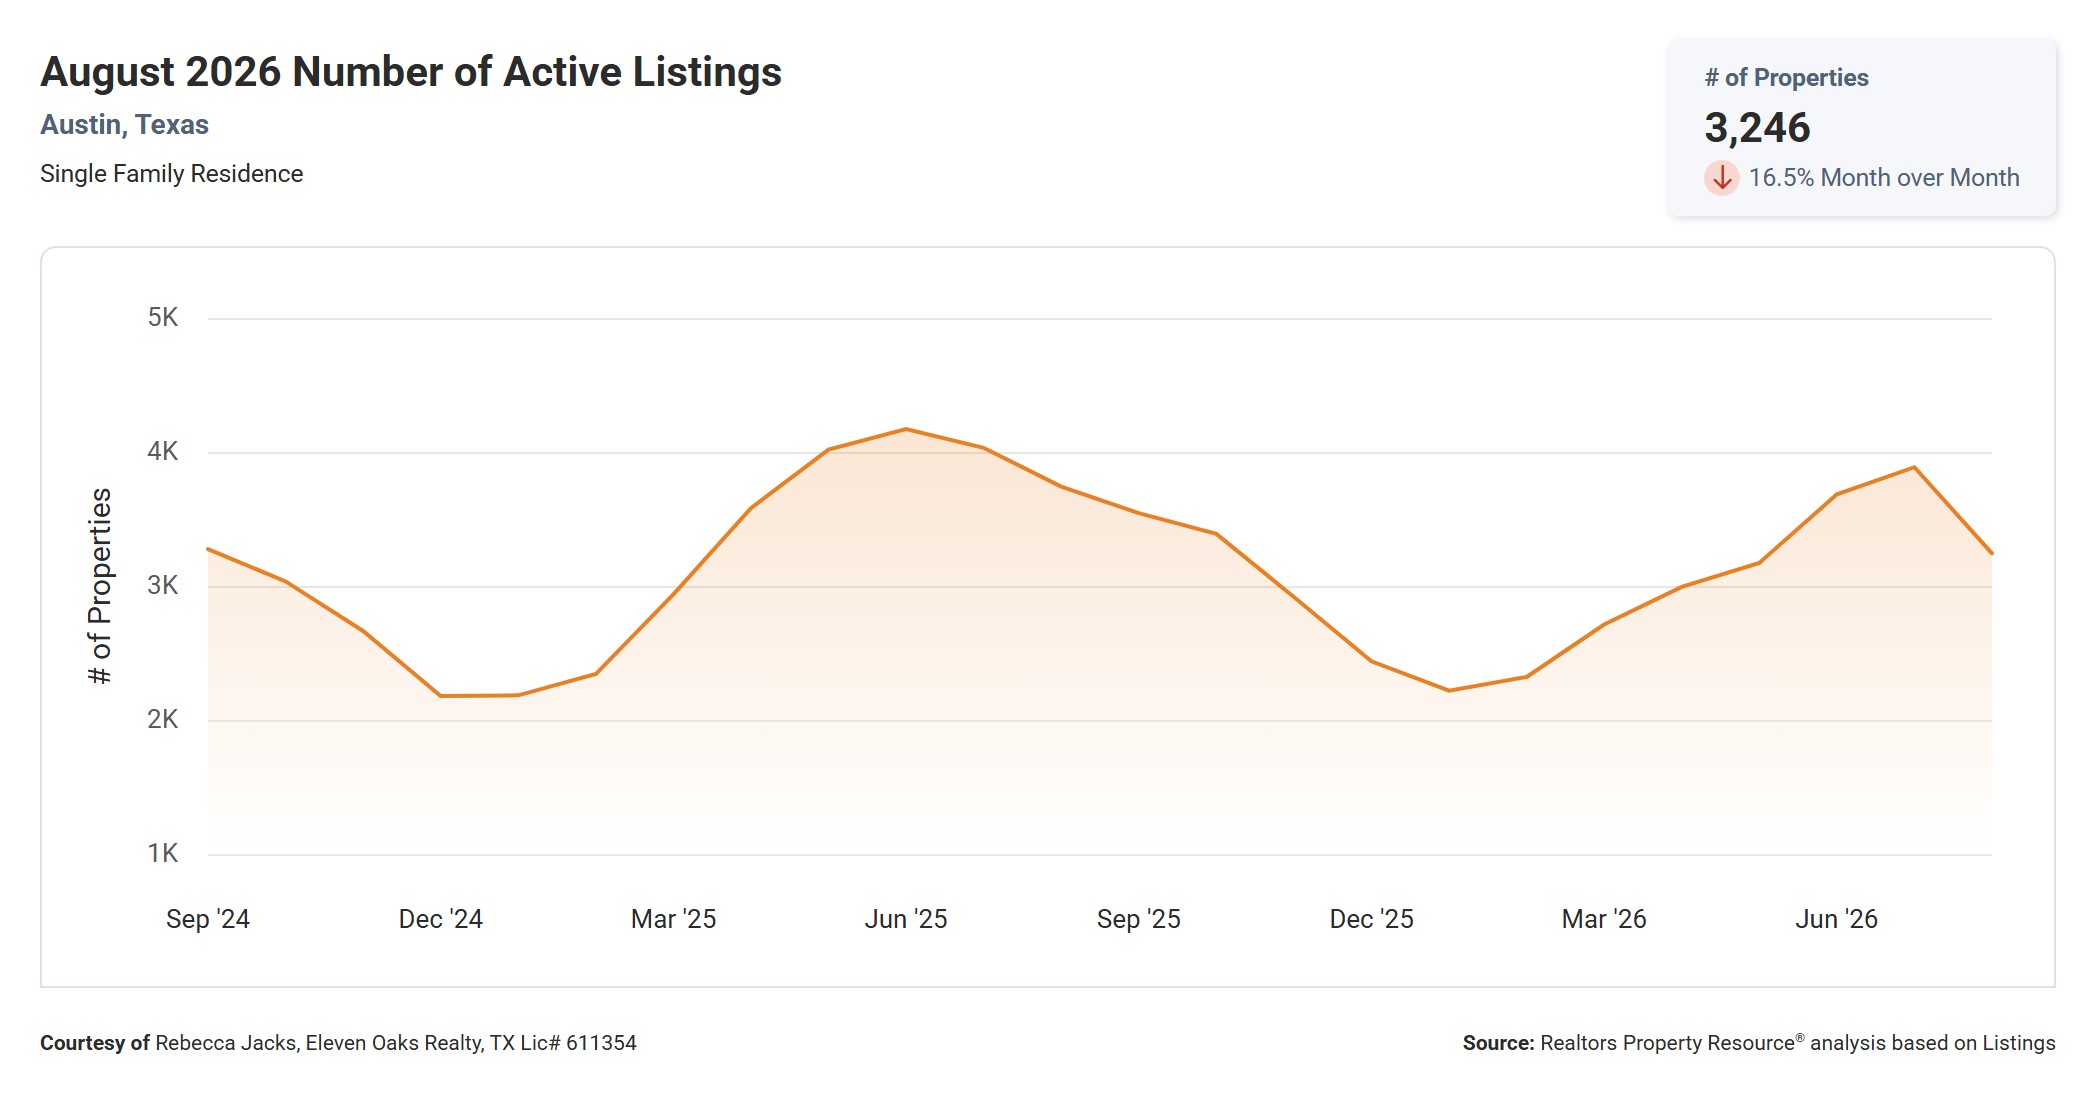
There were 3,246 active single family listings in Austin in August, down 16.5% from July’s 3,890 and down 13.2% from 3,740 a year ago.
Active inventory follows a strong seasonal curve, bottoming out near 2,200 homes each December and January before climbing to a peak above 4,000 each June. August’s count of 3,246 is well past this year’s June peak of roughly 3,900, reflecting the normal late summer decline as unsold homes are pulled or expire and fewer new ones are added to replace them.
Fewer active listings, combined with the drop in months supply, keeps competition for well priced homes elevated even as overall sales activity slows. Buyers searching in popular price ranges should expect fewer options than they had earlier this summer.
New Listings Down 4.6% Year Over Year
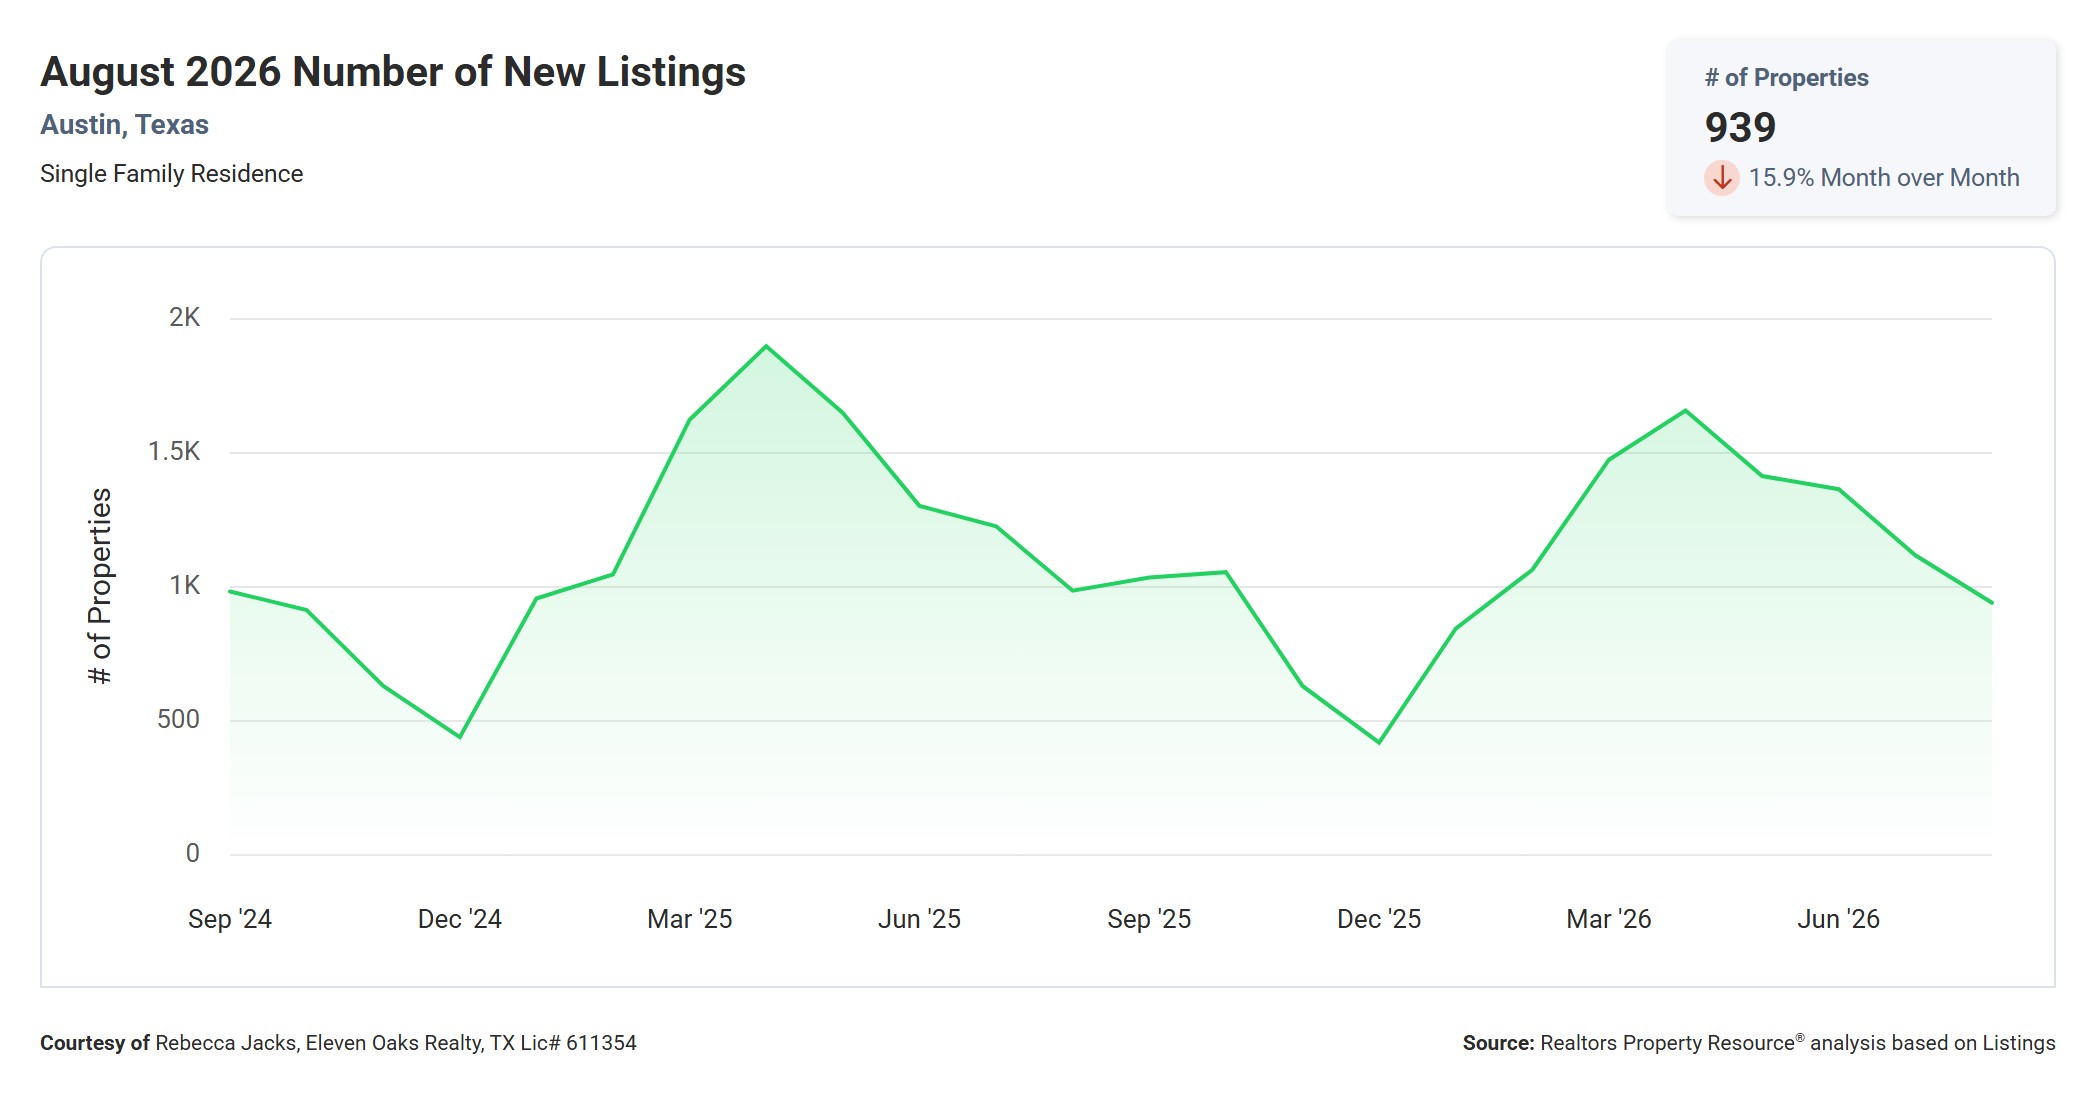
Sellers brought 939 new listings to market in August, down 15.9% from July’s 1,120 and down 4.6% from 984 a year ago.
New listing activity follows the same seasonal shape every year in this data, spiking each spring toward 1,600 to 1,900 homes and falling back toward 500 to 1,000 by December. August’s total continues that annual pullback from the spring surge, and it lands close to last August’s level.
A shrinking flow of new listings is one of the reasons active inventory and months supply both fell this month. Sellers who list now face less competition from freshly listed homes than they would have in the spring.
New Pending Listings Up Slightly Year Over Year
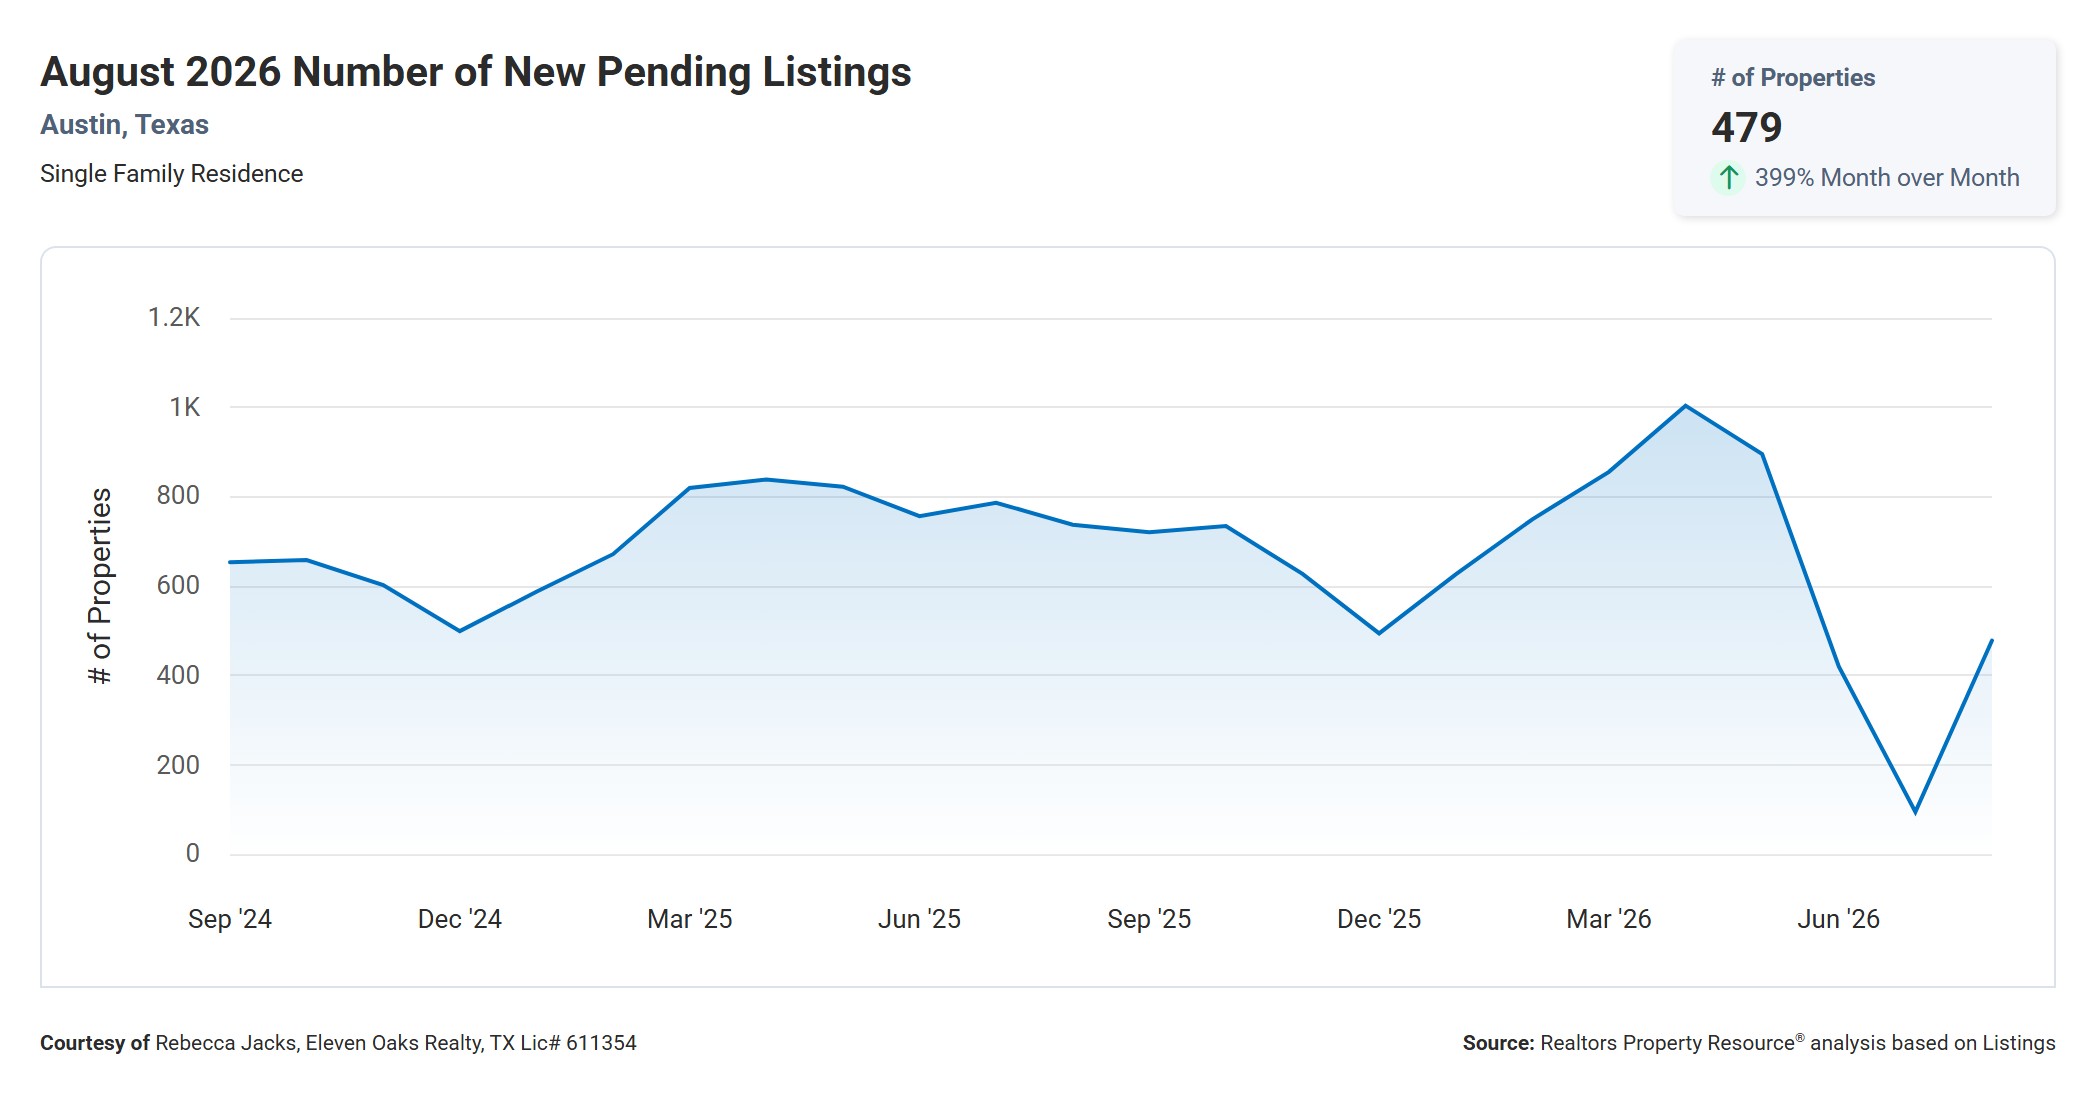
New pending listings jumped to 479 in August from just 96 in July, though that July figure was an unusually low outlier in the data. Compared to a year ago, new pending listings are down 35.1% from 738 in August 2025.
Excluding July’s anomaly, pending activity has generally tracked between 400 and 1,000 homes a month over the past two years, with a spring 2026 peak near 1,000 in May. August’s 479 sits toward the lower end of that normal range and well below last August’s 738.
For buyers, fewer homes moving into pending status signals less competition for the offers that are being written. For sellers, it reinforces the message from the days on market data: buyers are taking their time before committing.
Homes Sold Down 9.6% Year Over Year
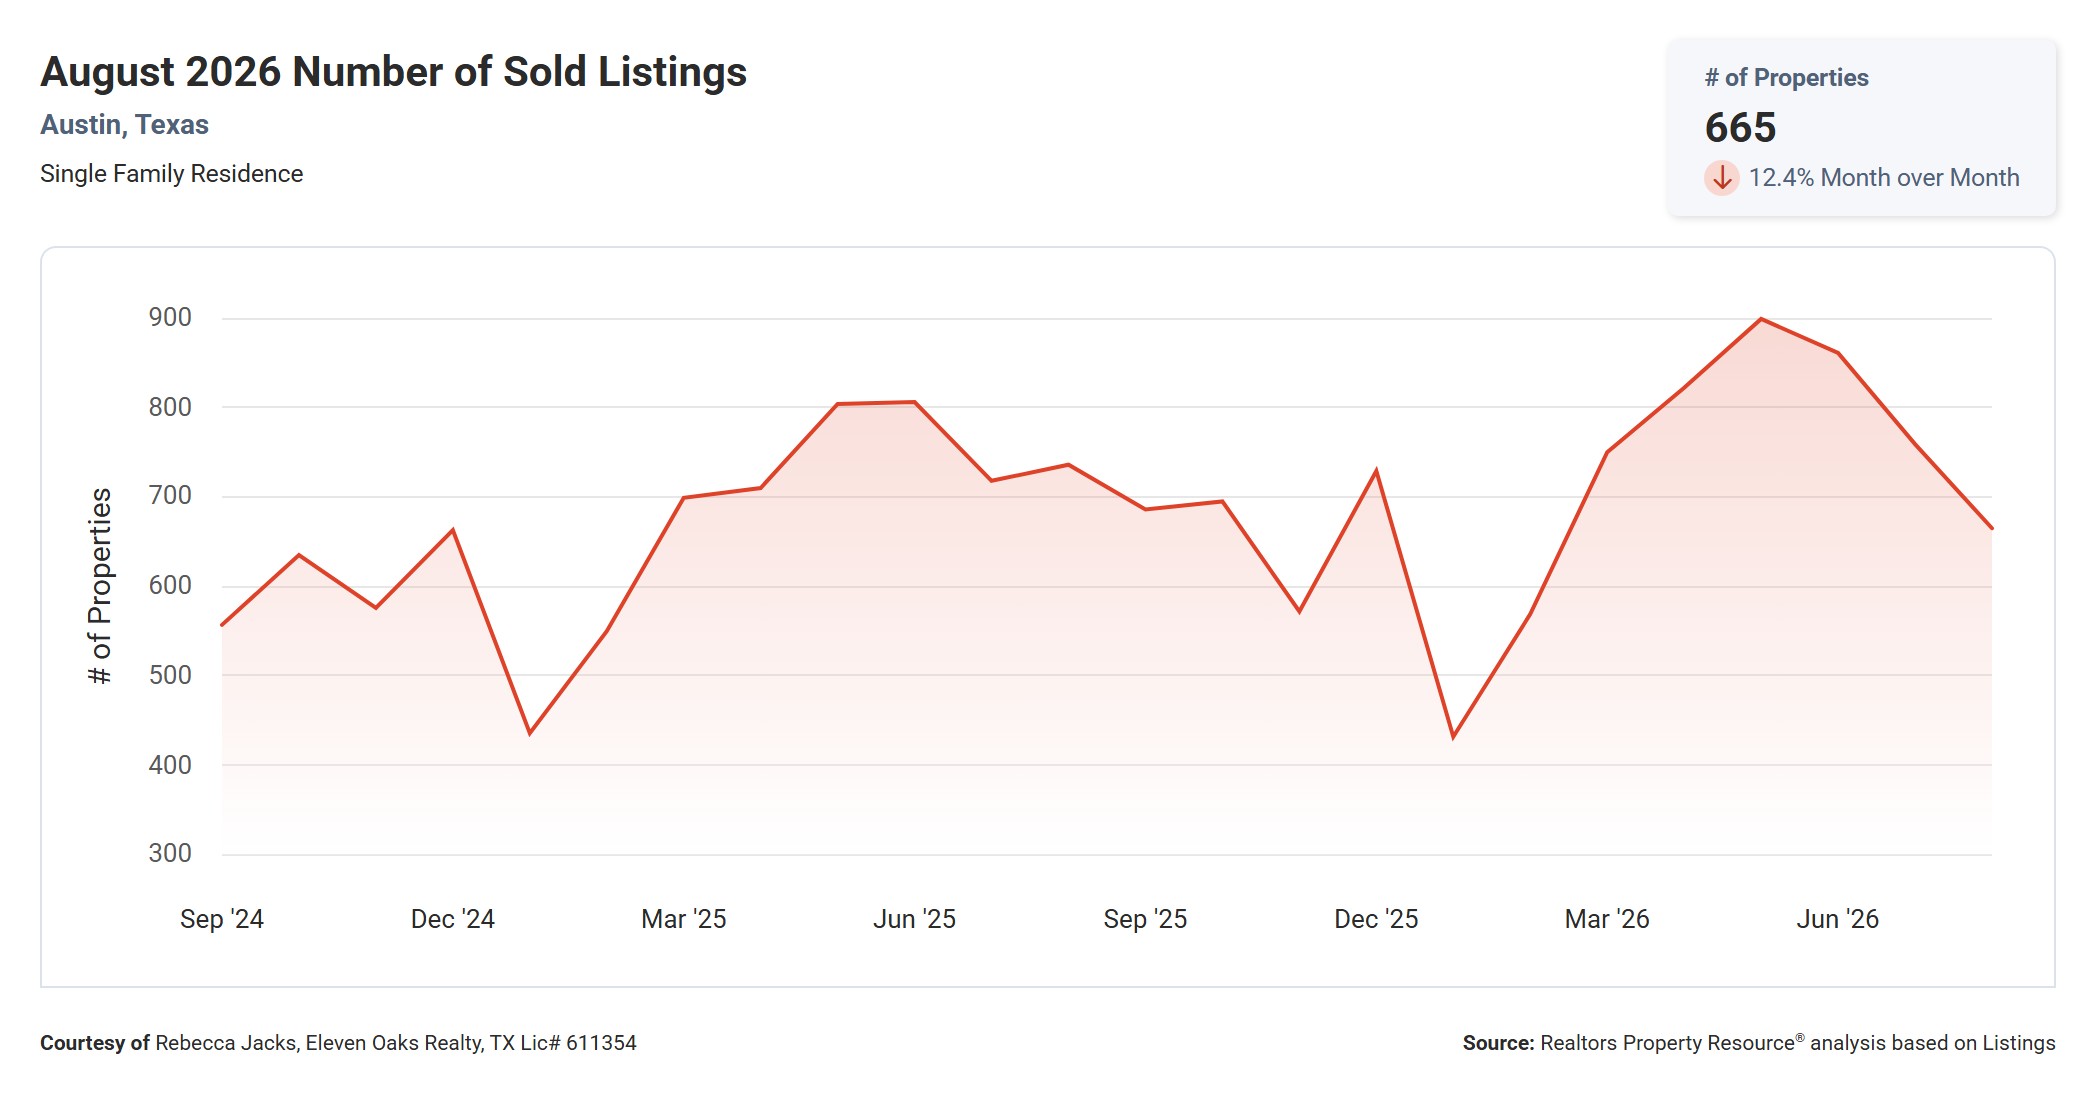
Austin closed 665 single family home sales in August, down 12.4% from July’s 759 and down 9.6% from 736 a year ago.
Closed sales have ranged from roughly 430 to 900 homes a month over the past two years, with the strongest months landing each June and July. August’s total of 665 is a step down from this year’s summer peak of 900 in June, following the same late summer cooldown seen in most years, though this year’s drop is steeper than last August’s comparable dip.
Fewer closings alongside a rising median sold price suggests the buyers who were active in August tended to be well qualified and targeting higher priced homes, rather than a broad slowdown across every price point. The buyer demand data below breaks that down further.
Total Sales Volume Down 9.9% Year Over Year
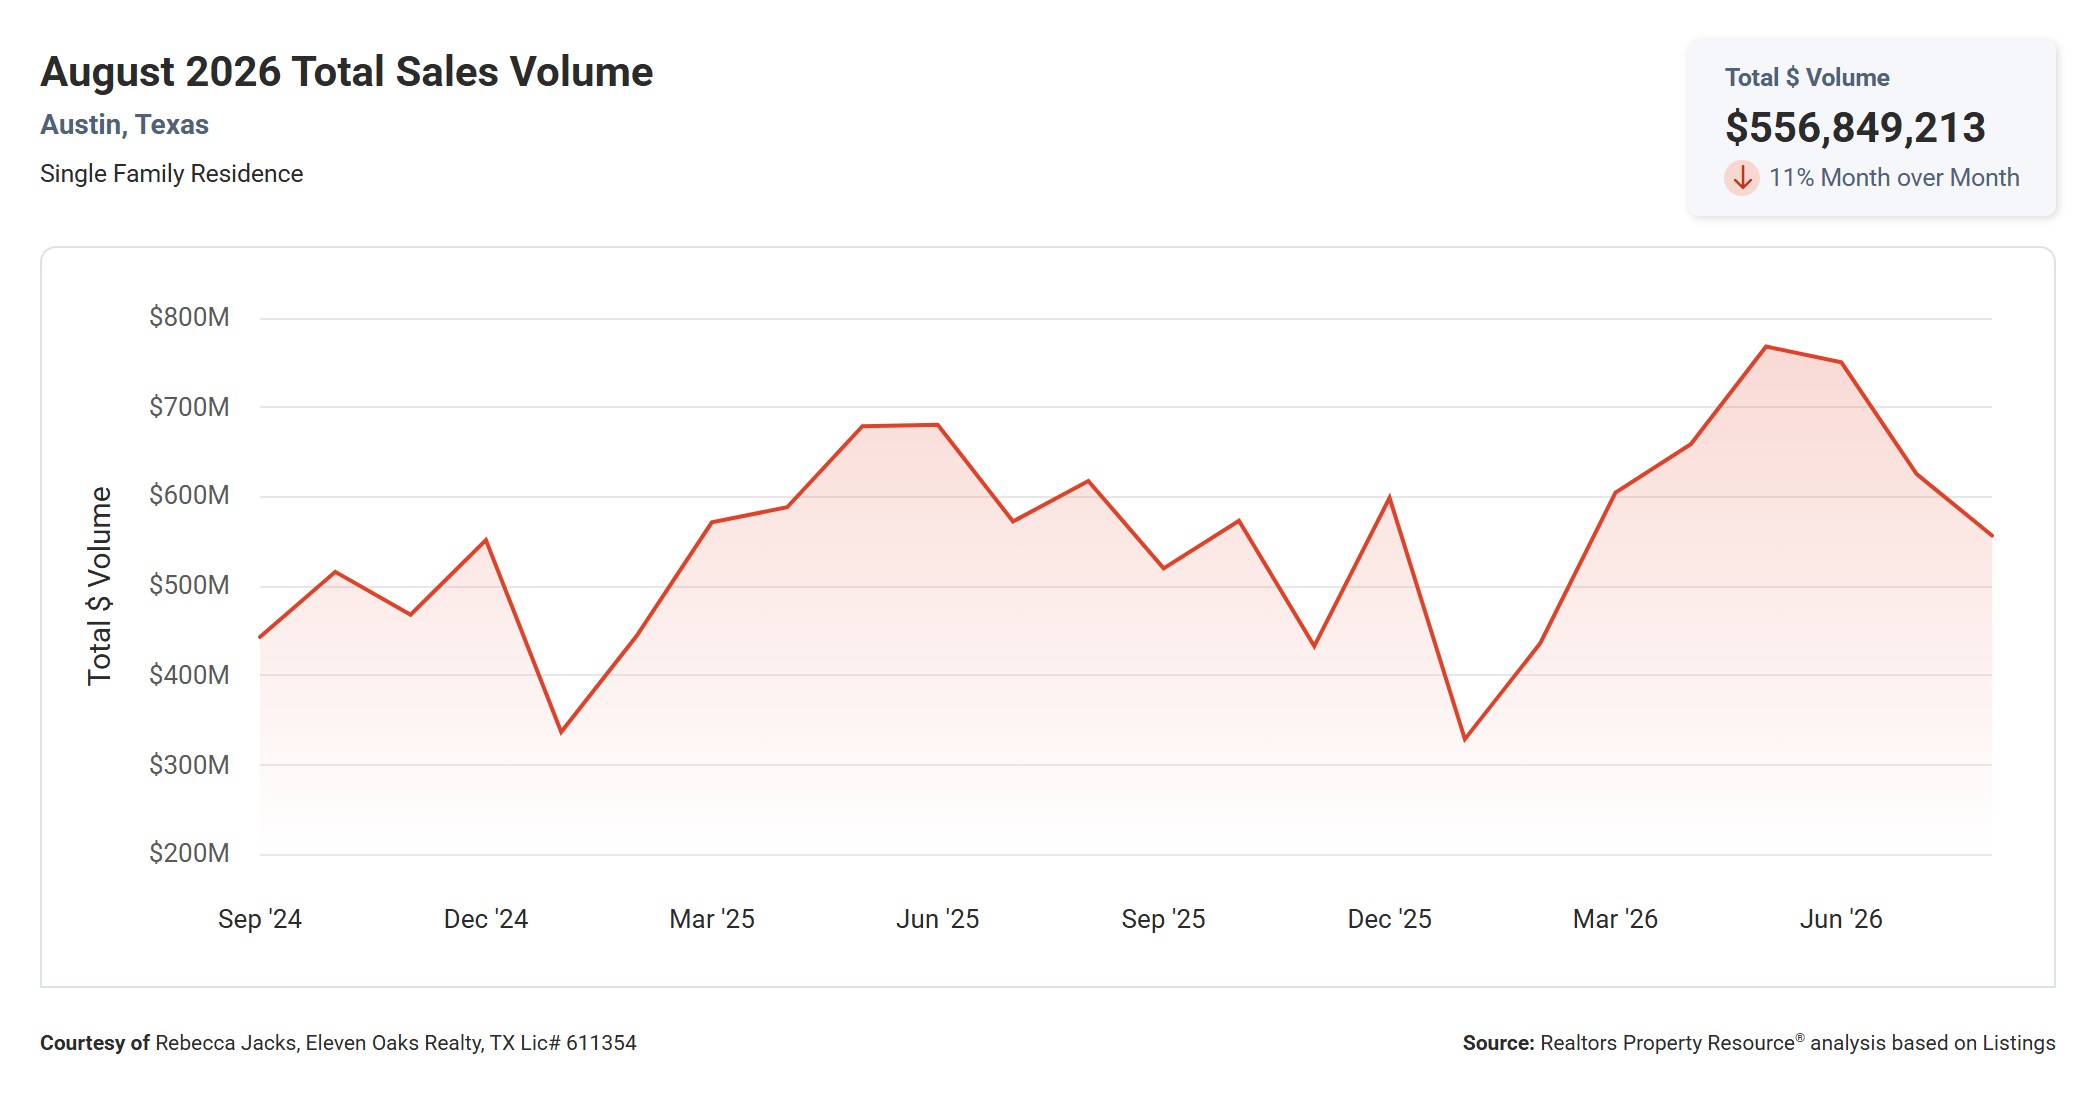
Total sales volume for Austin single family homes was $556.8 million in August, down 11% from July’s $625.6 million and down 9.9% from $617.9 million a year ago.
Volume tracks closely with the number of homes sold, and August’s $556.8 million comes down from this year’s summer high of roughly $770 million in June and July. The two year chart shows volume regularly dipping below $400 million each December and January, so August’s total remains well above the seasonal floor even with the monthly decline.
For sellers, lower overall volume paired with a higher median sold price means the market rewarded pricing accuracy in August more than it rewarded sheer sales count. For buyers, less overall competition for closings can translate into more negotiating room on individual homes.
August 2026 Austin Real Estate by the Numbers
The table below is pulled directly from the Austin Board of REALTORS MLS statistics for August 2026 and covers 715 closed single-family residential transactions in the city of Austin.
| Min | Max | Avg | Median | |
|---|---|---|---|---|
| Beds | 1 | 8 | 4 | 3 |
| Baths | 1 | 8 | 3 | 3 |
| Sq Ft | 468 | 9,530 | 2,397 | 2,142 |
| Lot Sq Ft | -- | 545,855 | 13,952 | 8,337 |
| List Price | $189,500 | $7,400,000 | $867,451 | $640,000 |
| LP/Sq Ft | $114.32 | $1,114.52 | $351.46 | $297.91 |
| Acres | 0.000 | 12.531 | 0.320 | 0.191 |
| Close Price | $169,000 | $7,300,000 | $838,215 | $625,000 |
| CP/Sq Ft | $101.68 | $1,144.47 | $339.95 | $291.54 |
| CP/LP% | 72.00% | 118.00% | 97.08% | 97.00% |
| CP/OLP% | 59.00% | 118.00% | 93.53% | 95.00% |
| ADOM | 0 | 584 | 51 | 36 |
The most expensive home that sold in August 2026 sold for $7,300,000 and the least expensive home sold for $169,000. Homes ranged in size from 468 to 9,530 square feet with an average size of 2,397 square feet. The average price per square foot for a home that sold in Austin in August 2026 was $339.95 with the lowest being $101.68 per square foot and the highest being $1,144.47 per square foot. It took, on average, 51 days to sell a home in Austin and sellers received, on average, 93.53% of their original list prices.
The gap between the average CP/LP% of 97.08% and the average CP/OLP% of 93.53% shows that most sellers adjusted their price at least once before going under contract. A home that sells at 97% of its most recent list price may still have closed several percentage points below what it was originally asking, which is why tracking the original list price matters as much as the final one.
The wide range between the ADOM average of 51 days and the ADOM median of 36 days points to a smaller group of homes that sat far longer than typical, likely stale or overpriced listings pulling the average upward. Most homes that sold in August found a buyer inside five to six weeks, even though the overall market, measured by RPR’s median days figure, showed a slower 66 day pace.
Where Buyers Are Shopping: A Look at Price Ranges
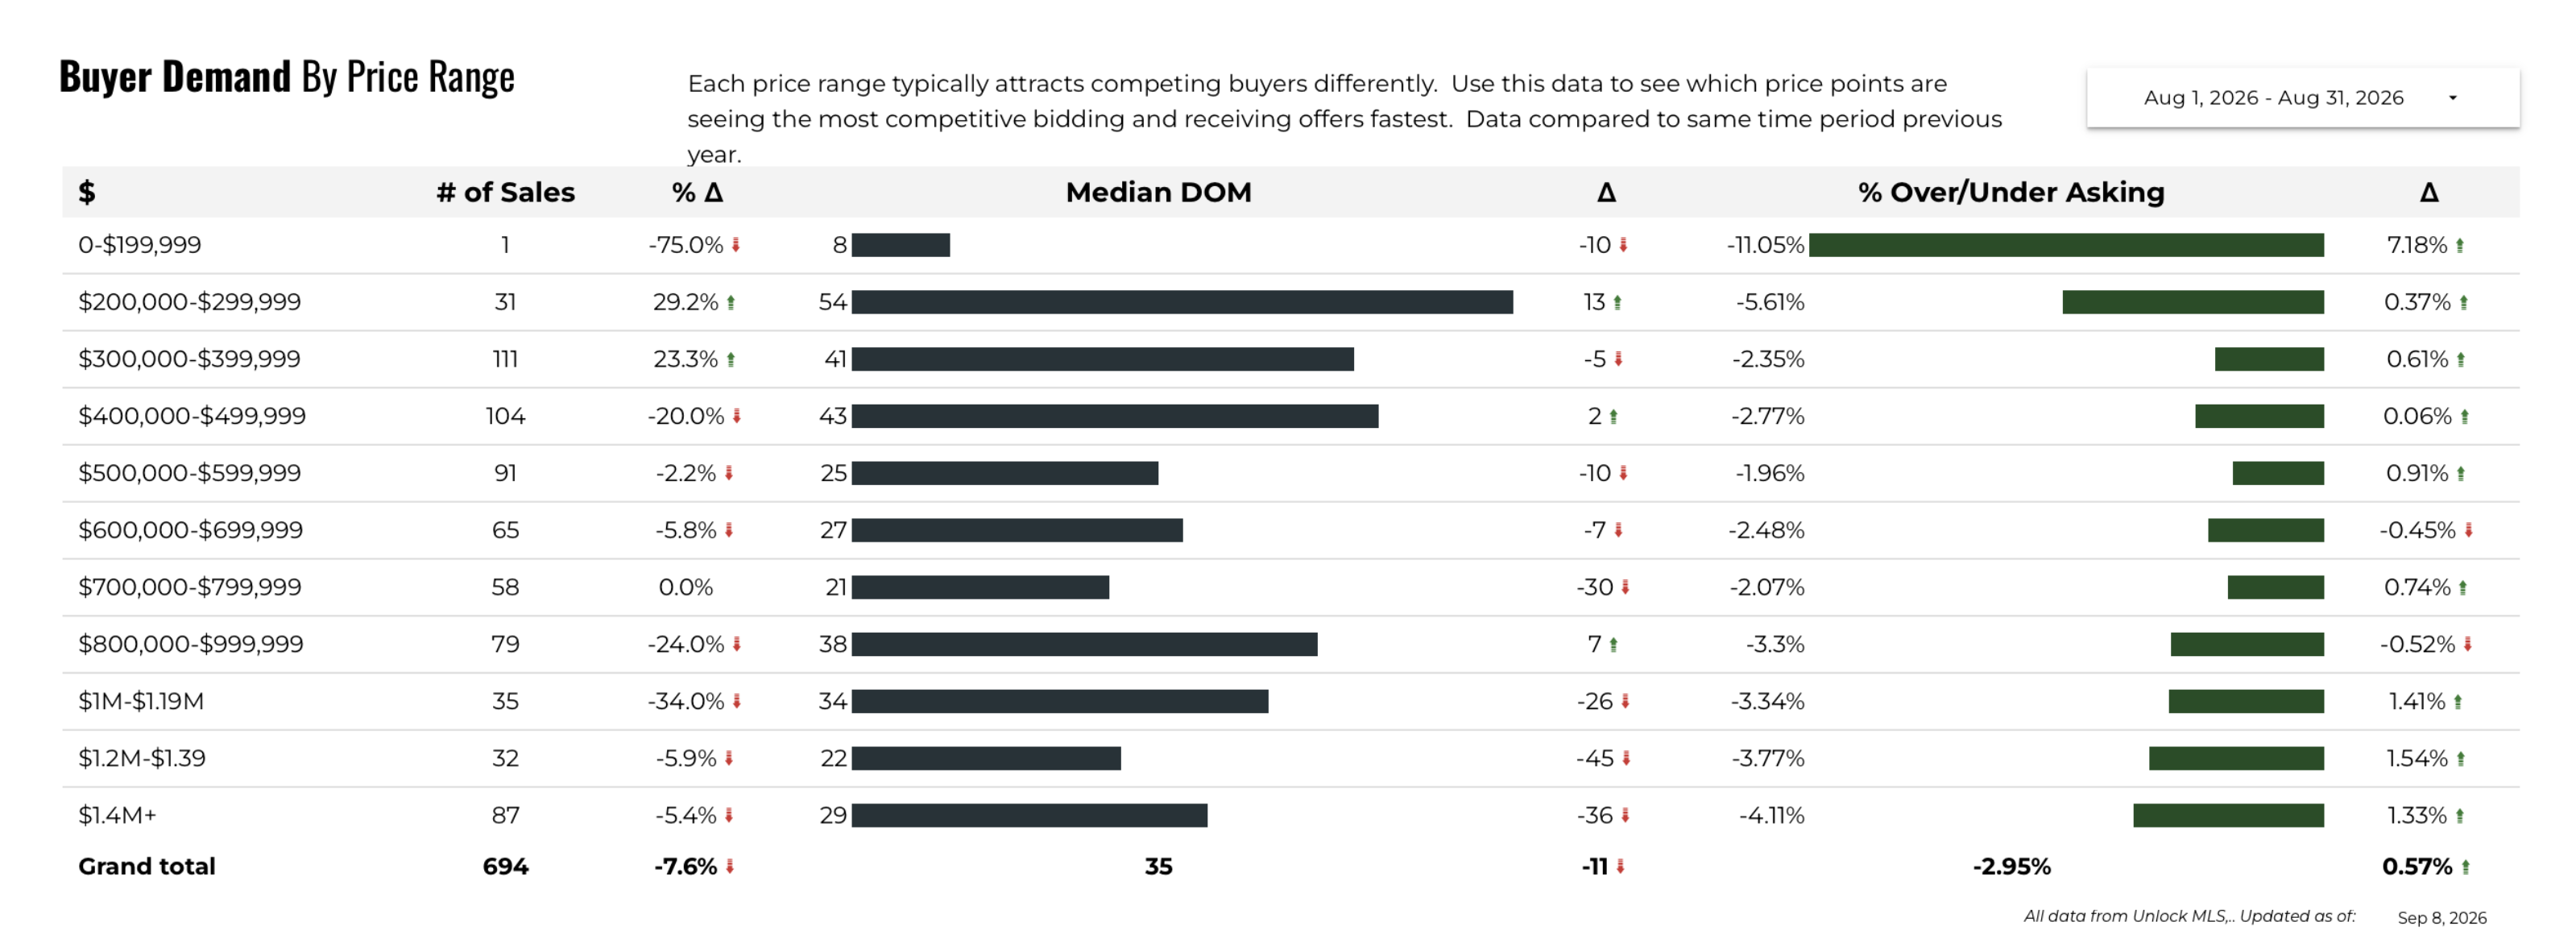
According to Unlock MLS, Austin recorded 694 single family closings across all price brackets in August, giving a fuller picture of exactly where buyer demand concentrated last month.
The $300,000 to $399,999 range led the market with 111 sales, followed by $400,000 to $499,999 with 104 sales and $500,000 to $599,999 with 91 sales. Together, these three brackets accounted for 306 sales, or roughly 44% of everything that closed in August, and both the $300,000 to $399,999 and $400,000 to $499,999 ranges are drawing more buyers than they did a year ago, up 23.3% and holding relatively flat respectively in year over year sales count.
The $600,000 to $999,999 range added another 202 sales, about 29% of total activity, spread across the $600,000 to $699,999, $700,000 to $799,999, and $800,000 to $999,999 brackets. Activity at the very bottom of the market stayed thin, with just 1 sale under $200,000 and 31 sales between $200,000 and $299,999, together representing less than 5% of all closings, a reminder of how little inventory exists at Austin’s most affordable price points.
At the top of the market, homes priced at $1 million and above accounted for 154 sales, or about 22% of the total, including 87 sales at $1.4 million and above. Luxury buyers are seeing the steepest discounts from list price of any tier, with the $1.2 million to $1.39 million bracket closing 3.77% under original asking and $1.4 million and above closing 4.11% under, compared to a market-wide gap of 2.95%.
Homes in the $700,000 to $799,999 range moved fastest, with a median of just 21 days on market, while the $200,000 to $299,999 bracket took the longest at a median of 54 days, though that segment’s small sales count makes it more sensitive to a handful of unusual listings. For buyers competing in the $300,000 to $600,000 range, expect the most competition and the fastest pace, since that band accounts for nearly half of everything selling in Austin right now.
The Listing-to-Close Price Gap: What Sellers Need to Know
Austin’s CP/LP% of 97.08% and CP/OLP% of 93.53% look similar at first glance, but the difference between them tells an important story. CP/LP% measures the final sale price against whatever the home was asking right before it went under contract, while CP/OLP% measures it against the very first price the home hit the market at. The 3.55 point gap between the two means that, on average, sellers reduced their price before finding a buyer rather than negotiating that discount directly off their original number.
Applying that gap to a typical home tells the story in dollars. Austin’s median original list price this month was around $640,000. Using the median CP/OLP% of 95%, a home that originally listed at $640,000 would be expected to close closer to $608,000, a $32,000 gap between the opening ask and the final sale price.
The takeaway for sellers is that getting the price right at launch matters more than being able to negotiate later. A home that starts at the right number tends to sell faster and closer to that number, while one that starts too high often ends up selling for less than a more accurately priced listing would have, once you account for the reductions along the way.
What This Means for Buyers
With the median sold price down 2.4% and price per square foot down 1.7% compared to a year ago, buyers have a small but real pricing edge over where the market stood in August 2025. Combined with a median active list price that is 4.8% lower than last year, homes across most price points are asking less than they were twelve months ago.
The negotiation landscape has also shifted in buyers’ favor since summer. The average sold to list ratio slipped to 97.01%, months supply climbed to 5.06, and the median time to sell jumped to 66 days, all signs that sellers have less leverage than they did in June. Homes that have been sitting for a few weeks are worth a closer look and a more assertive offer.
Seasonally, expect this window to persist through the fall before spring buyer competition picks back up. New pending listings excluding July’s outlier data point are running below last year’s pace, meaning fewer buyers are actively writing offers right now, which works in your favor if you are ready to move.
On financing, with days on market stretching out, there is more room to build rate buydowns or closing cost credits into your offer rather than competing purely on price. Talk with your lender about how a slower moving listing might create room to negotiate concessions that would have been off the table during the spring rush.
What This Means for Sellers
The 2.5% month over month rise in median sold price is a genuine demand signal, showing buyers are still willing to pay up for the right home even as overall sales volume slows.
That said, competition has not disappeared. Even with new listings down 15.9% from July, 939 homes still entered the market in August, and active inventory of 3,246 homes means buyers have real choices. Pricing a new listing competitively from day one matters more than ever when buyers can compare it against thousands of alternatives.
The CP/OLP% data makes the cost of overpricing clear: the average seller who needed a price reduction closed 6.47 percentage points below their original ask. Homes priced accurately at launch, based on August’s median CP/LP% of 97%, are closing close to their most recent asking price.
Despite the slower pace, the fundamentals remain healthy. A sold to list ratio near 97% and a median of 36 days for the typical closed sale, according to the MLS statistics sheet, show that well priced homes are still finding buyers in a reasonable window.
Market Summary and Outlook
August 2026 told a story of a market taking a breath. Sales fell 12.4% and new listings fell 15.9% from July, while the median sold price still managed a 2.5% gain and days on market more than doubled. It was not a soft month for pricing, but it was a slower month for volume.
Compared to a year ago, most of the core numbers are down modestly: median sold price off 2.4%, median list price off 4.8%, and active listings off 13.2%. The one exception is time to sell, up 34.7% year over year, showing that even though fewer homes are on the market than last August, the ones that are there are taking meaningfully longer to find a buyer.
The key variable to watch through the fall is whether new listings keep pulling back or start to recover. If new listings stay depressed, active inventory and months supply should keep tightening, which would support prices even with fewer transactions. If new listings pick back up while buyer activity stays where it is, expect this month’s slower pace and longer days on market to continue.
Underneath the month to month swings, Austin’s fundamentals remain steady. A metro adding jobs and residents at the pace Austin has for years does not lose its underlying housing demand over a single slow month, and the data here reflects a market recalibrating after a strong summer rather than one in decline.
Time to Buy? Time to Sell?
For buyers, August’s combination of softer year over year pricing, a lower sold to list ratio, and 66 median days on market adds up to real leverage, especially compared to the competitive conditions of this year’s spring and early summer. If you have been priced out or outbid earlier this year, this is a window worth taking seriously.
For sellers, the honest read is that pricing discipline matters more right now than it did a few months ago. The market is still rewarding accurately priced homes with a sold to list ratio near 97%, but with 3,246 active listings and 939 new ones added in August alone, an overpriced home will sit, and sitting tends to cost more in the end than pricing it right from the start.
For sellers who have the flexibility to wait, the next 60 to 90 days are worth watching closely. If new listings continue to decline while buyer demand holds steady, inventory could tighten further heading into winter, which would work in your favor. If you do not have that flexibility, price to today’s data, not to what the market was doing in June.
Action Items for Buyers
- Take advantage of the 66 day median time to sell by targeting listings that have been on the market for three weeks or more, where sellers may be more open to negotiating on price or terms.
- Use the 2.4% year over year drop in median sold price and the 4.8% drop in median active list price as leverage when comparing a home’s current ask to what similar homes sold for a year ago.
- Focus your search in the $300,000 to $599,999 range if you want the most inventory and the most recent comparable sales, since that band accounted for roughly 44% of August’s closings.
- Talk to your lender now about rate buydown or closing cost credit strategies, since a slower market gives you more room to ask for concessions than a multiple-offer environment would.
- Watch the months supply figure over the next few months. If it climbs further past 5.06, expect even more room to negotiate; if it falls back toward 4, expect competition to pick back up.
- Get pre-approved and ready to move before the traditionally slower late fall and winter months, since well priced homes are still closing near 97% of list price.
Action Items for Sellers
- Price your listing using the most recent 30 to 60 days of closed sales, not spring 2026 comps, since median active list price is down 4.8% from a year ago.
- Expect a longer runway to close than earlier this summer. The median time to sell jumped to 66 days in August, so build that timeline into any plans tied to your sale.
- Avoid the price reduction cycle by setting an accurate number at launch. Sellers who needed a reduction closed an average of 6.47 percentage points below their original list price this month.
- Highlight your home’s condition and location clearly in your listing, since 939 new listings competed for buyer attention in August and standing out matters more when inventory is elevated.
- If your home is priced in the $600,000 to $999,999 range, know that this segment made up about 29% of August sales, giving you a reasonably sized pool of comparable activity to price against.
- Review your listing every two to three weeks against new comparable closings, and be ready to adjust quickly if it has not generated strong interest, rather than waiting out a stale price for months.
Final Word on the Market
August 2026 rewarded patience and pricing discipline over speed. This was not a month where homes flew off the market within days of listing. It was a month where the properties that sold tended to be priced accurately, and where buyers who were willing to negotiate found more room to do so than they had in months.
Taken together, the numbers point to a Central Texas market settling into a steadier, more seasonal rhythm after a strong summer, rather than one showing signs of real trouble. Prices held up better than sales volume did, inventory eased rather than piled up, and the fundamentals that have supported Austin real estate for years remain in place.
For a broader look at what the season ahead may bring, see our Austin Real Estate Market: What to Expect This Fall 2026.
For the most current data, see our September 2026 Austin Real Estate Price Report.
Whether you are weighing a purchase or considering a sale, the data here is meant to be a guide, not a verdict. Talk through what these numbers mean for your specific street, price point, and timeline, and make the decision that fits your life and your financial situation.
Questions About the August 2026 Austin Real Estate Price Report?
Have questions about what the August 2026 Austin Real Estate Price Report means for your specific situation? We are happy to help. If you are thinking about buying a home in Austin, our Buyers page has resources to help you understand the process and get started. If you are thinking about selling, our Sellers page walks through what to expect in today’s market.
Reach out to Rebecca Jacks and the team at Eleven Oaks Realty. Call or text (512) 827-8323 or email info@11OaksRealty.com. We have been helping buyers and sellers since 1978 and we are here to help you make the best decision for your situation, whatever that looks like.
Data sources: Realtors Property Resource (RPR), Austin Board of REALTORS MLS, Unlock MLS. All figures are for single-family residential properties in the city of Austin. Reported figures reflect August 1, 2026 through August 31, 2026. Some variation between data sources may exist due to differing methodology and timing of data pulls.




Leave a Reply