Eleven Oaks Realty is proud to present their 78745 Austin Real Estate Price Report, a summary of single family home market activity in Austin’s 78745 zip code.
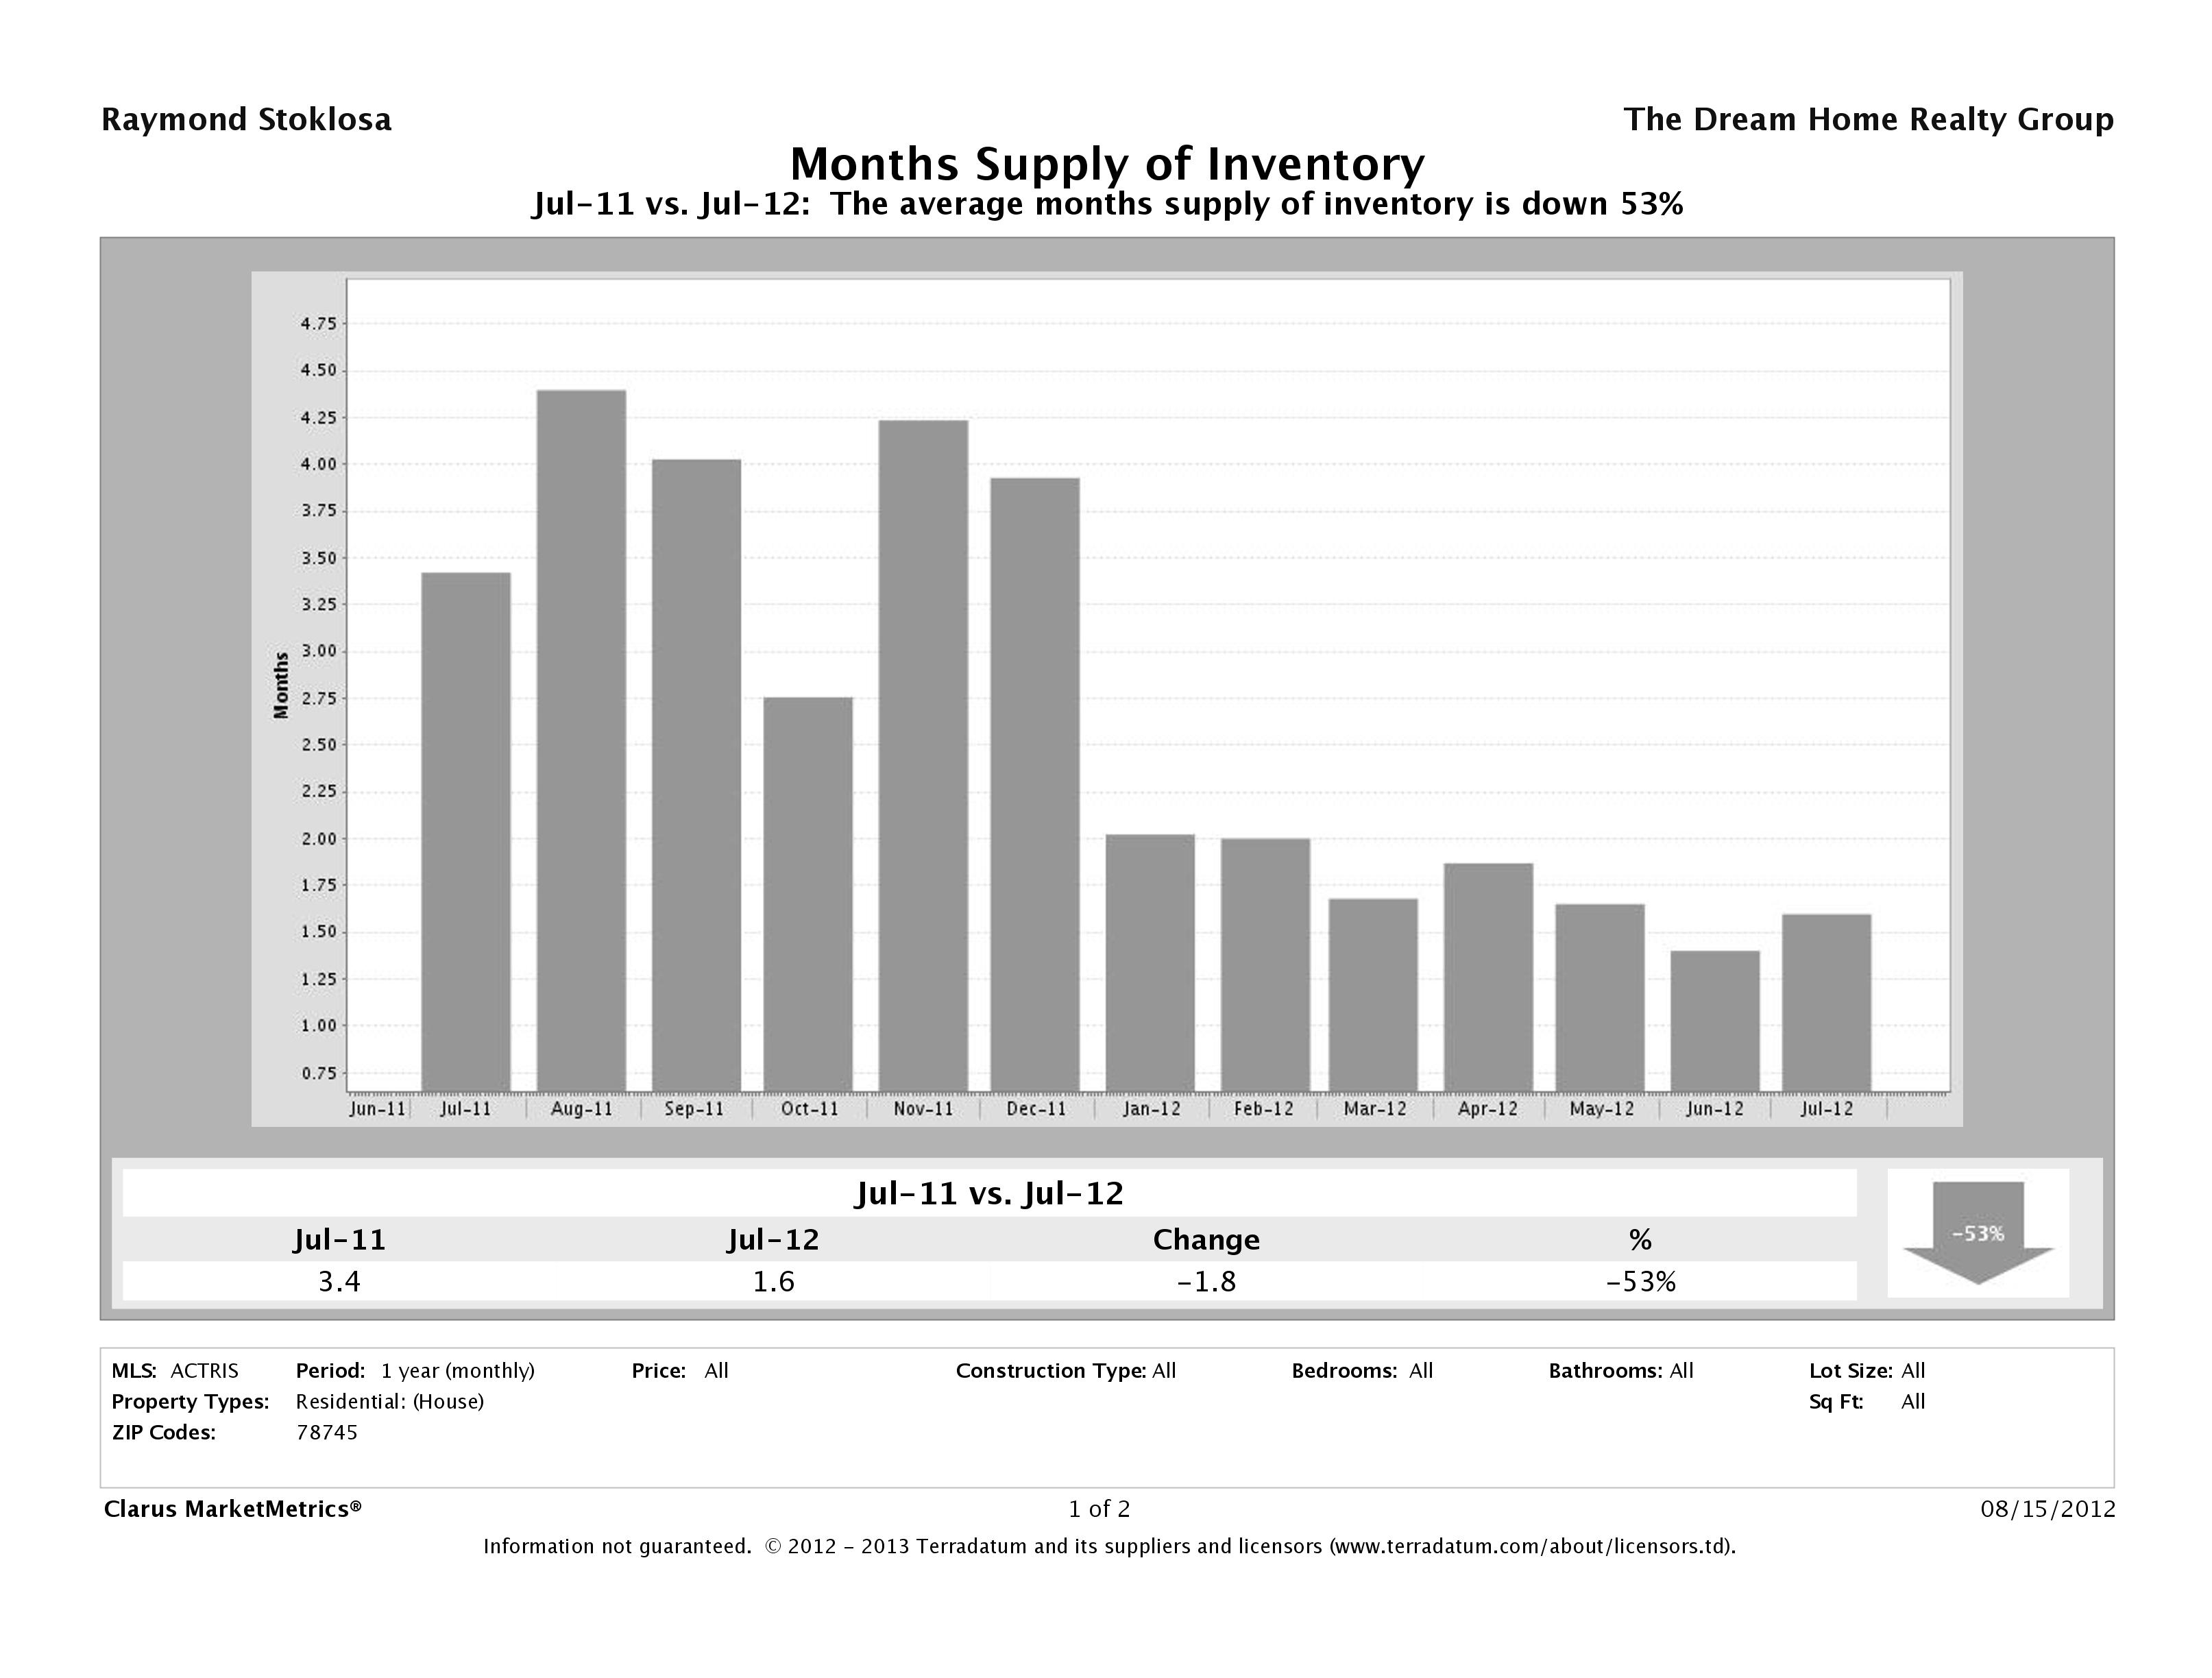
Months Supply of Inventory in 78745 Down 53%
The biggest story for July 2012 in 78745 comes by way of the decreased inventory. In July 2012, we had just over 1.5 months of inventory available in 78745, compared to just about 3.5 months in July 2011 marking a 53% decrease. It seems this story stays consistent over Austin, especially in the more desirable zip codes.
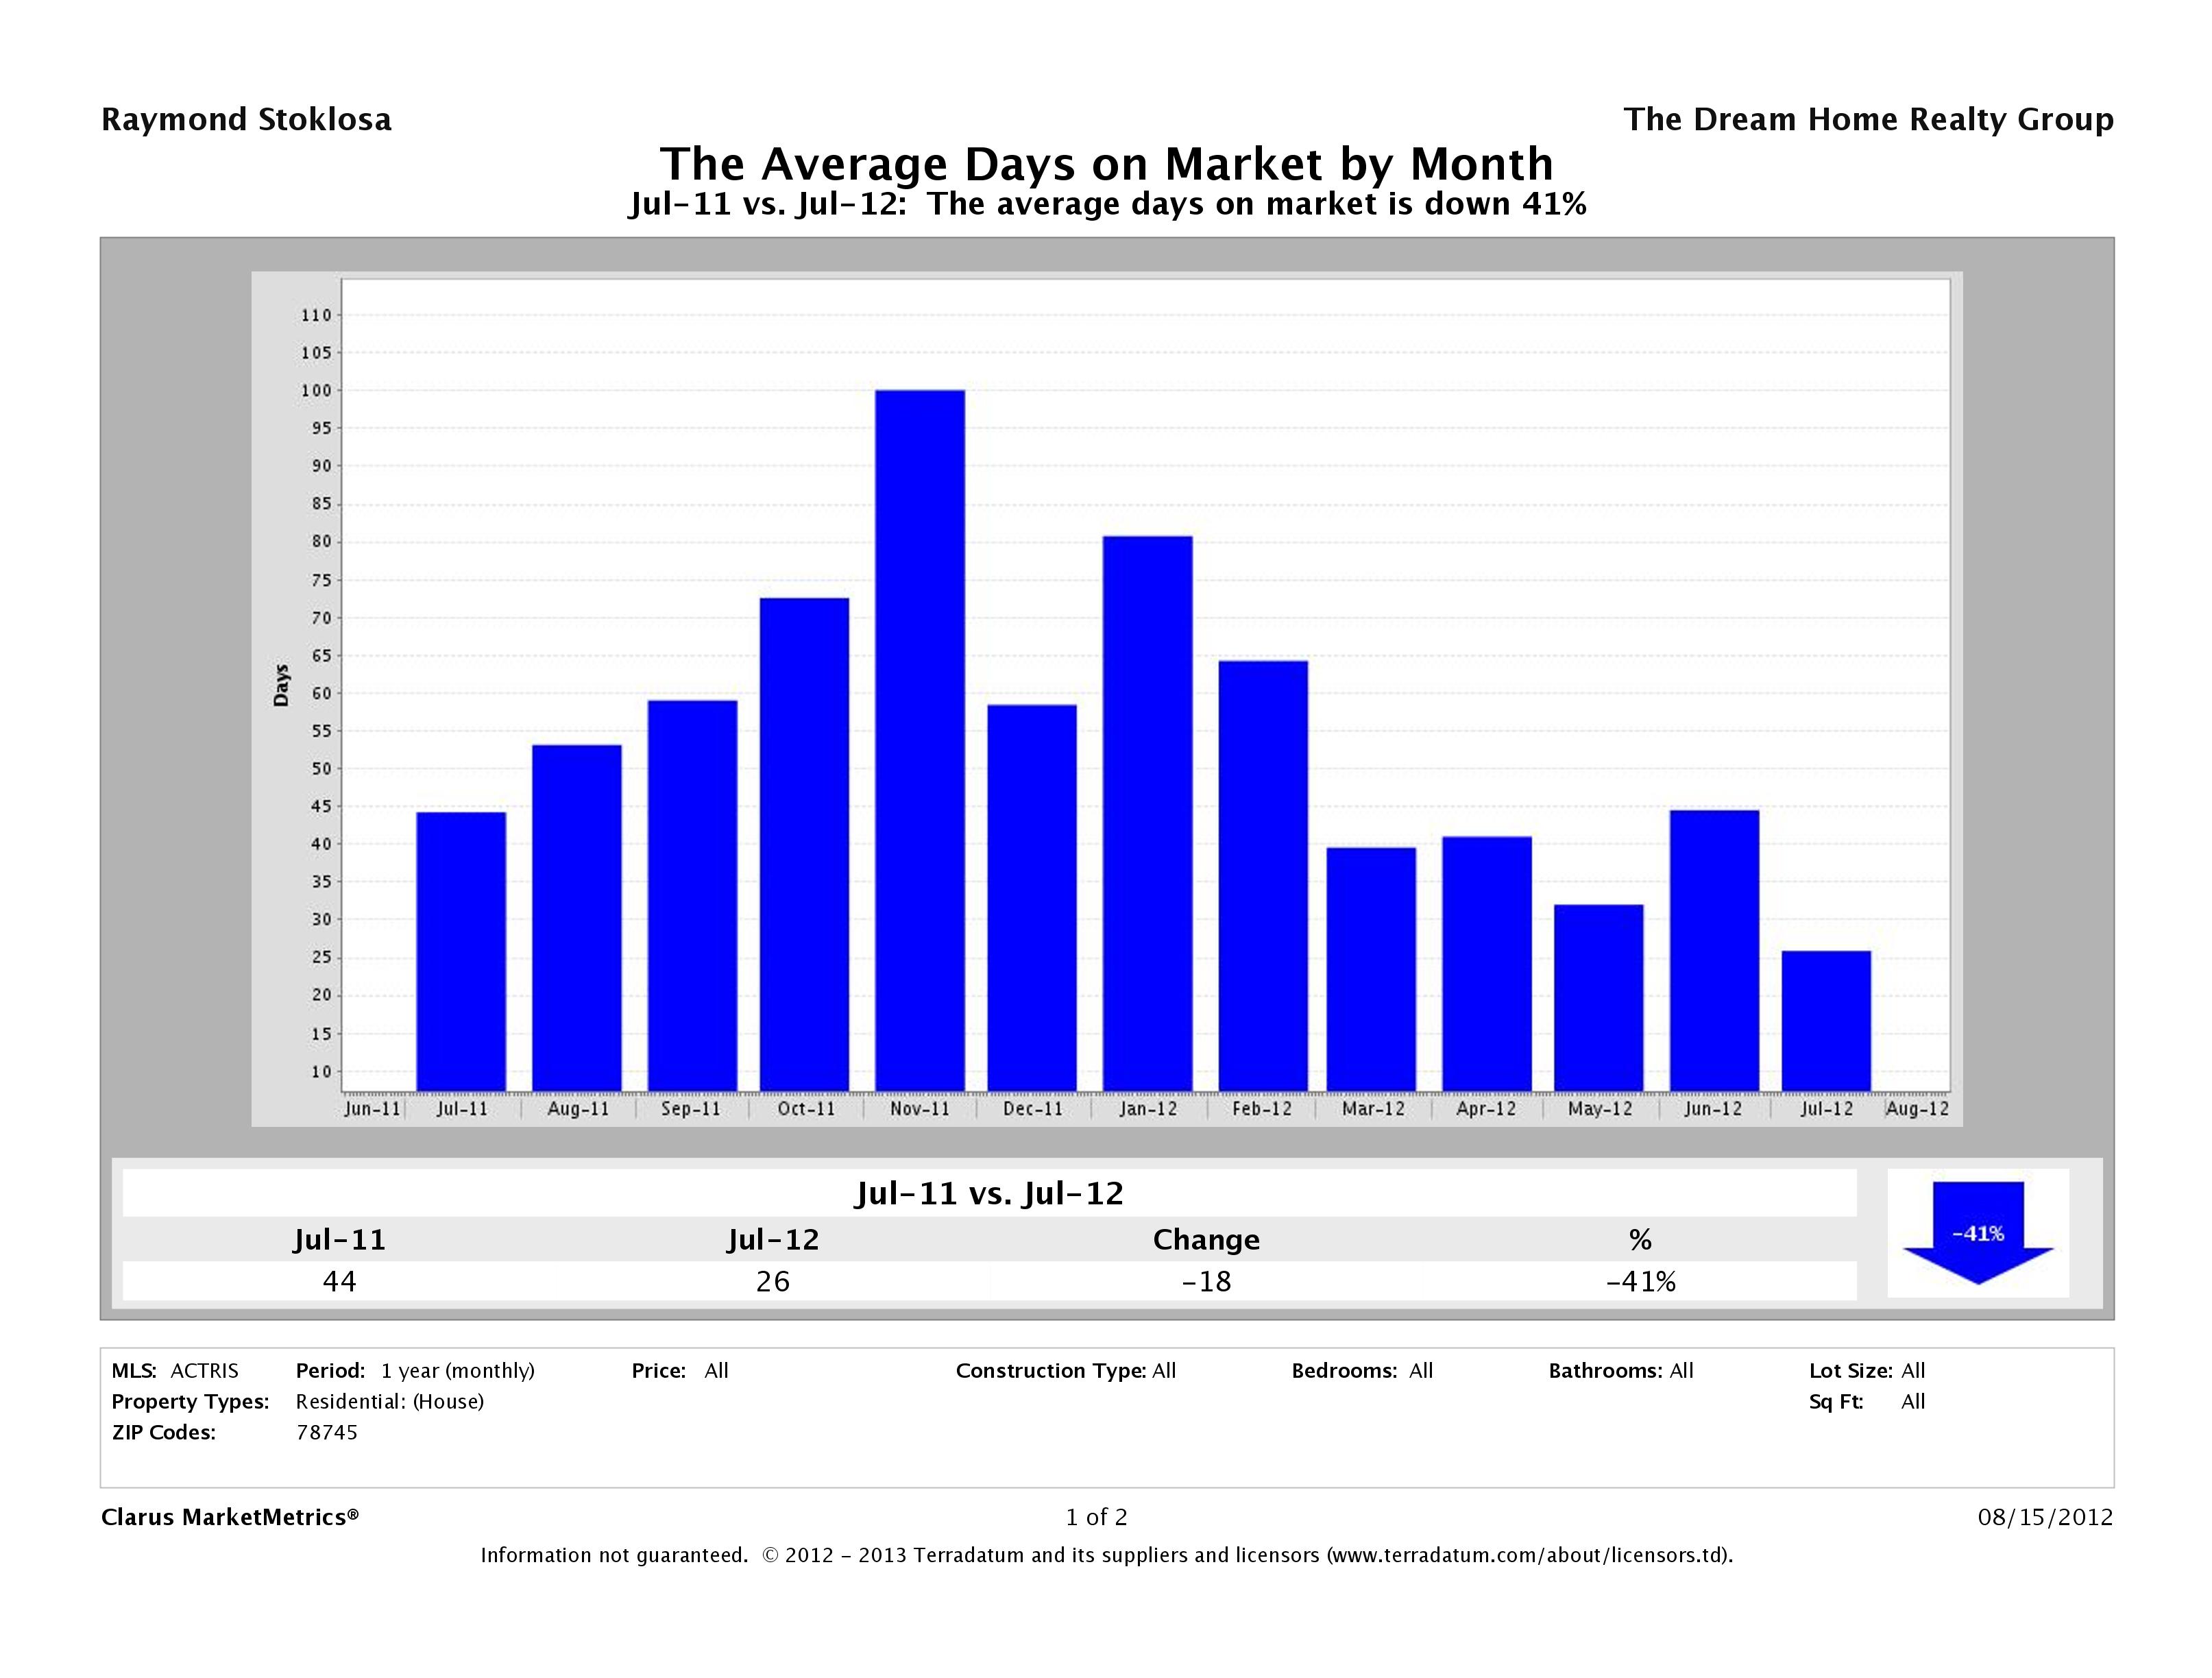
Homes in 78745 Selling 41% Faster
In July 2011, it took 44 days to sell a home in 78745 compared to just 26 days in July 2012. July 2012 marks the shortest amount of time to sell we’ve seen in over a year, which is a strong indicator of a seller’s market.
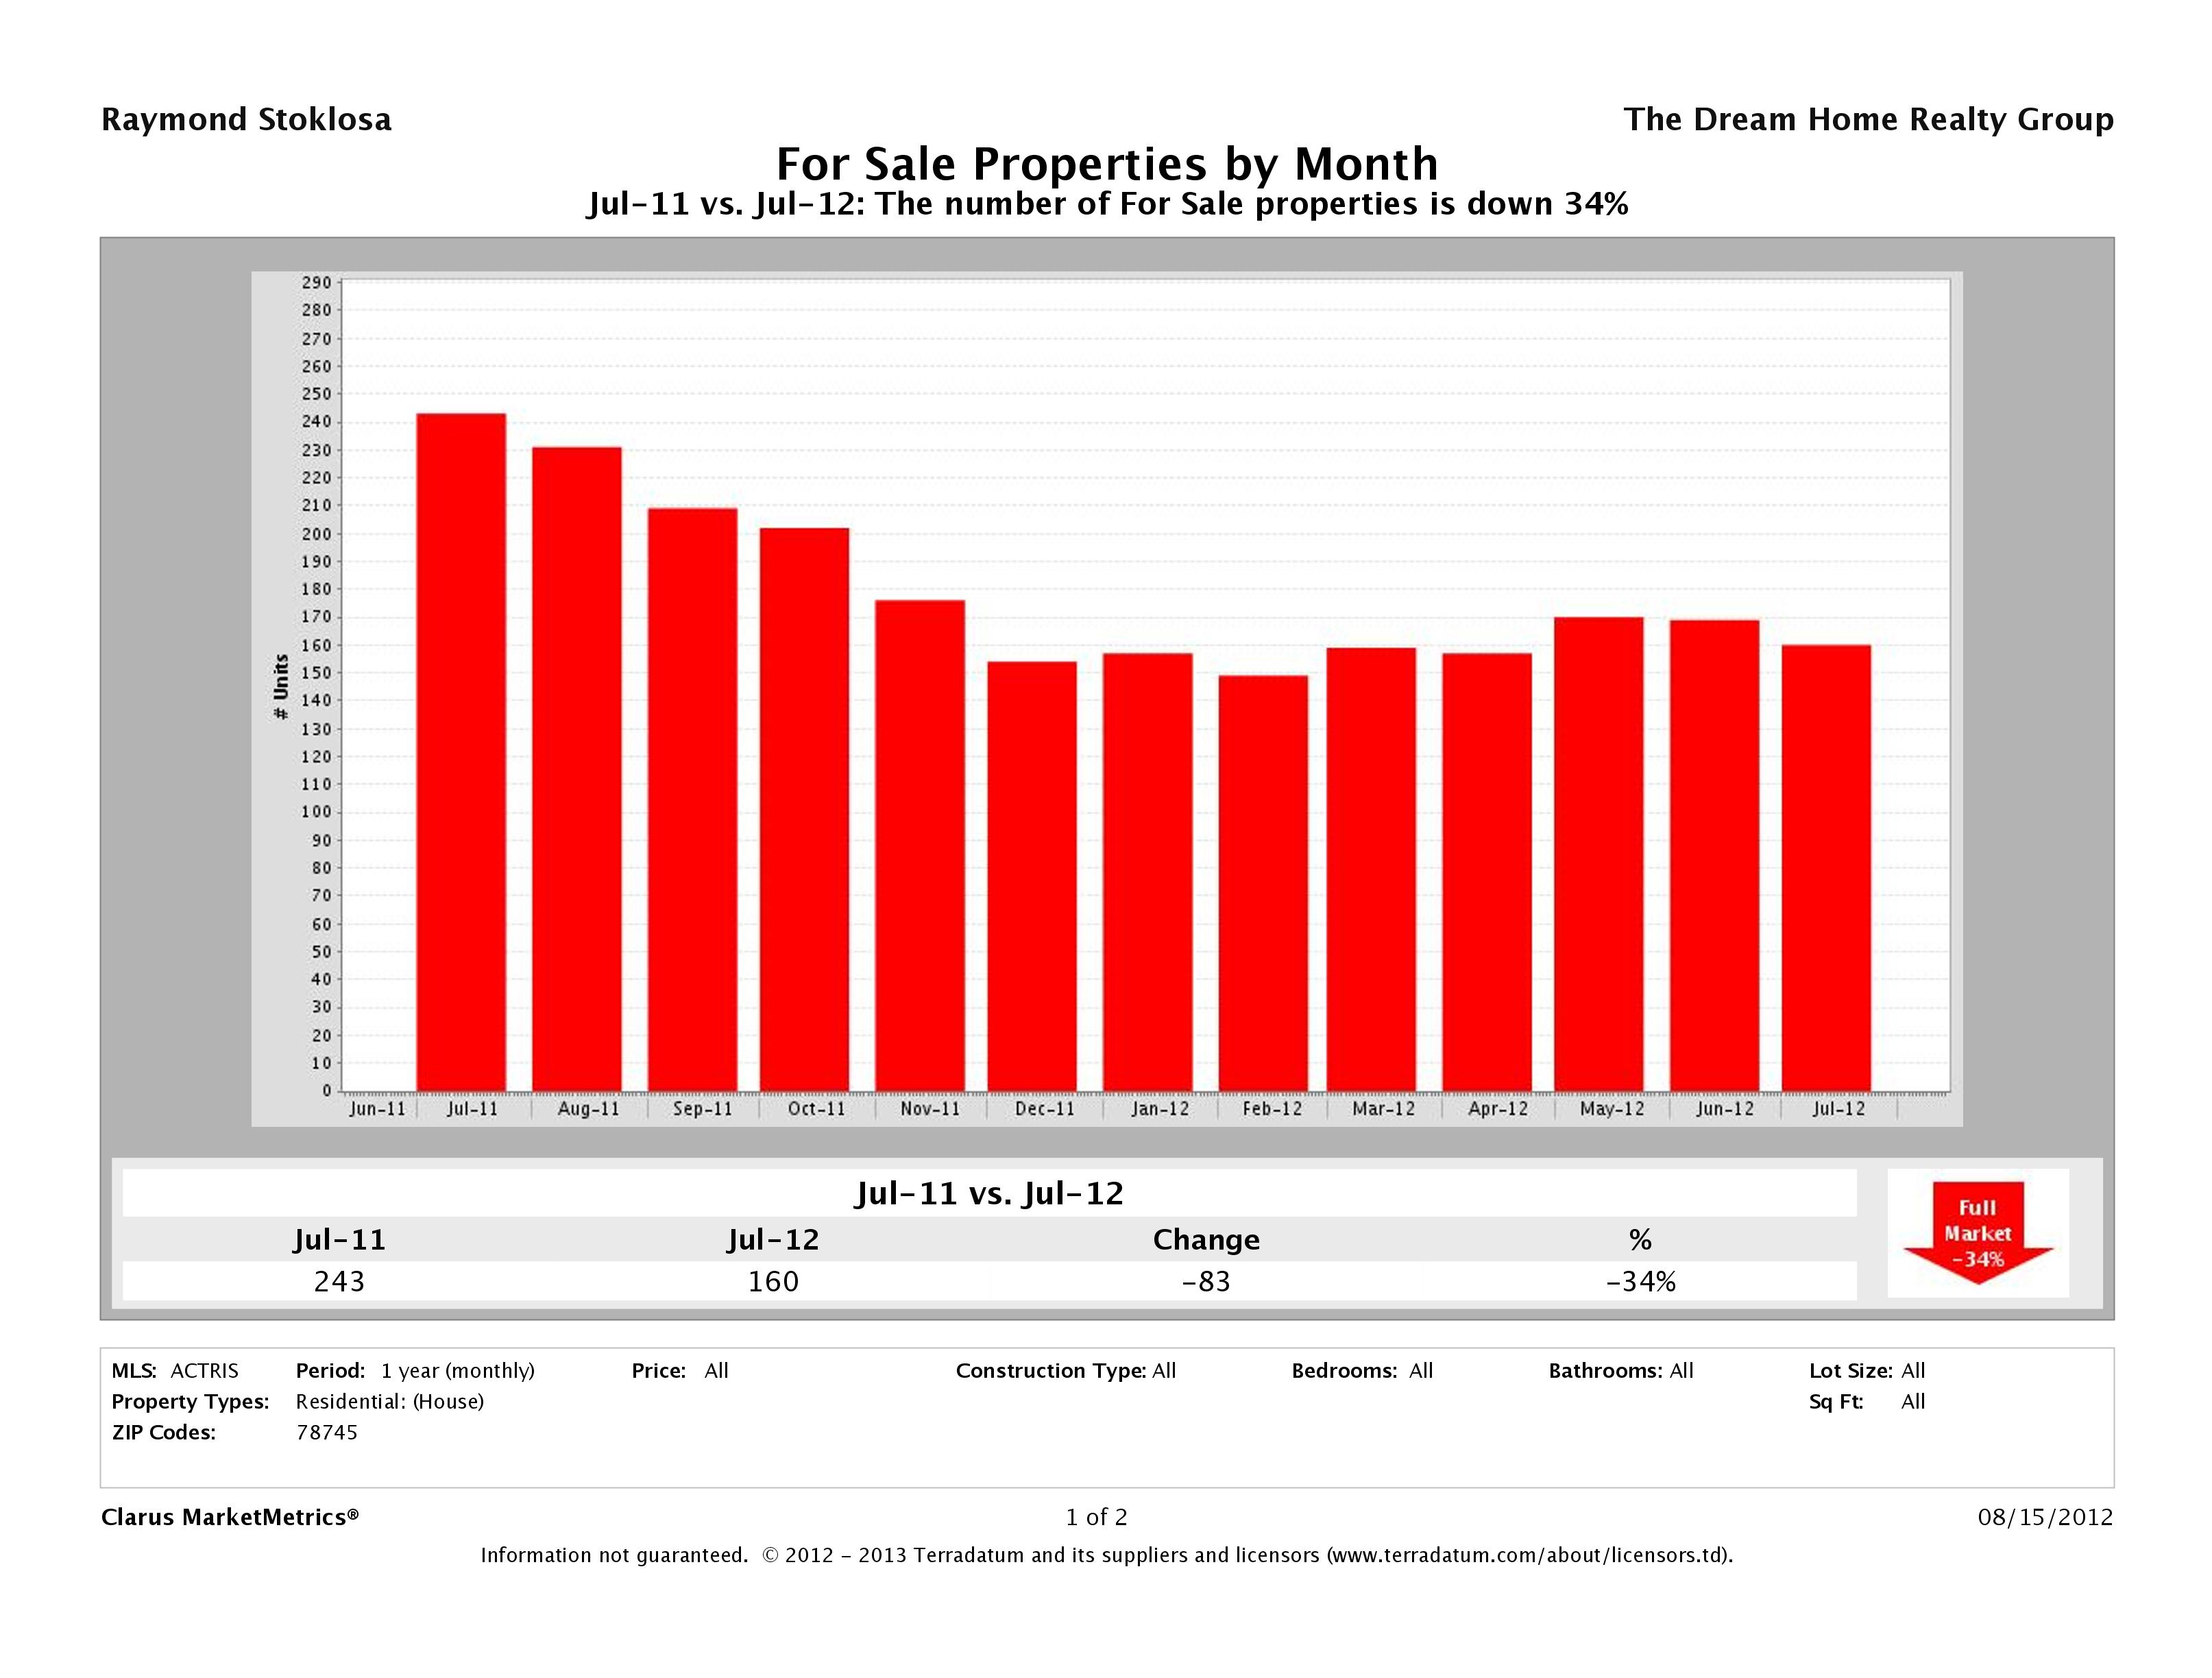
34% Fewer Homes on the Market
Over the past 8 months, we’ve seen fewer properties for sale in 78745 than in the past year. As 78745 continues to attract people who want to live near Downtown but who don’t want to pay Downtown prices, I would imagine we would continue to see this decreased inventory.
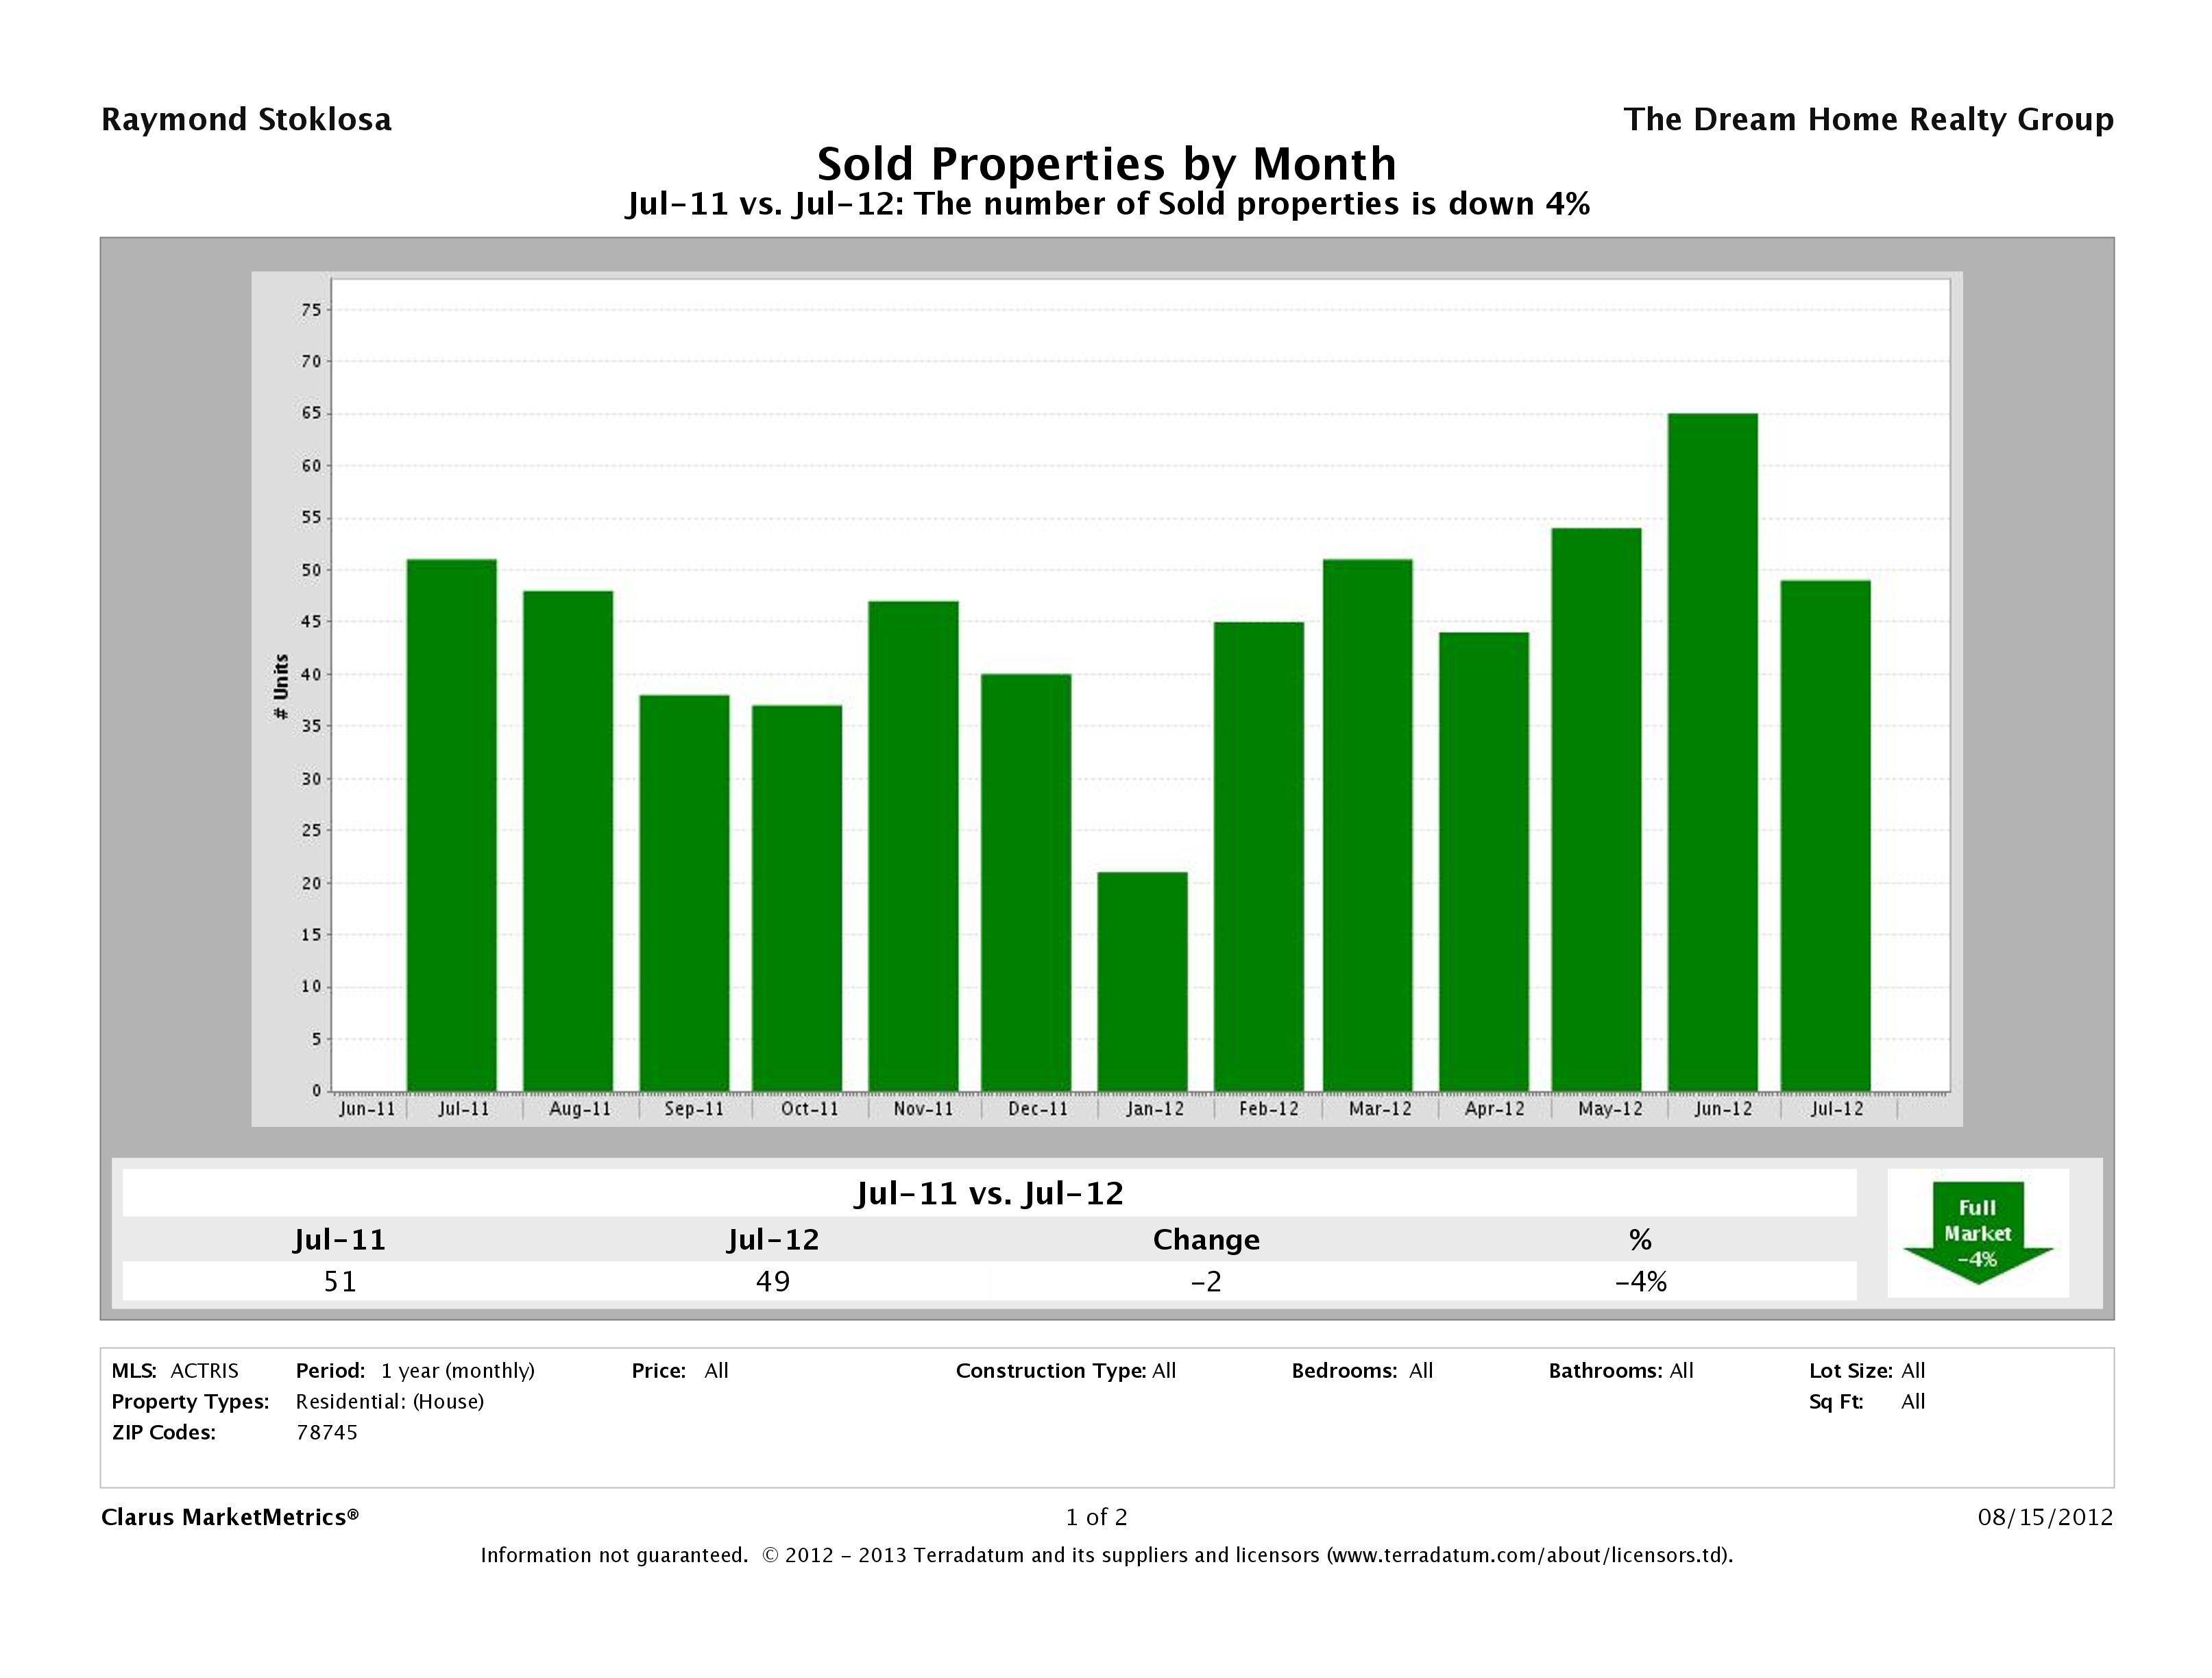
2% Fewer Homes Sold in 78745
Interestingly, we’re also seeing fewer homes selling in 78745 as we saw last year. In July 2012, 50 homes sold in 78745 compared to 51 in July 2011. Though this difference is not statistically relevant, it shows 78745 residents are buying and staying put.
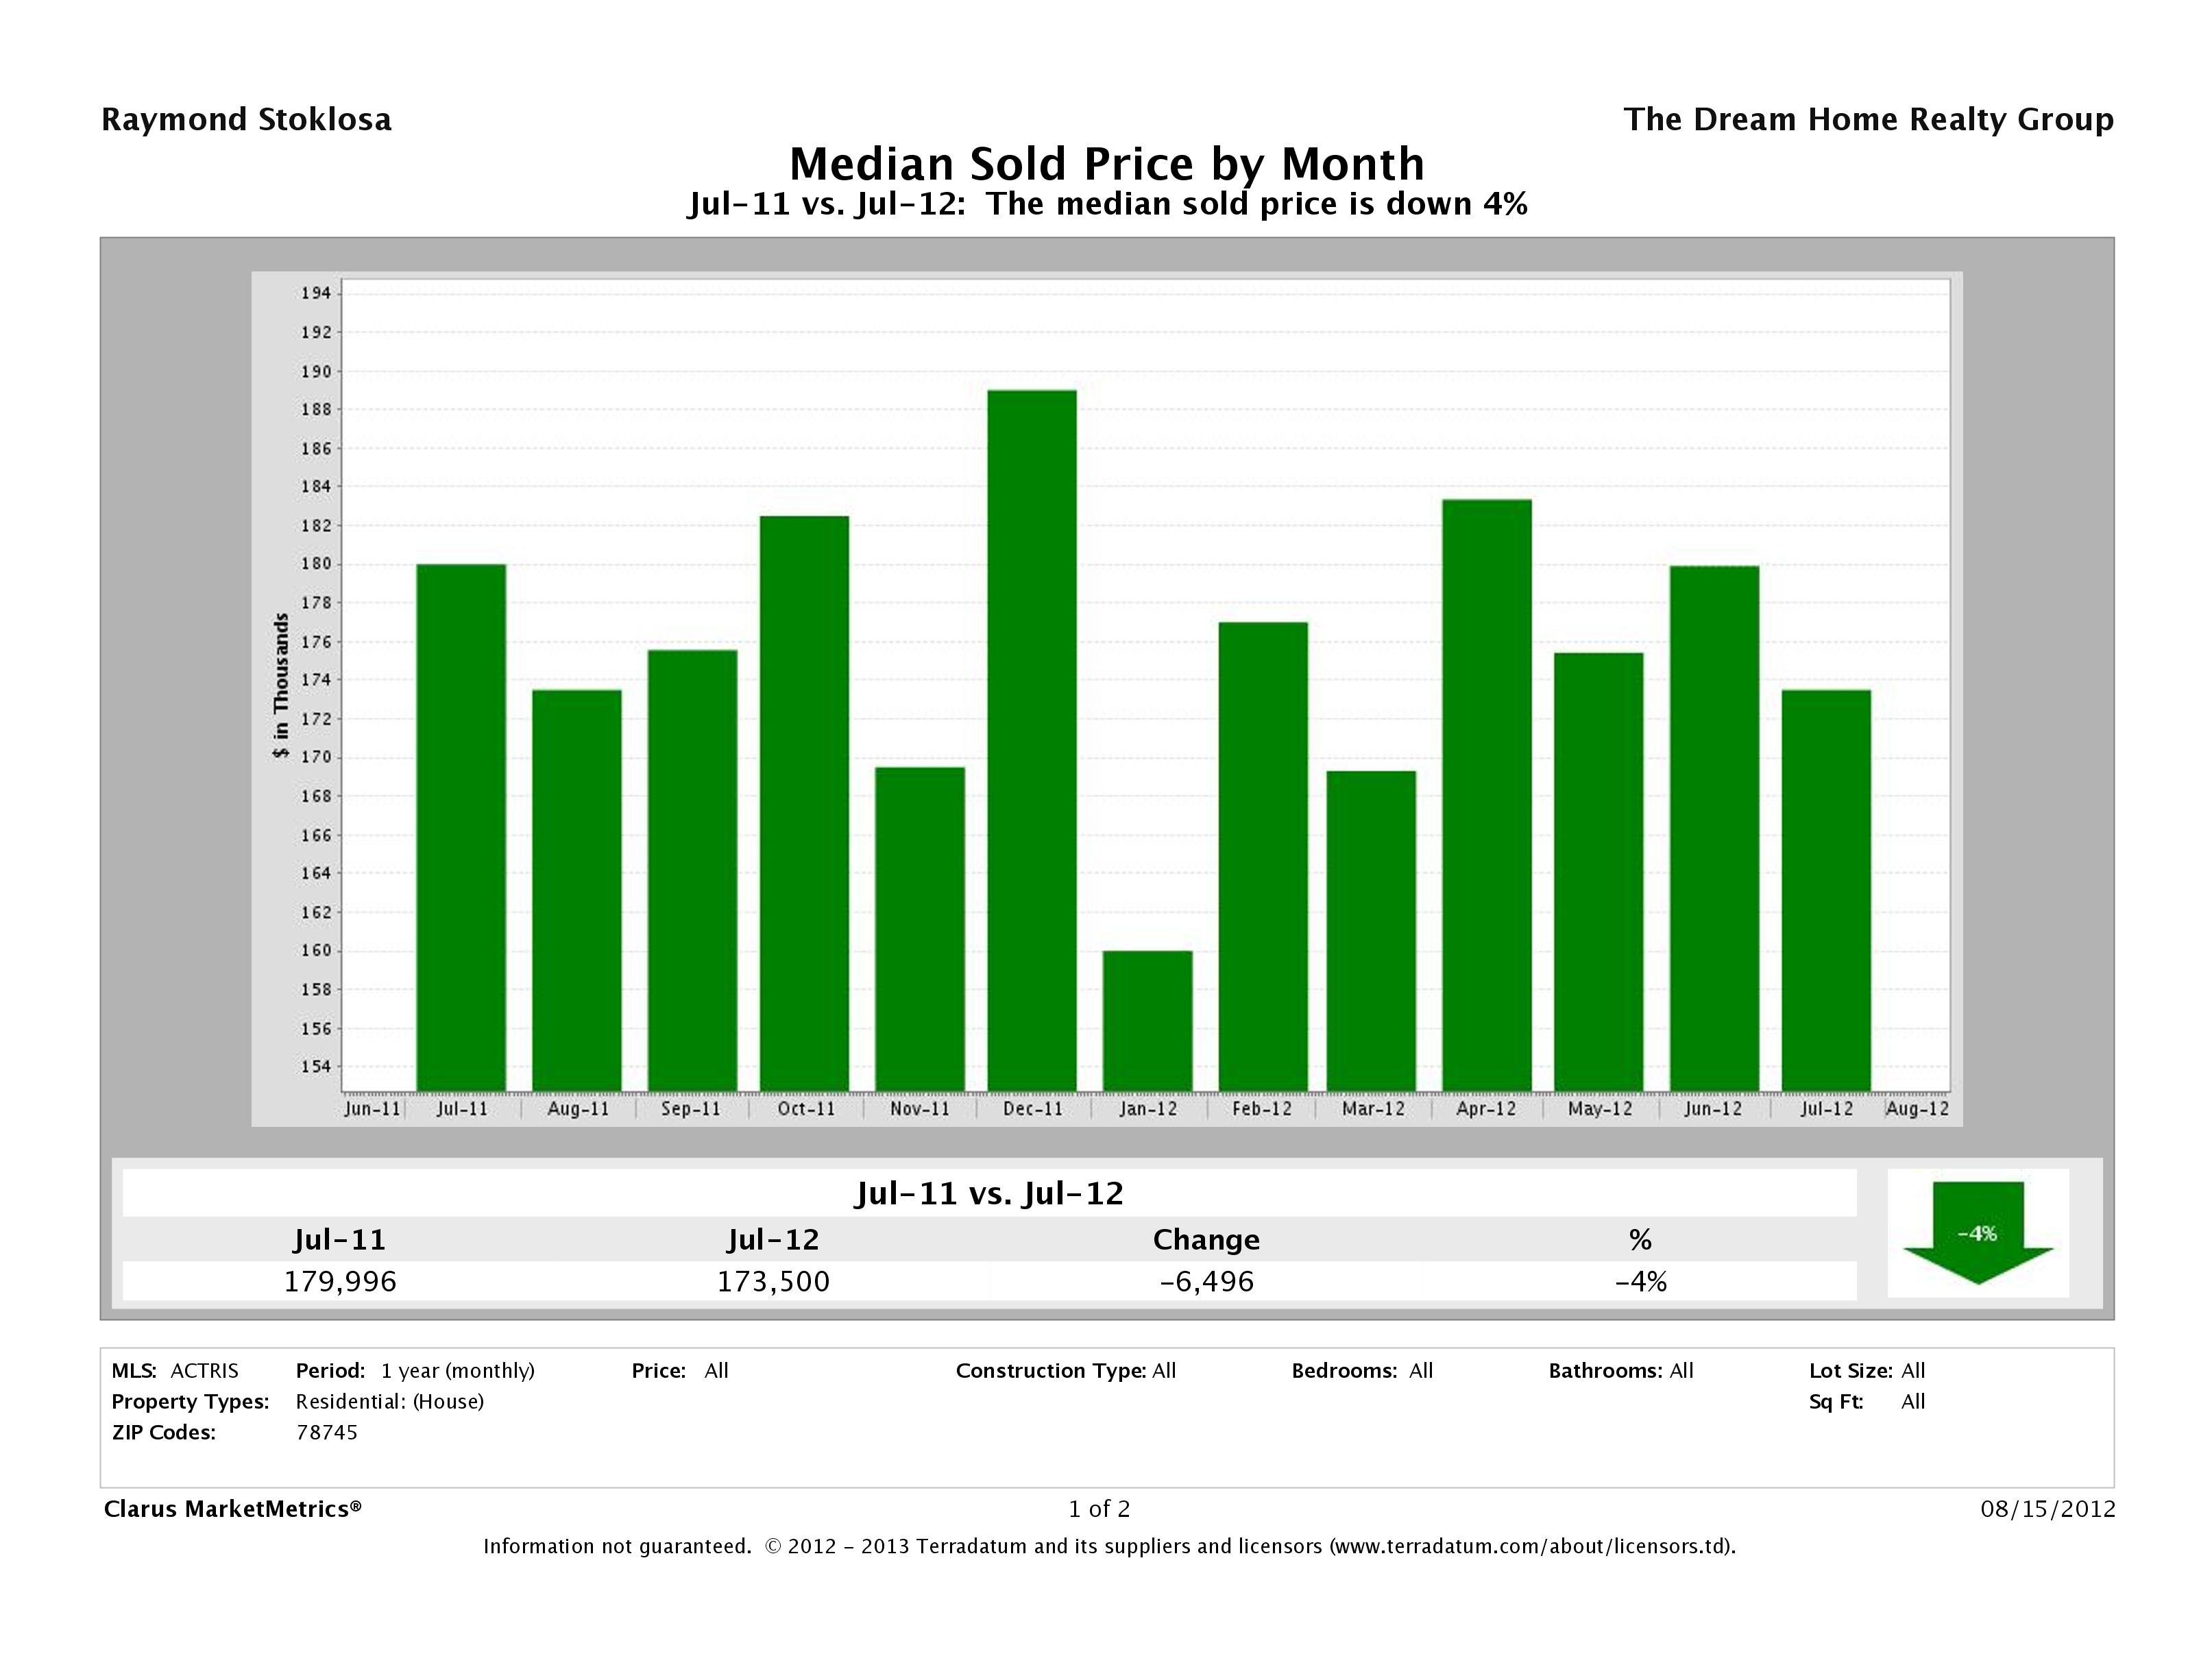
78745 Prices are Down 3%
Last year, the median sales price of a home in 78745 was $179,996 compared to $174,250 in July 2012, showing a 3% decrease. A lowered median price is an indicator more lower priced properties are selling as compared to higher priced properties which makes sense as buyers continue to snatch up the perceived deals.
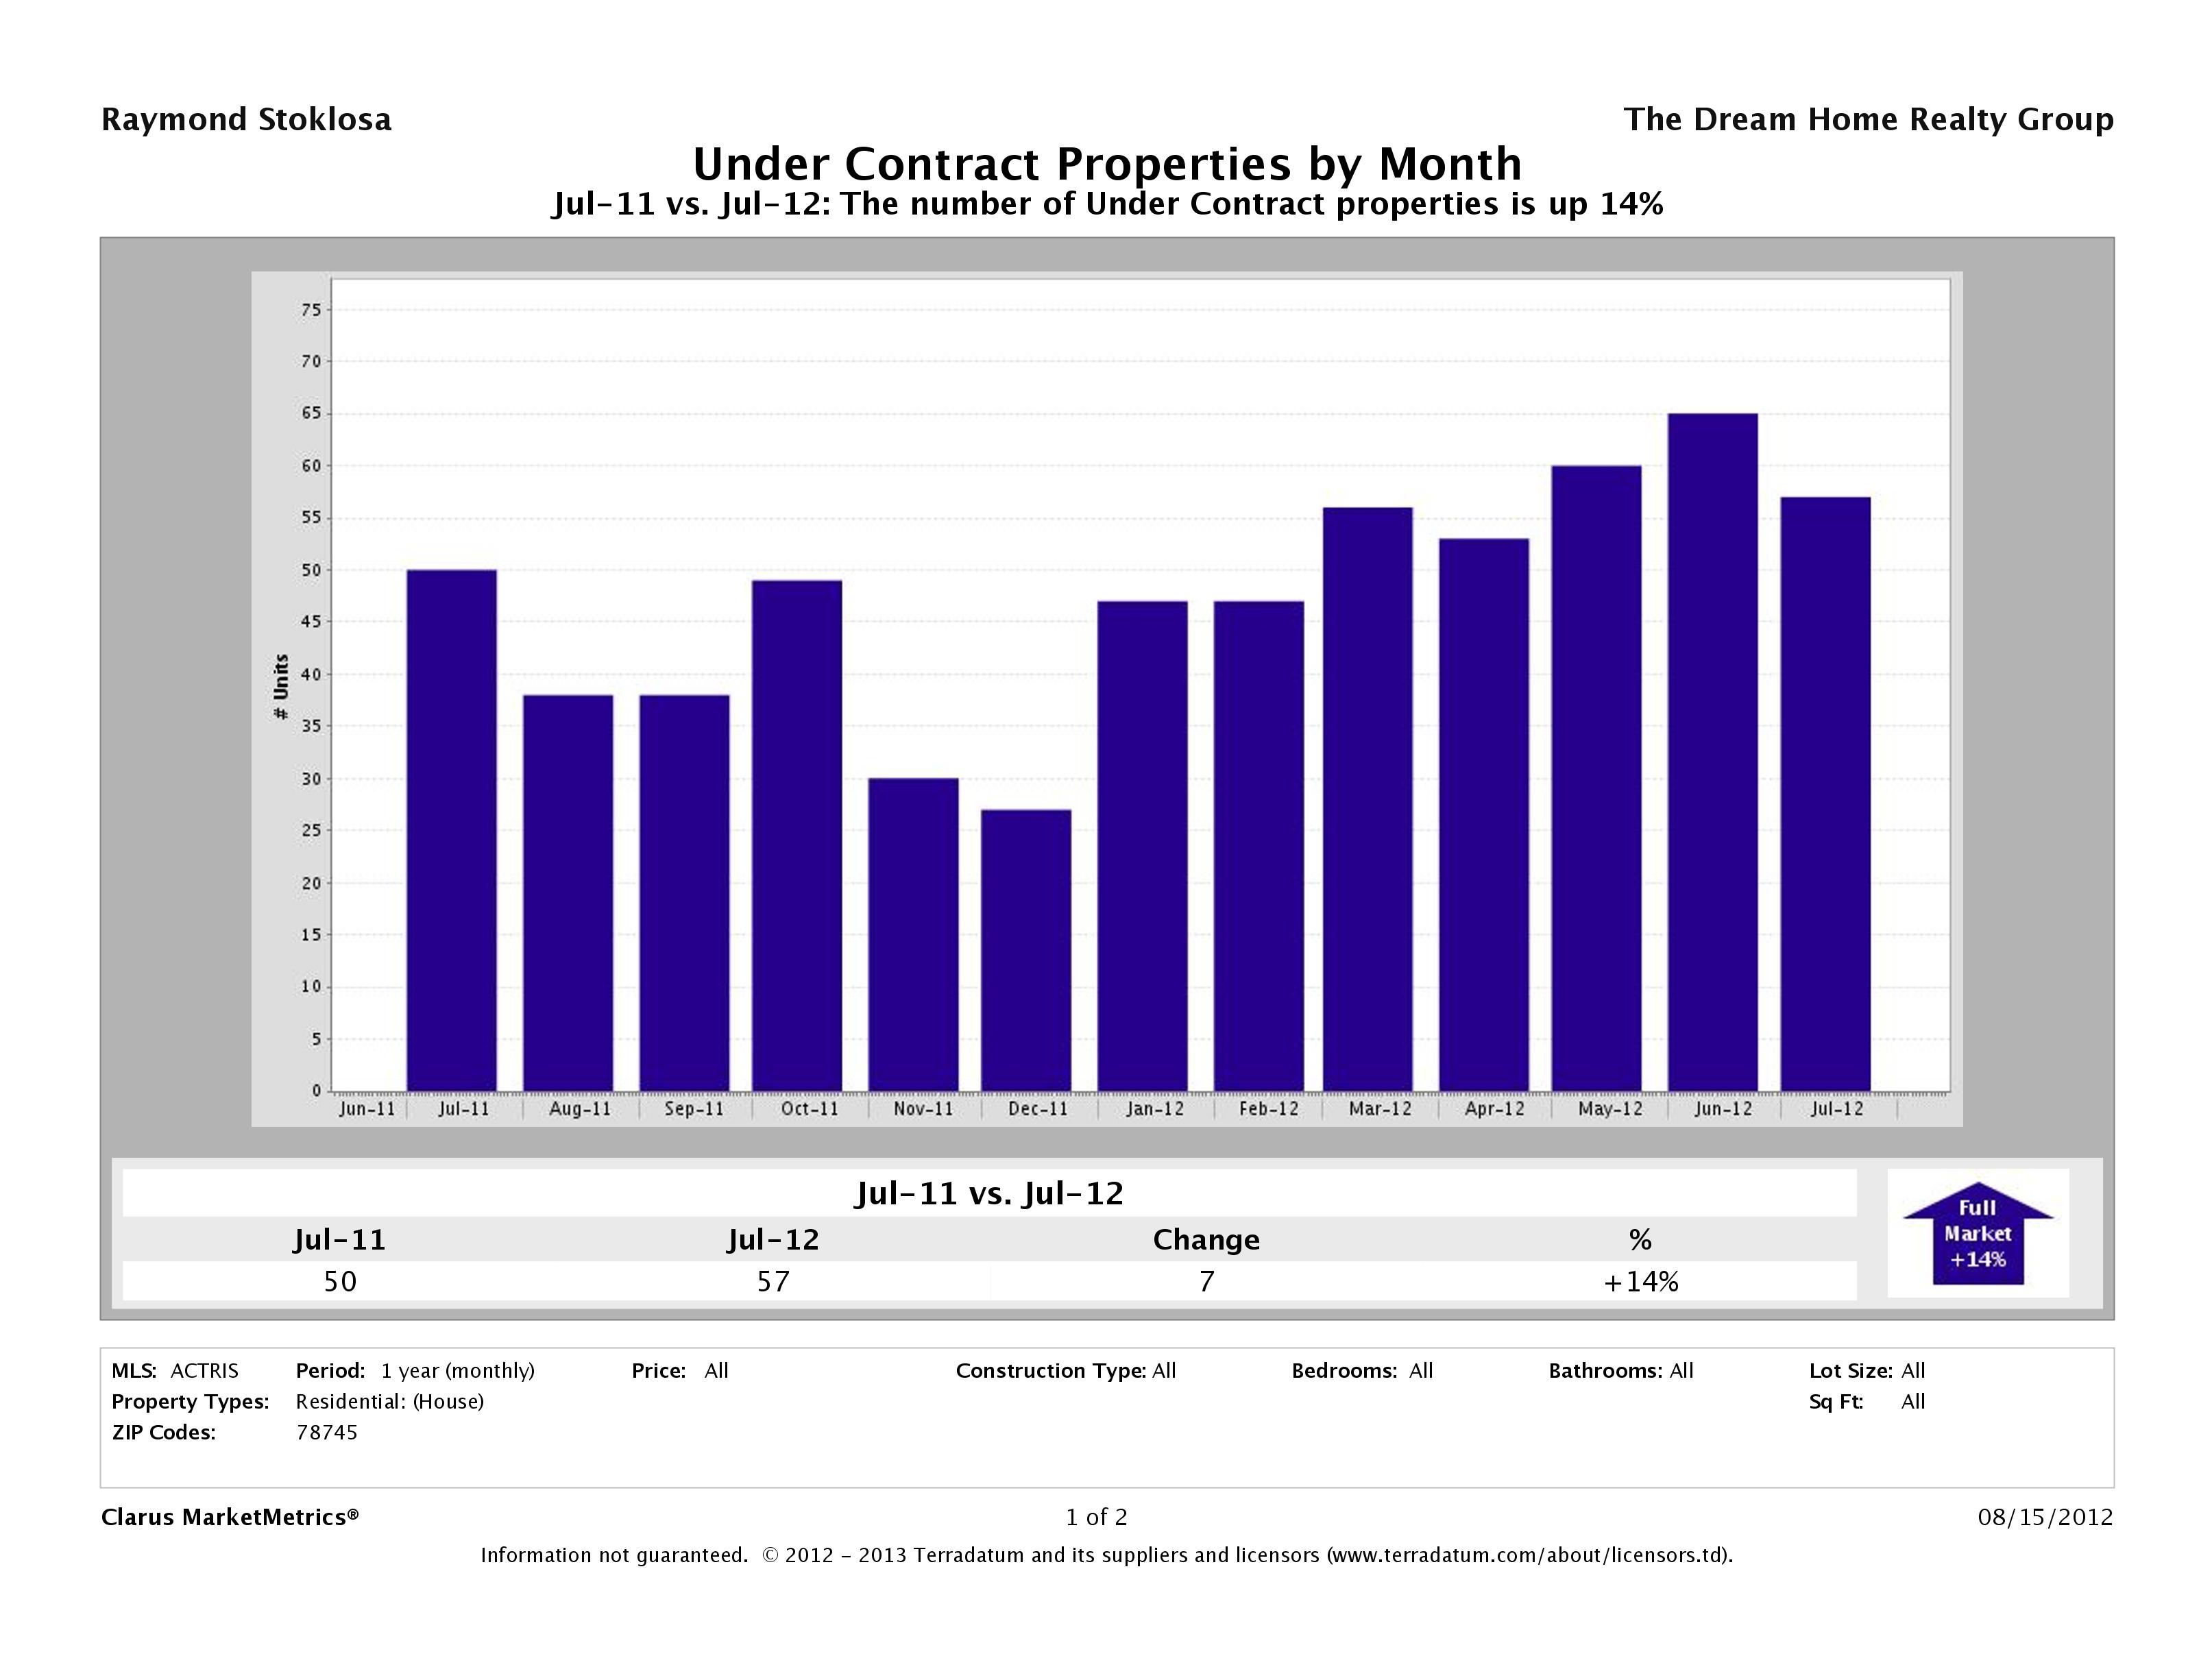
14% More Homes Under Contact in 78745
In July 2012, there were 57 homes that went under contract in 78745 compared to 50 homes in July 2011 marking a 14% increase in activity. We’ve seen this trend continuing upward over the past 7 months. 78745 continues to prove itself as one of Austin’s zip codes to watch.
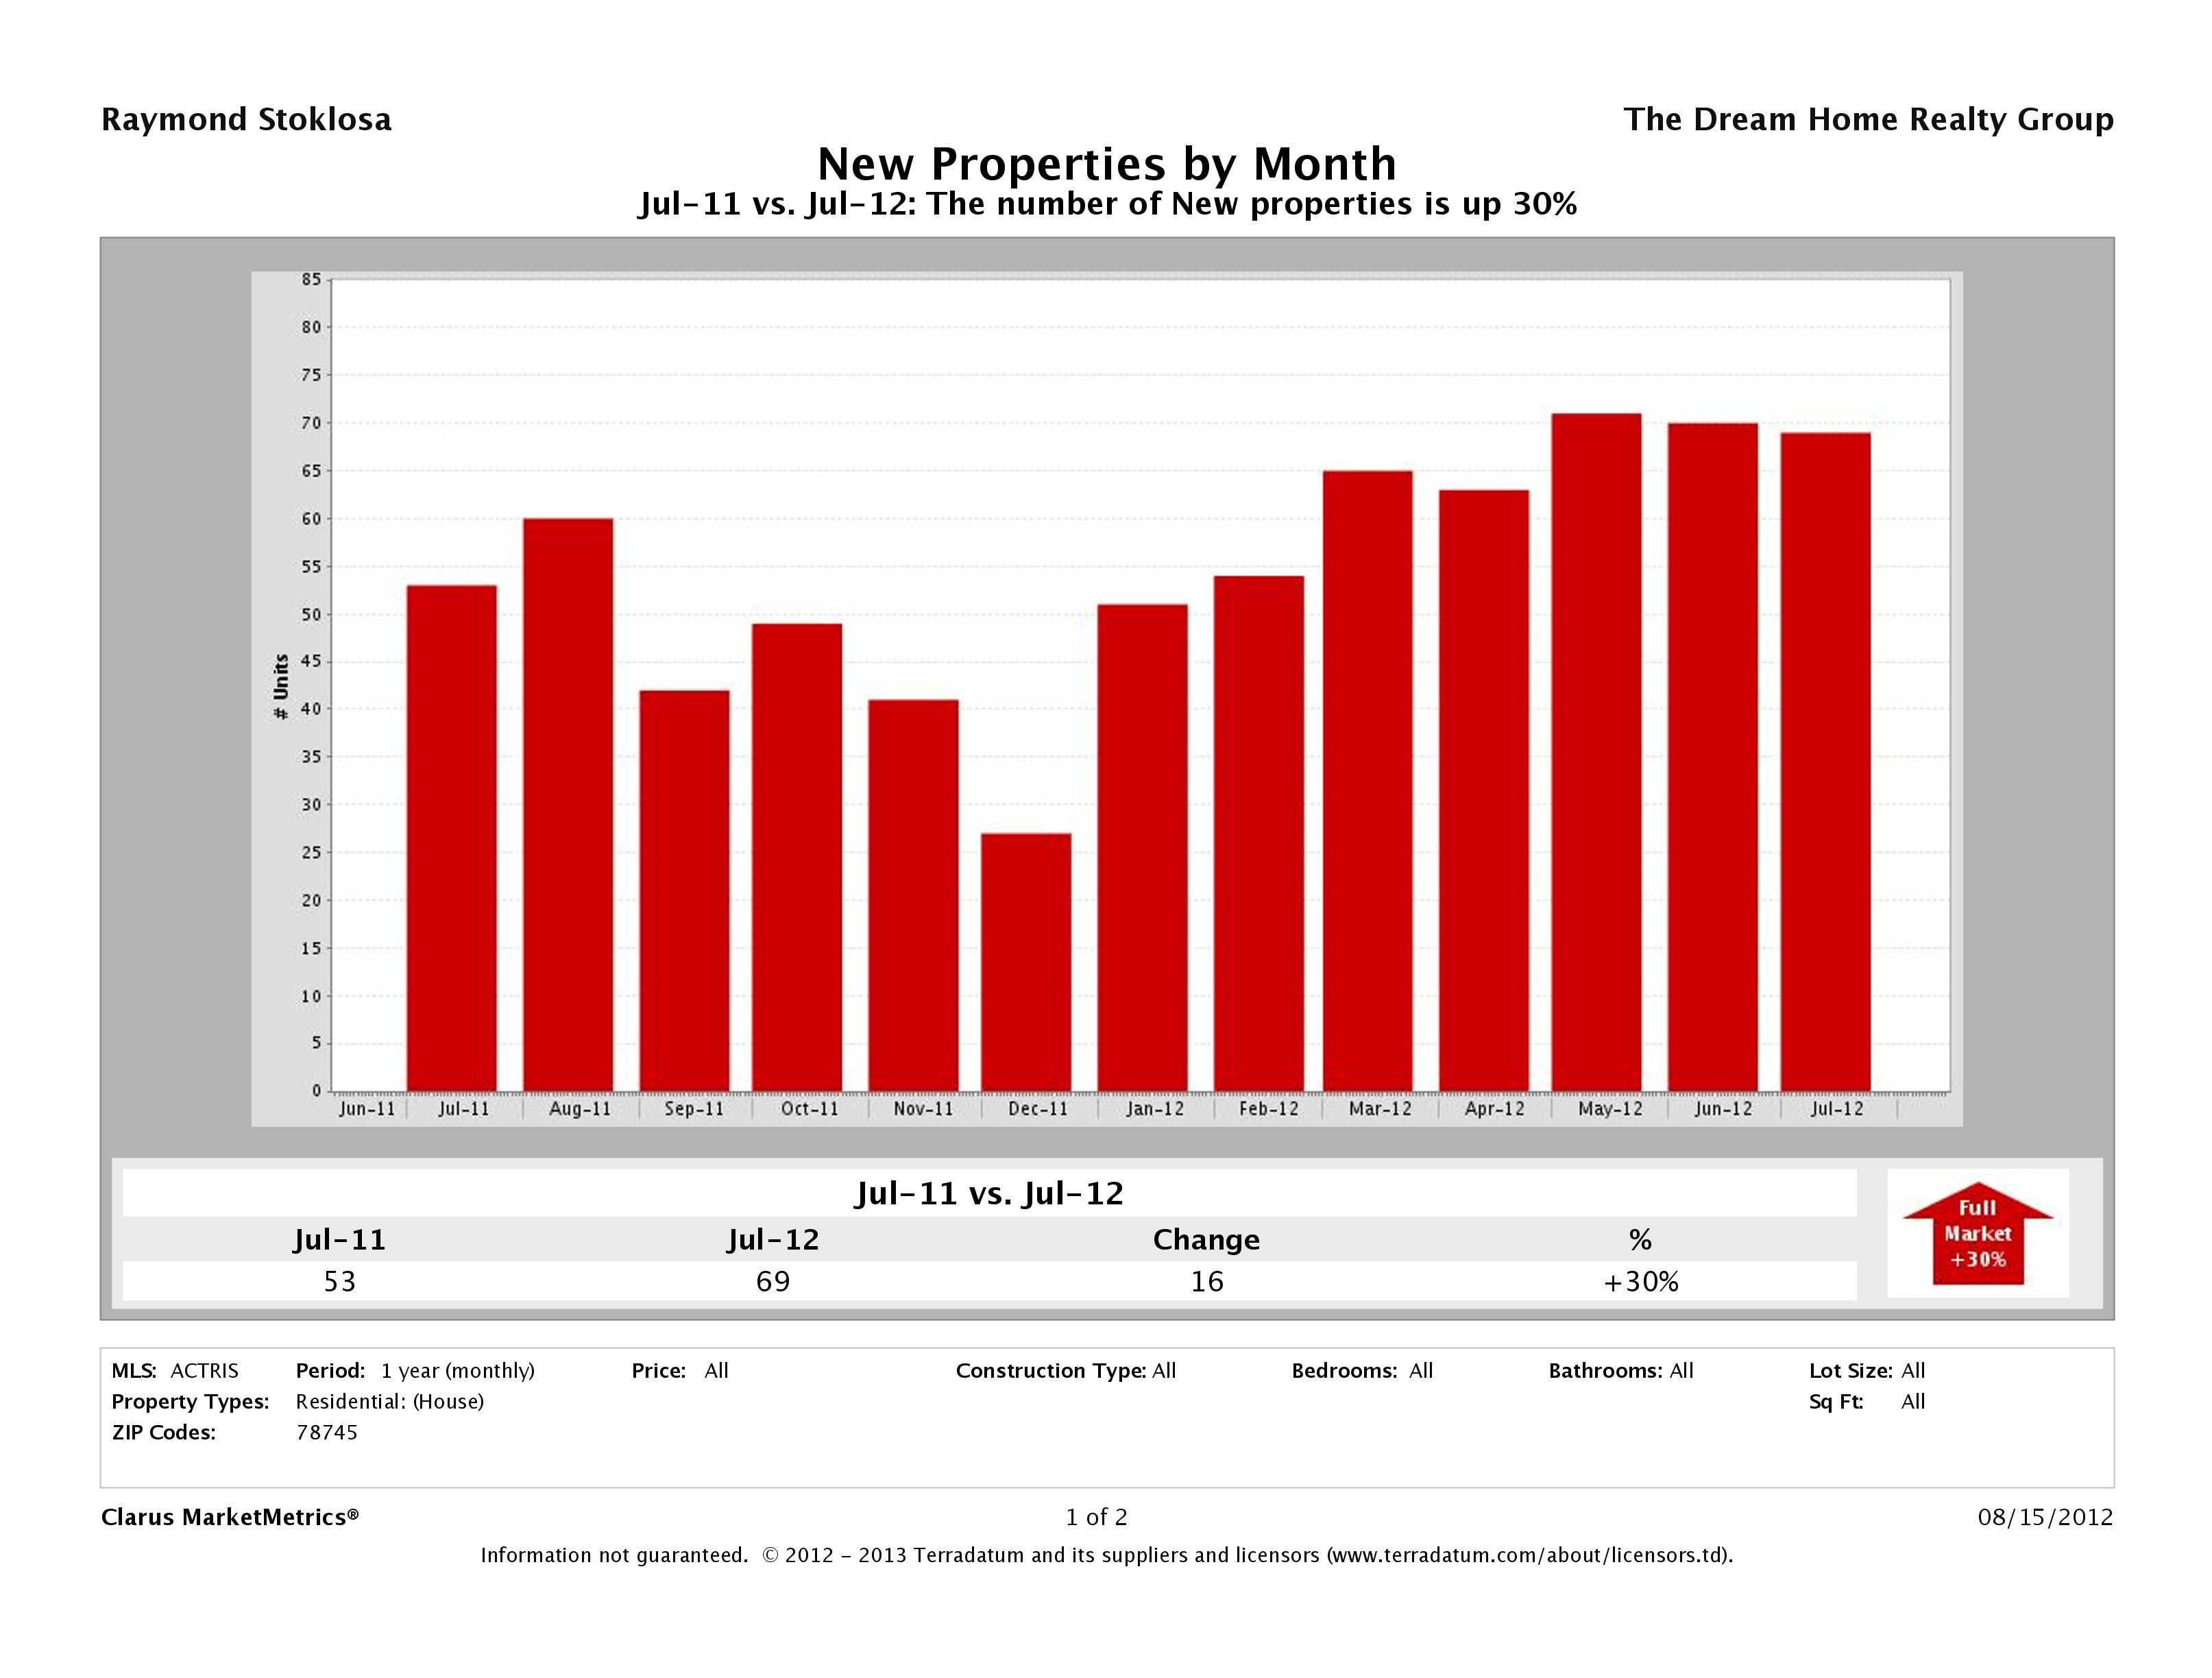
30% More Homes Listed in 78745 in July 2012
Even with record low inventory levels, sellers continue to list their homes with new listings up 30% in year over year numbers. In July 2011, there were 53 homes listed for sale in 78745 compared to 69 homes in July 2012. Considering the inventory levels and increasing activity, 78745 could support even more new listings.
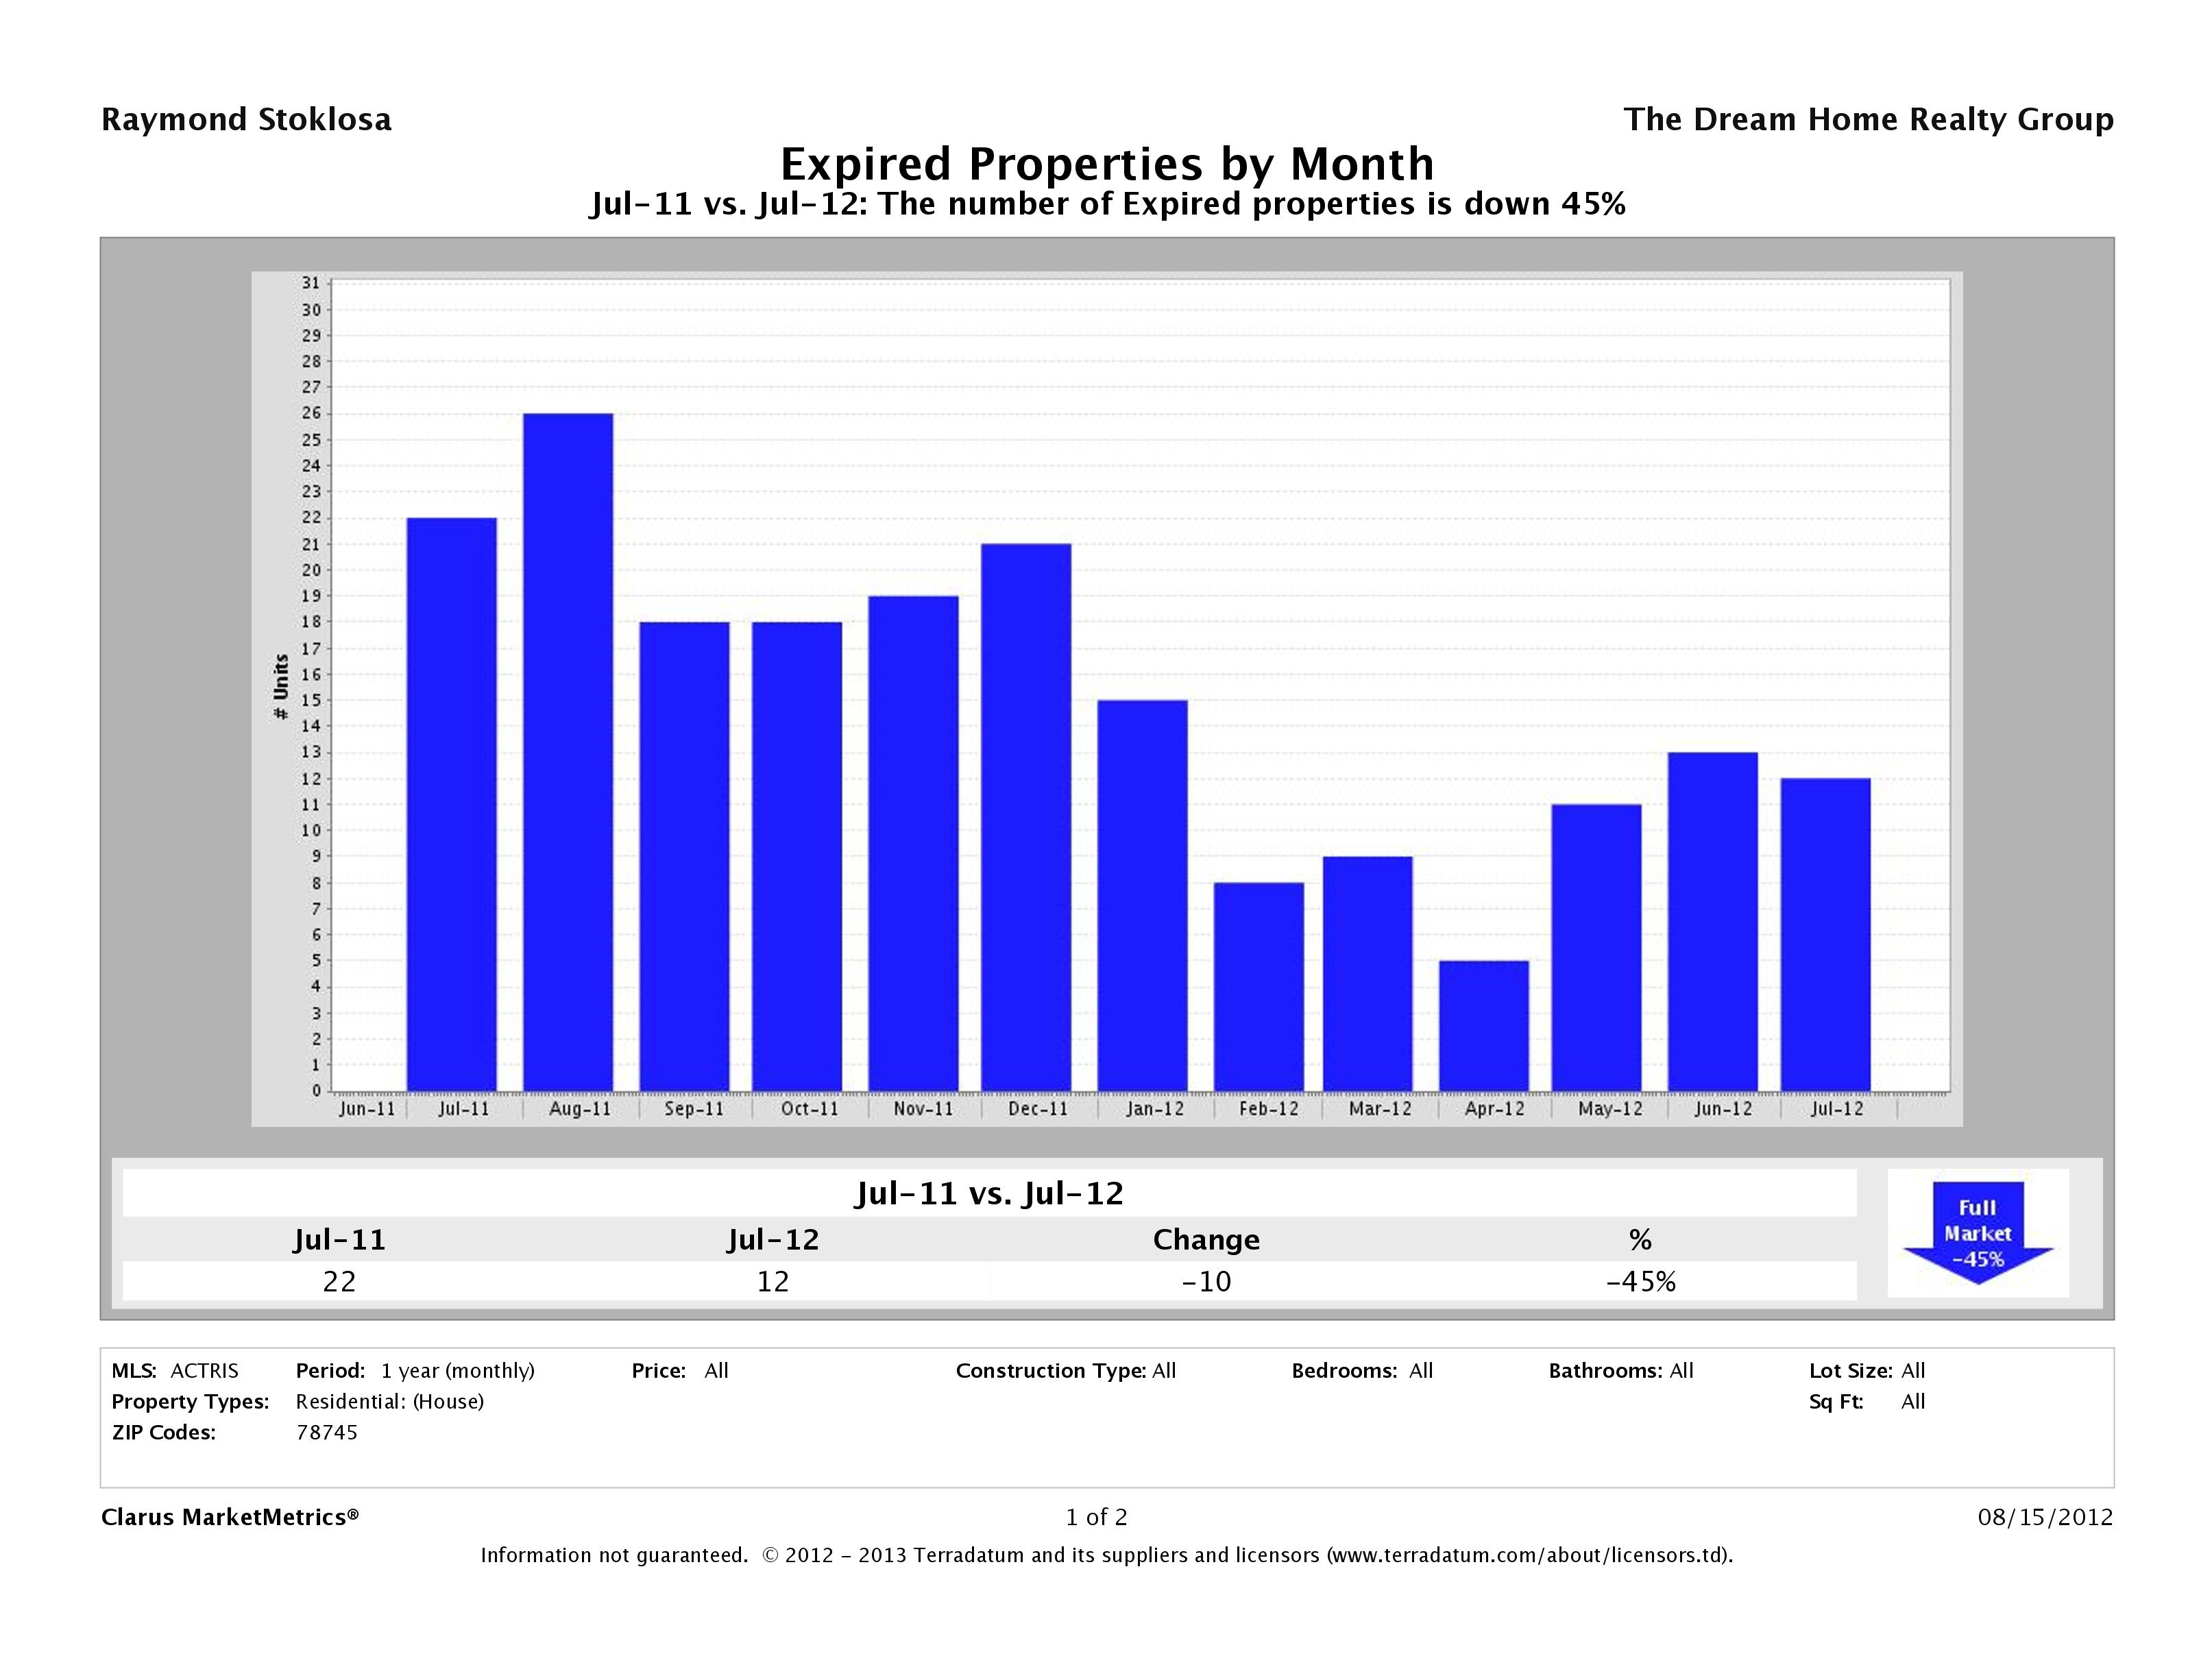
45% Fewer Homes Taken Off the Market
Another interesting stat comes by way of homes taken off the market in 78745 (expired listings). In July 2012, we saw only 12 homes expire compared to 22 in July 2011. With the lowered inventory, buyers are choosing homes they might not have considered in a weaker market which is positive news for sellers.
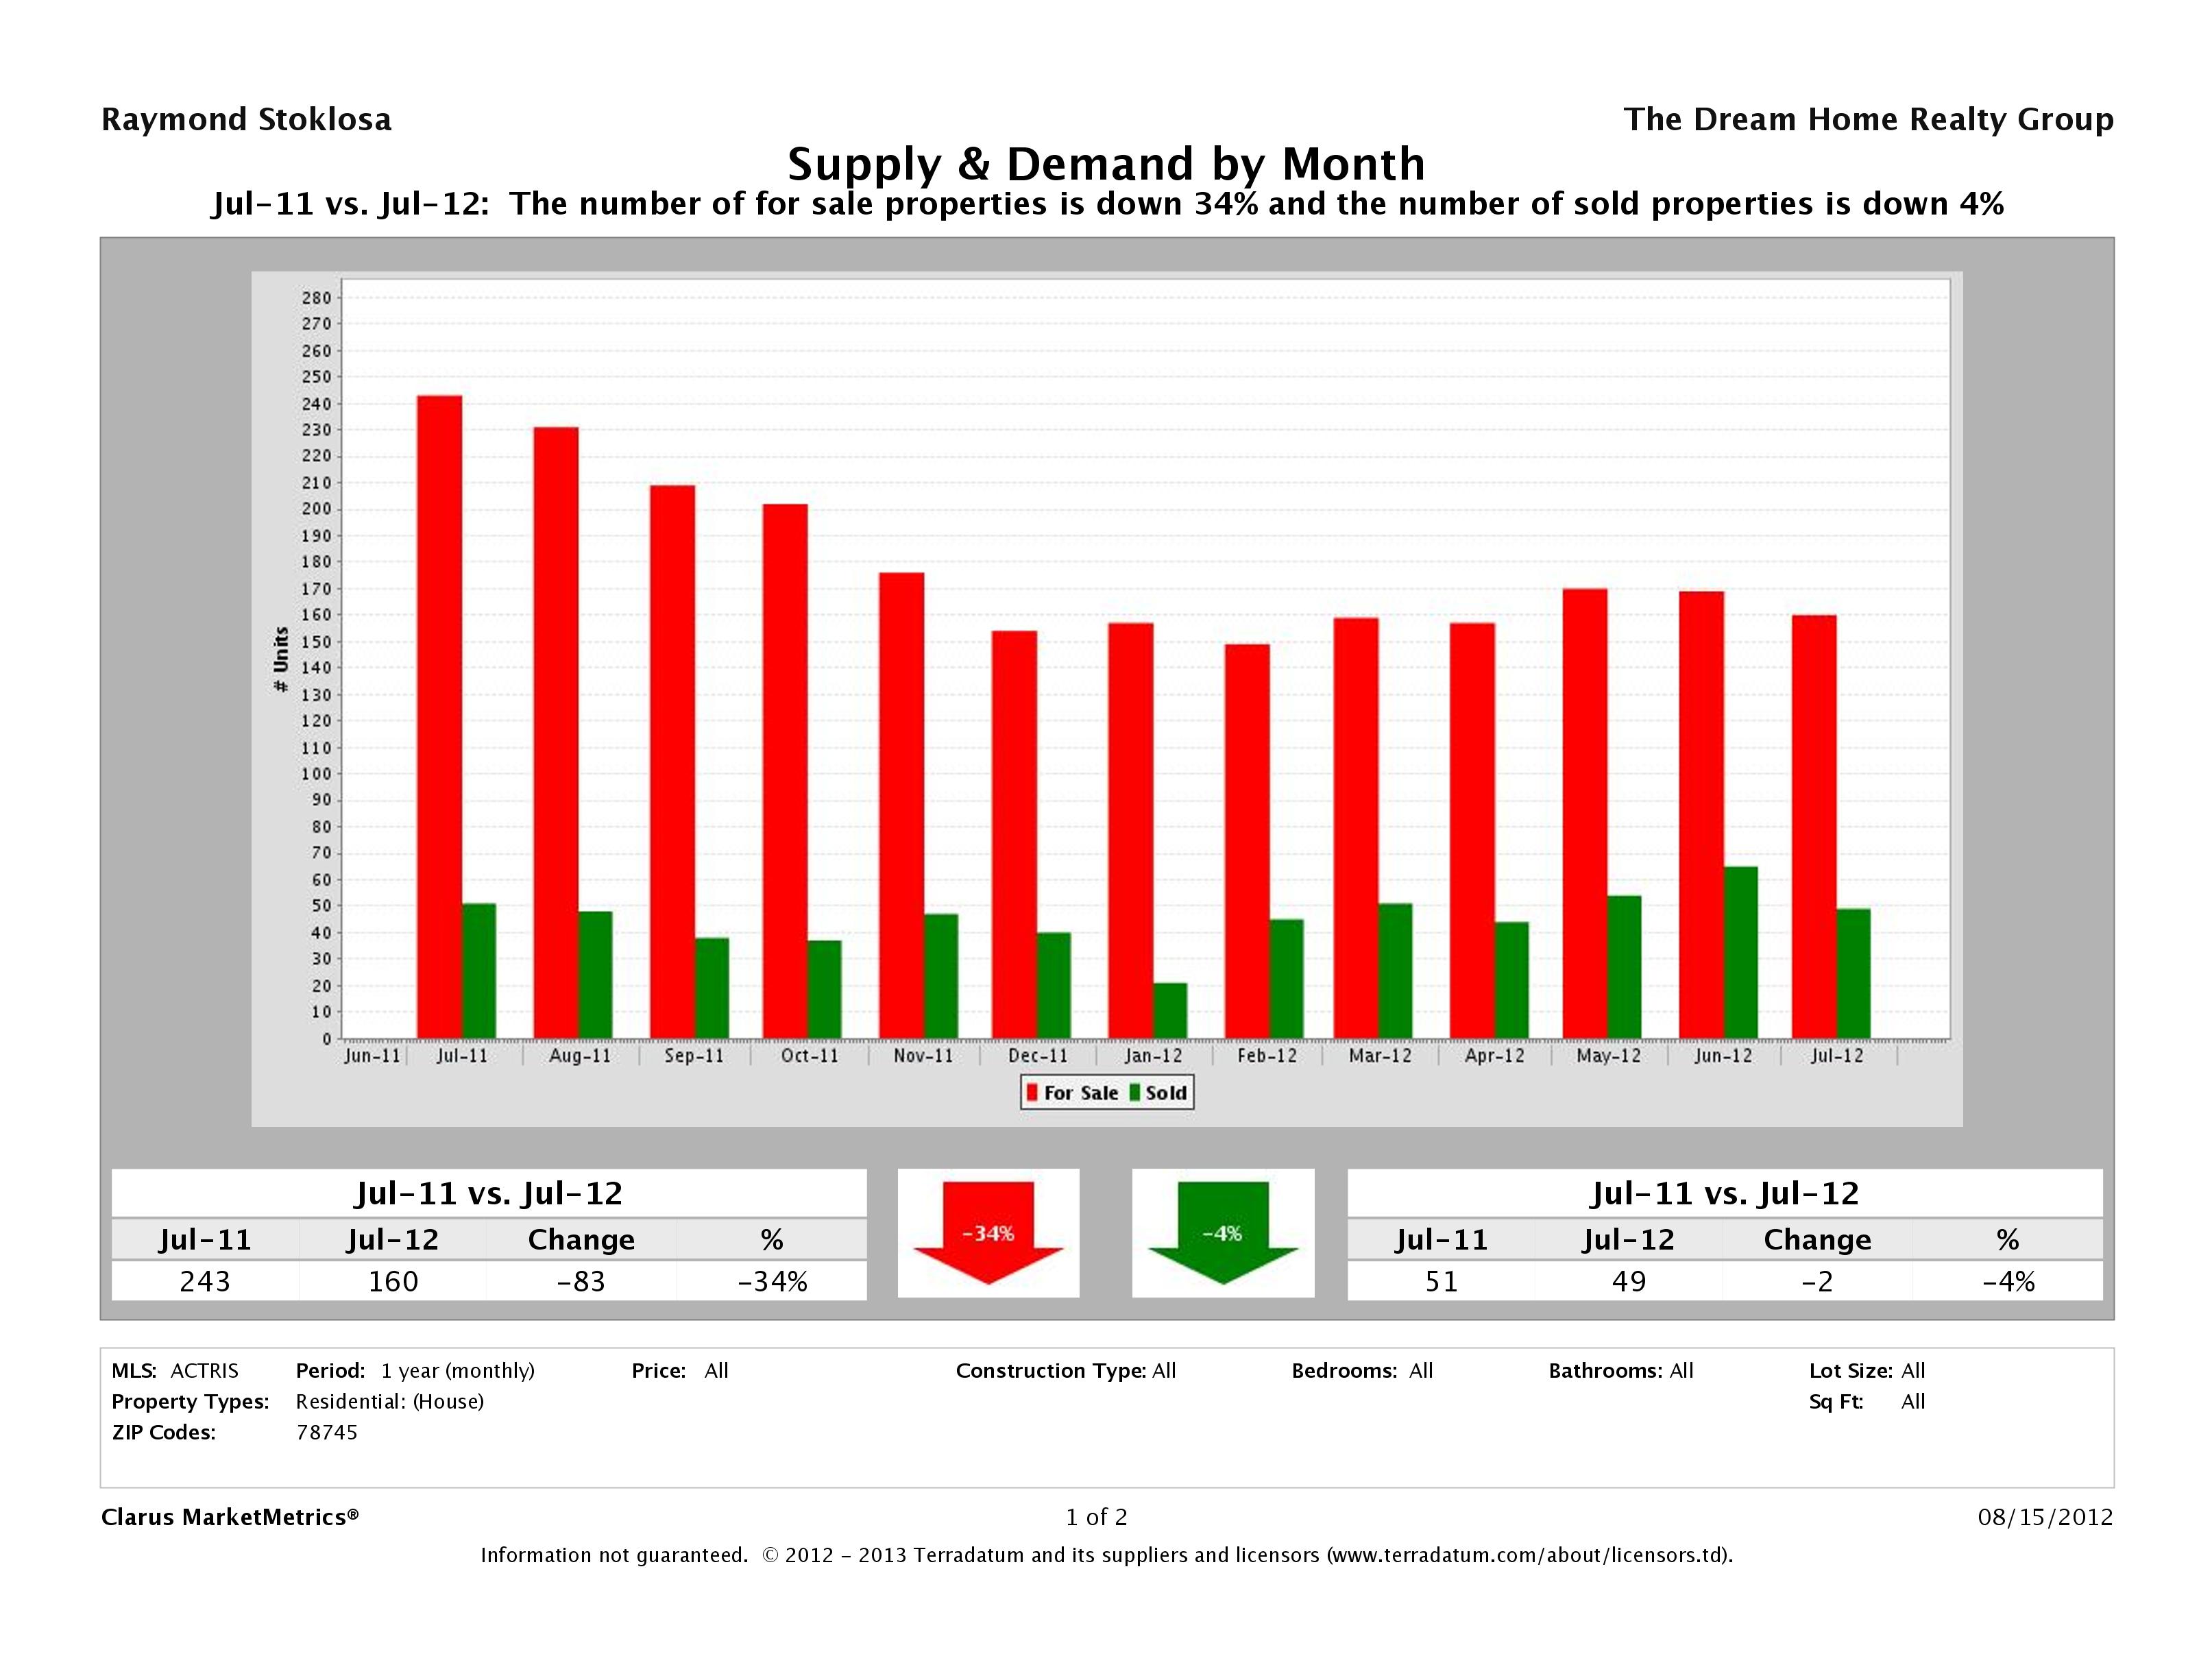
Supply and Demand in 78745 Down
The number of for sale properties (supply) was down 34% while the number of sold properties (demand) was down 2%. Though fewer homes are selling in 78745 than last year at this time, there is much less supply.
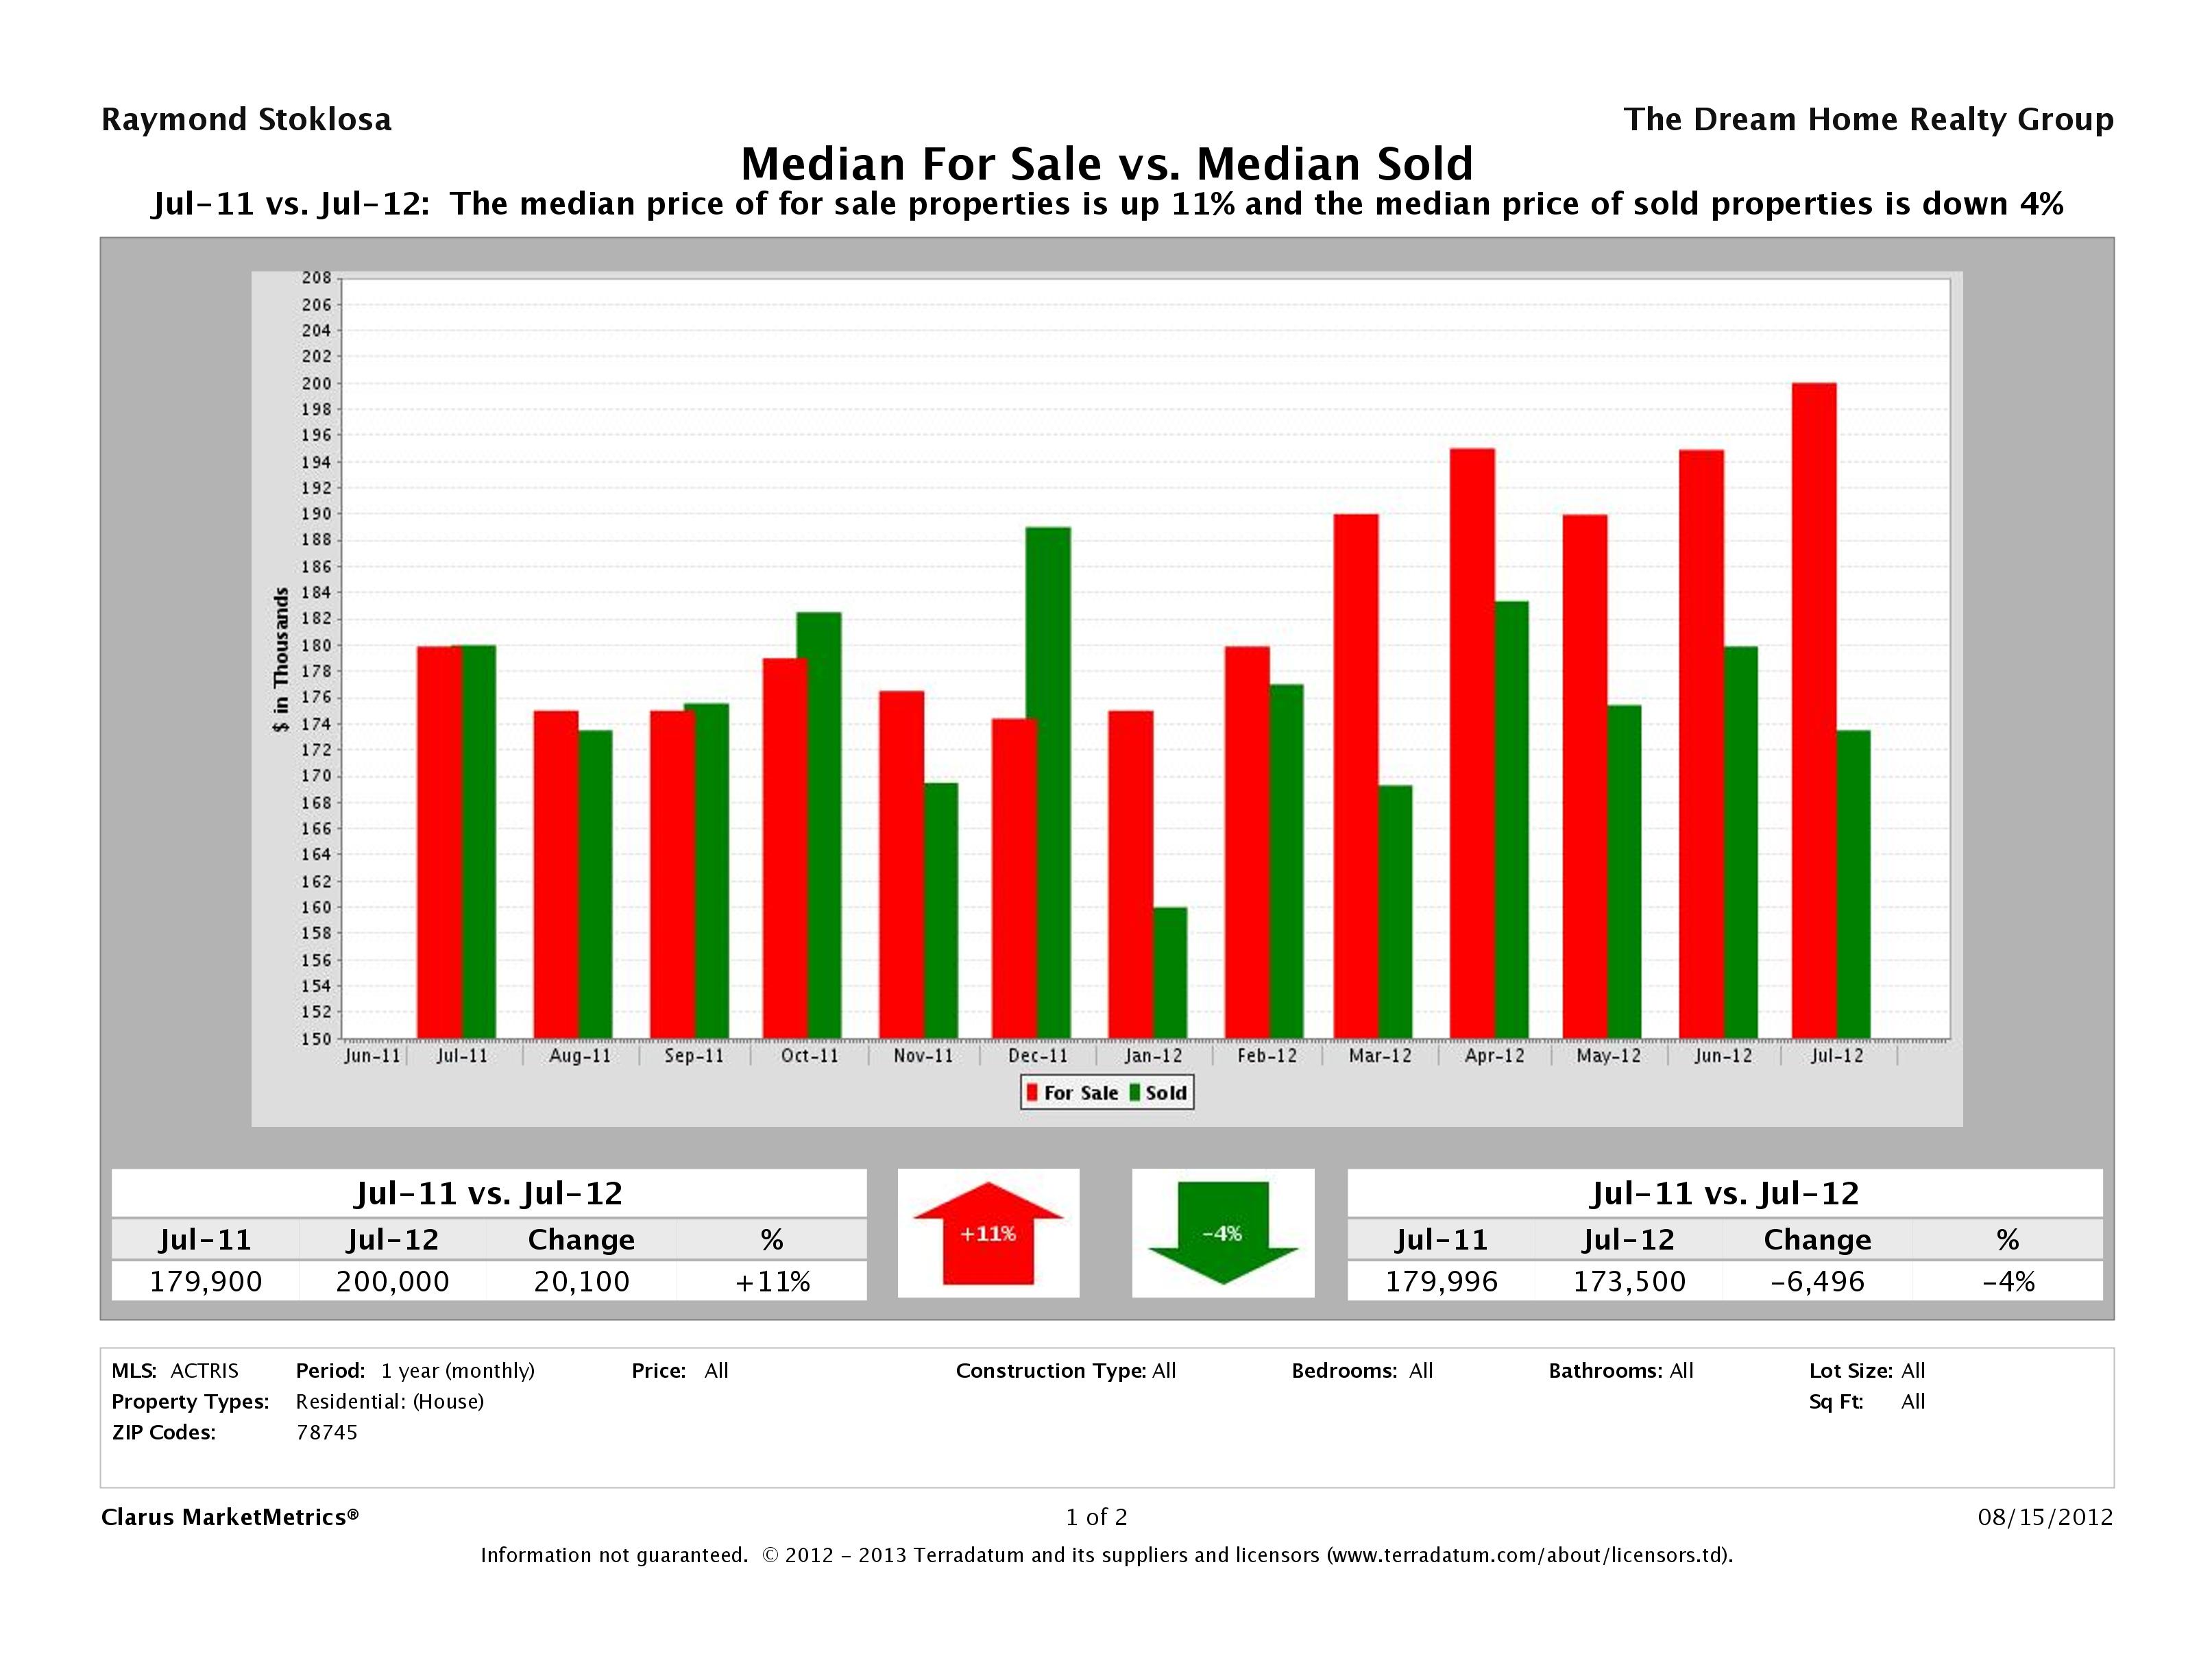
Median For Sale vs Median Sold Price 78745
The median for sale price of a home in 78745 went from $179,900 in July 2011 to $200,000 in July 2012 marking an 11% increase. The median sold price went from $179,996 in July 2011 to $174,250 in July 2012 marking a 3% decrease.
78745 July 2012 Real Estate Price Report Numbers
In July 2012, there were 50 homes that sold in Austin’s 78745 zip code. Homes ranged in size from 837-3,350 sqft with 2-4 bedrooms and 1-3 bathrooms. The most expensive home in 78745 sold for $549,900 and the least expensive home sold for $100,250. The average price of a home in 78745 was $181,235 and the average price per square foot in 78745 was $128.55. It took, on average, 31 days to sell a home in 78745 and sellers received, on average, 97.77% of their original list prices. The highest price per square foot was $245.37 and the lowest price per square foot was $78.26.
| Beds | Baths | SqFt | Listing Price | LP/SqFt | Selling Price | SP/SqFt | SP/LP | SP/OLP | DOM | |
|---|---|---|---|---|---|---|---|---|---|---|
| High | 4 | 3 | 3,350 | $549,900 | $254.63 | $549,900 | $245.37 | 107.5% | 107.5% | 335 |
| Low | 2 | 1 | 837 | $100,000 | $74.31 | $100,250 | $78.26 | 88.8% | 81.7% | 1 |
| Average | 3 | 2 | 1,451 | $183,290 | $130.04 | $181,235 | $128.55 | 98.97% | 97.7% | 31 |
| Median | 3 | 2 | 1,394 | $174,500 | $125.05 | $174,250 | $122.63 | 99.15% | 98.4% | 12 |
| Search Criteria | |||
|---|---|---|---|
| Status | Sold | Sold Date | July 2012 |
| Property Type | Single Family Homes | Number Sold | 50 |
| Source: | ABoR Sales Data | Area | 78745 |
What Do the Numbers Mean for Buyers and Sellers?
When inventory gets this low, buyers are in need of more choices. If you need to sell a home in 78745, now may be the best time to do so. With the right preparation and market placement, your home could be one of the homes that sell in less than 30 days. Check out our Selling a Home in South Austin page to find out how we can help you sell your 78745 home faster and for more money.
If you’re in the market to buy, don’t be discouraged. Yes inventory is low, however you only need to find one house. If you make your home search a priority, you can find a home in 78745 and take advantage of today’s historically low interest rates. Check out our 78745 Home Buyers page to learn how we can help make your next purchase stress free!
Leave a Reply