Eleven Oaks Realty is proud to present their August 2012 Austin Real Estate Price Report measuring activity in the Austin single family home market.
Austin Housing Inventory Continues to Decline to Historically Low Levels
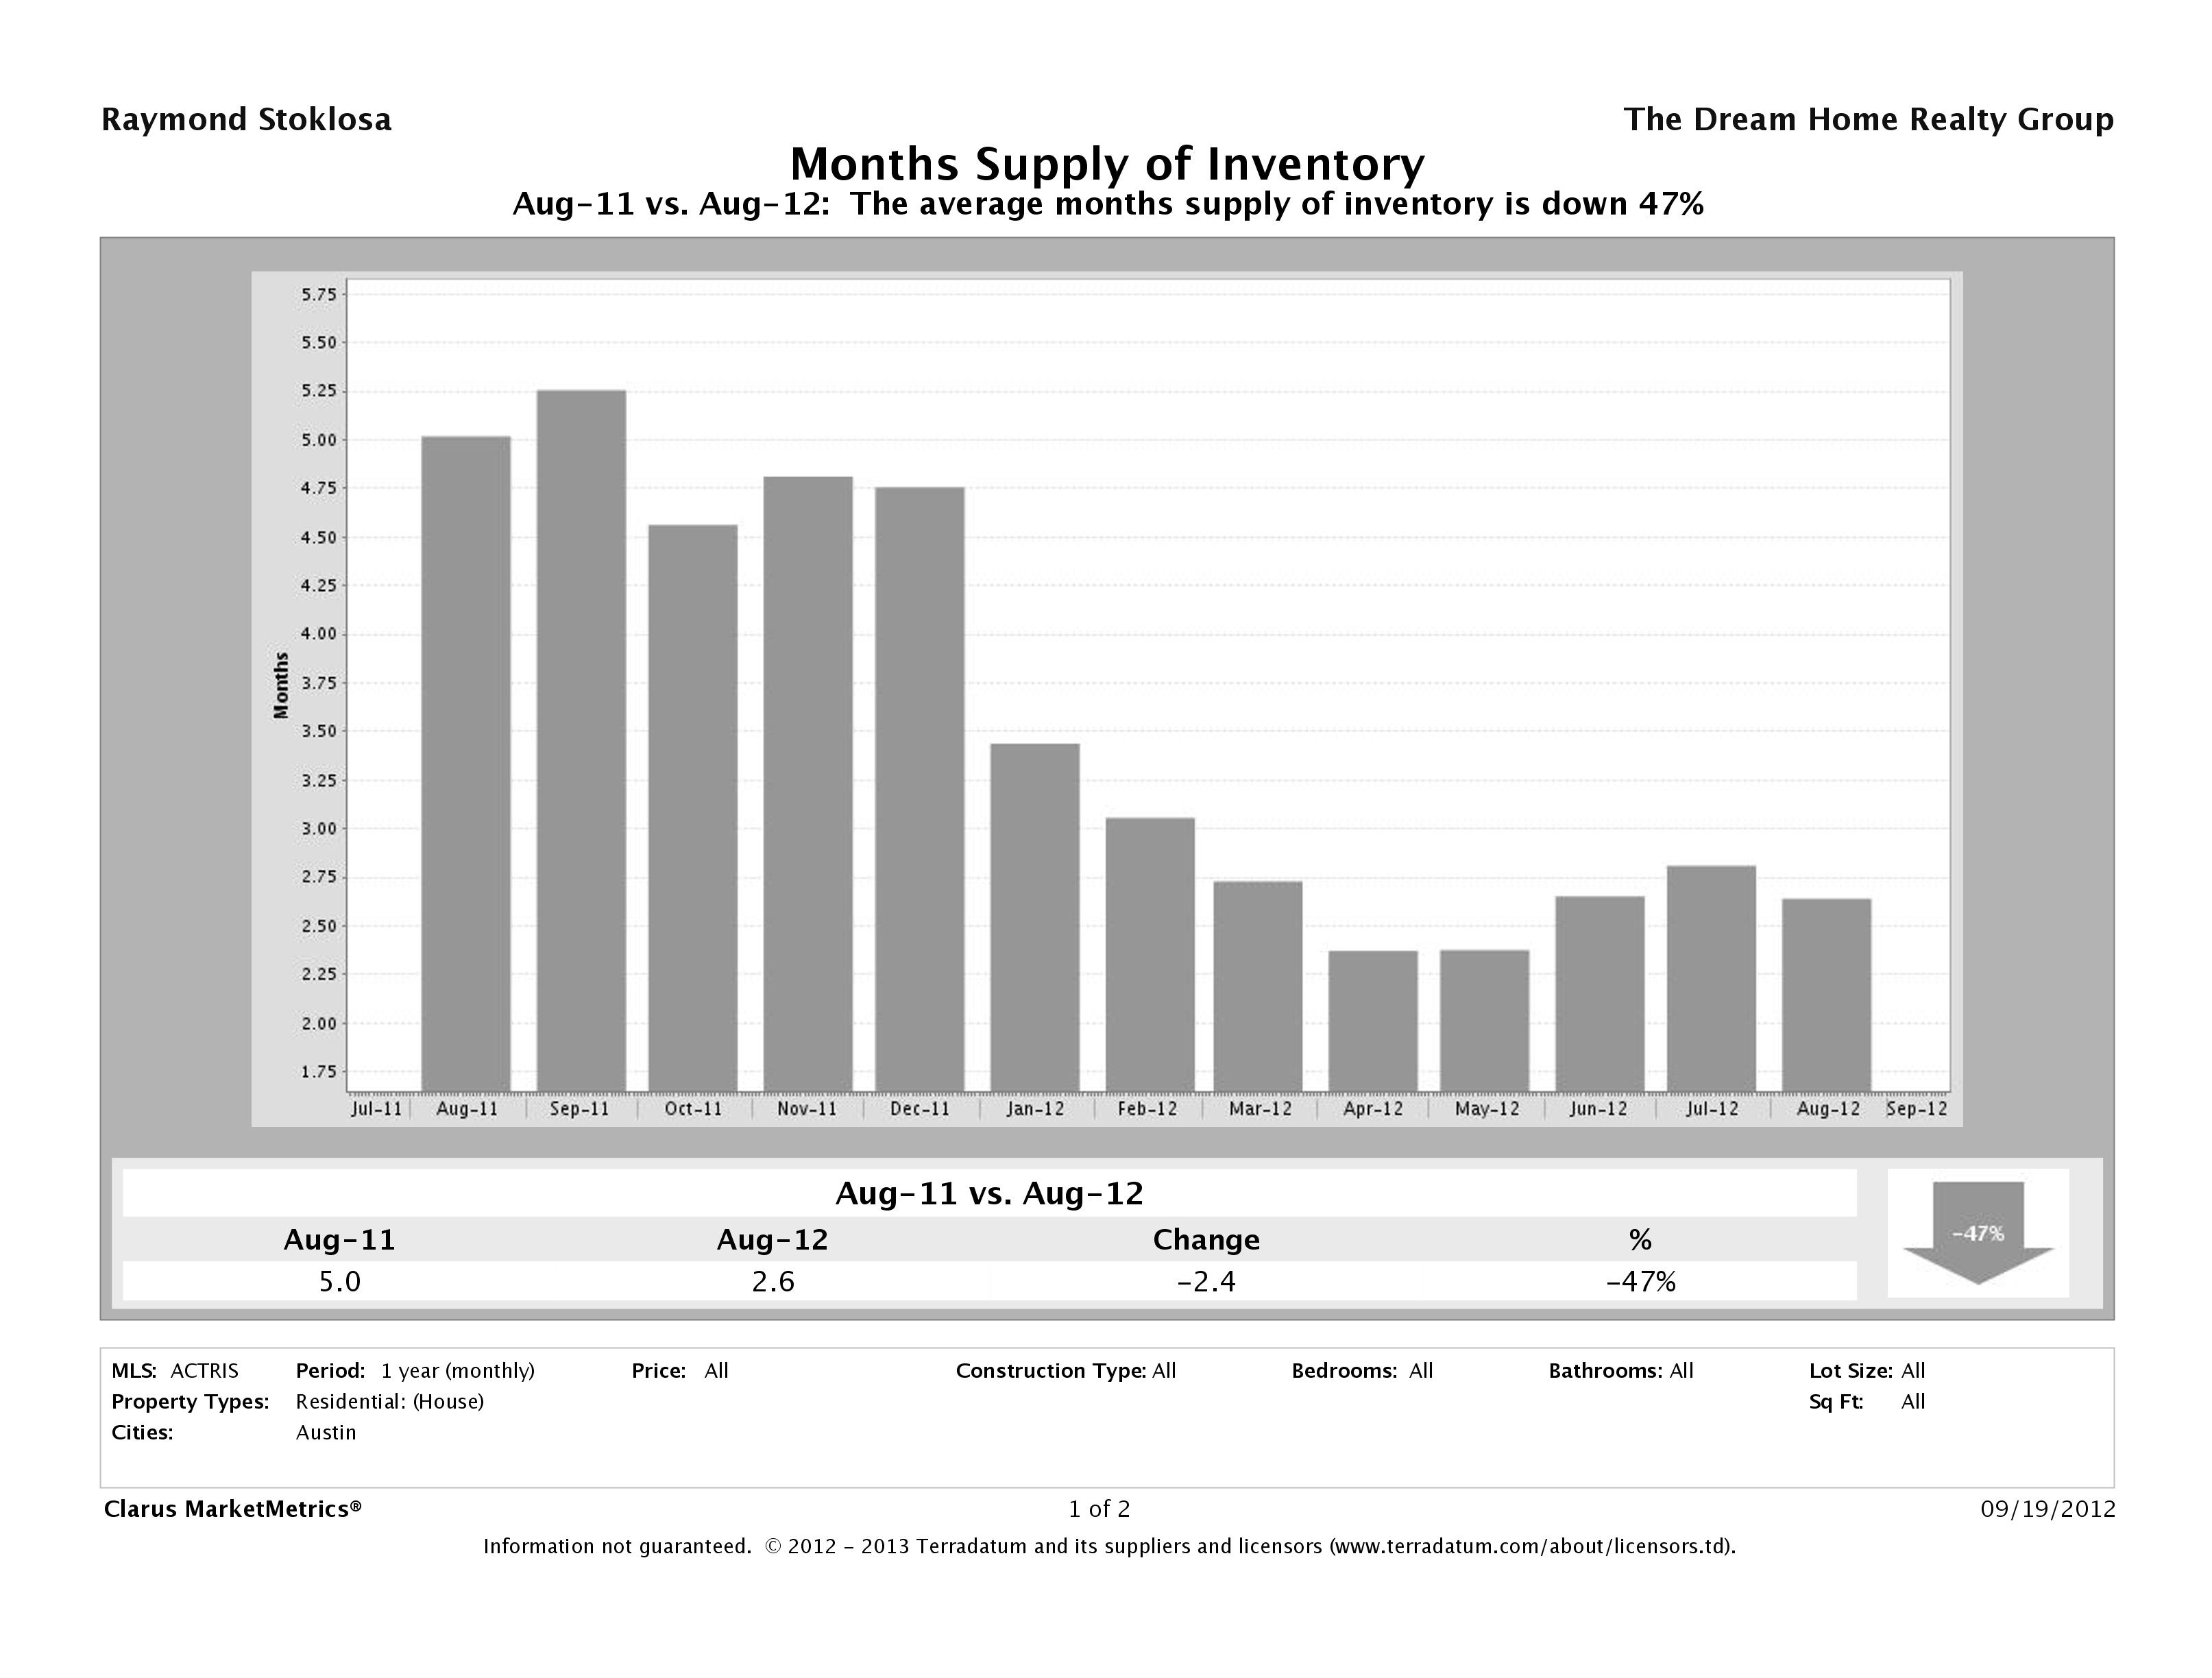
The biggest story in August 2012 numbers is in months supply of inventory. In August 2012, we saw a 47% decrease in months supply of inventory from already historically low July 2012 numbers to 2.6 months of inventory. August 2012 are hovering near some of the lowest inventory we’ve seen in years. Though April and May 2012 numbers were lower, we’re still well below a normal market. As we enter into the historically less strong Fall market it will be interesting to see if the numbers continue to decline.
What does this mean to sellers? If you are thinking of selling, get the process started now. Don’t wait until Winter when fewer buyers are out. There are likely buyers who have been waiting for the right house to come up and either haven’t found it or have lost out to other buyers in multiple bids.
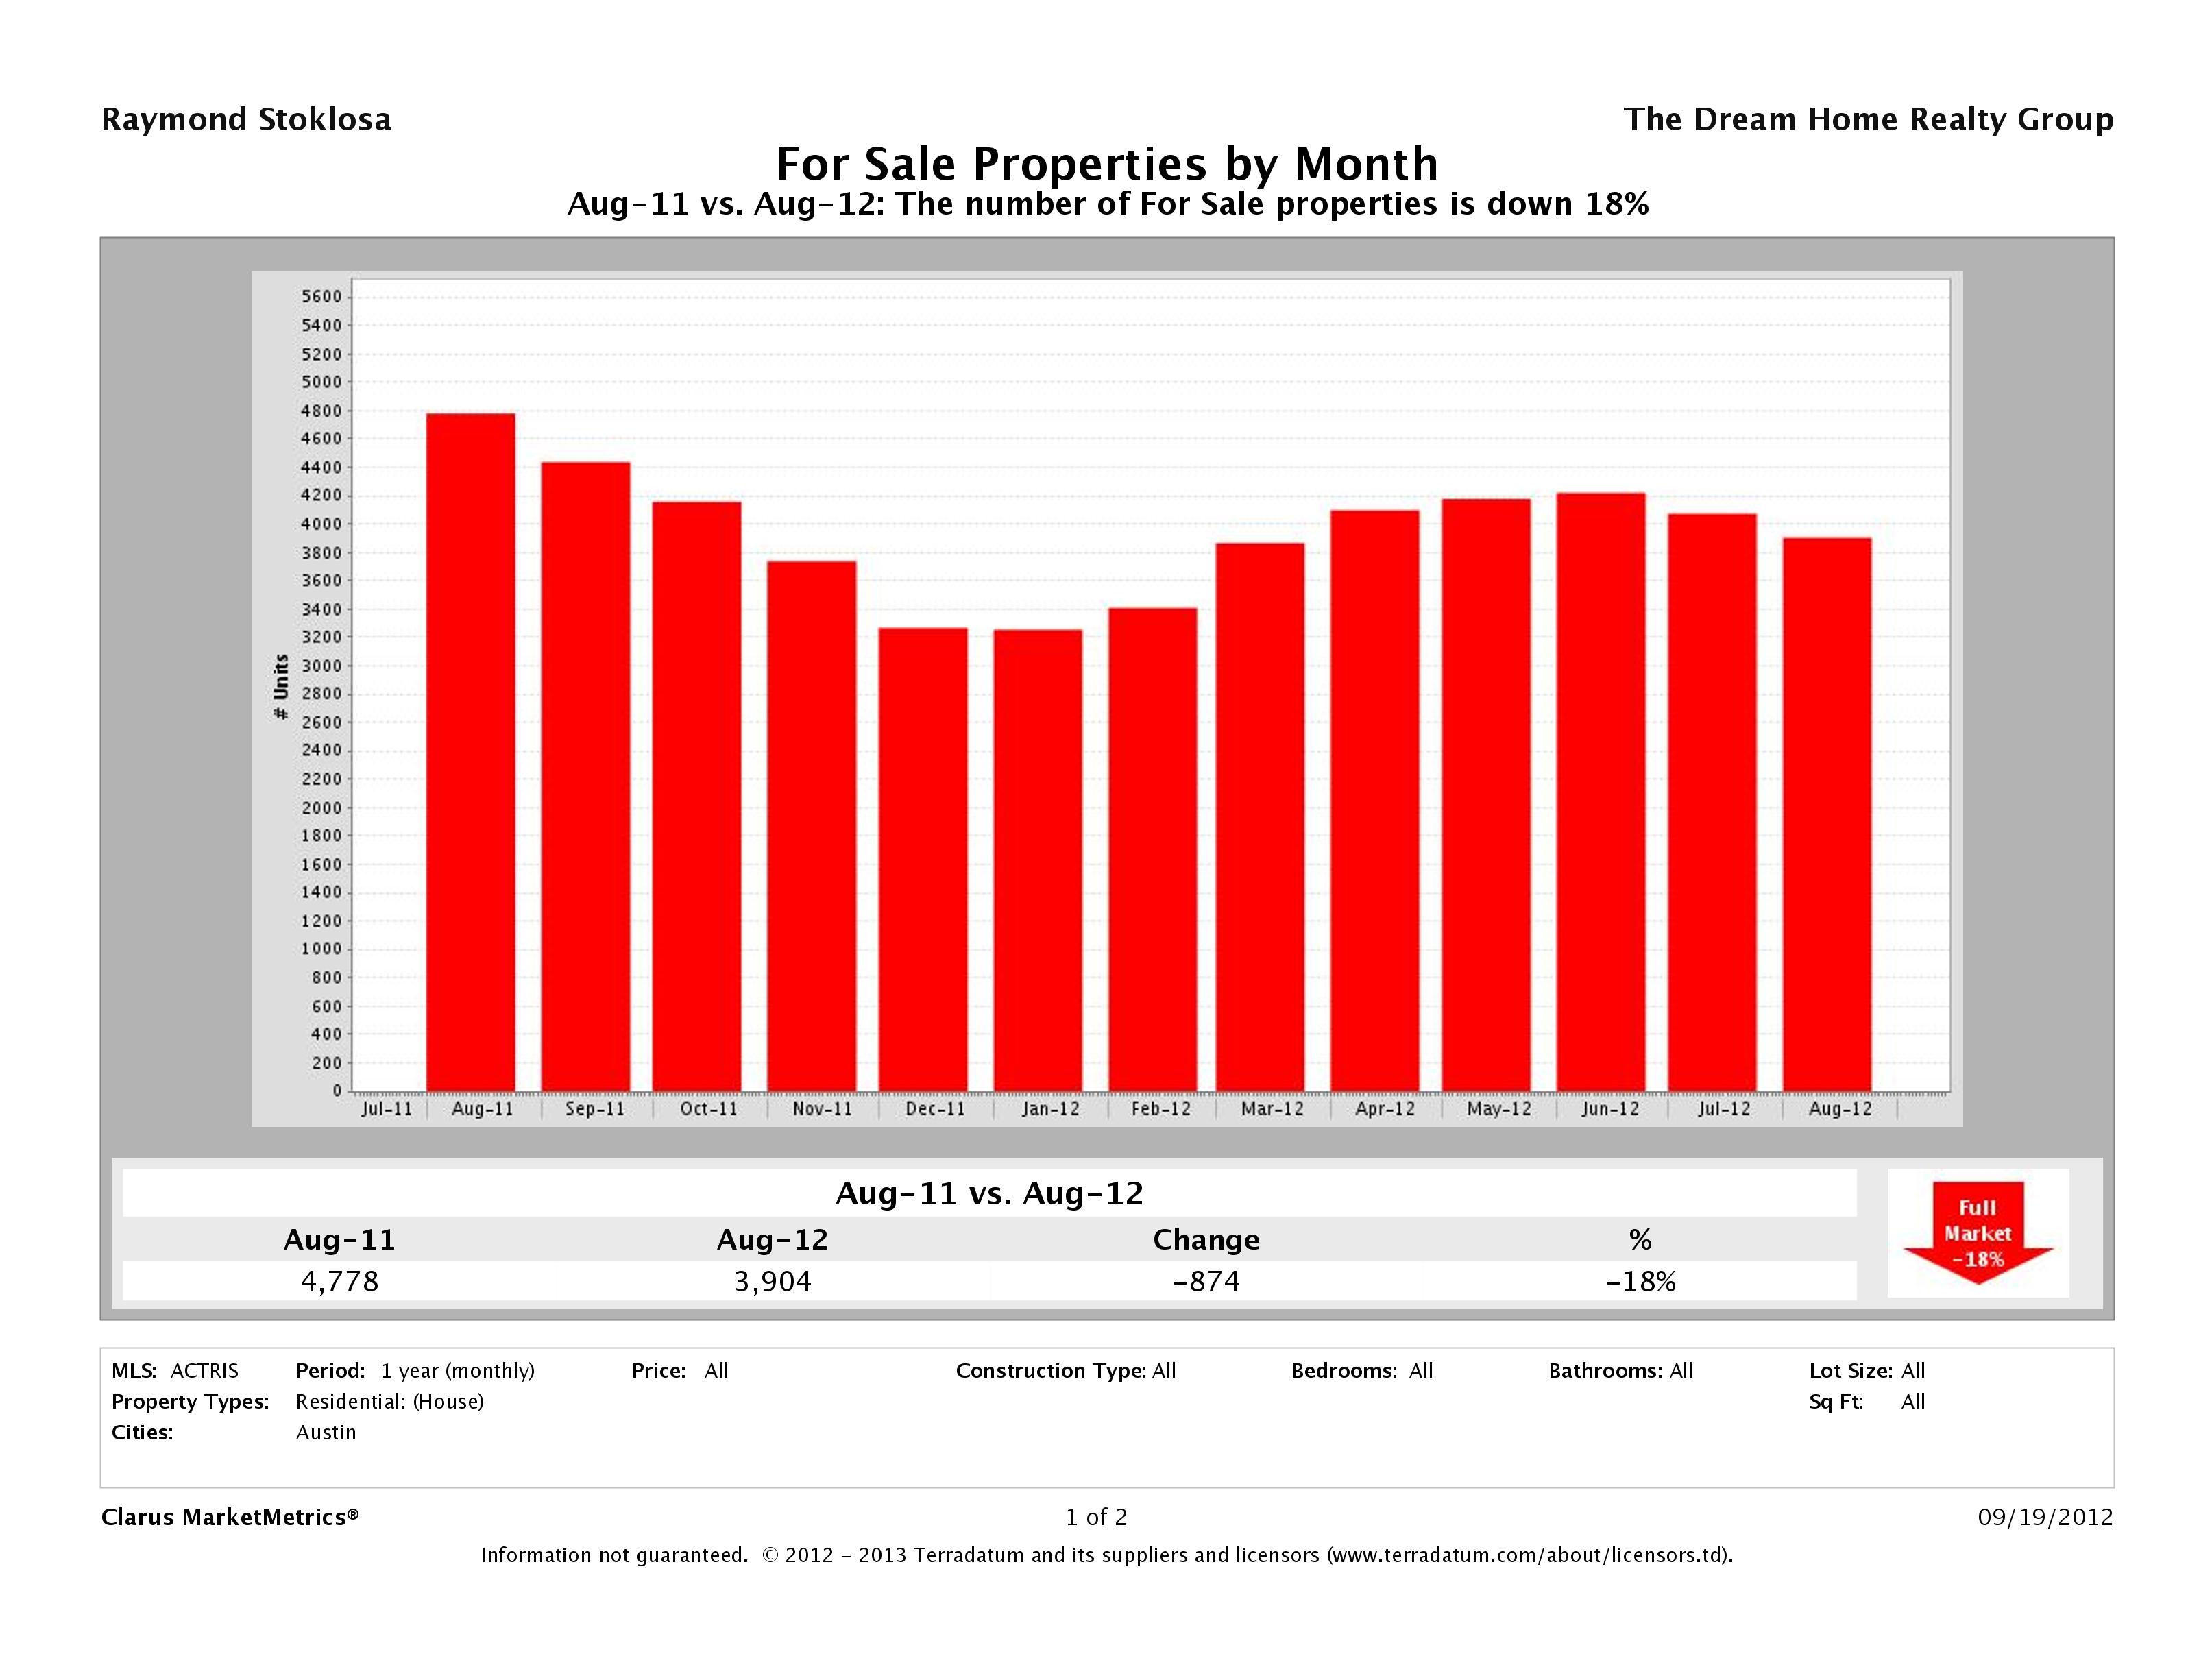
18% Fewer Homes on the Market than August 2011
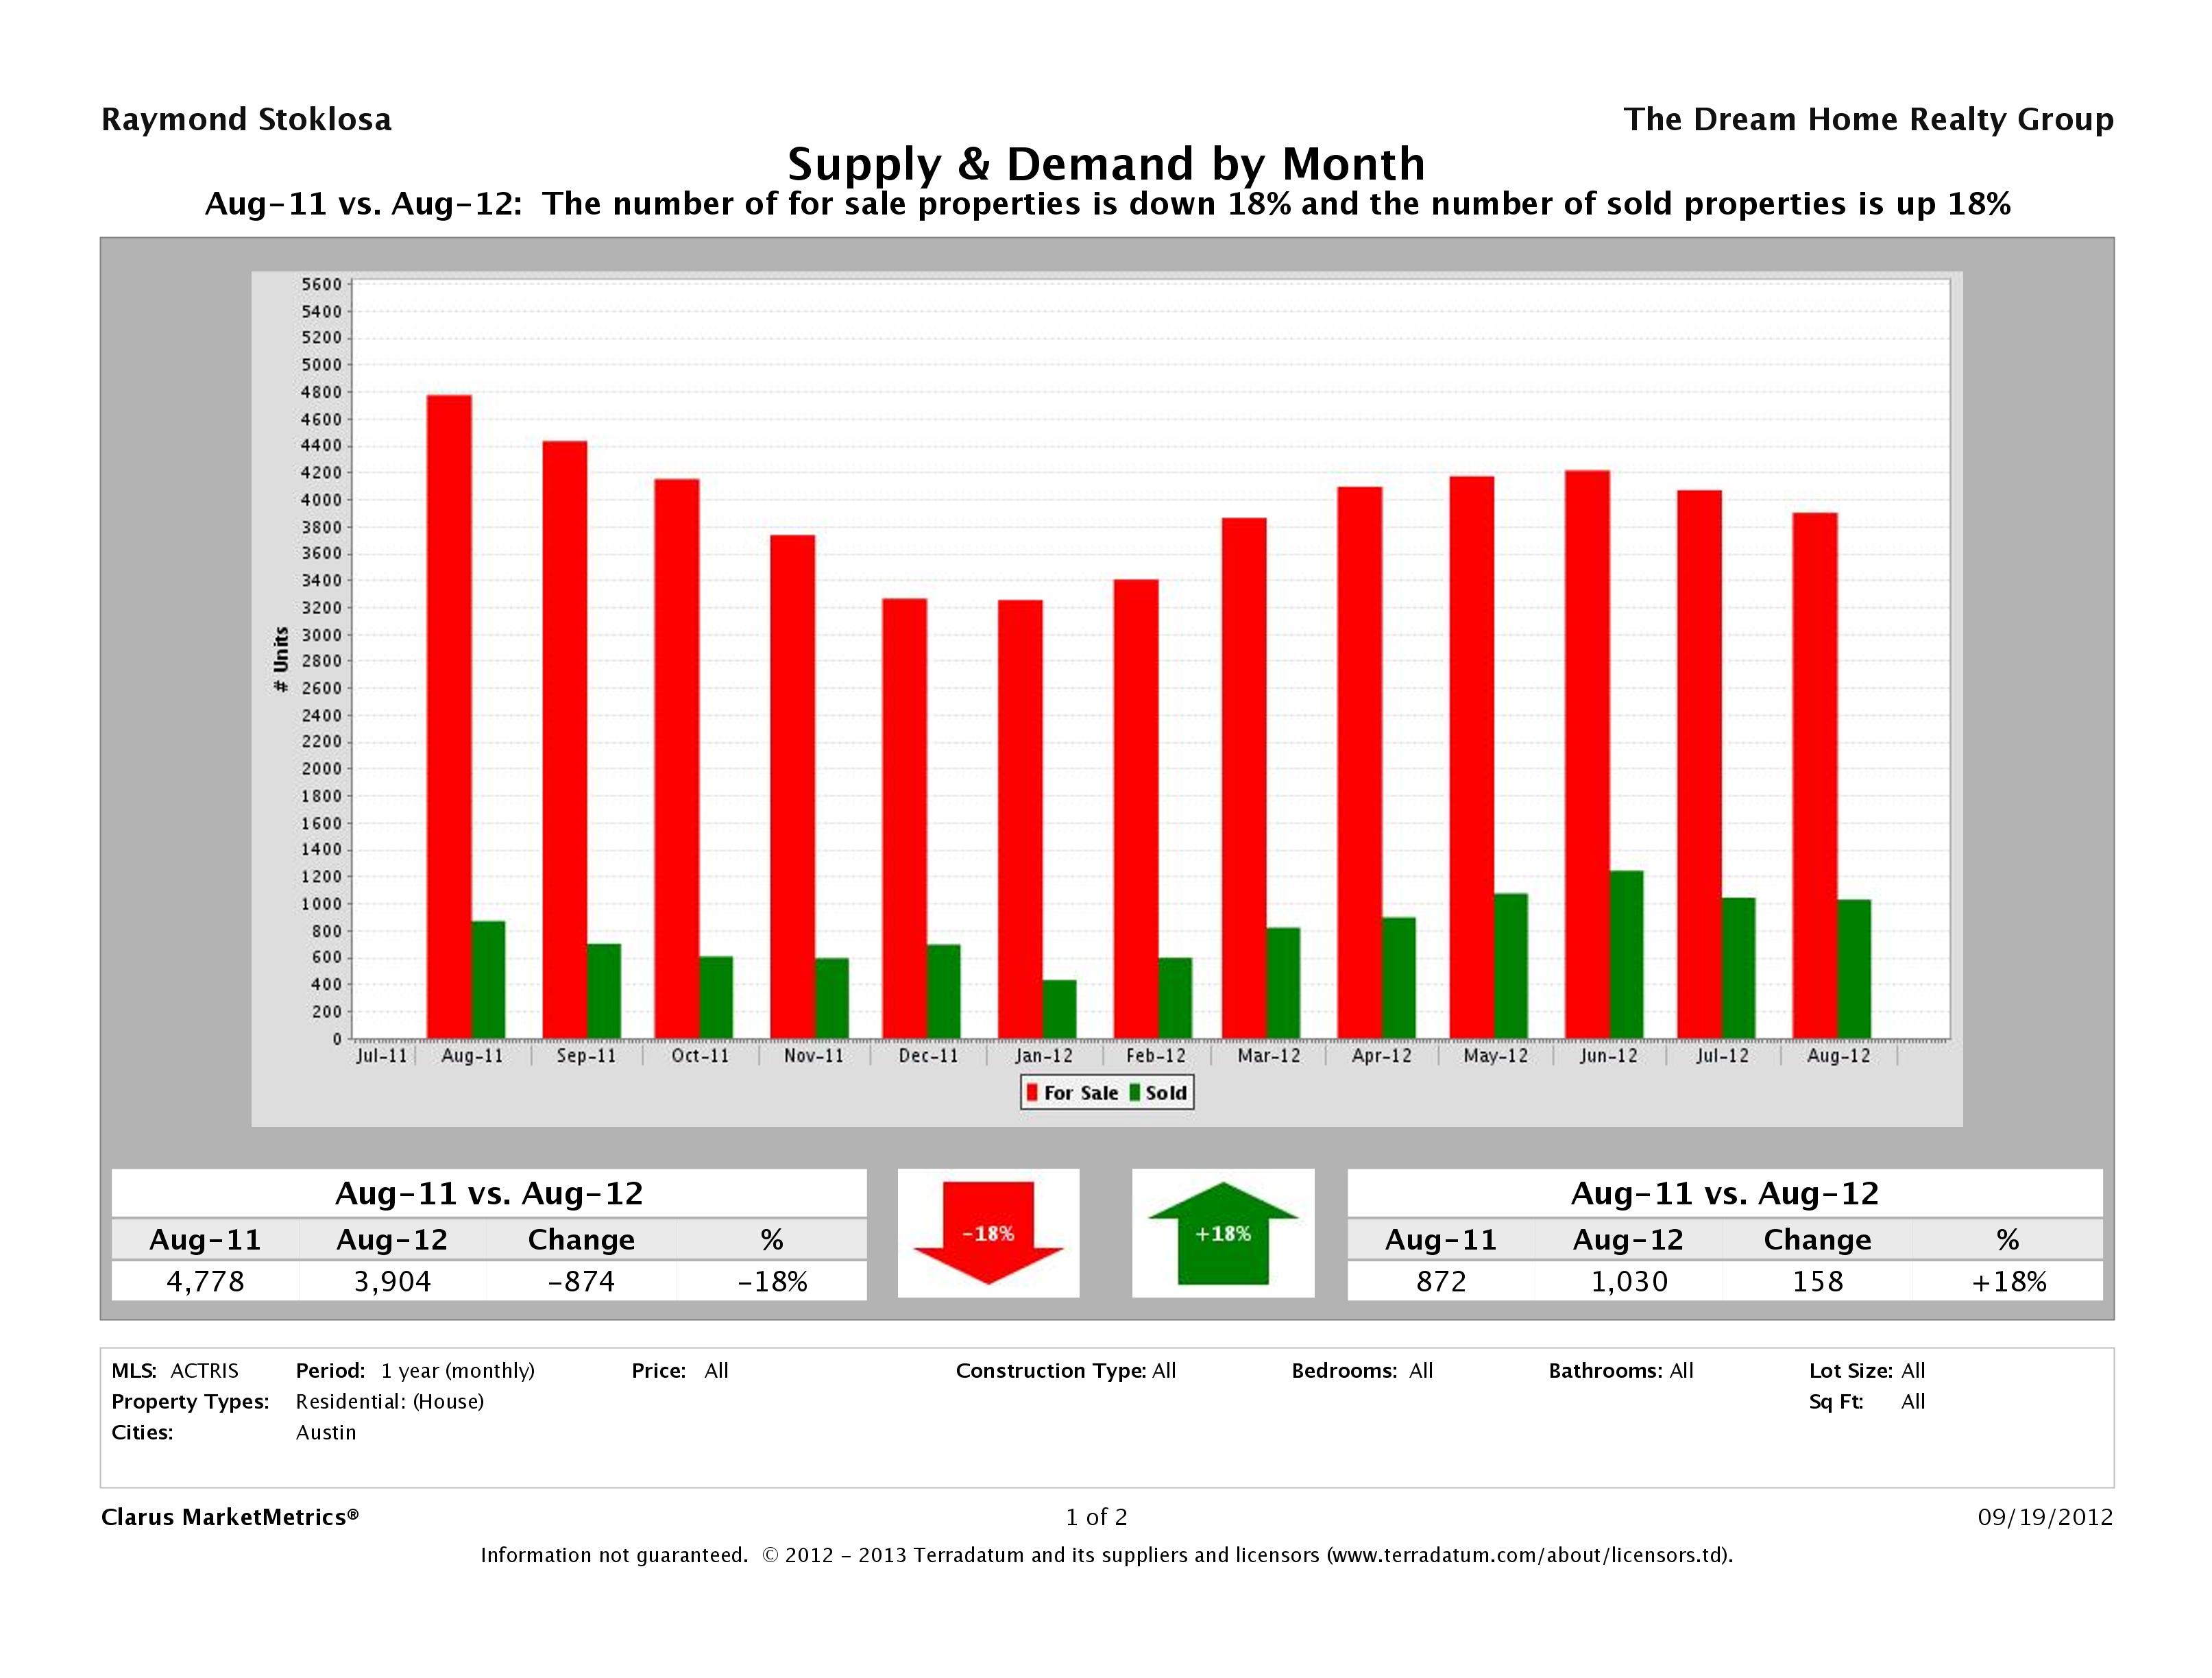
In August 2012, we had 3,904 homes listed for sale in Austin, compared to 4,778 this time last year. The story is not much different from last month. Buyers continue to snatch up inventory quickly and with record numbers of people moving to Central Texas, there aren’t enough homes to meet the demand. If you’re thinking of selling, think about doing so sooner rather than later to take advantage.
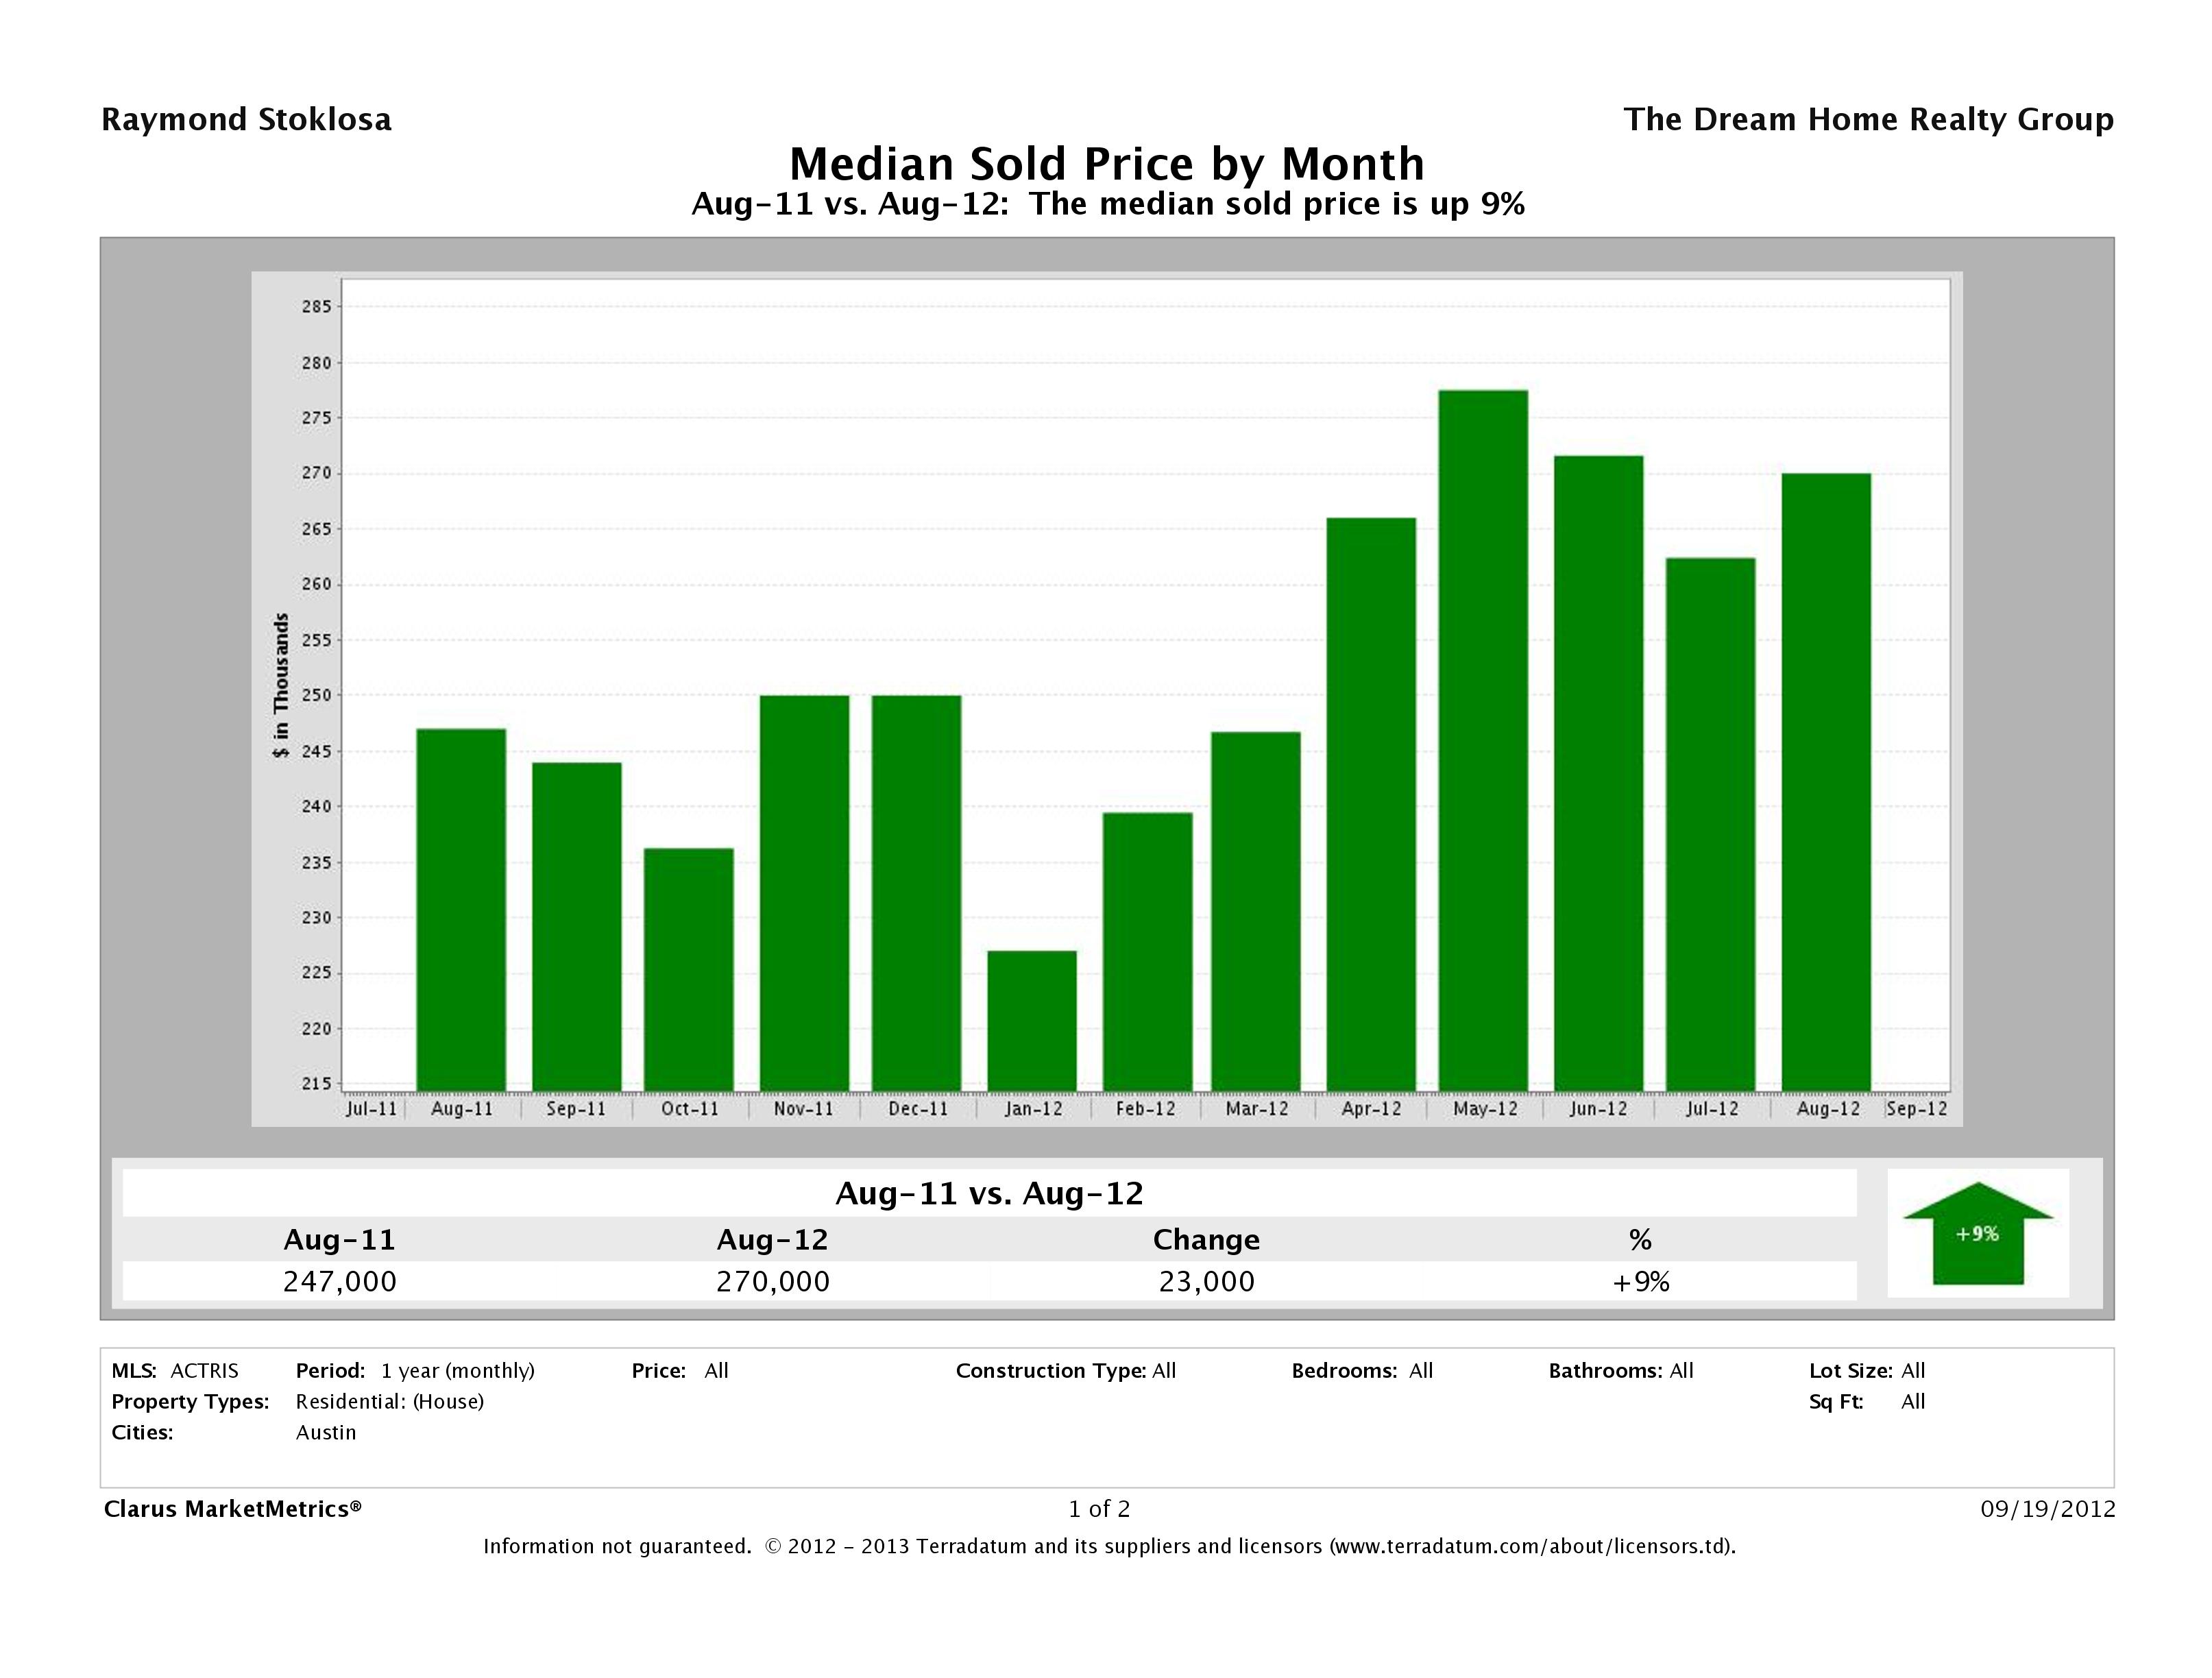
Austin Median Home Price Up 9%
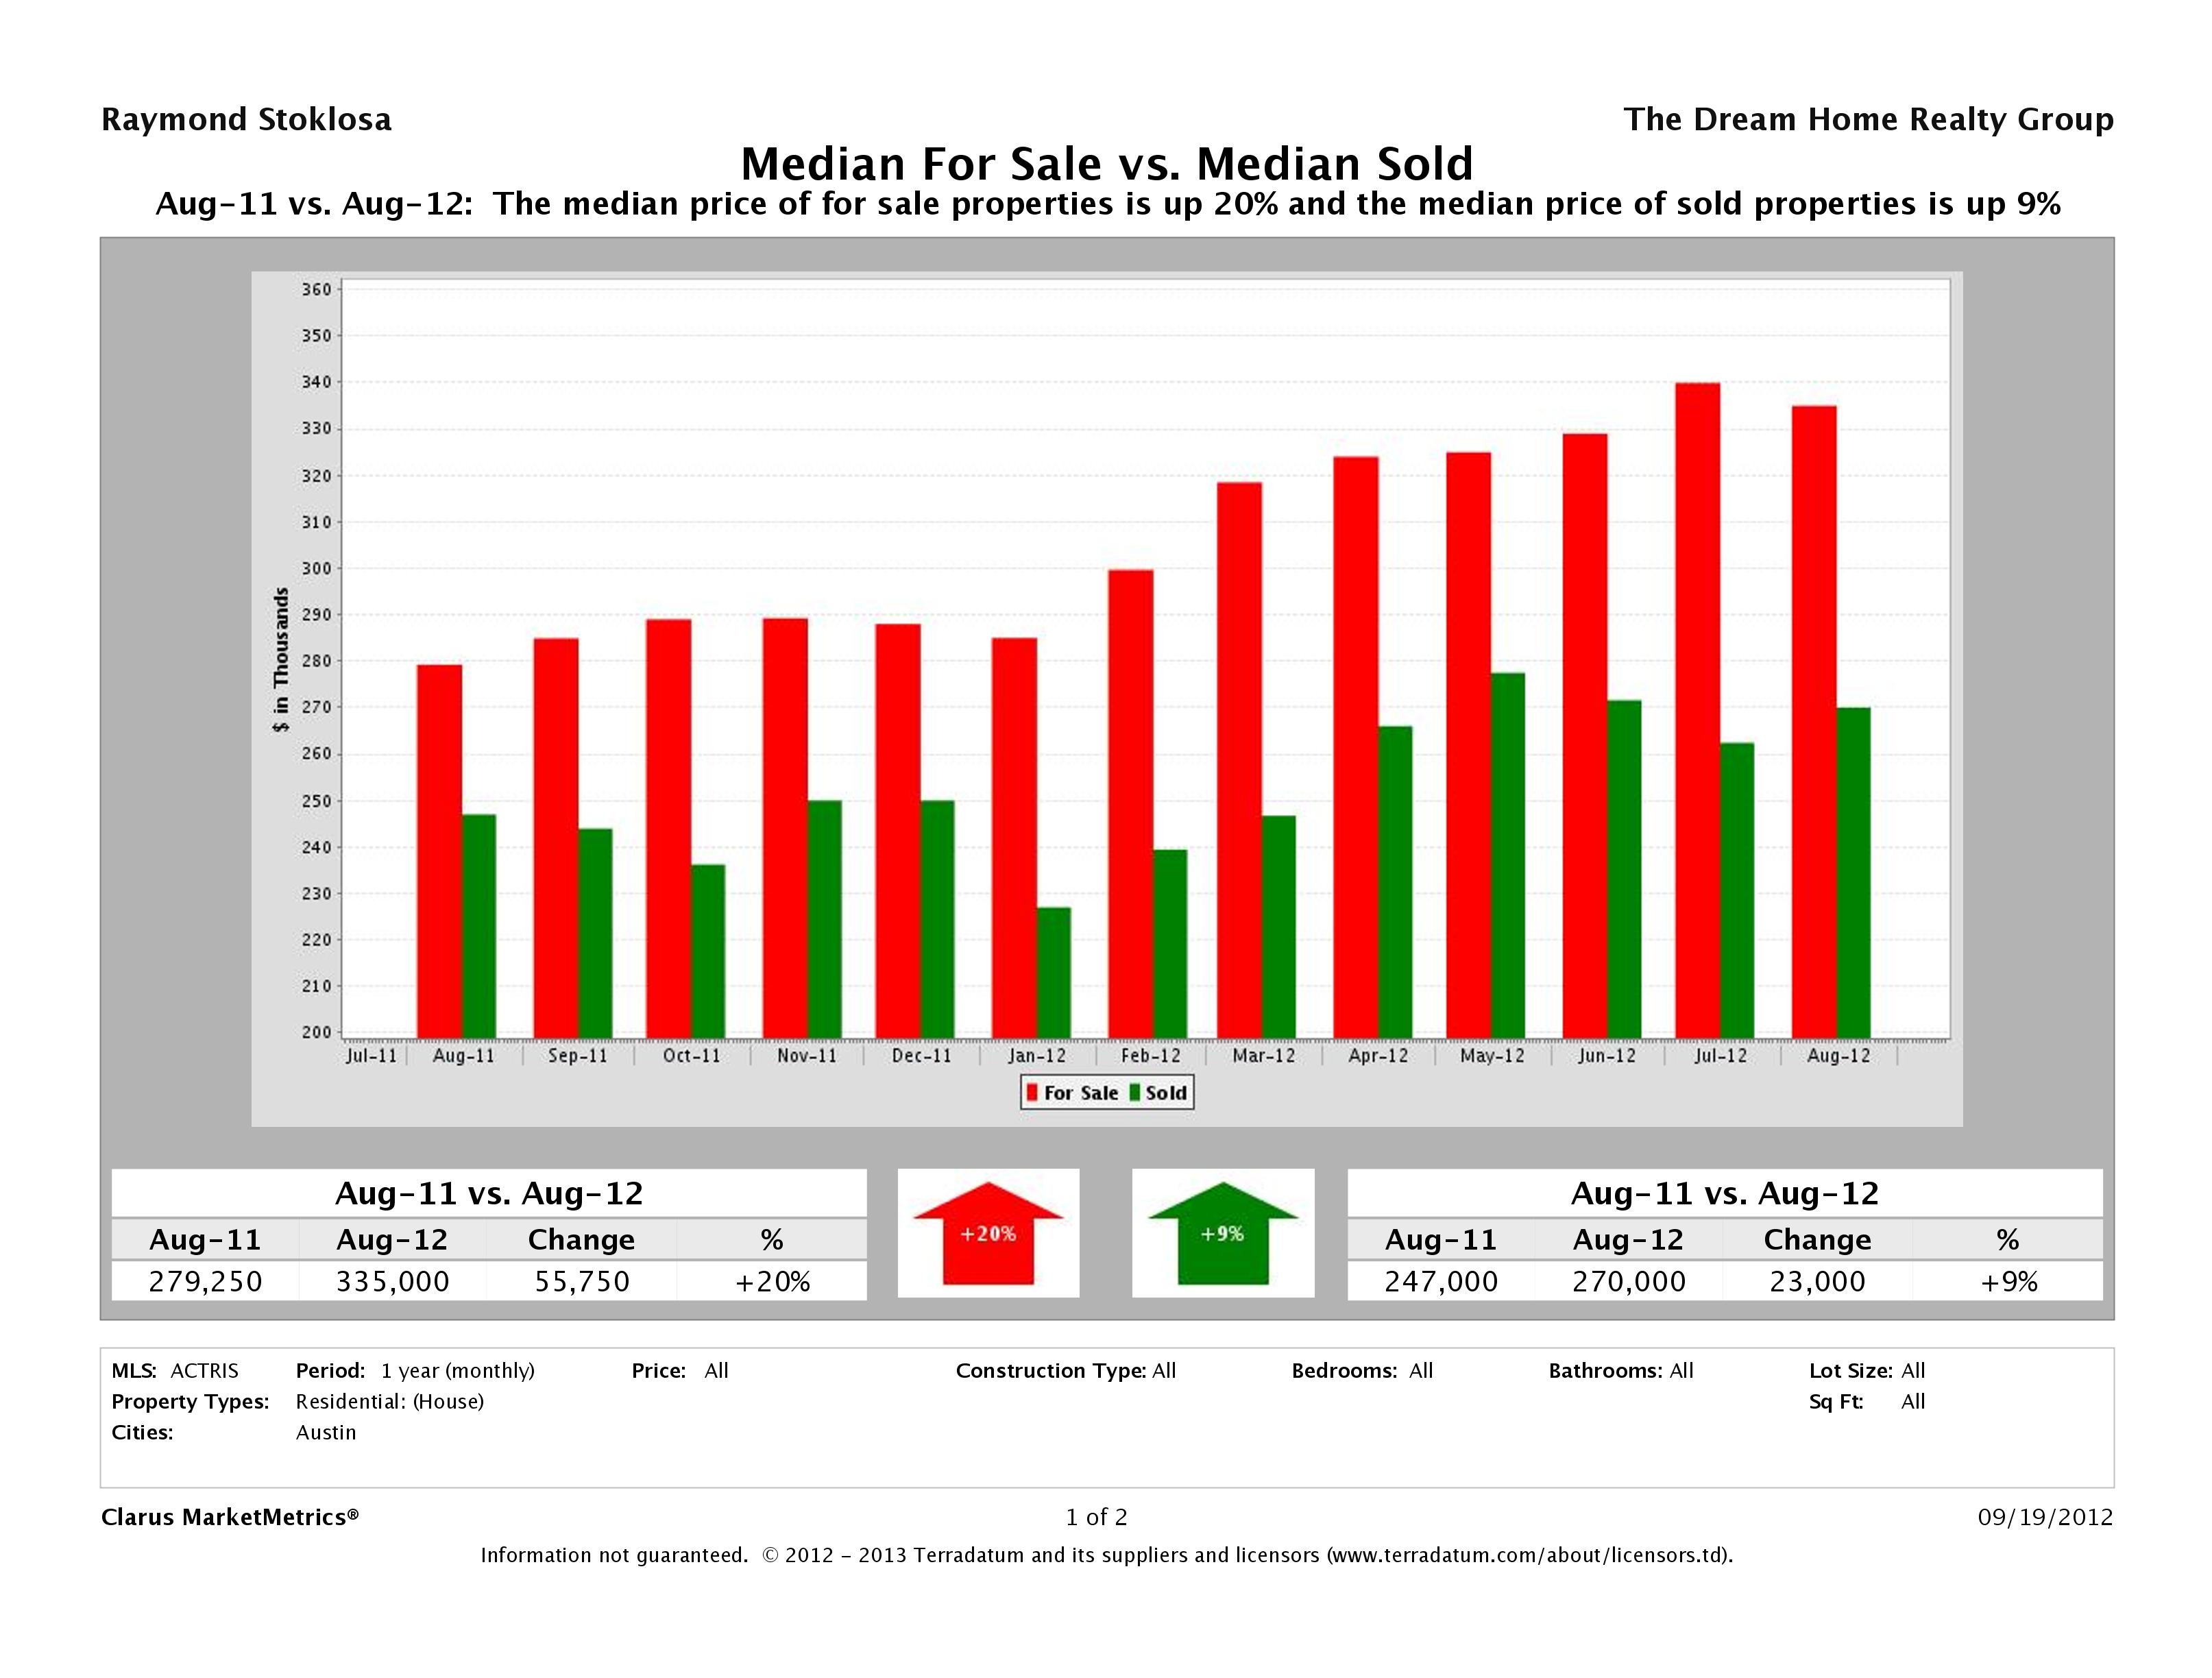
This month, we saw a 9% increase in the median home price in Austin with an $23,000 increase in year over year numbers. The median home price in August 2011 was $247,000 vs $270,000 in August 2012. As inventory continues to hover around historically low levels and people continue to move into the area from out of town, it is only logical we see an increase in median price.
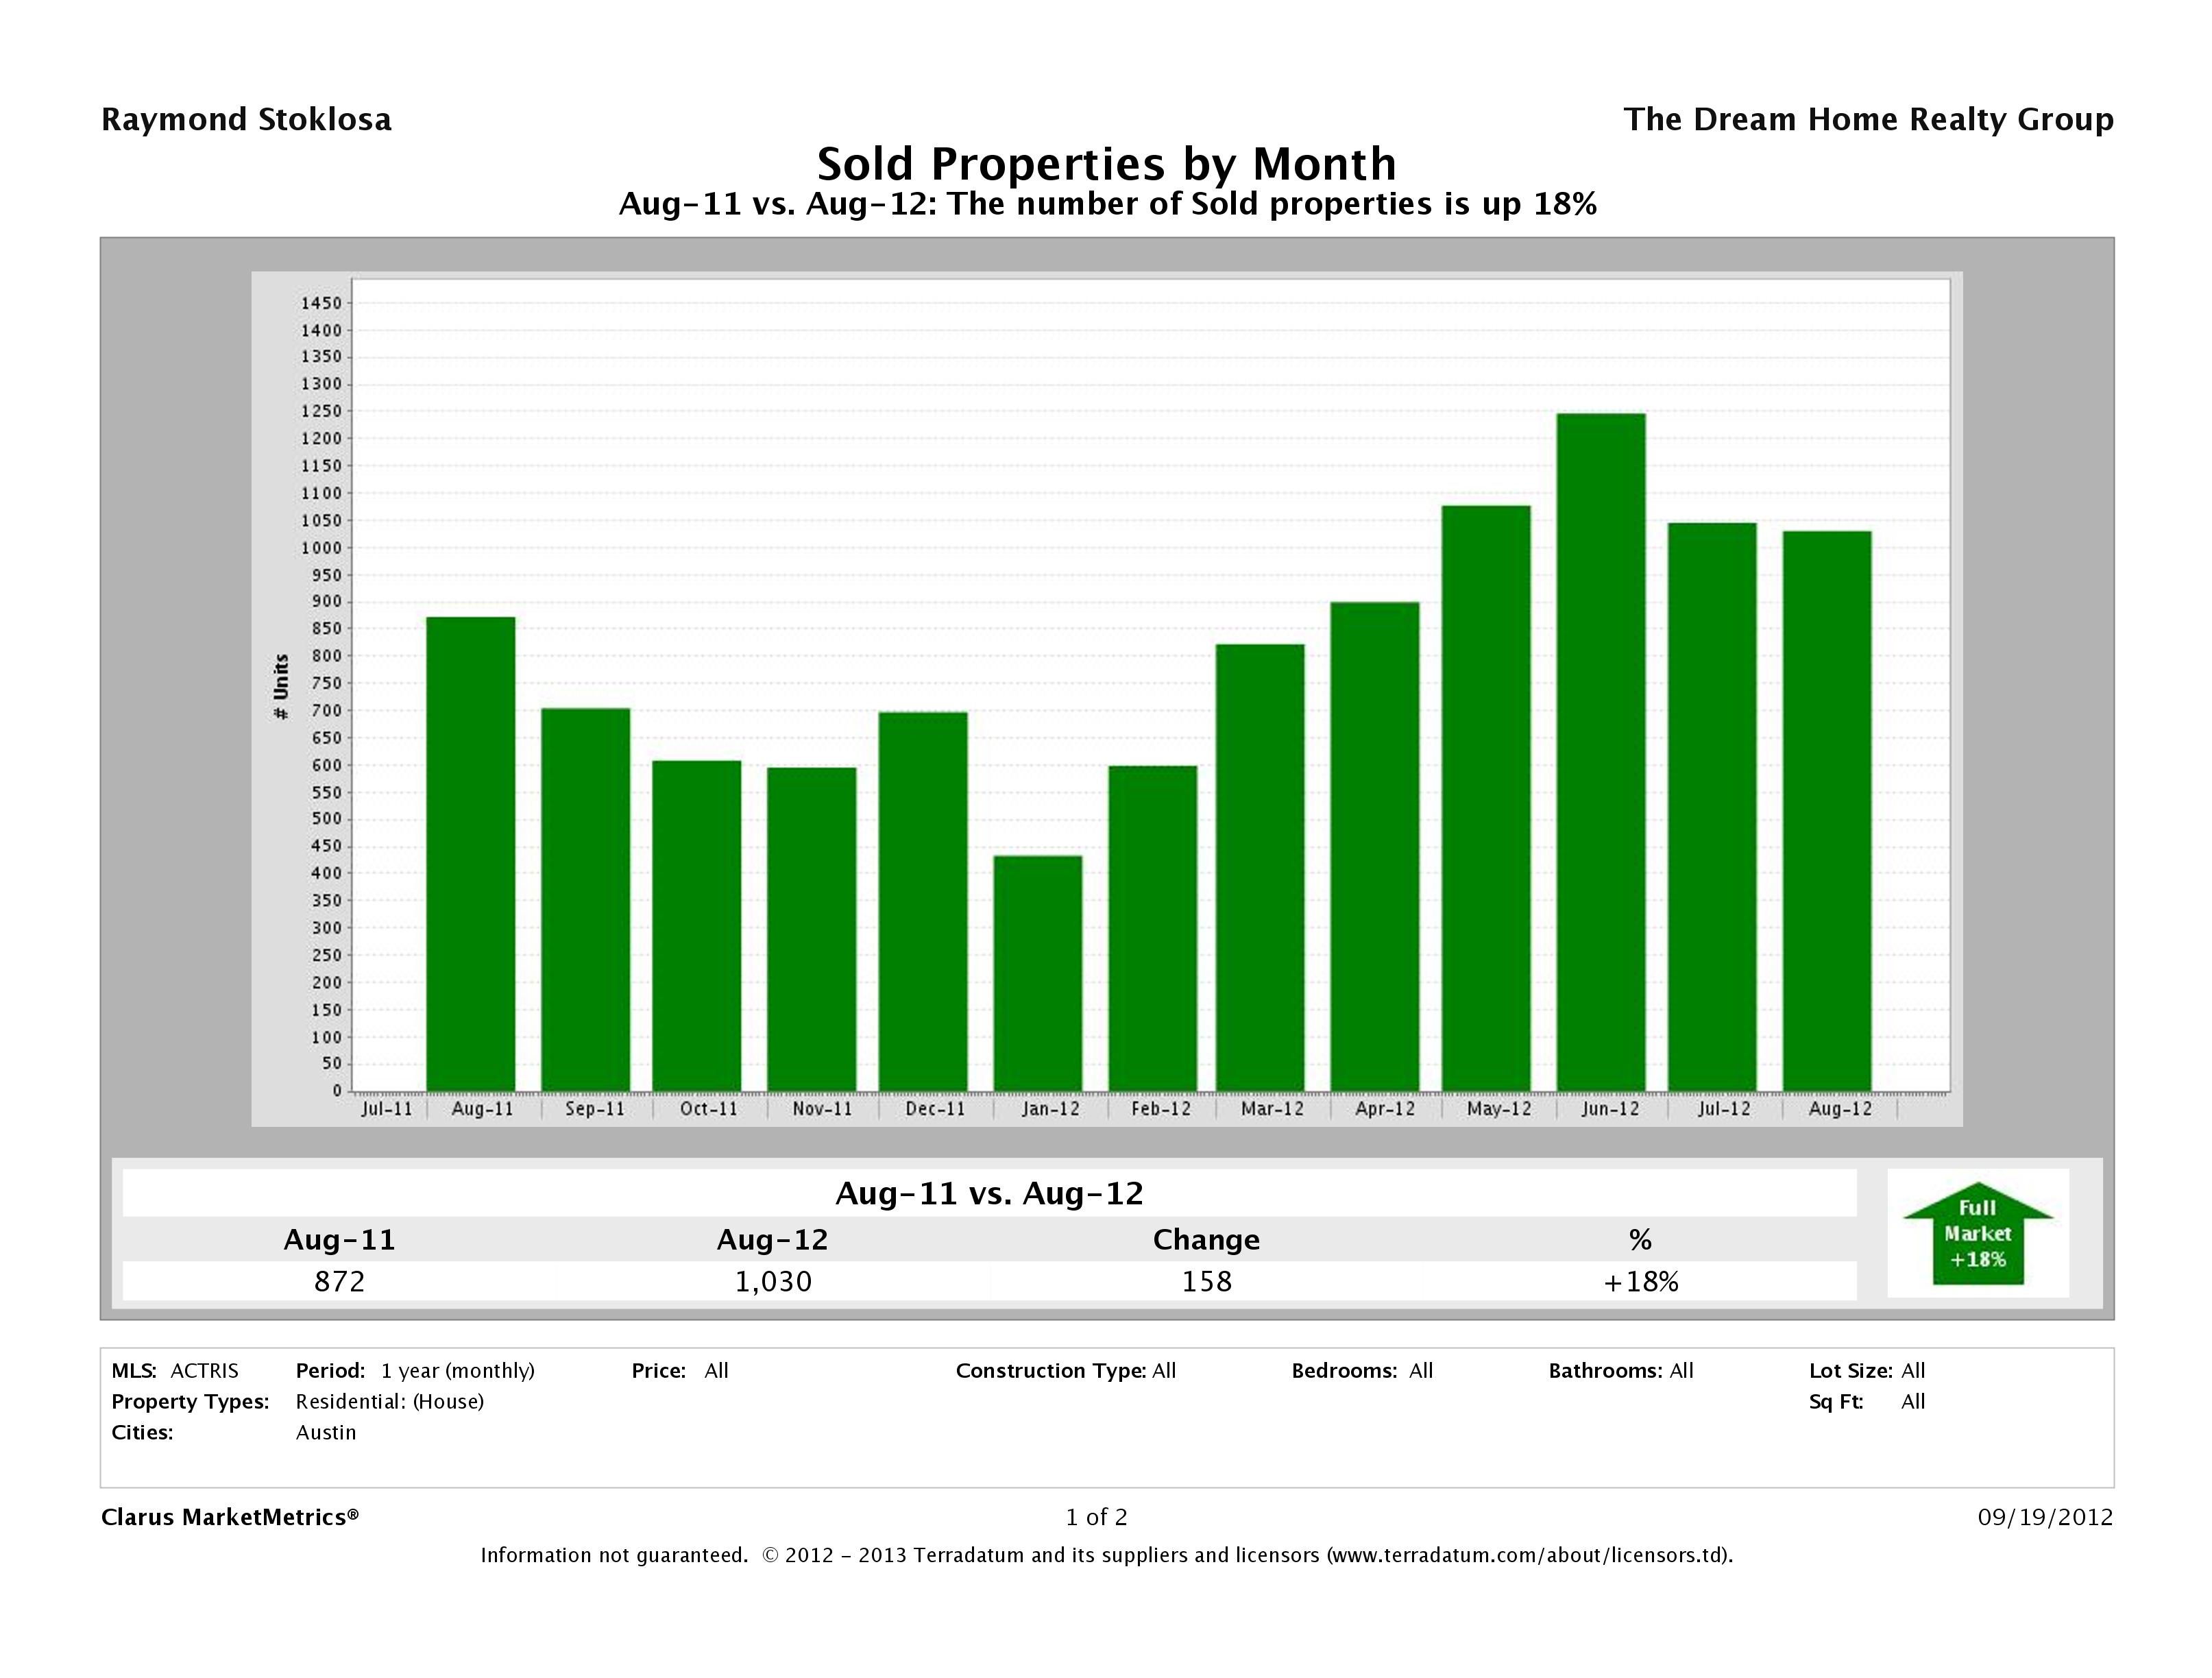
Number of Sold Homes in Austin Up 18%
In August 2012, we saw an 18% increase in the number of homes sold from August 2011 numbers. In August 2012, we saw 1,030 homes sell in Austin compared to 873 in August 2011. Normally, we see a drop off in August with number of sold homes, but this year we saw comparable numbers in July 2012. Another sign this market is still very strong.
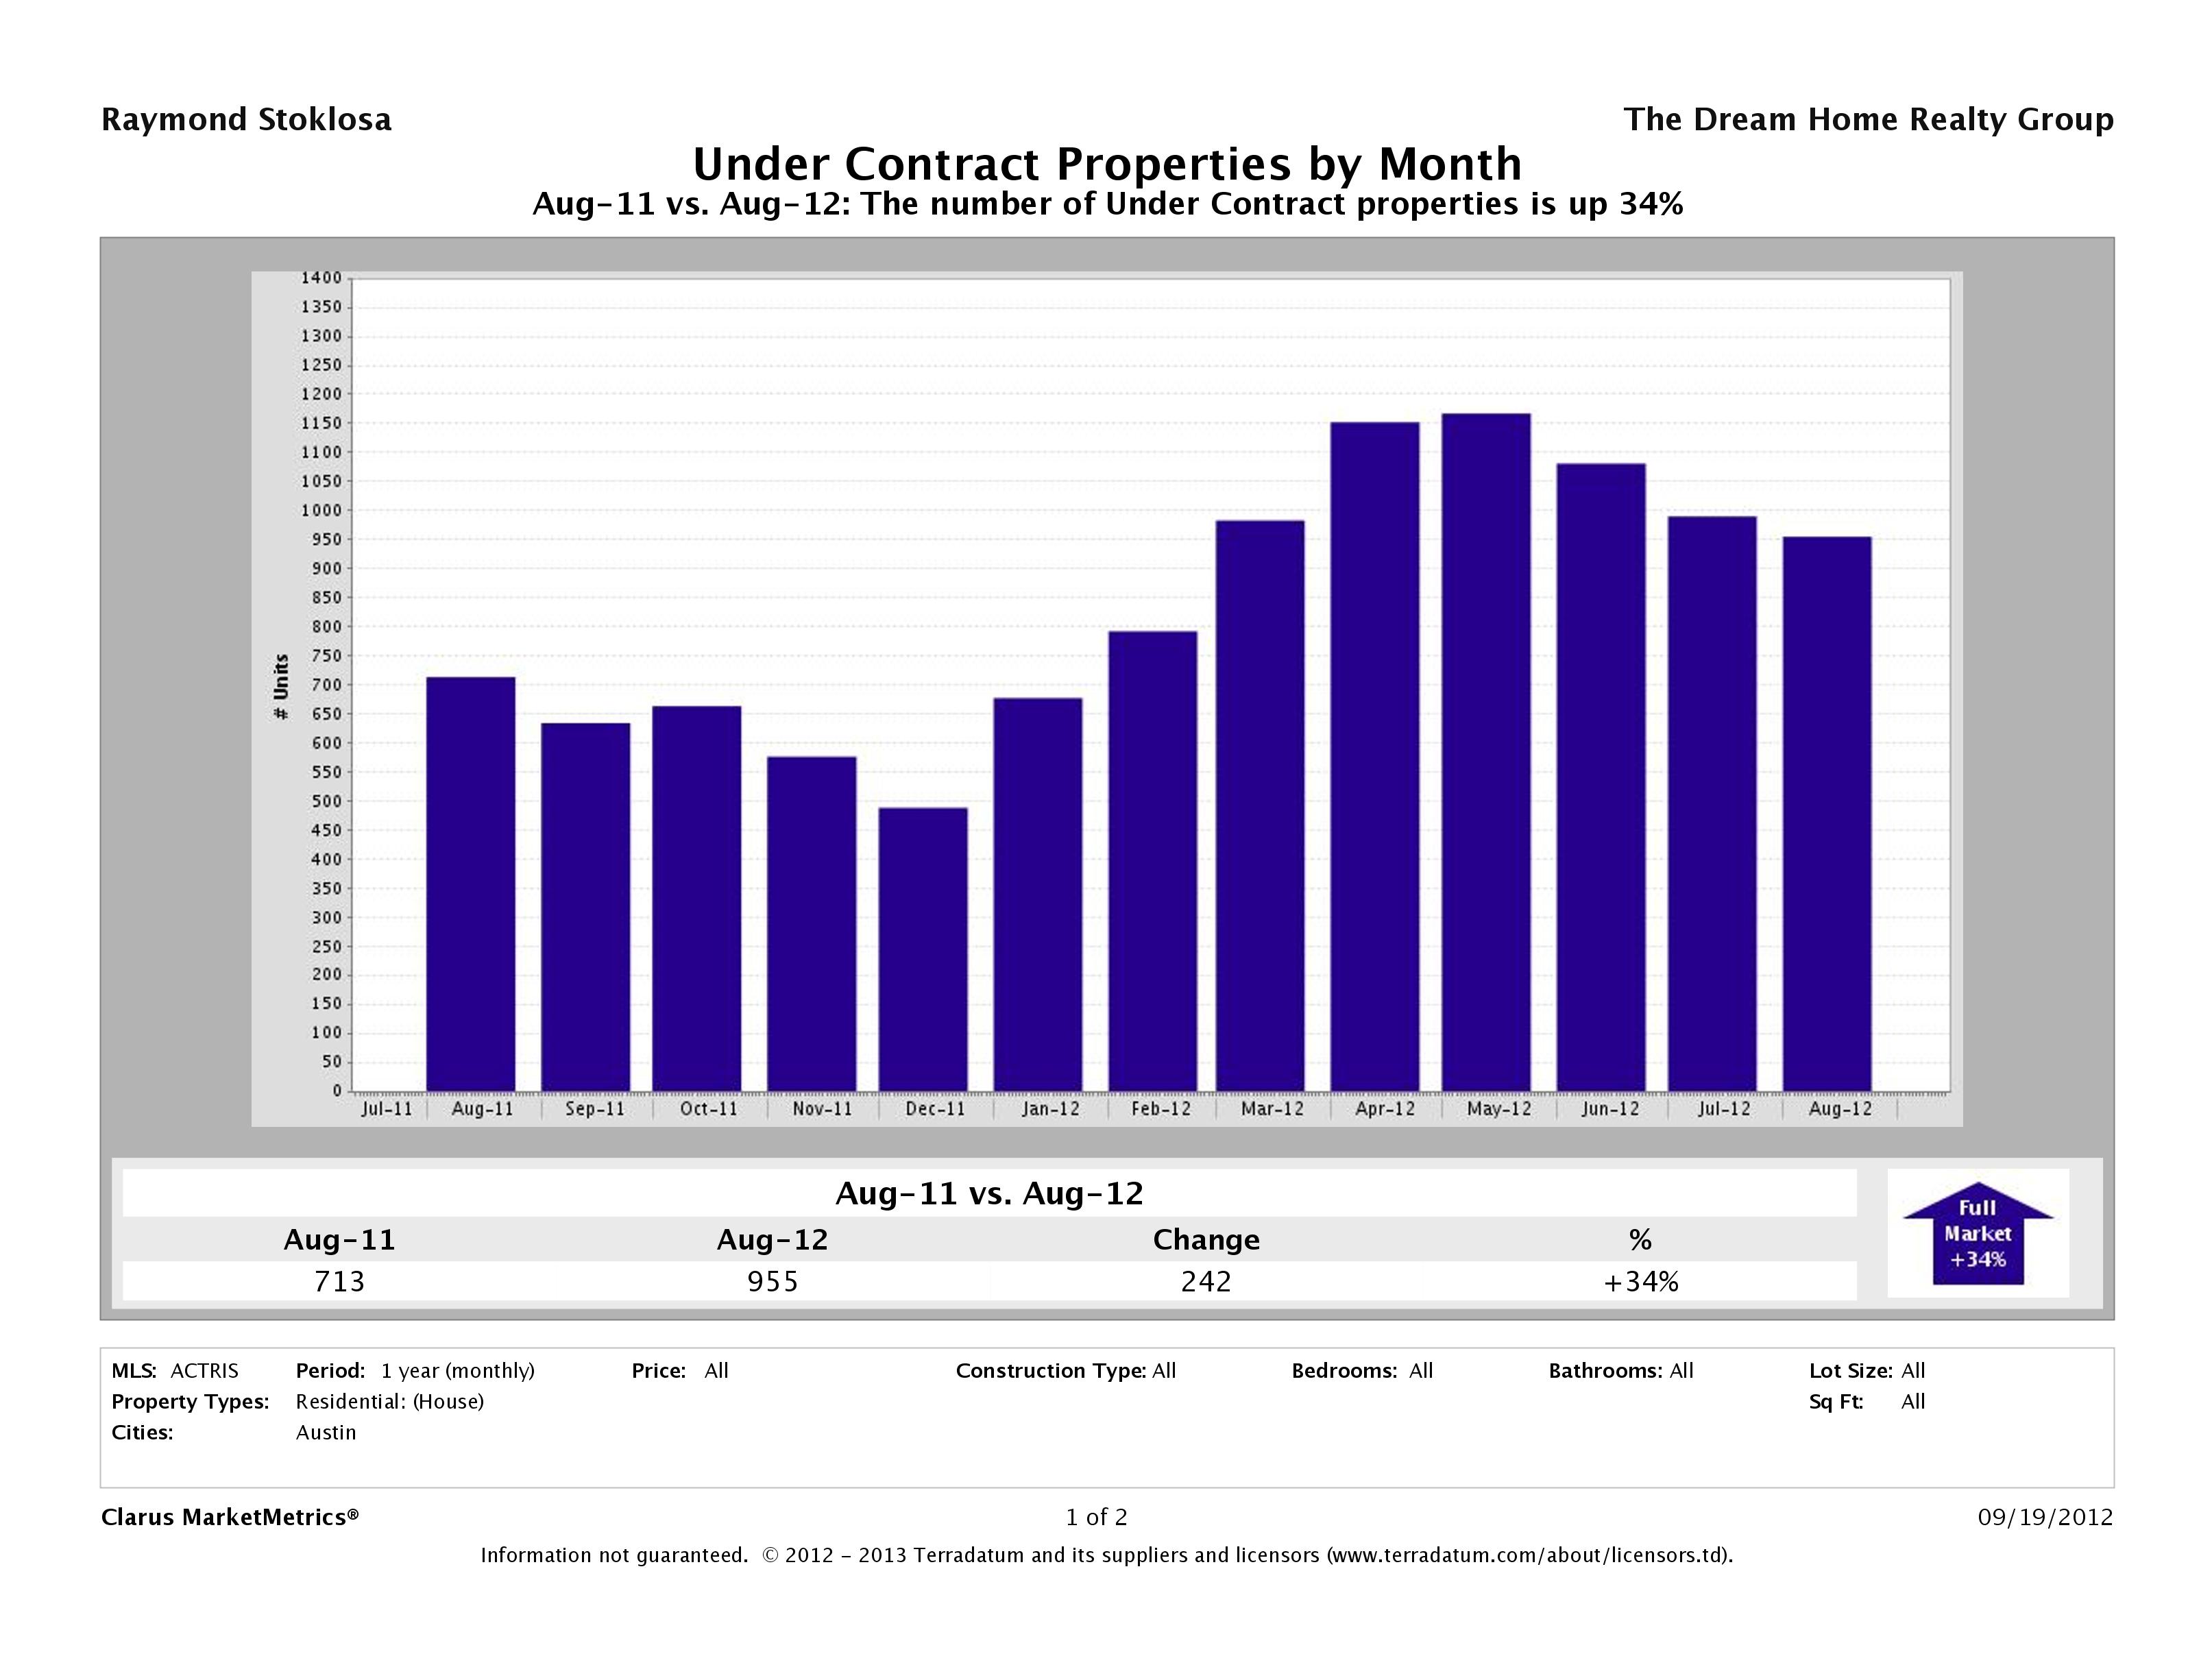
34% More Austin Homes Under Contract
In August 2012, there were 955 homes that went pending compared to just 713 in August 2011 marking a 34% increase. We usually see a sharp increase in the busy Spring/Summer buying season followed by a pretty significatn drop off in August. This year, we only saw a small drop off, another indication of the strength of the market.
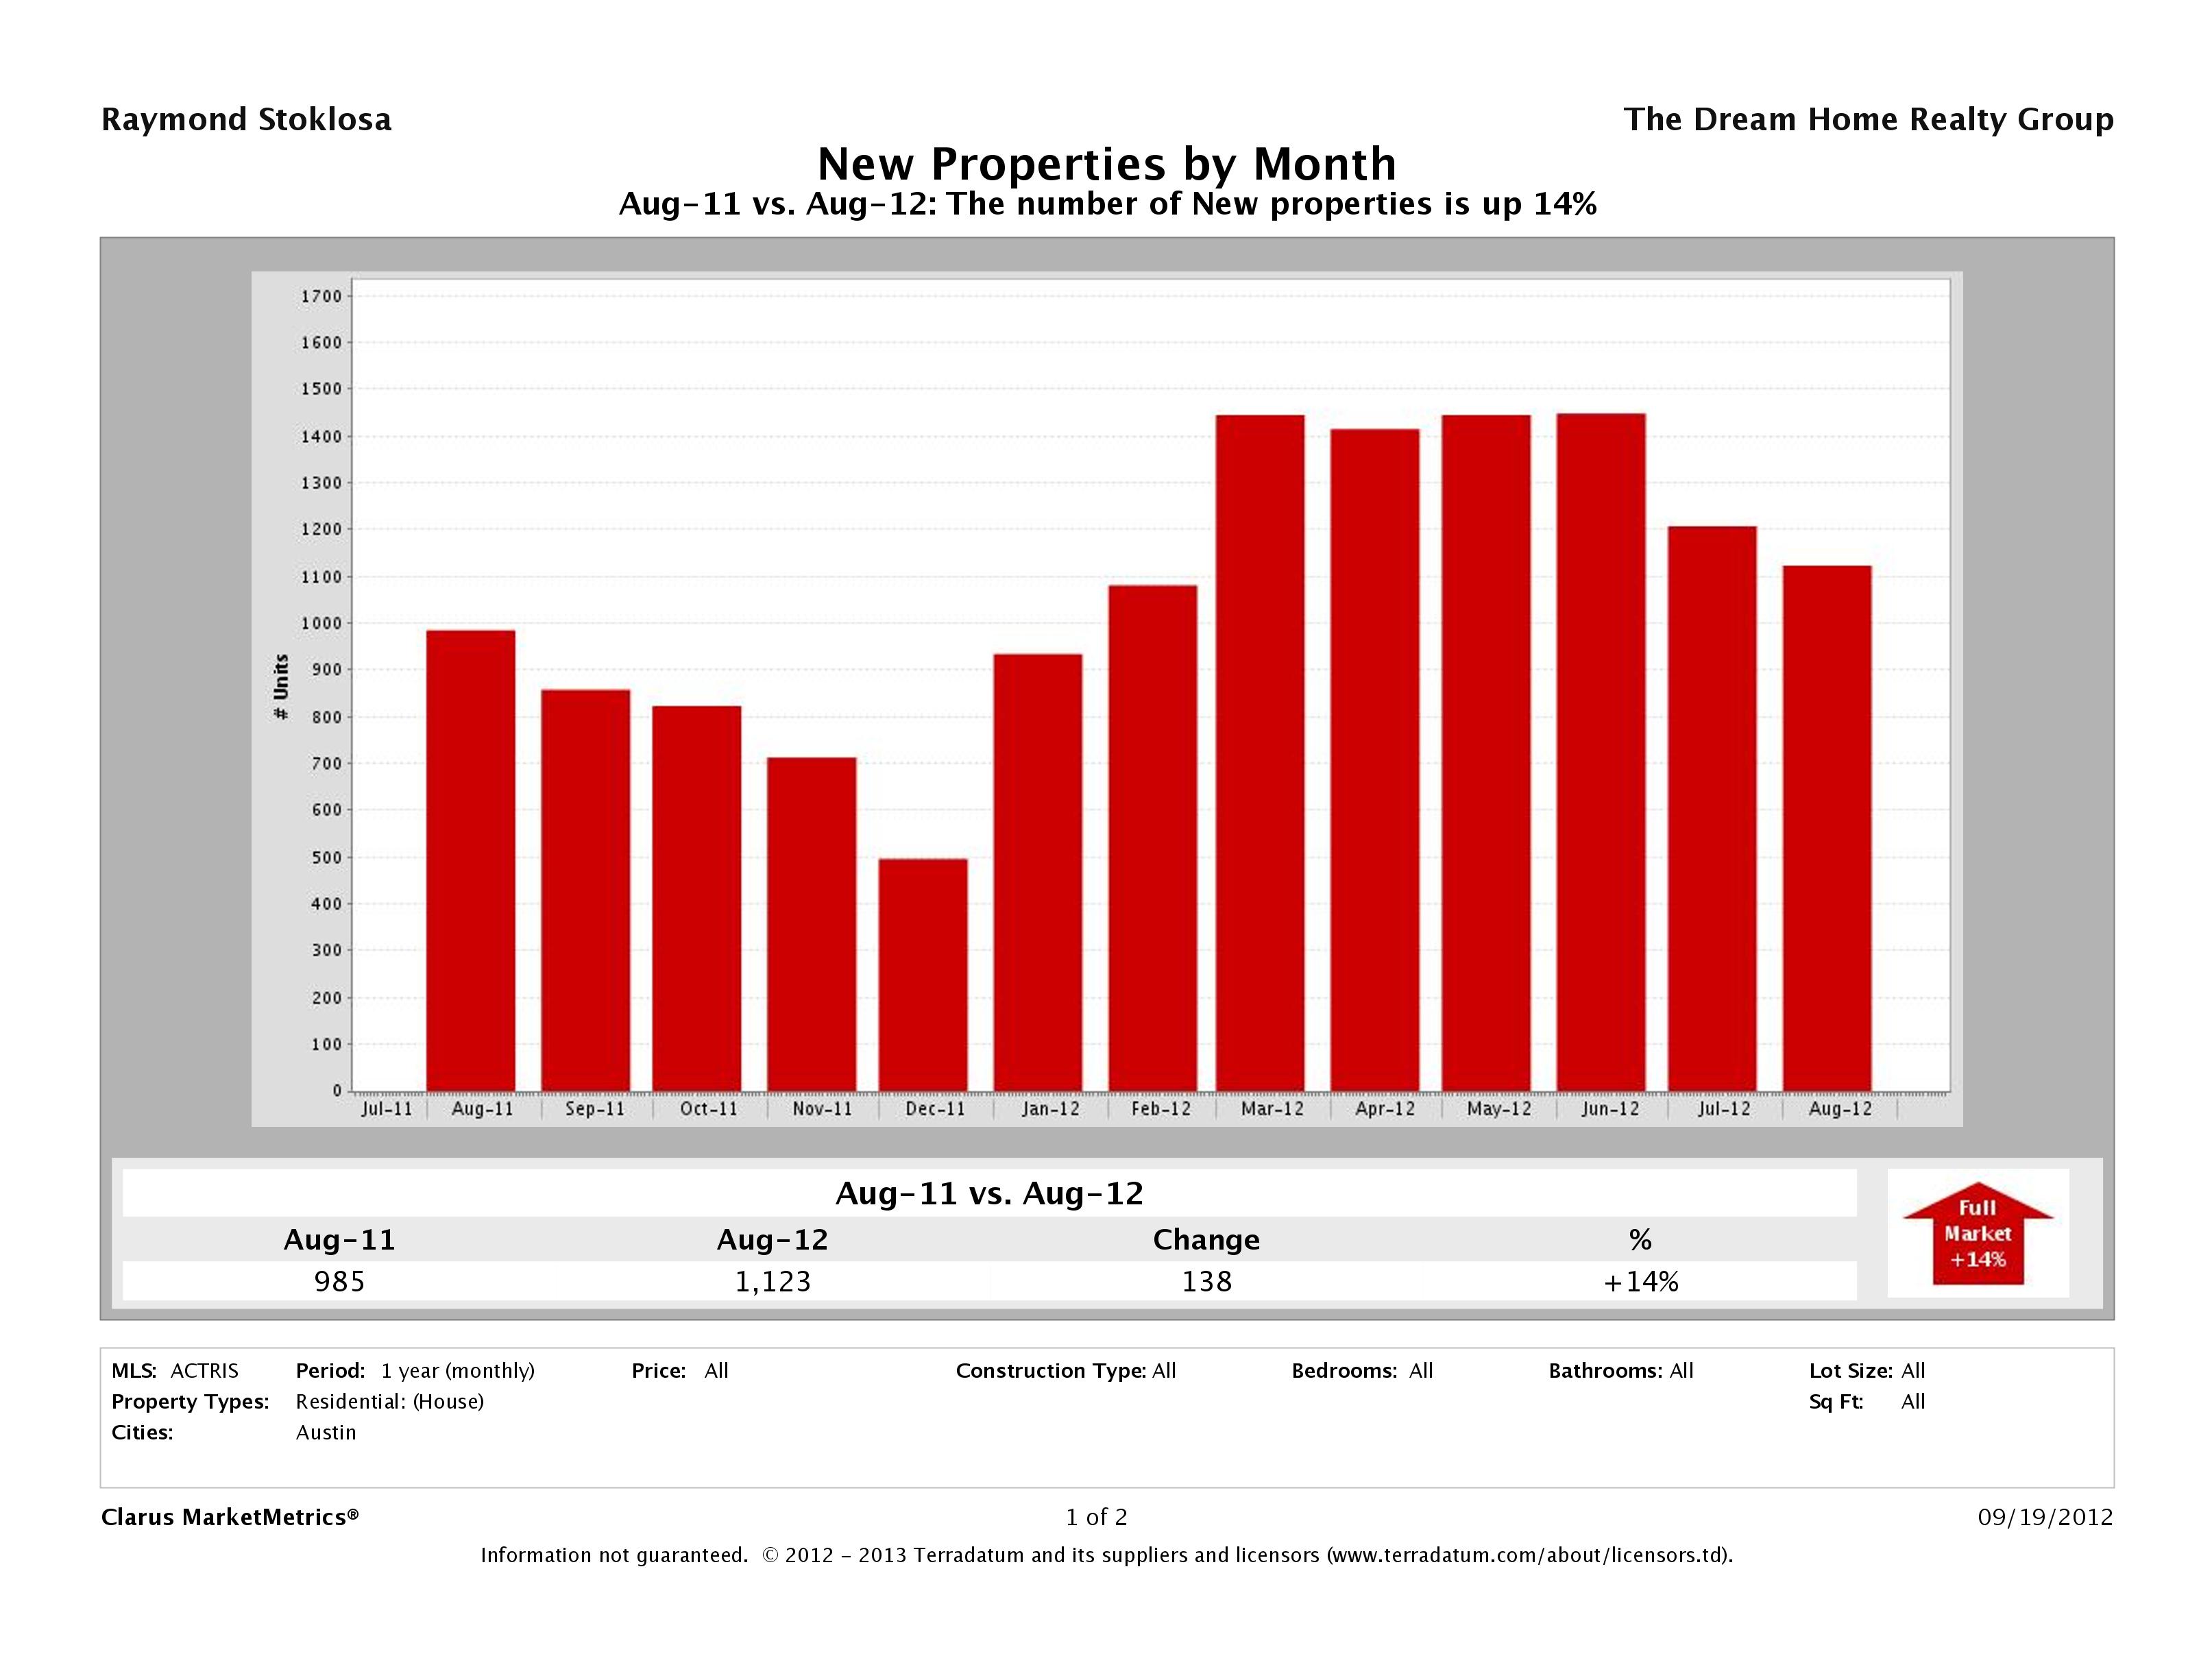
Number of Homes Listed for Sale Up 14%
In August 2012, we saw an 14% increase in the number of homes being introduced to the market than in August 2011. In August 2012, there were 1,123 homes listed for sale in Austin compared to 982 in August 2011. It seems more sellers are deciding now is the time to sell than did last year. But, demand continues to out pace supply, which is why we have such low inventory levels.
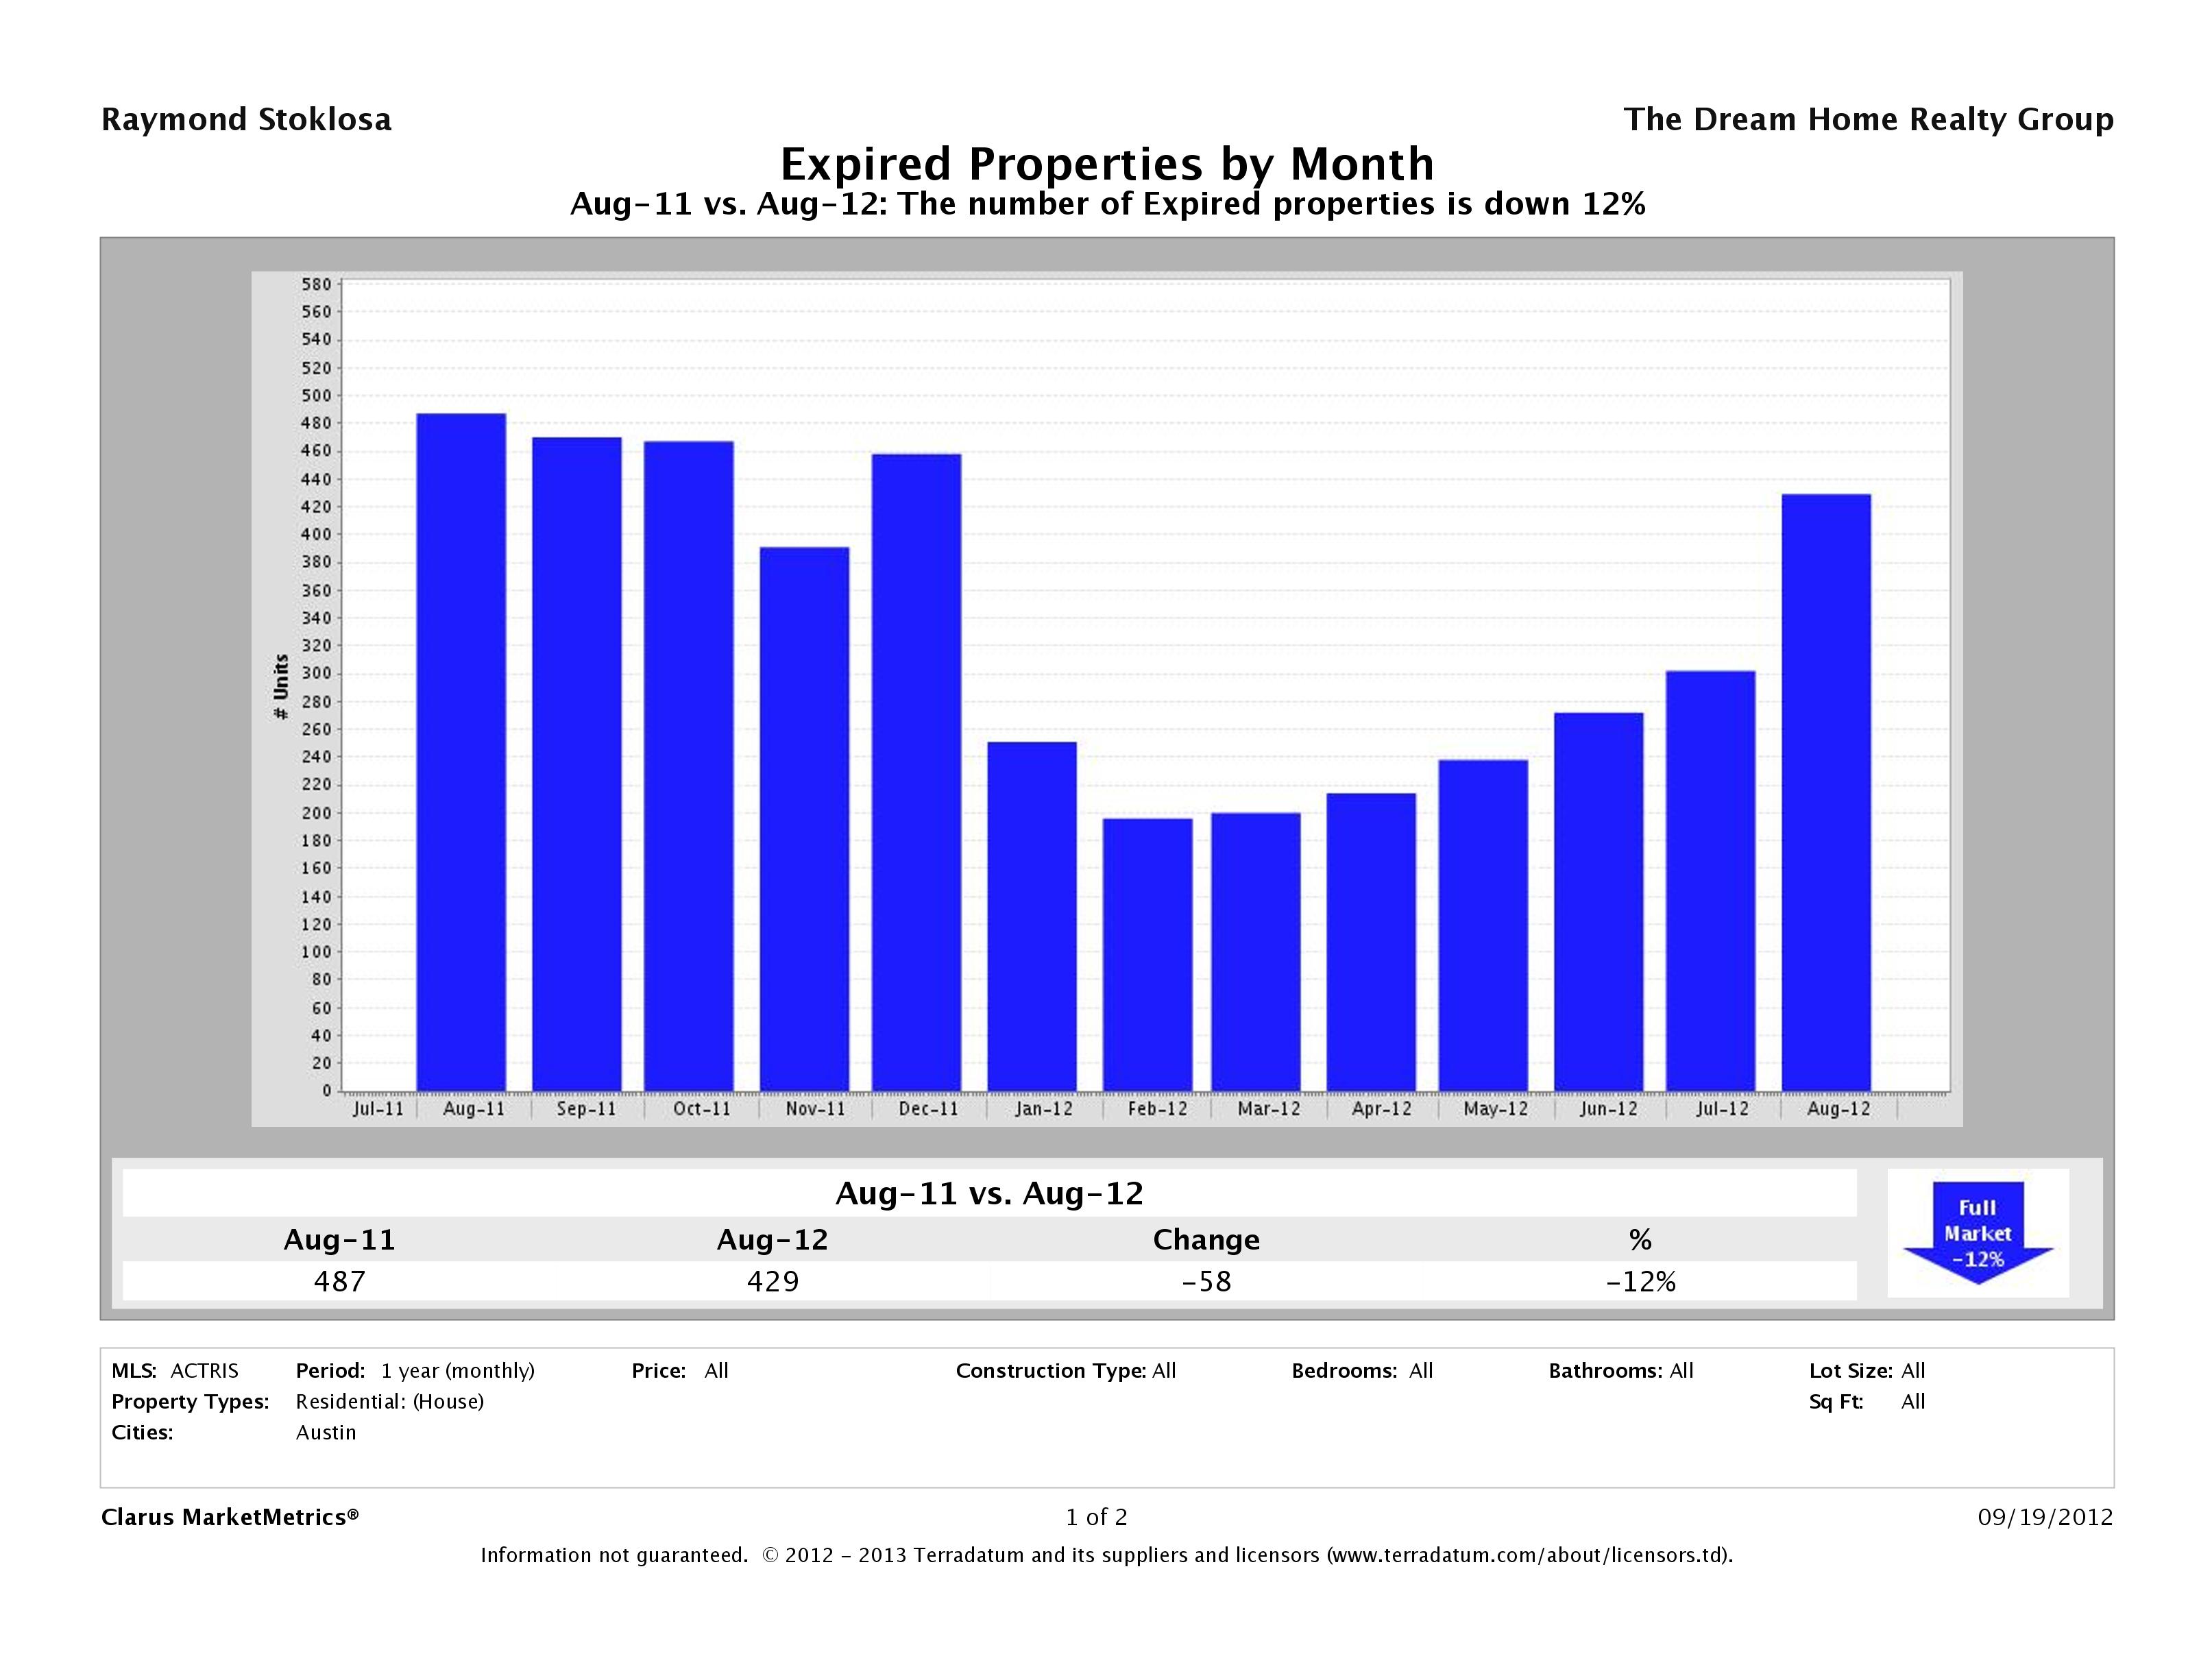
Number of Homes Taken Off the Market Down 12%
With such low inventory levels, homes that might not necessarily have been sold in a normal market are selling causing a 12% decrease in the number of homes that were taken off the market in year over year numbers. In August 2011, 487 homes were taken off the market and in August 2012, 429 were taken off the market.
Did your home expire? Check out our Austin Home Not Selling resources page to find out why.
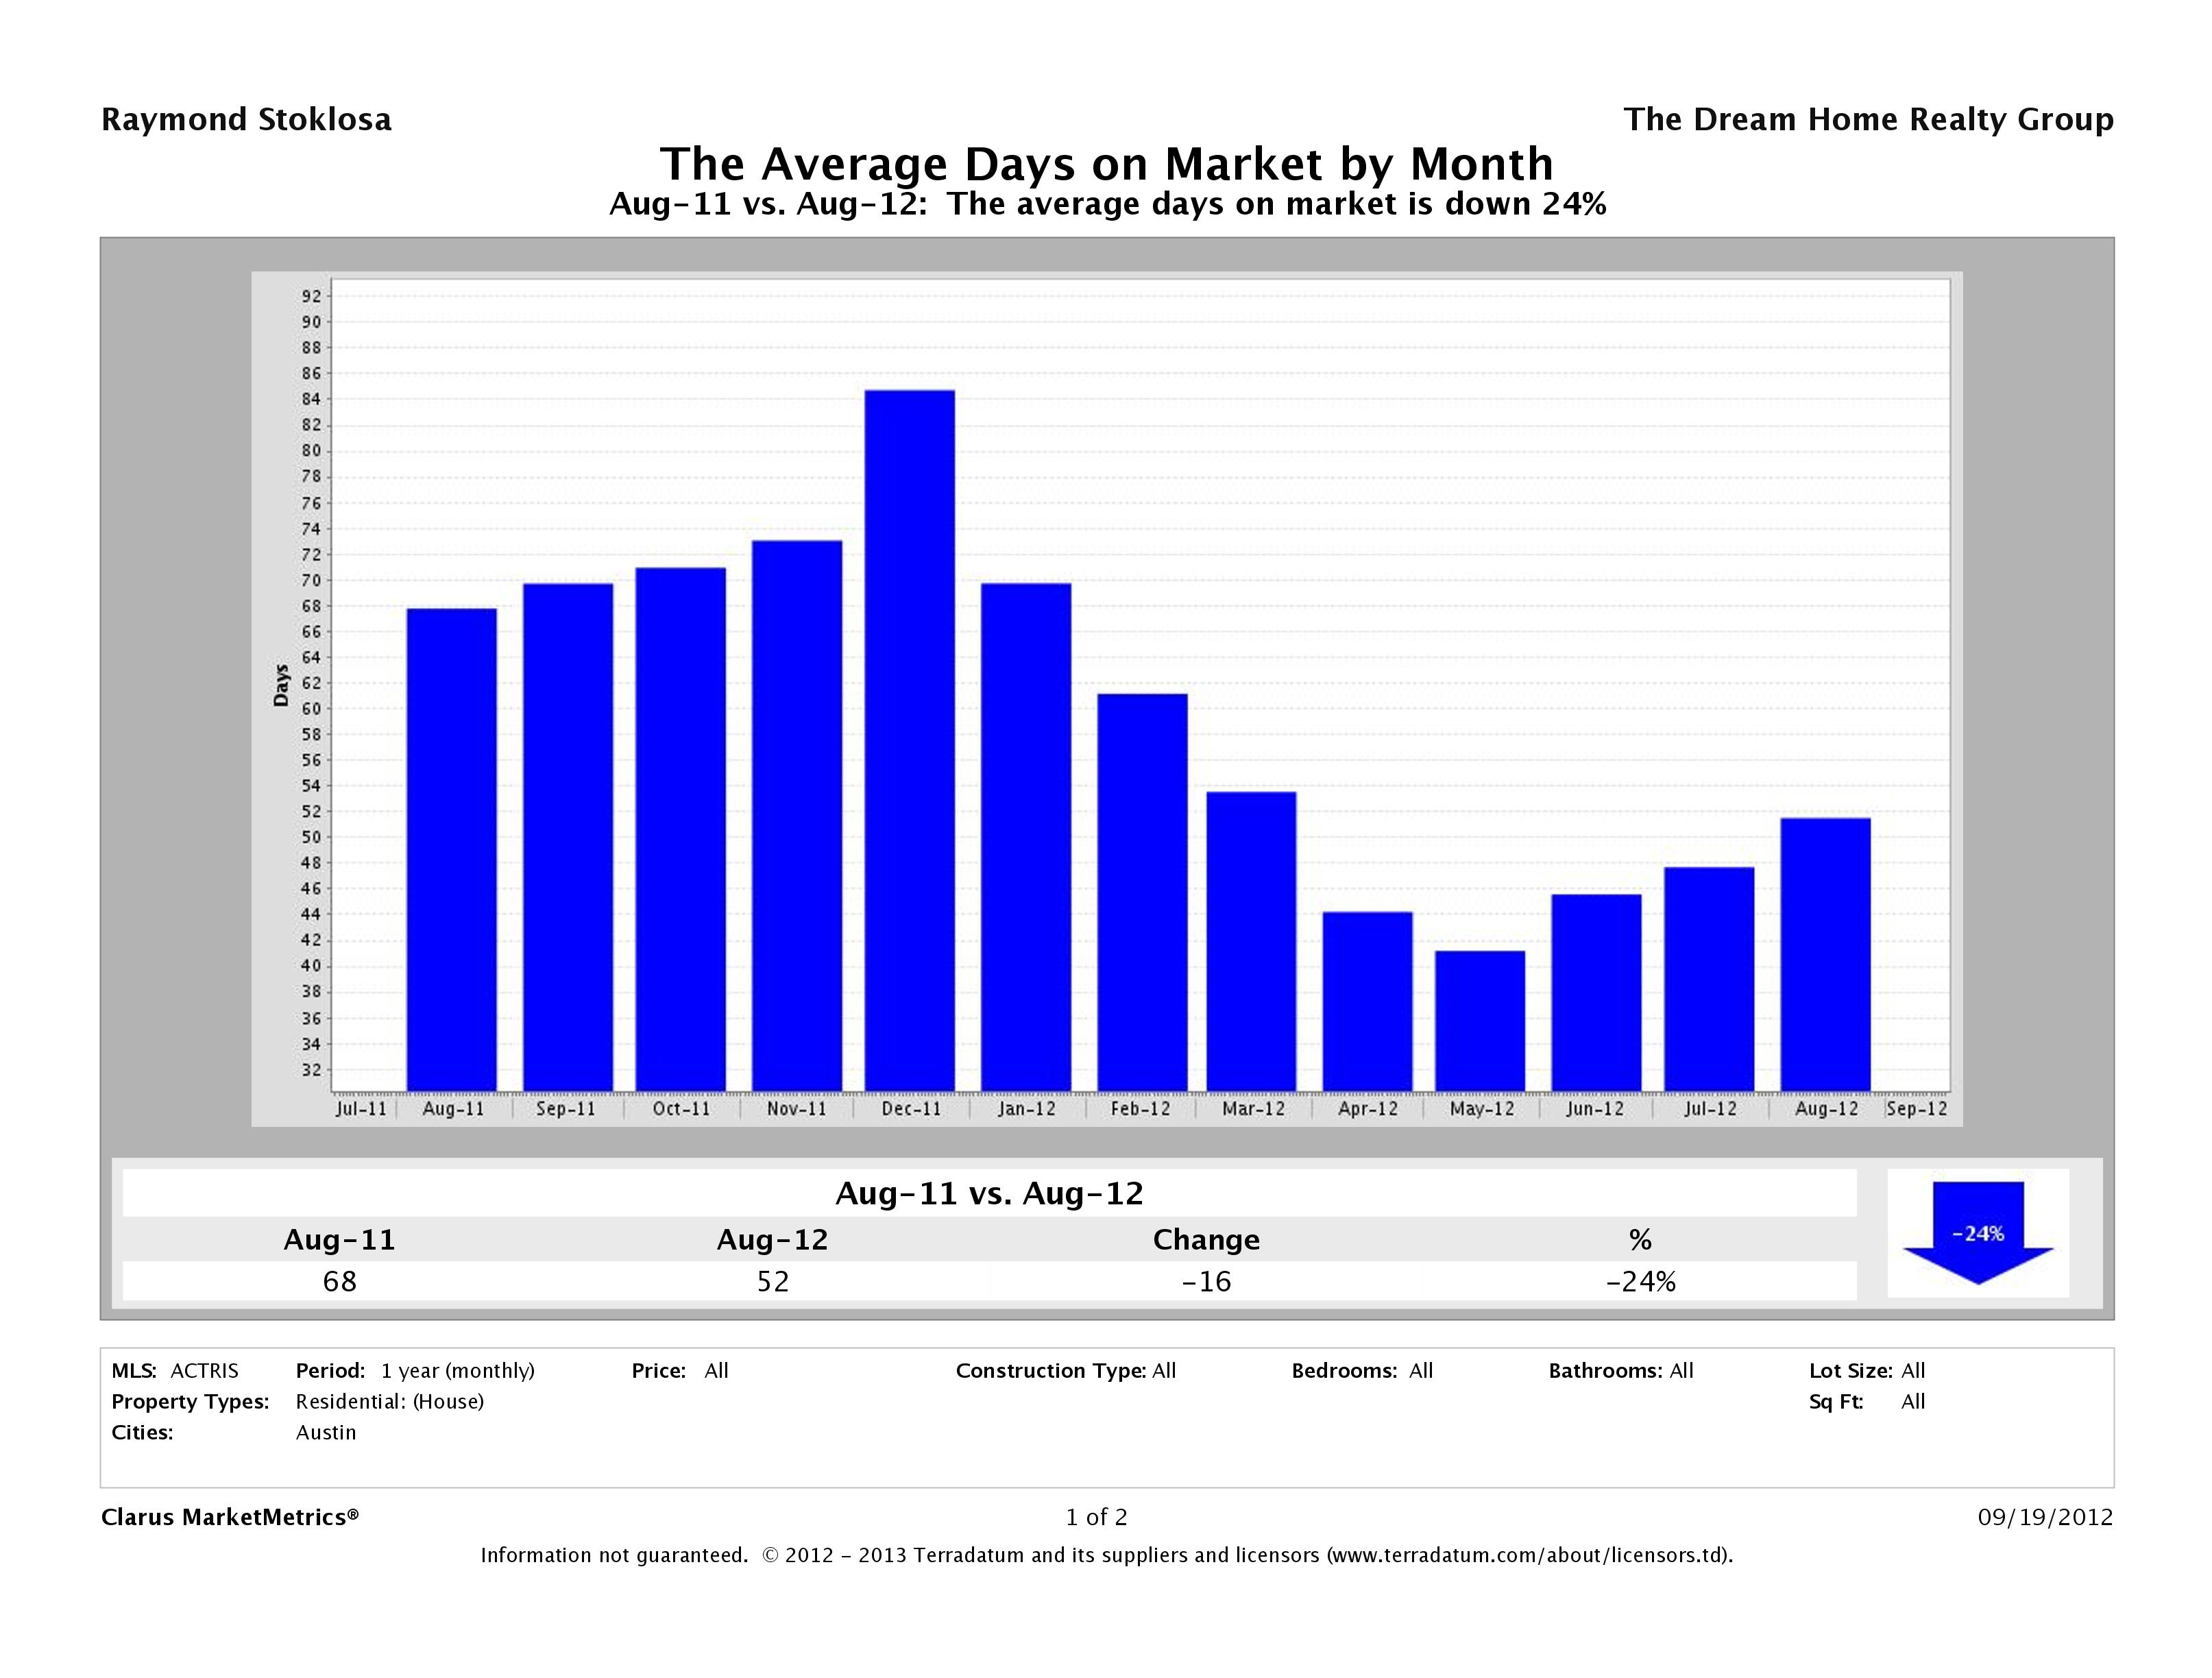
Time to Sell Home in Austin Down 24%
In August 2011, it took, on average, 68 days to sell a home in Austin while in August 2012, it is taking around 52 days. A normal market is considered 90 days, so 52 days is pretty low.
Supply is Down 18% and Demand is Up 18%
This month we’ve seen a 18% decrease in supply (number of properties for sale) and a 18% increase in demand (number of sold properties). Yet another indicator of the overwhelming number of buyers in the market compared to sellers willing to sell.
Median for Sale Up 20% vs Median Sold Price Up 9%
This chart compares the Median for Sale Price vs the Median Sold Price to show their relationship. In Austin, we saw a 20% increase in the median for sale price of a single family home in year over year numbers. The median sold price was also up 9%, increasing by $23,000 in year over year numbers. It seems sellers are asking more for their homes and are getting it.
Source: Clarus Market Metrics, ACTRIS Sold Data
August 2012 Real Estate Price Report – Strictly Numbers
For those of you who prefer to see the actual hard numbers, we’ve included the figures for August 2012 Austin home sales below. The most expensive home that sold in August 2012 was $7,000,000 and the least expensive home sold for $43,214. Homes range in size from 576sqft-13,673sqft with an average size of 2,305sqft. The average price per square foot was $147.63 with the lowest being $37.64/sqft and the highest being $511.96/sqft. It took, on average, 45 days to sell a home in Austin and sellers received, on average, 97.16% of their list prices.
| Beds | Baths | SqFt | Listing Price | LP/SqFt | Selling Price | SP/SqFt | SP/LP | SP/OLP | DOM | |
|---|---|---|---|---|---|---|---|---|---|---|
| High | 7 | 10 | 13,673 | $7,500,000 | $548.53 | $7,000,000 | $511.96 | 144% | 933.3% | 1,156 |
| Low | 1 | 1 | 576 | $30,000 | $26.13 | $43,214 | $37.64 | 68.5% | 0.9% | 0 |
| Average | 3 | 2 | 2,305 | $360,556 | $151.24 | $349,760 | $147.63 | 97.92% | 97.16% | 45 |
| Median | 3 | 2 | 2,066 | $279,500 | $129.59 | $270,000 | $127.87 | 98.2% | 97.3% | 21 |
| Search Criteria | |||
|---|---|---|---|
| Status | Sold | Sold Date | August 2012 |
| Property Type | Single Family Homes | Number Sold | 1,031 |
| Source: | ABoR Sales Data | Area | Austin |
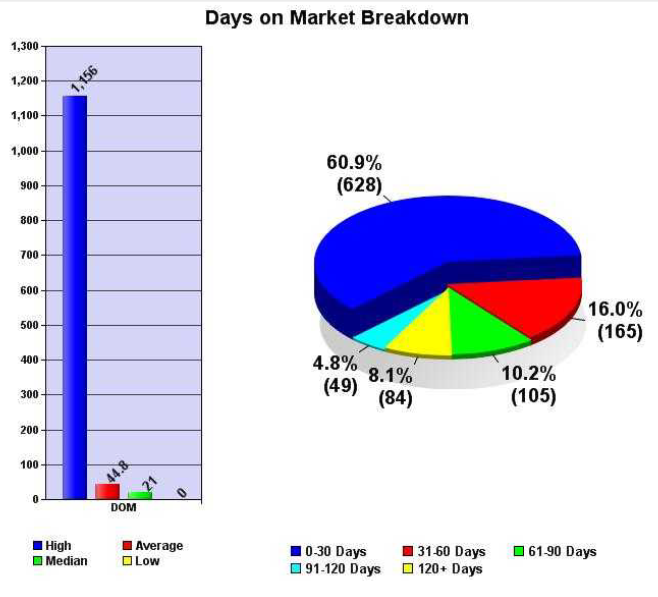
August 2012 Days on Market Report
The overwhelming majority (60.91%) of the 1,031 homes that sold in Austin in August 2012 (628) sold in less than 30 days and received, on average, 98.89% of their list prices. As homes stayed on the market for longer, sellers received less than their list prices with homes that have been for sale for 120 days or more receiving, on average, 95.89% of their list prices. The lesson here? Homes that are priced right from the beginning sell quickly and for list price.
| 0-30 Days | 31-60 Days | 61-90 Days | 91-120 Days | 120+ Days | |
|---|---|---|---|---|---|
| No. of Listings | 628 | 165 | 105 | 49 | 84 |
| Breakdown % | 60.91% | 16% | 10.18% | 4.75% | 8.15% |
| Avg % SP/LP | 98.89% | 97.09% | 95.85% | 96.24% | 95.89% |
August 2012 Price Analysis Report
The majority of the homes that sold in Austin in August 2012 were priced below $400,000, which is to be expected. You’ll also see that the lower priced homes sold faster than the higher priced homes, which is due largely in part to the increased market for homes below $400k.
| Price Range | Quantity | Average DOM |
|---|---|---|
| $149,999 or under | 130 | 38 |
| $150,000 – $199,999 | 175 | 32 |
| $200,000 – $249,999 | 147 | 35 |
| $250,000 – $299,999 | 130 | 54 |
| $300,000 – $349,999 | 105 | 32 |
| $350,000 – $399,999 | 69 | 29 |
| $400,000 – $449,999 | 70 | 48 |
| $450,000 – $499,999 | 41 | 55 |
| $500,000 – $549,999 | 36 | 50 |
| $550,000 – $599,999 | 27 | 59 |
| $600,000 – $699,999 | 33 | 54 |
| $700,000 – $799,999 | 19 | 79 |
| $800,000 – $899,999 | 12 | 66 |
| $900,000 – $999,999 | 6 | 124 |
| $1,000,000 or over | 31 | 139 |
| Total | 1,031 | 45 |
August 2012 Summary Price Report
Below you’ll find a breakdown of the sales prices of homes in Austin. The average price of a home that sold in August 2012 was $349,760 and the median price was $270,000.
| Summary | List Price | Sale Price |
|---|---|---|
| High | $7,500,000 | $7,000,000 |
| Low | $30,000 | $43,214 |
| Average | $360,556 | $349,760 |
| Median | $279,500 | $270,000 |
Time to Buy? Sell?
As we always say, the best time to buy or sell a home is when you need to buy or sell. If you have a house to sell, selling when its a buyers market may hurt you on the selling end, but you’ll make it up on the buying end. If you’re trying to get into the market for the first time, the only way you’ll know that we’ve “hit bottom” is when its in the rear view mirror. Work with professionals who can help you analyze your financial and lifestyle to determine if now is the right time to buy or sell.
Looking strictly at the numbers, it appears the recommendation for this month is (again)…it’s time to sell. With inventory hovering near the 3 year low, a home that’s priced right should have no problem finding a buyer. Buyers again came out in record numbers in August 2012. As we head into back to school time and get into the Holidays, buyers will start to get distracted. If you need to sell, try to get it on the market as soon as possible. For more info about the best home selling program in Austin, visit Sell My Austin Home.
If you’re a buyer, that doesn’t mean sit on the fence. Buyers have negotiated great deals from sellers who need to sell. If you’re looking to get into the market, the best time to find a great deal is any time you can. For more info about our Home Buyer Representation Program, check out Buy a Home in Austin.
Questions About the Austin Real Estate Price Report?
Do you have questions about this Austin Real Estate Price Report? Call us at (512) 827-8323 or email us at info@AustinRealEstateHomesBlog.com and we’ll help you in any way we can. If you’re looking to buy or sell Austin real estate, don’t forget to check out our Buyer Resources and our Seller Resources for more tips.
Leave a Reply