Eleven Oaks Realty is proud to present their May 2013 Austin Real Estate Price Report measuring activity in the Austin single family home market.
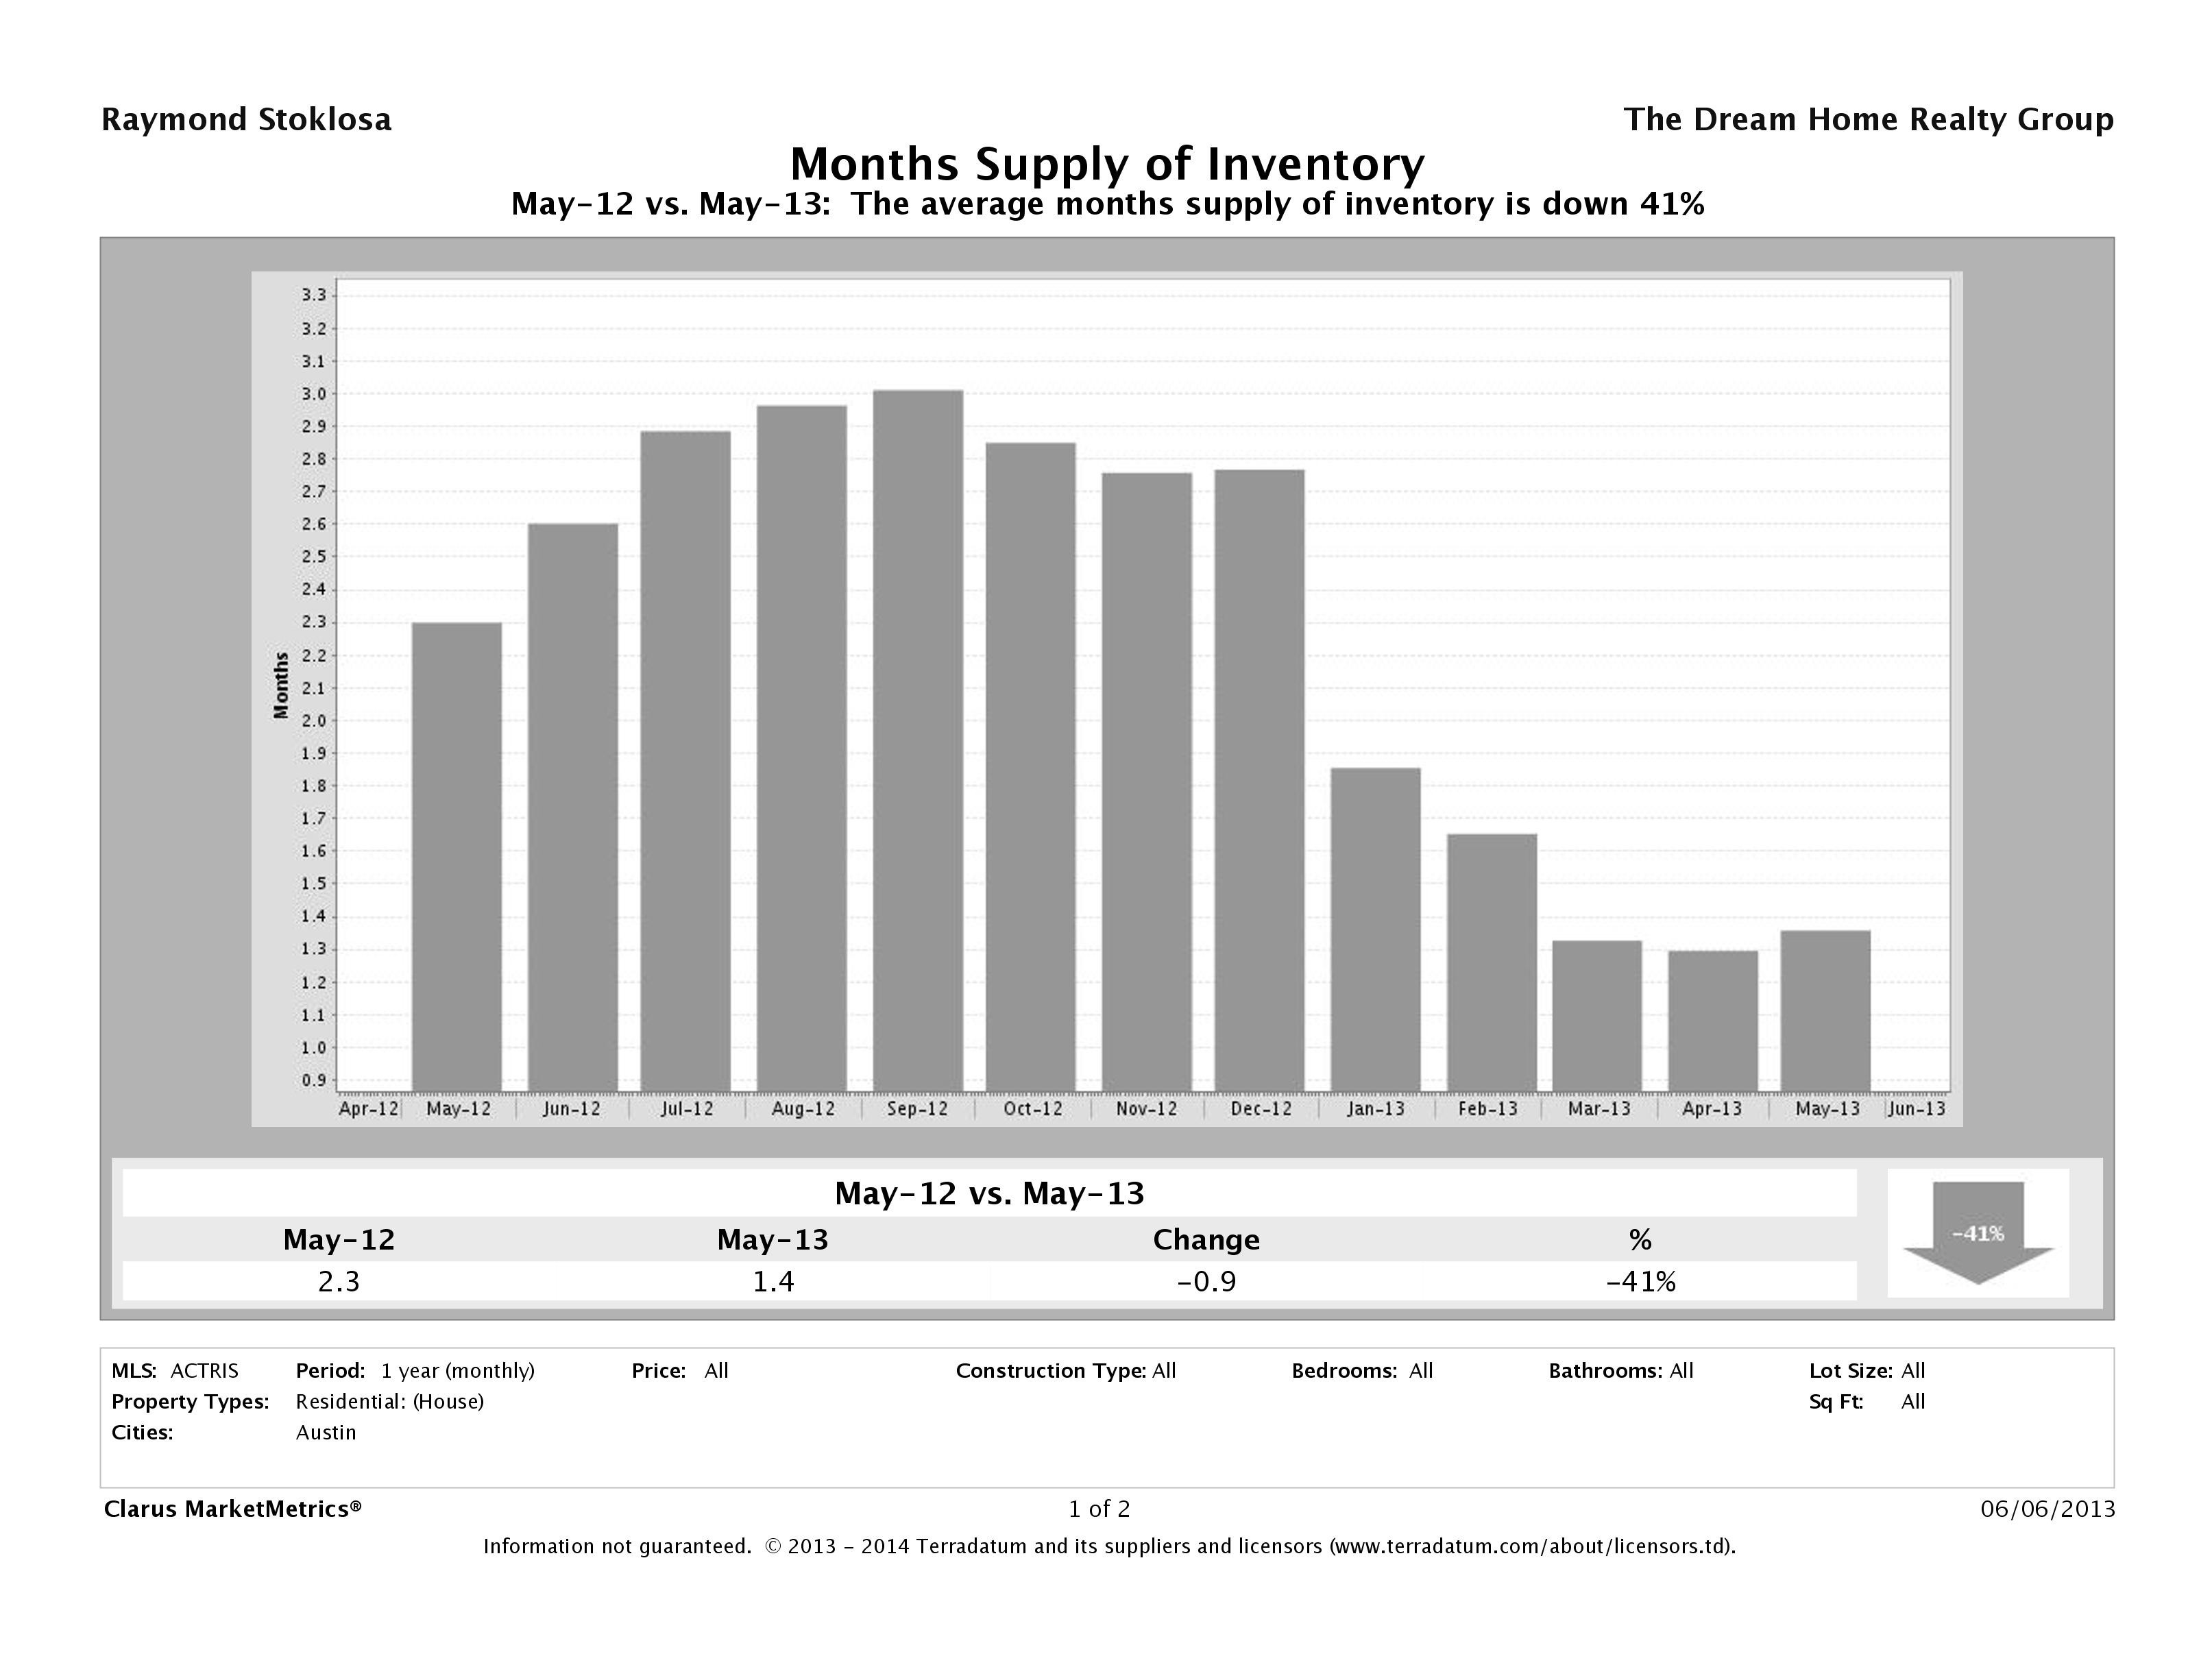
Austin Housing Inventory Down 41%
As it’s been for past several months, the biggest news in the Austin housing market comes by way of inventory. In May 2013, we saw a 41% decrease in months supply of inventory in year over year numbers with a slight increase from April 2013 numbers to less than 1 1/2 months of single family home inventory currently on the market. In the more desirable Austin neighborhoods, we are seeing an even less inventory available, which is to be expected. May 2012 saw 2.3 months of inventory, which is indicative of a strong sellers market. May 2013’s less than 1 1/2 months of inventory shows an even stronger seller’s market.
What does this mean to buyers? If you’re in the market to buy, be proactive, especially if you’re looking in one of the more desirable neighborhoods or if you are in the market to buy a home that’s priced at $250,000 or below. Homes that are priced right are selling within a matter of hours, many of them with multiple offers and for more than list price. Buyers can’t afford to wait a week to look at a home. Making home buying a priority will ensure you don’t miss out on a great house.
What does this mean to sellers? If you’re thinking about selling, now is the time to do it. If you aren’t too thrilled with your neighborhood, or want to be in a better neighborhood, the money you will make on the home you need to sell will make up for the extra you might spend on the house you buy. We haven’t seen this extreme a seller’s market in Austin in years. Interest rates are incredibly low and buyers are starting to get eager to buy something before they go back up.
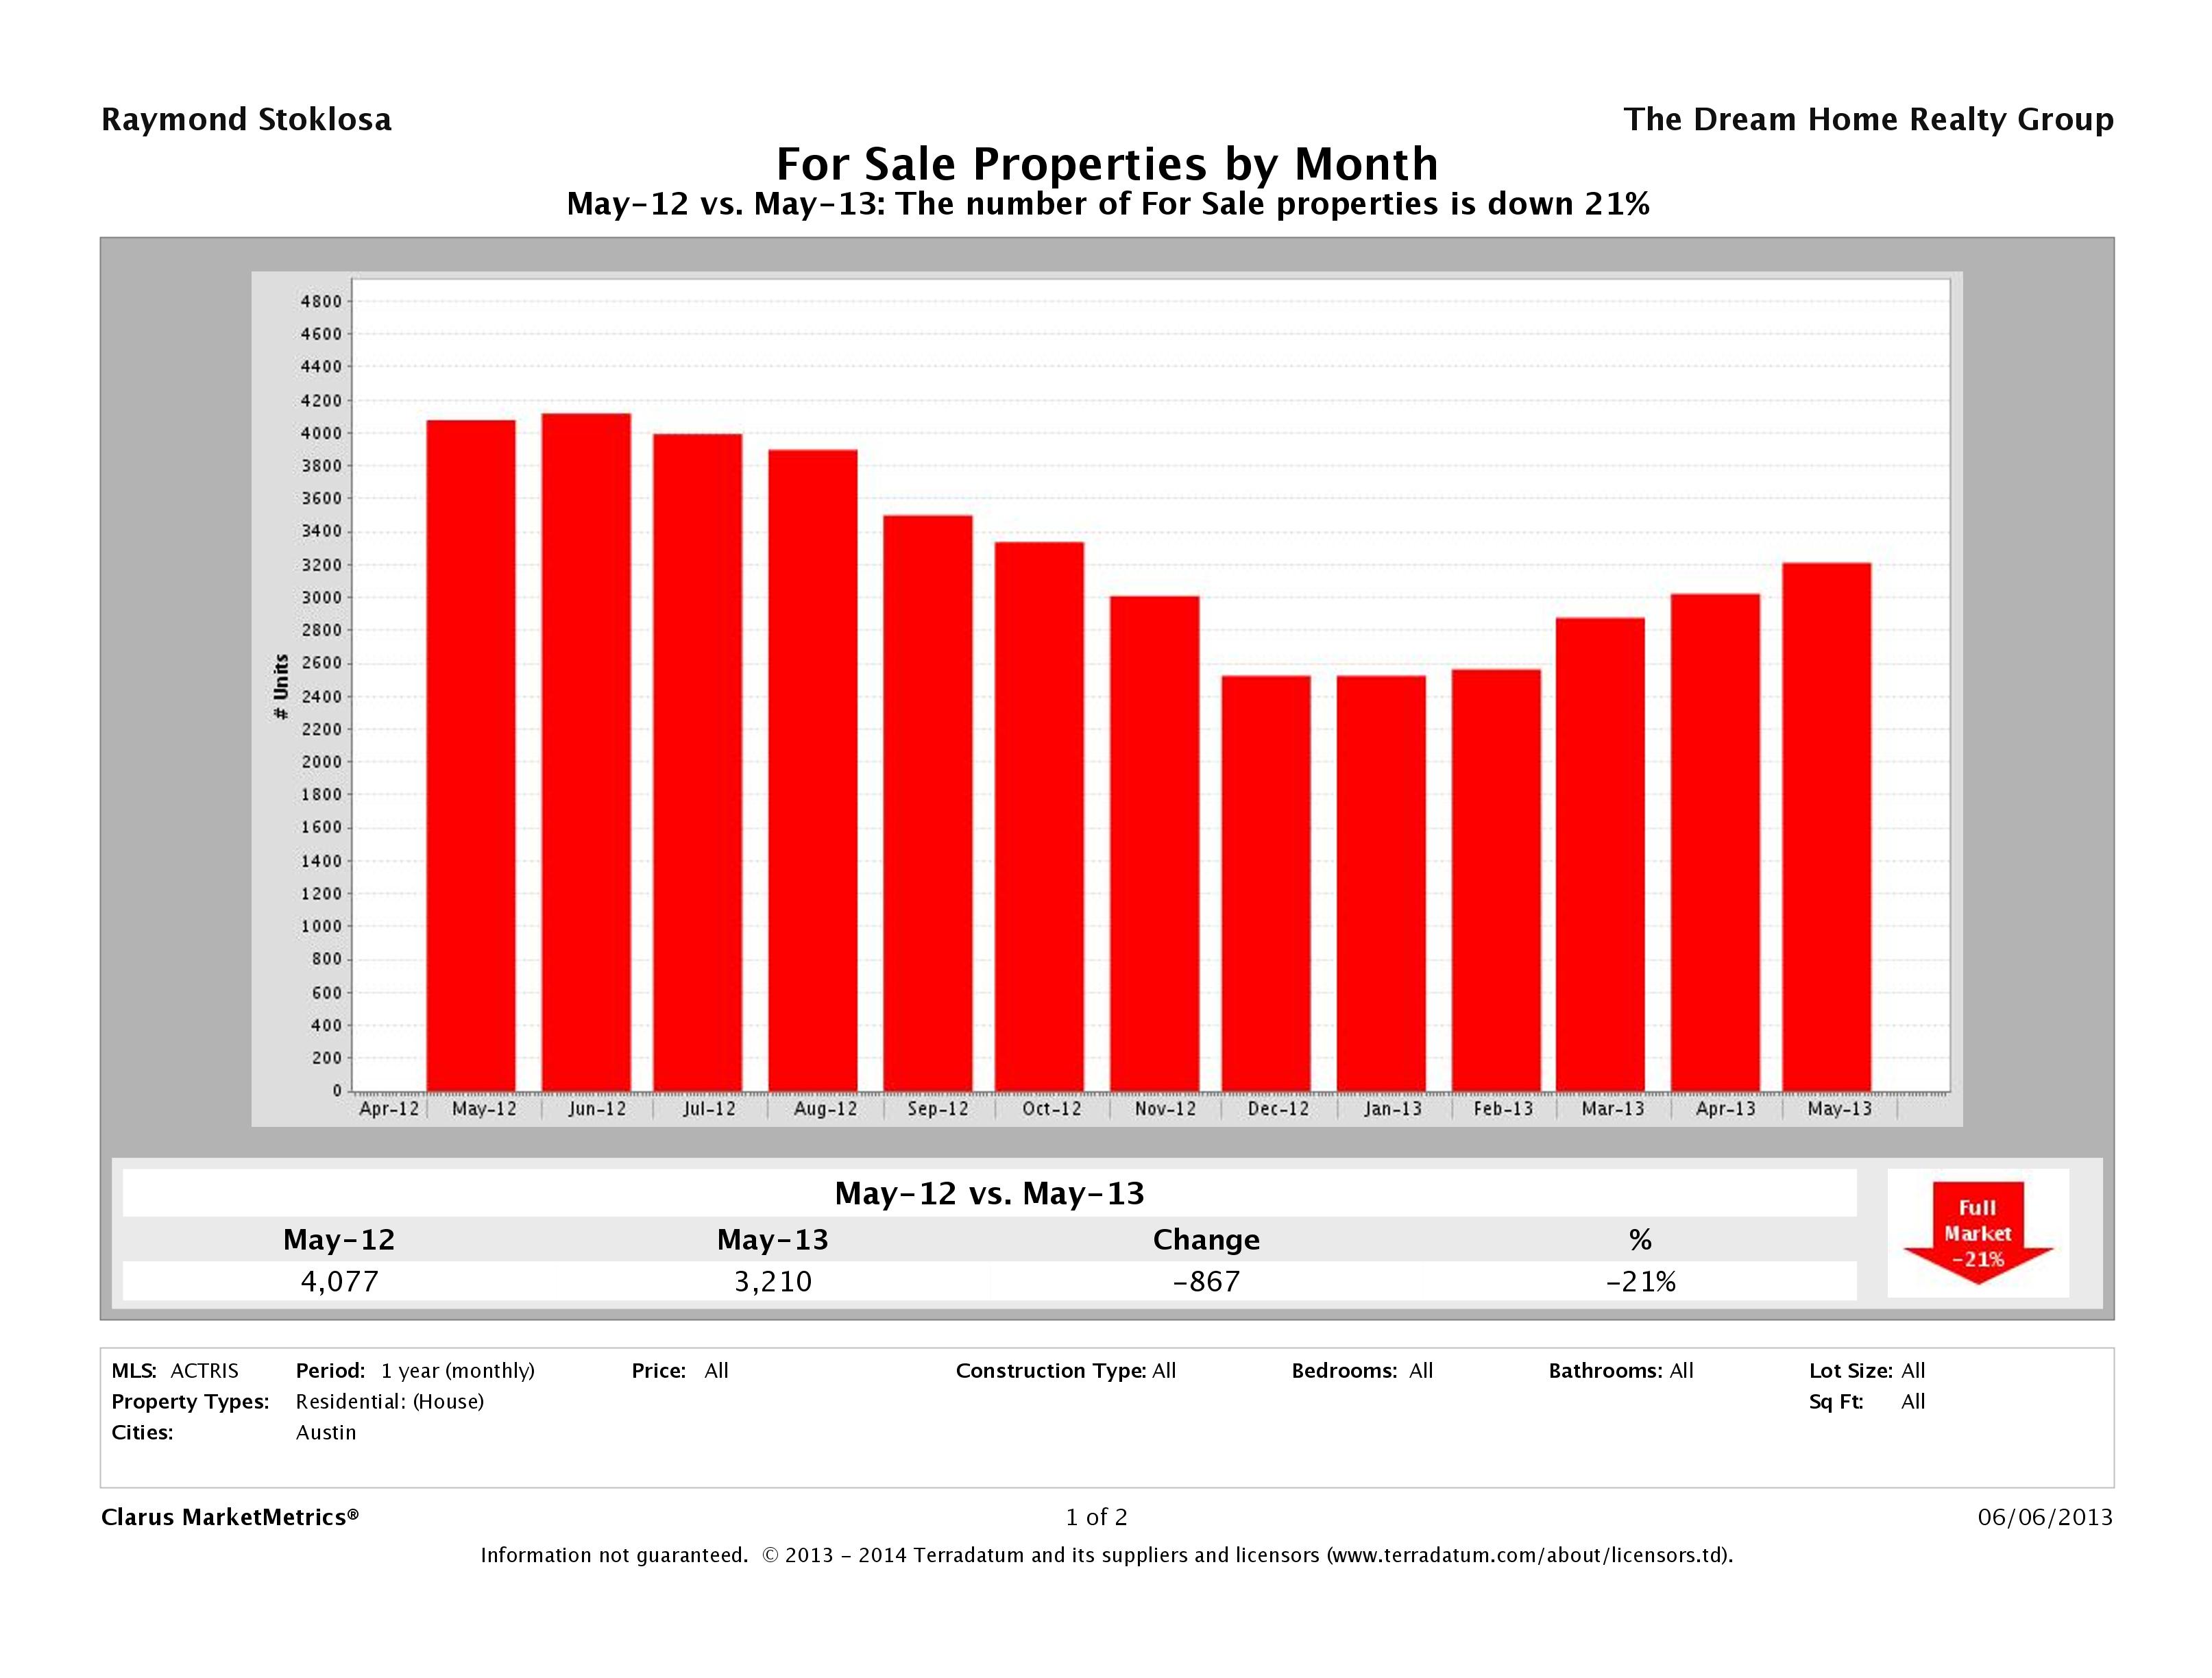
21% Fewer Homes on the Market than May 2012
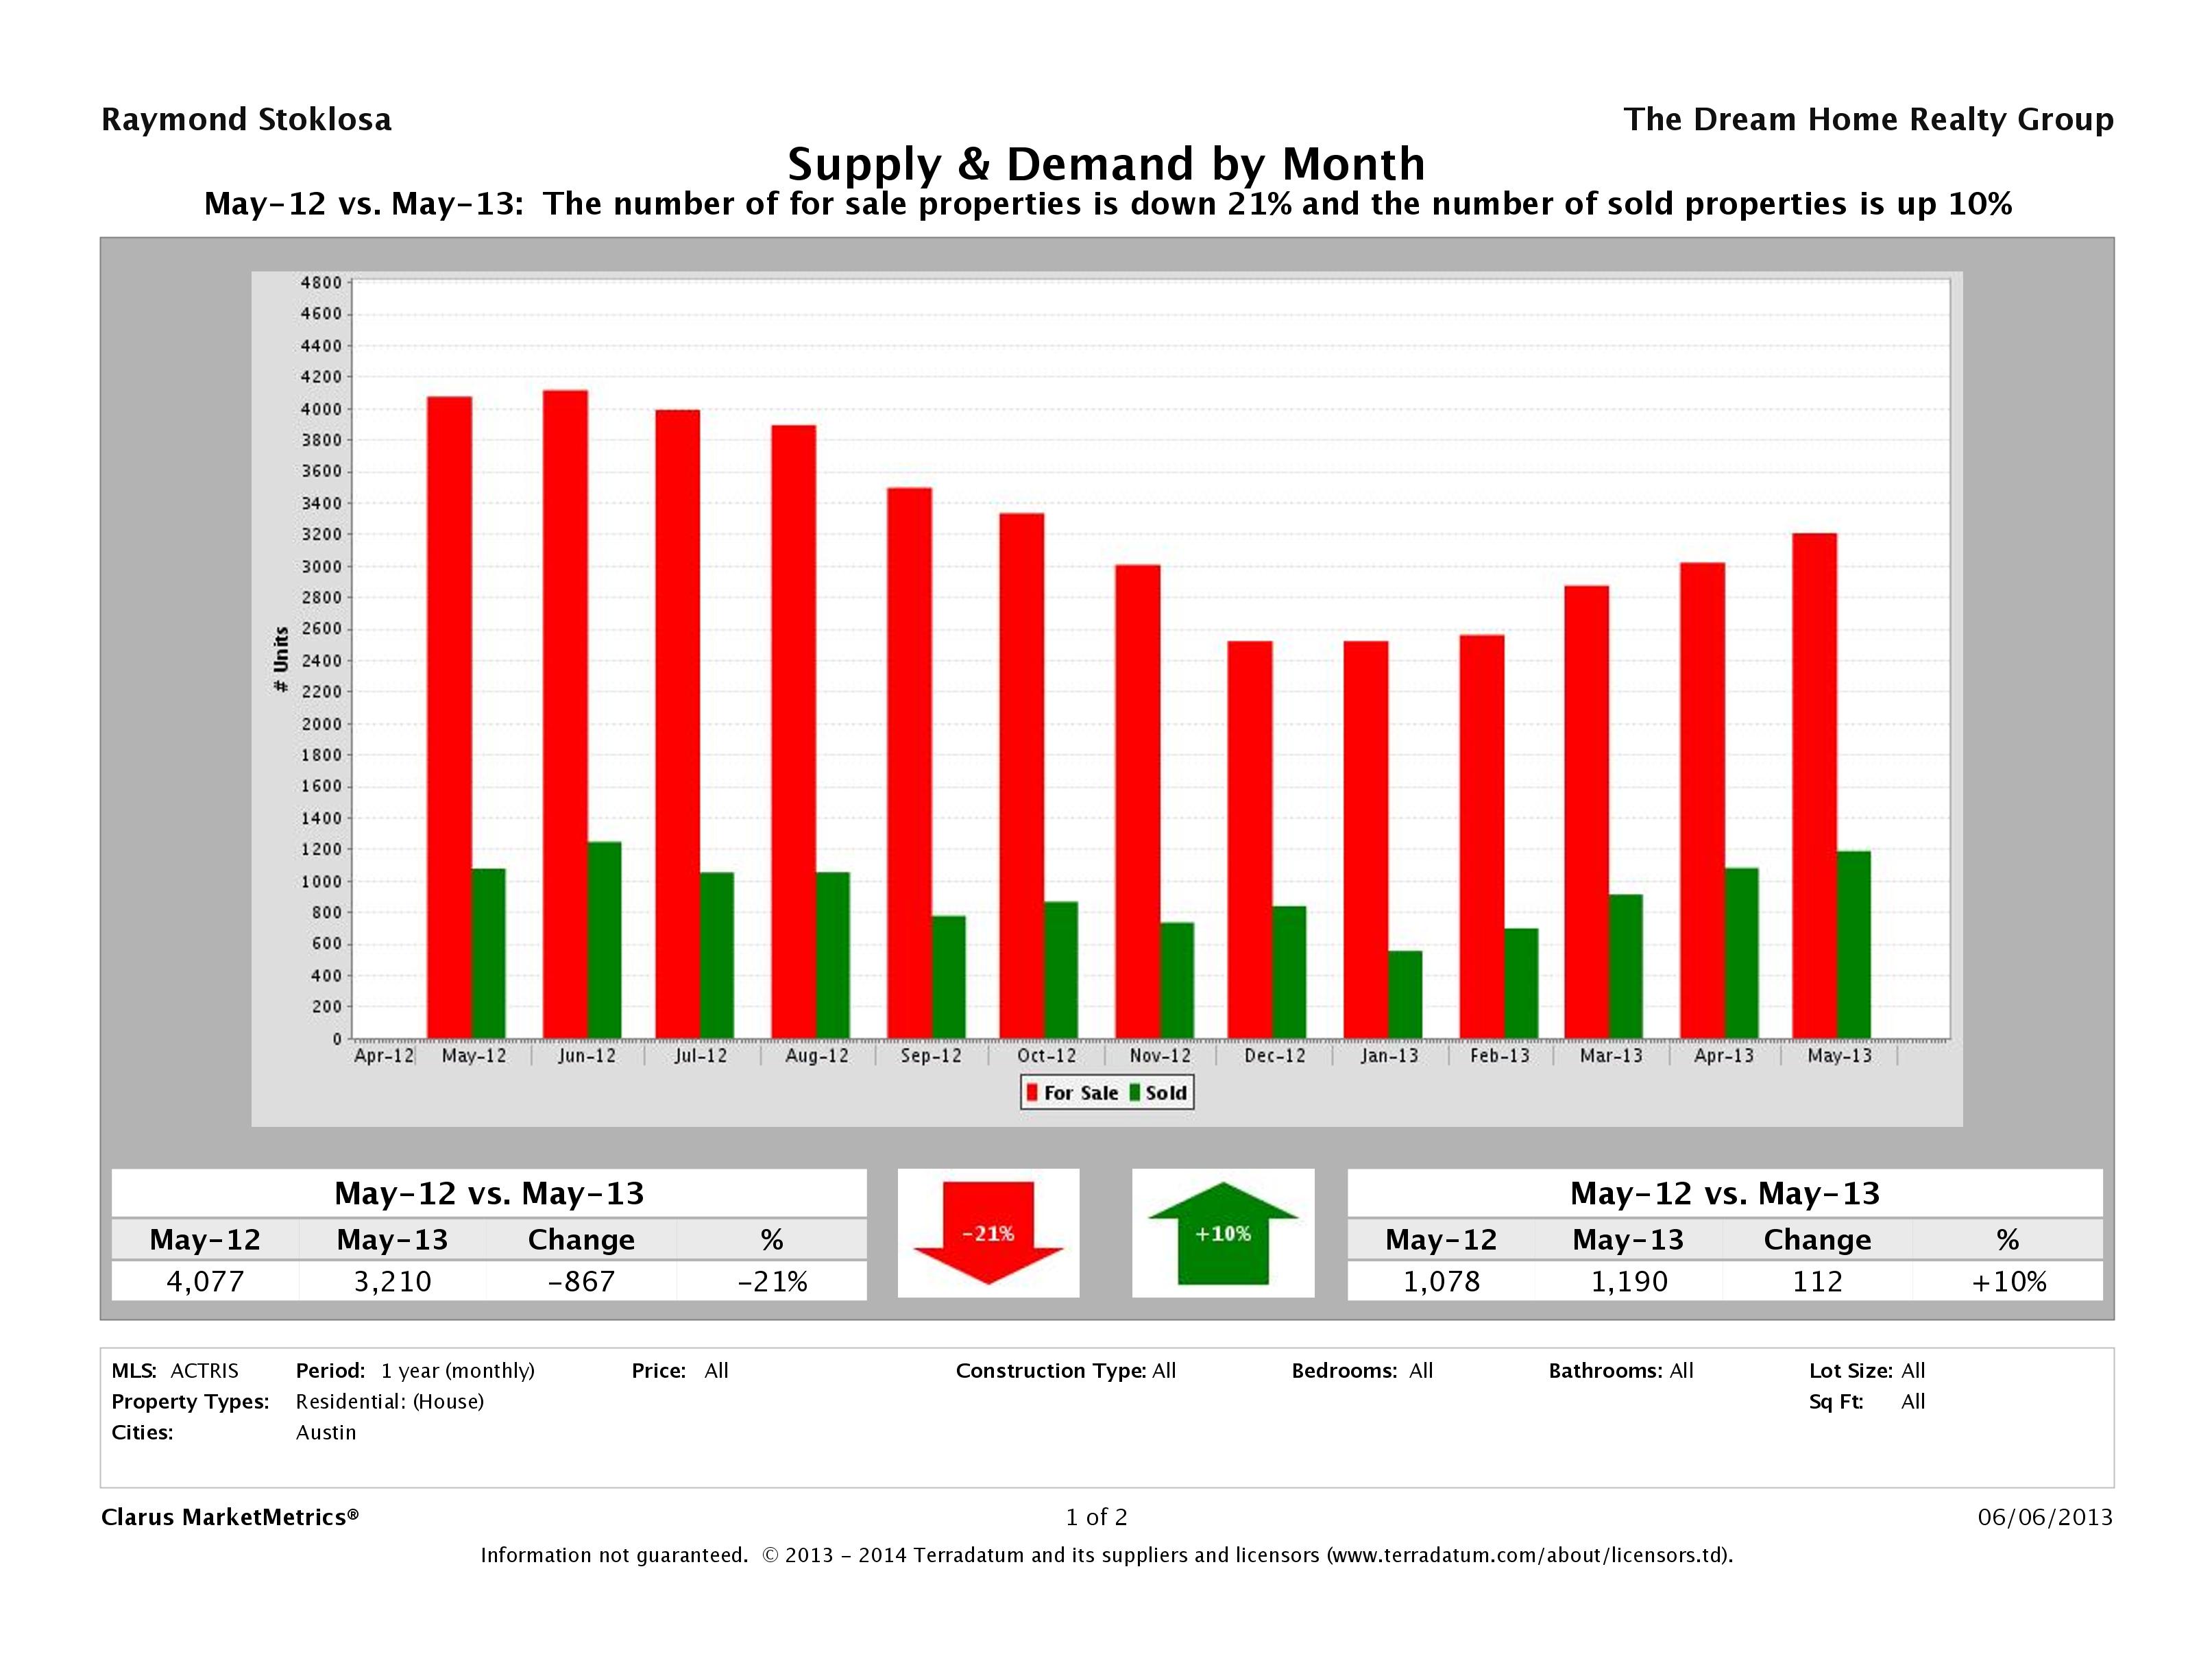
In May 2013, we had 3,210 homes listed for sale in Austin, compared to 4,077 in May 2012. As you can see below in the properties listed for sale numbers (which are up in year over year numbers), we have less properties for sale, but that’s not because we have fewer homes being listed. We actually have 8% more homes being listed than we had last year at this time. This shows us just how many buyers are currently in the market to buy. And, with inventory shrinking each month and new listings rising, it appears as though buyers are either relocating from out of the area or renters, with no local homes to sell.
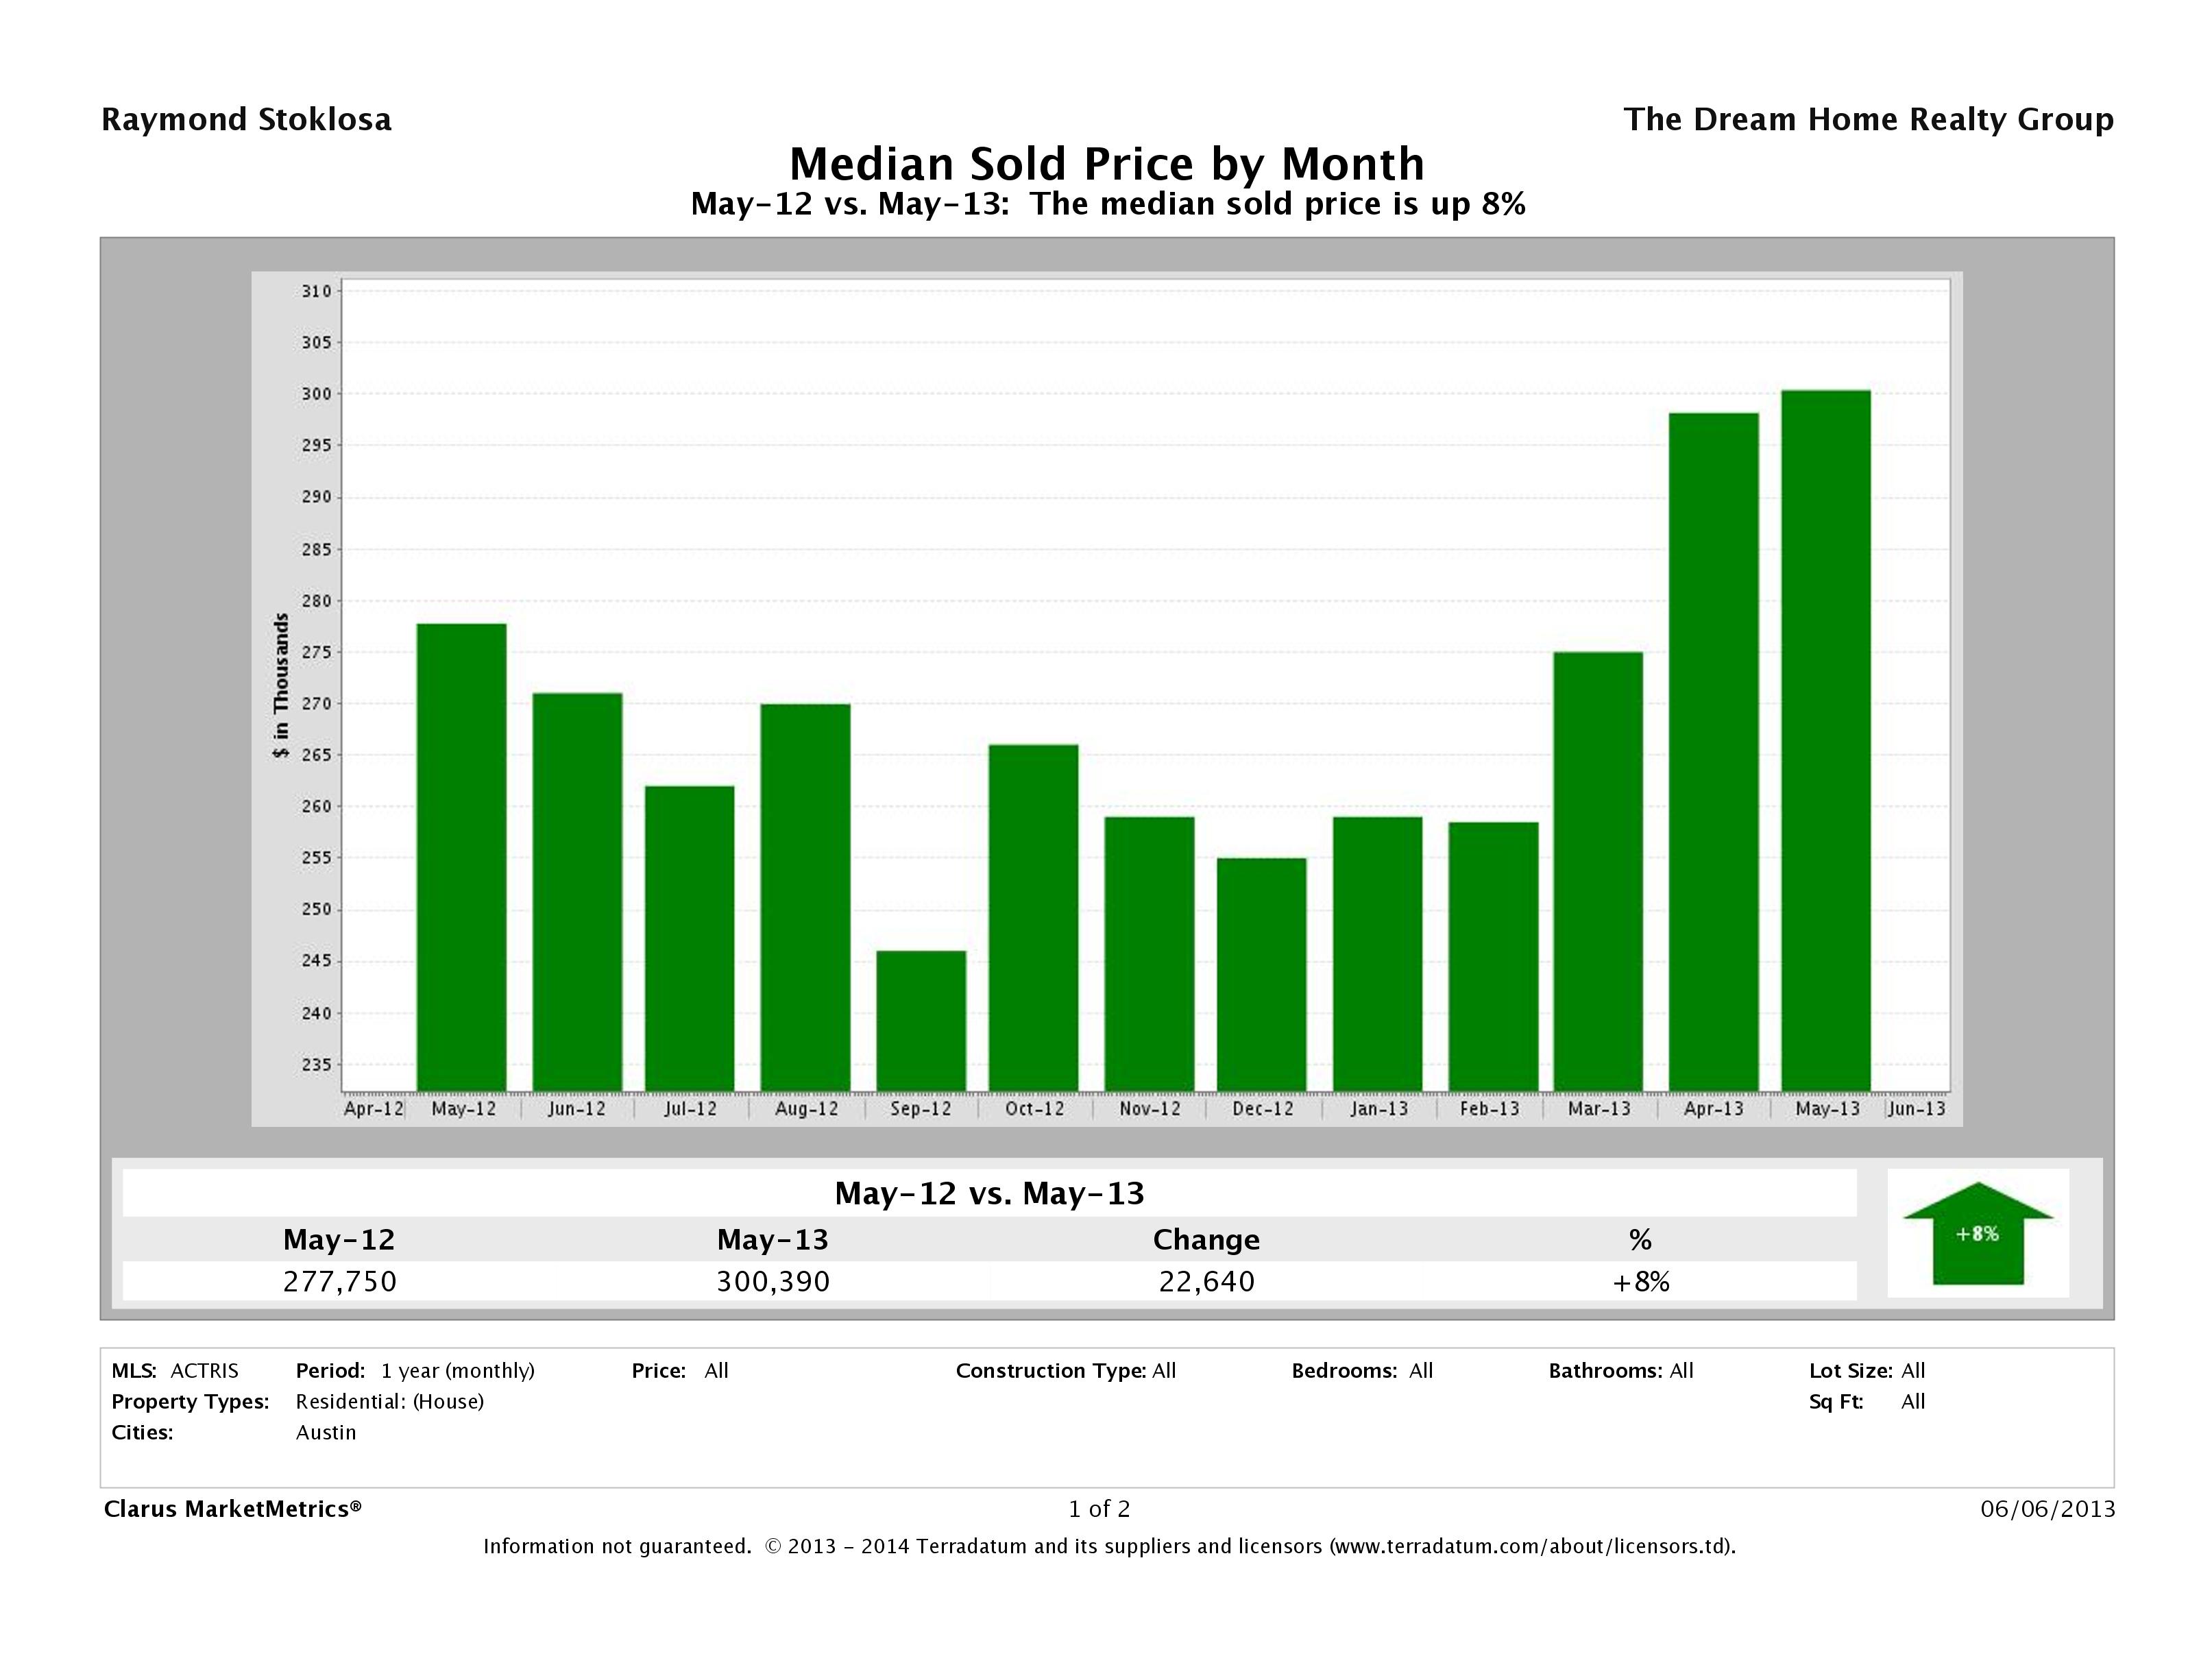
Austin Median Home Price Up 8%
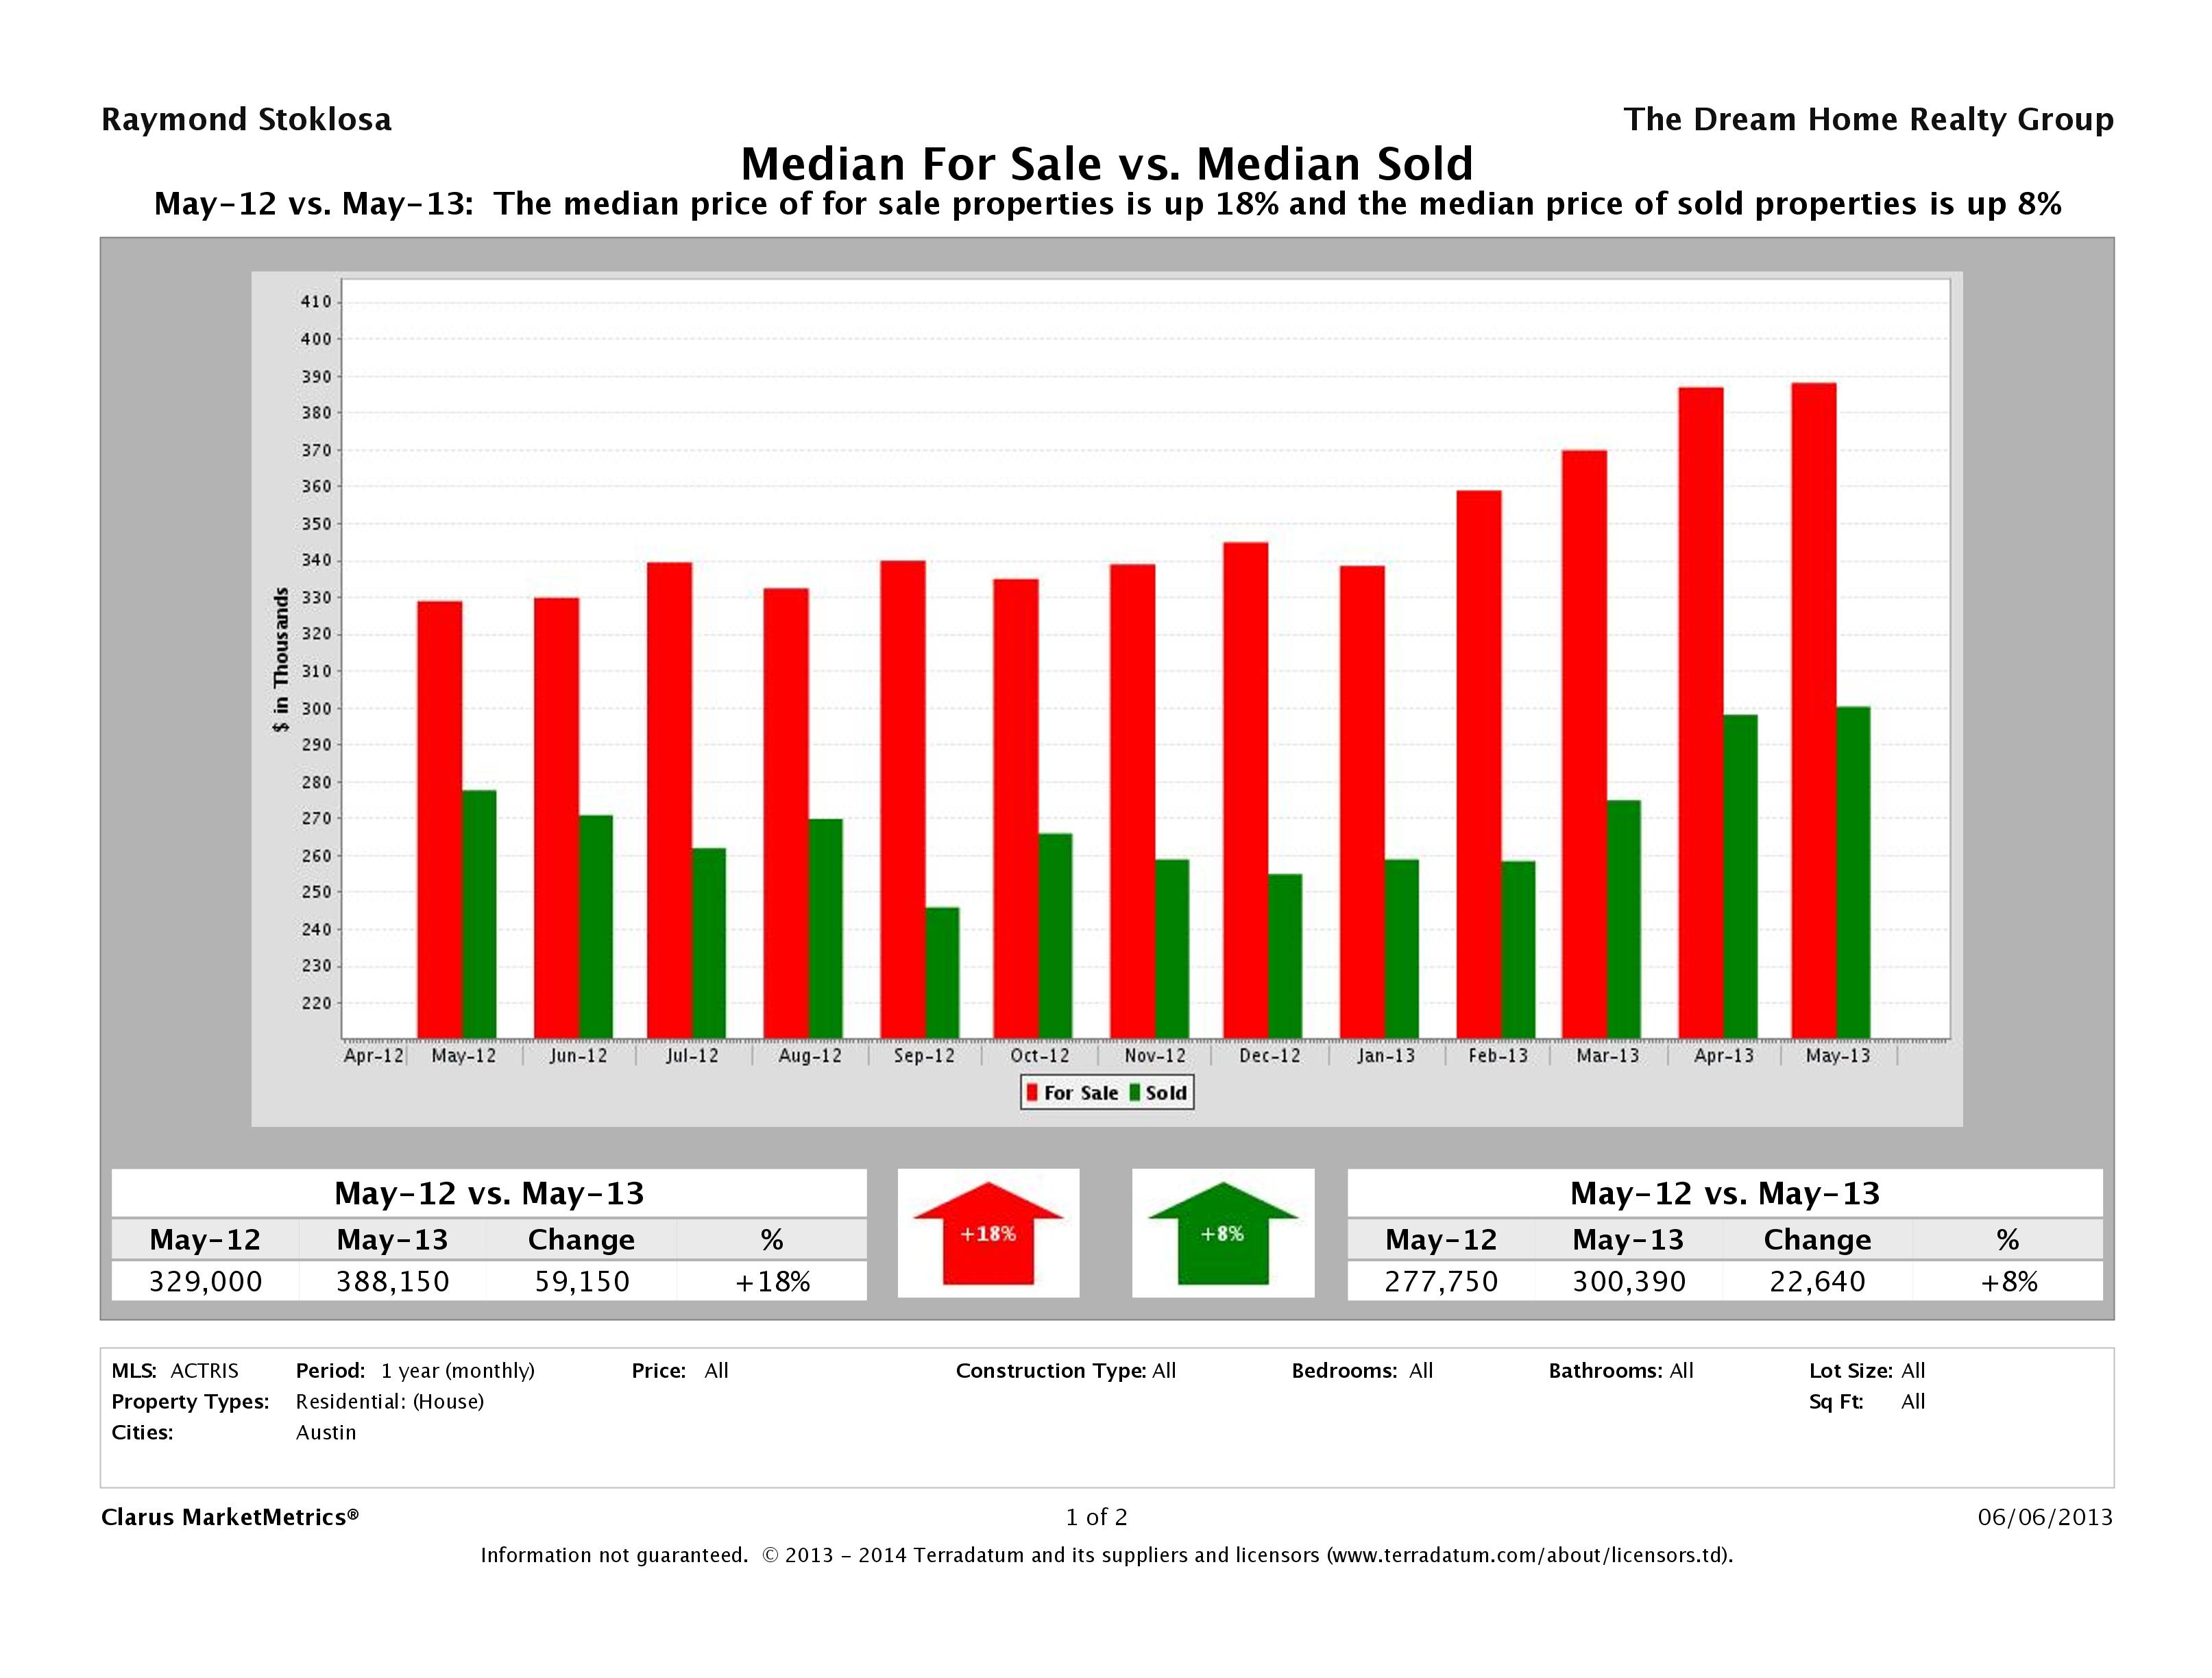
This month, we saw an 8% increase in the median home sale price of a home in Austin. In May 2013, the median home price was $300,390 compared to $277,750 in May 2012. Median home price helps us see the distribution of homes being sold and does not really give us an indication of the increase or decrease in a particular home’s market value. To analyze market value, we’d have to take an in depth look at a neighborhood. If you’re looking for something like that, please check out our Austin Neighborhood Market Reports.
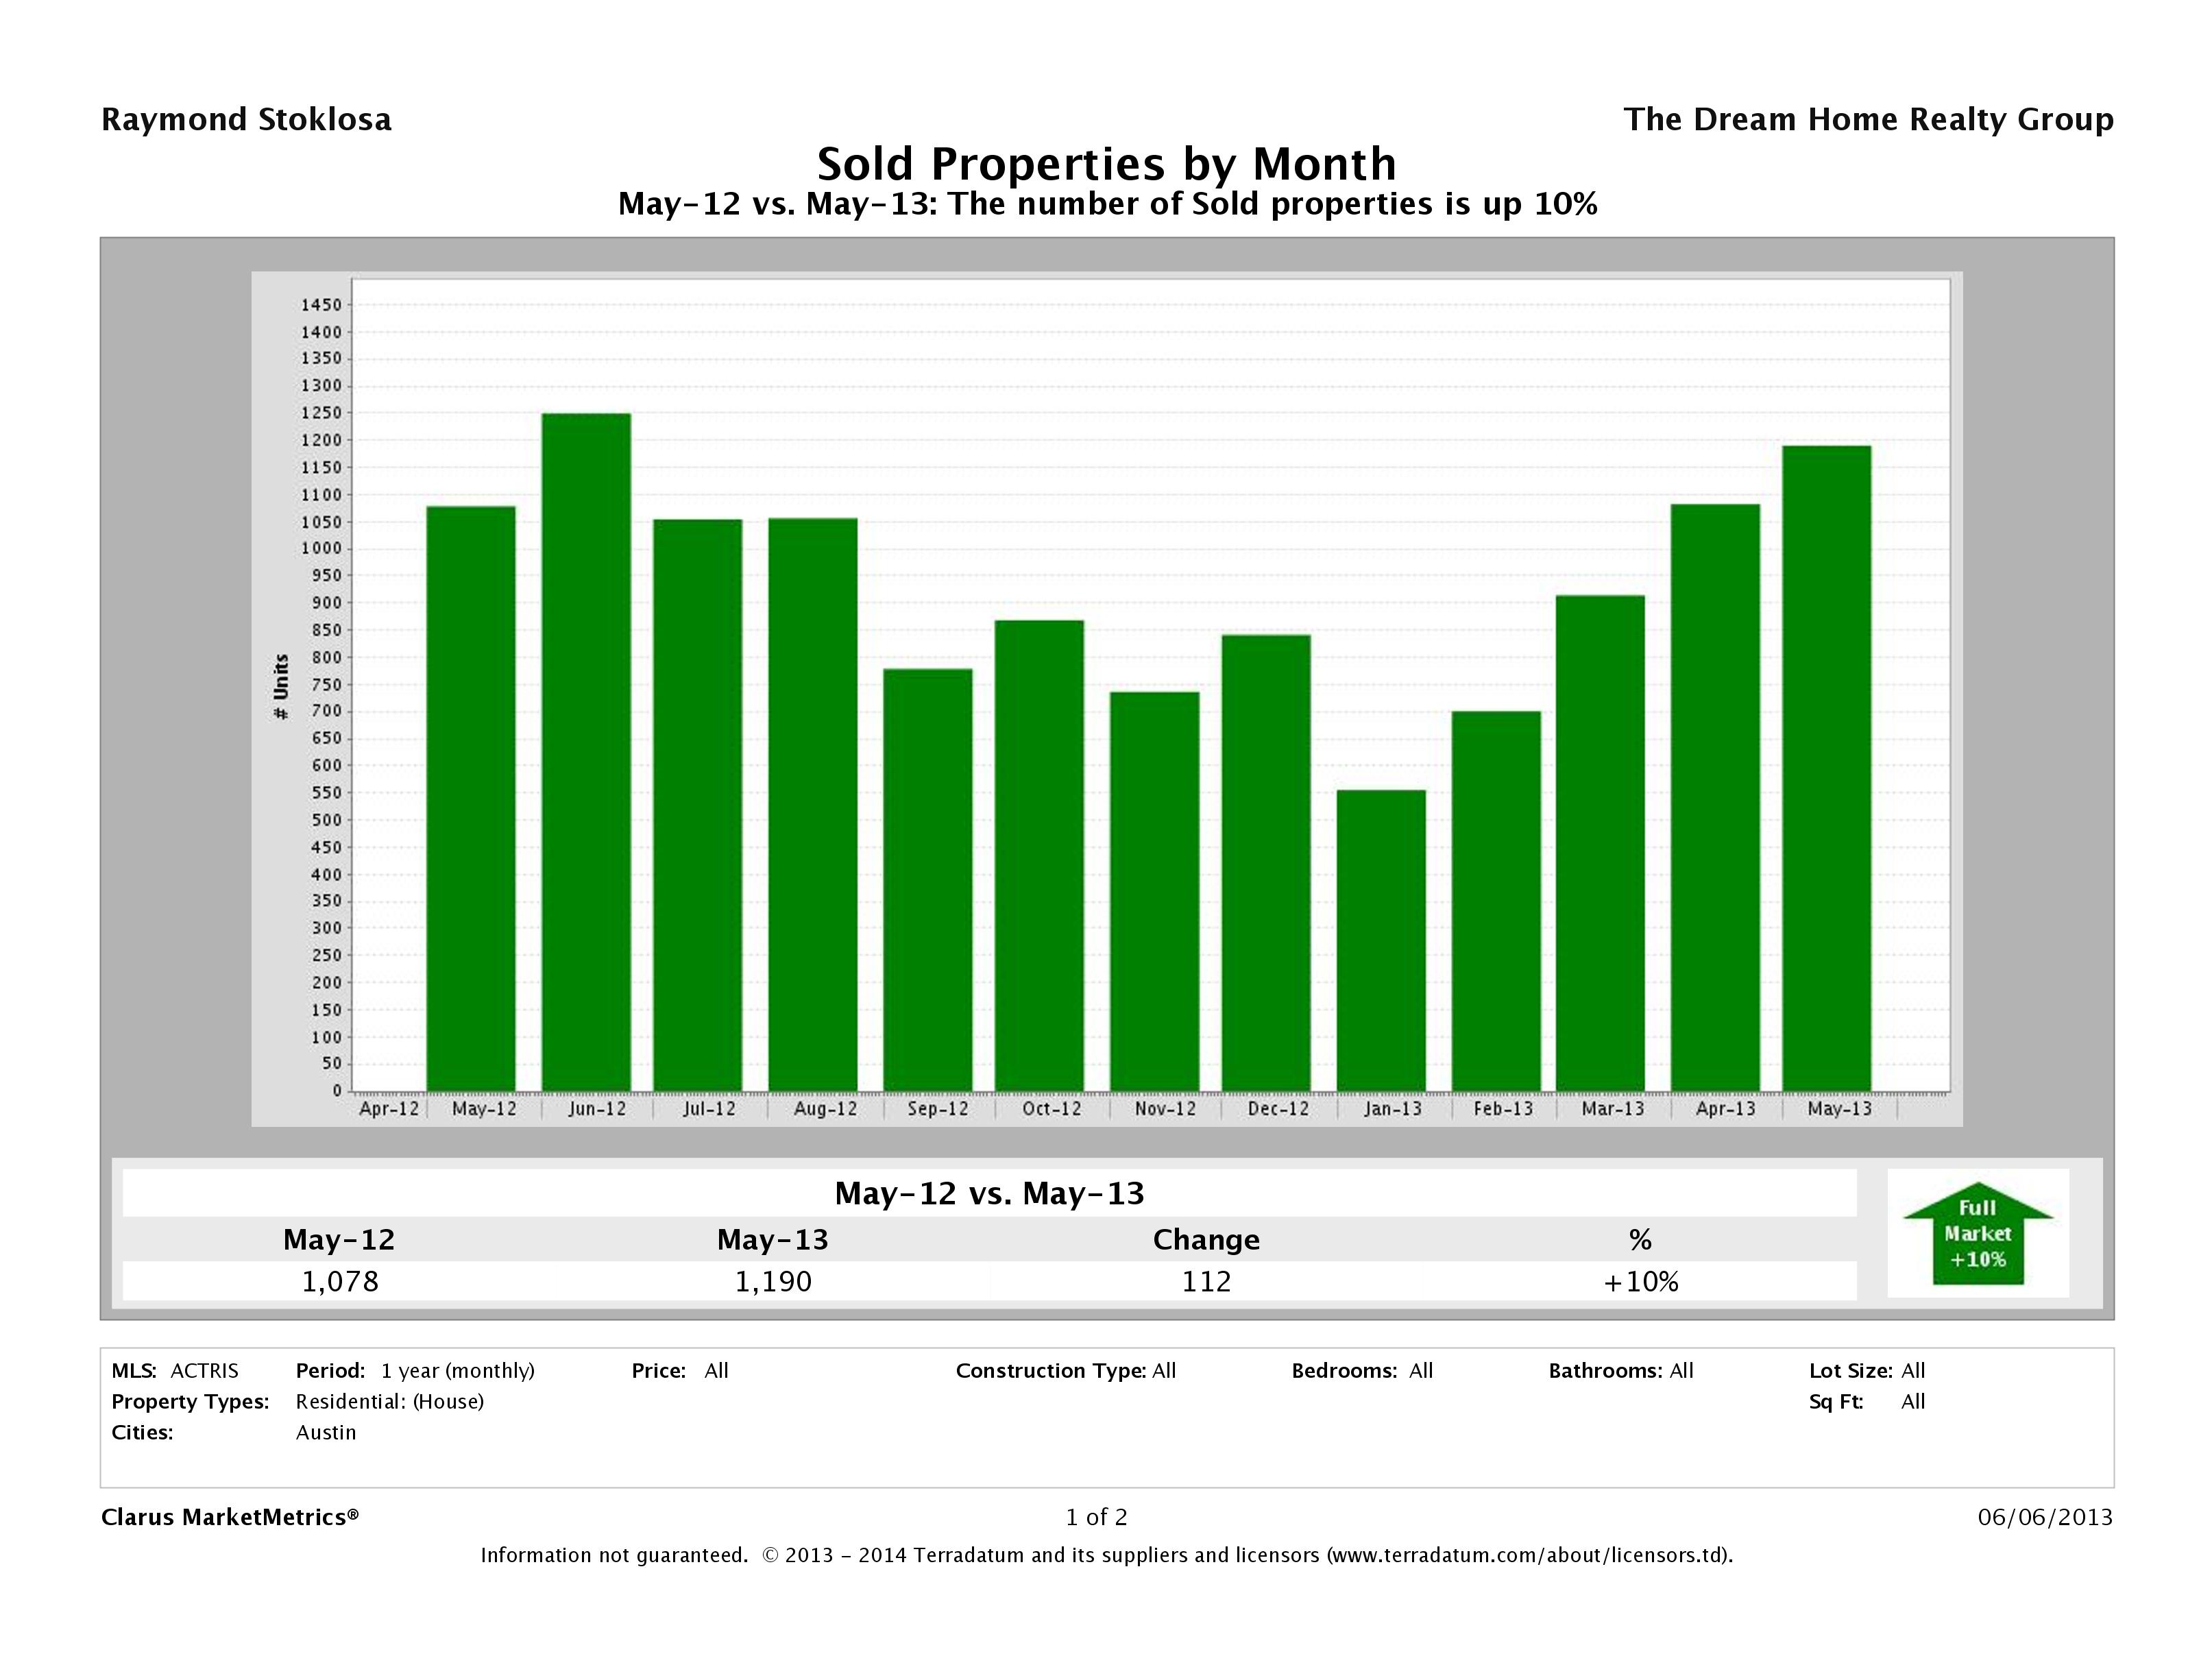
Number of Sold Homes in Austin Up 10%
In May 2013, Austin saw a 10% increase in the number of homes sold from May 2012 to May 2013 numbers. In May 2013, we saw 1,190 homes sell in Austin compared to 1,078 in May 2012. Last Spring showed strong numbers, but this Spring continues to outpace last year’s market in record numbers. It will be interesting to see what this Summer brings.
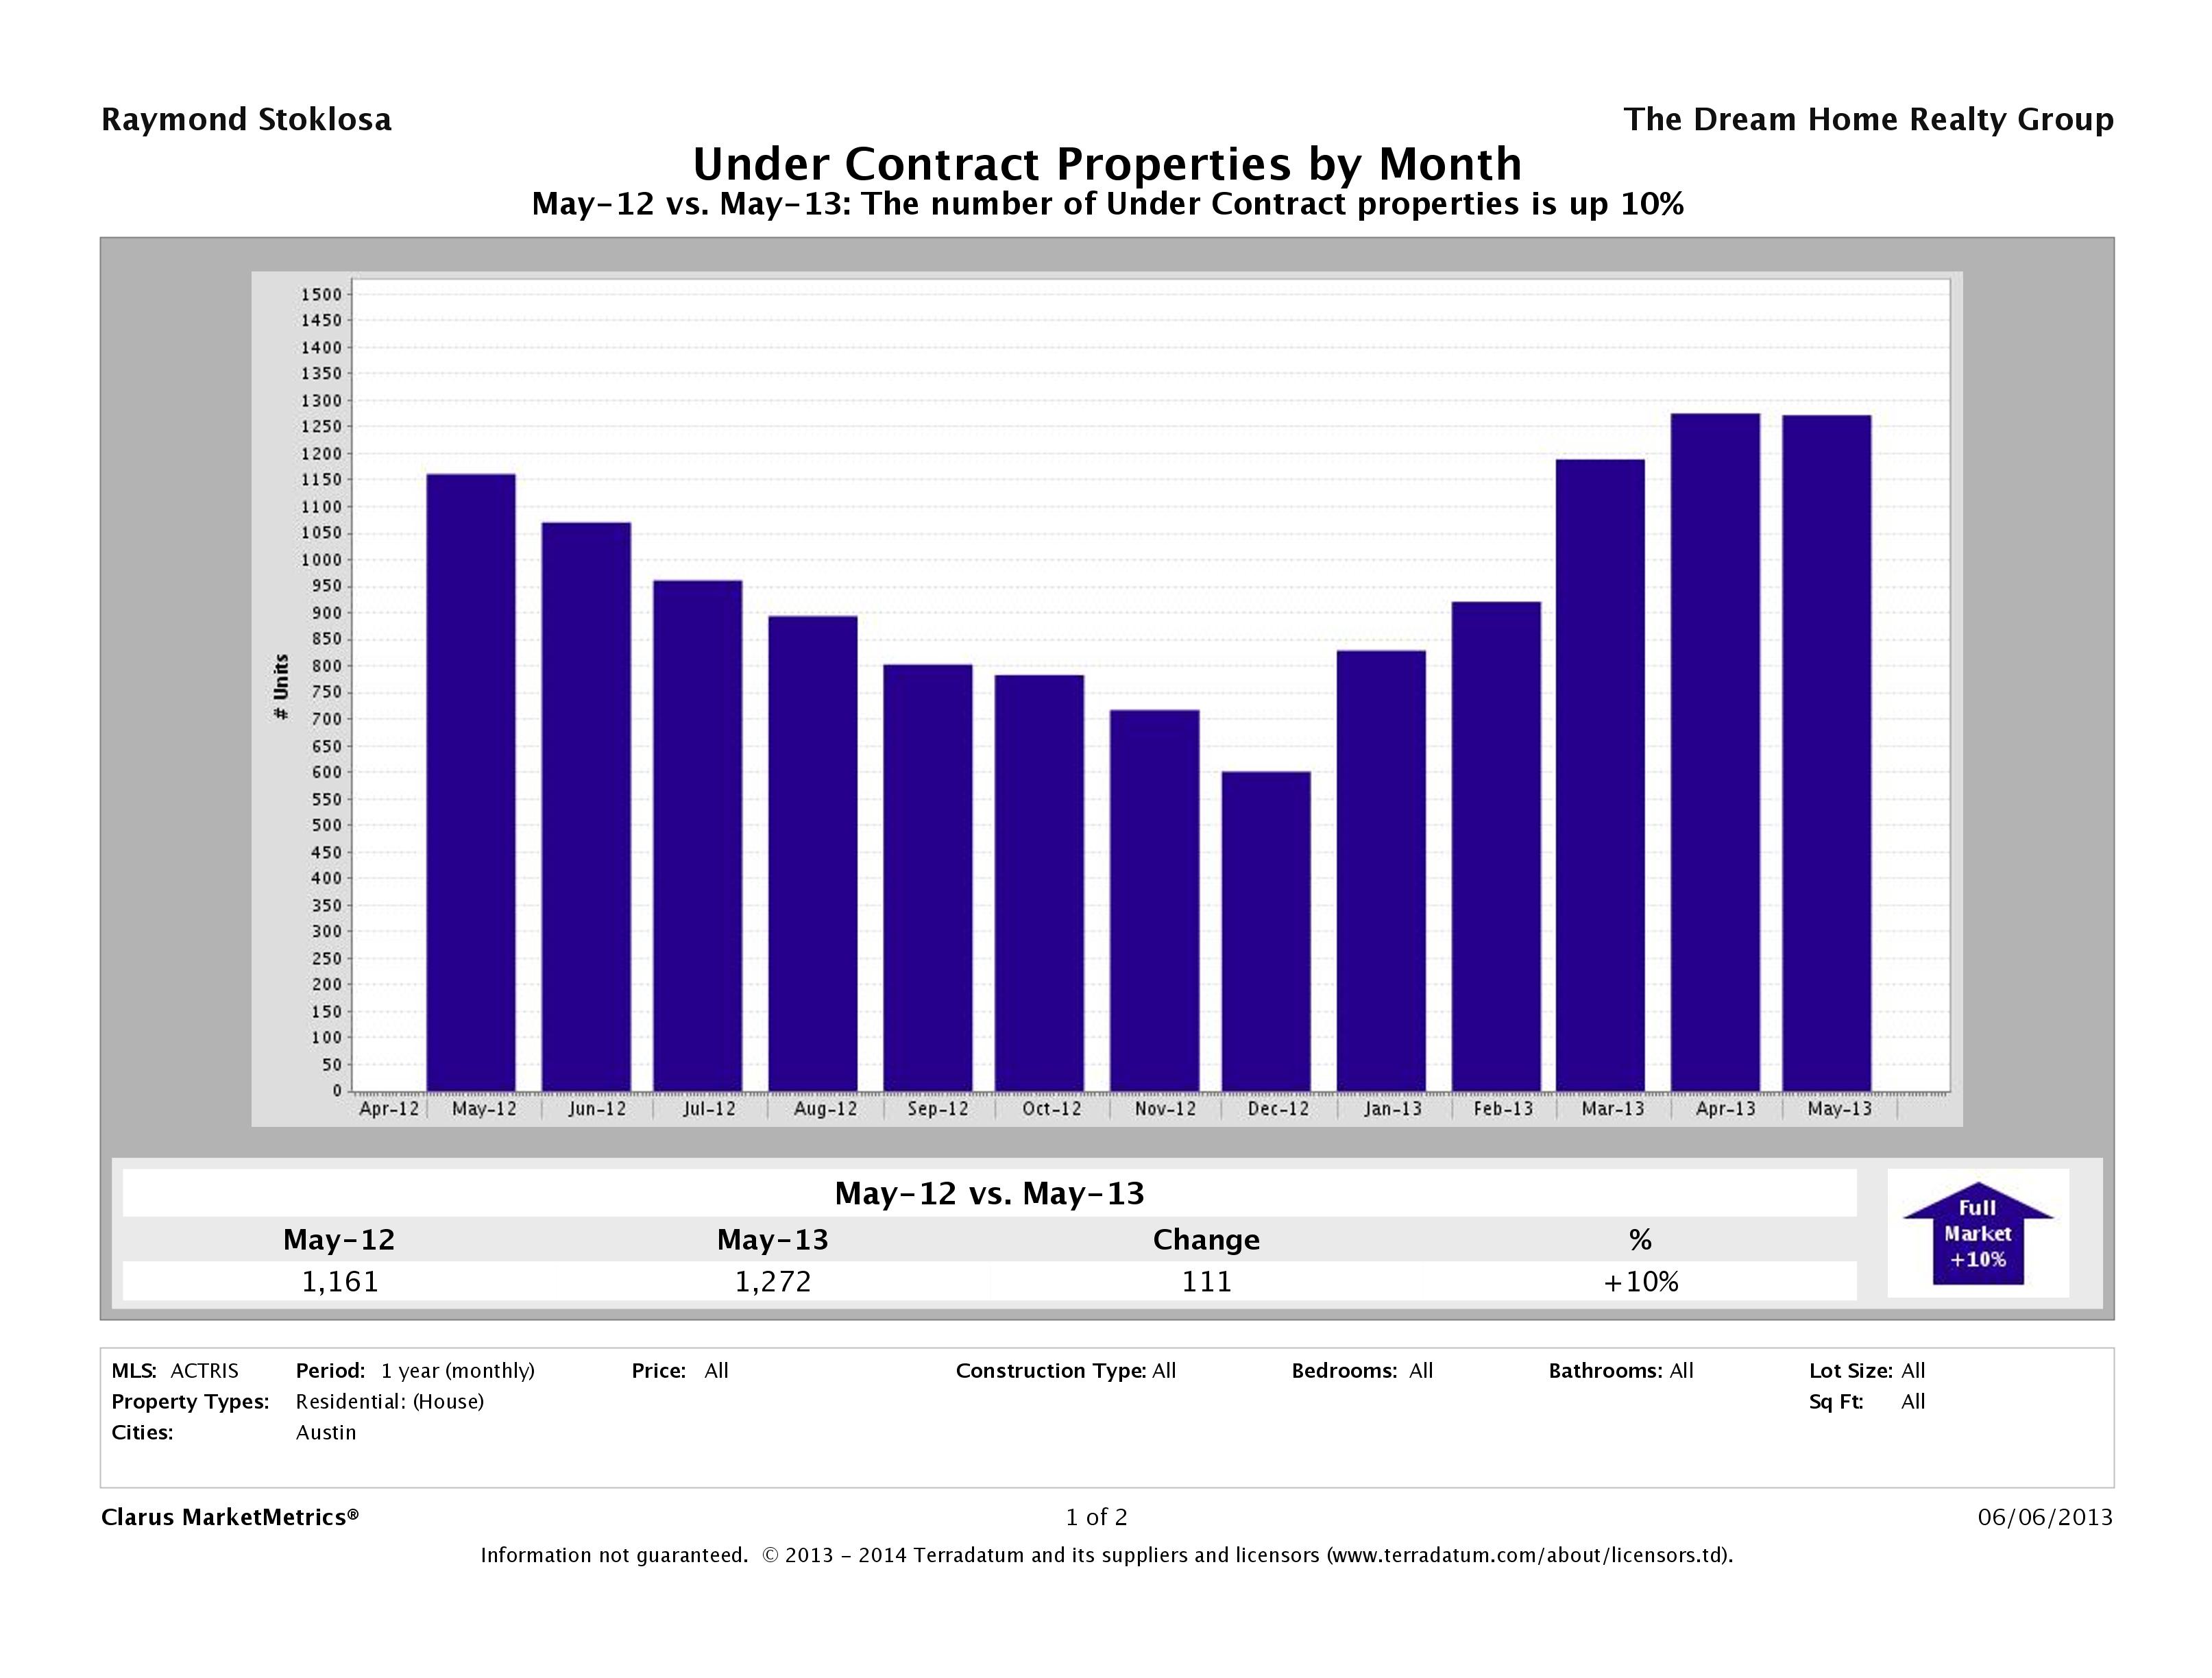
10% More Austin Homes Under Contract
In May 2013, there were 1,272 homes that went pending compared to 1,161 in May 2012 marking a 10% increase. 2013 has started out strong and continues to bring multiple offers to the most desirable properties. It seems there are still plenty of buyers in the market to support more sales.
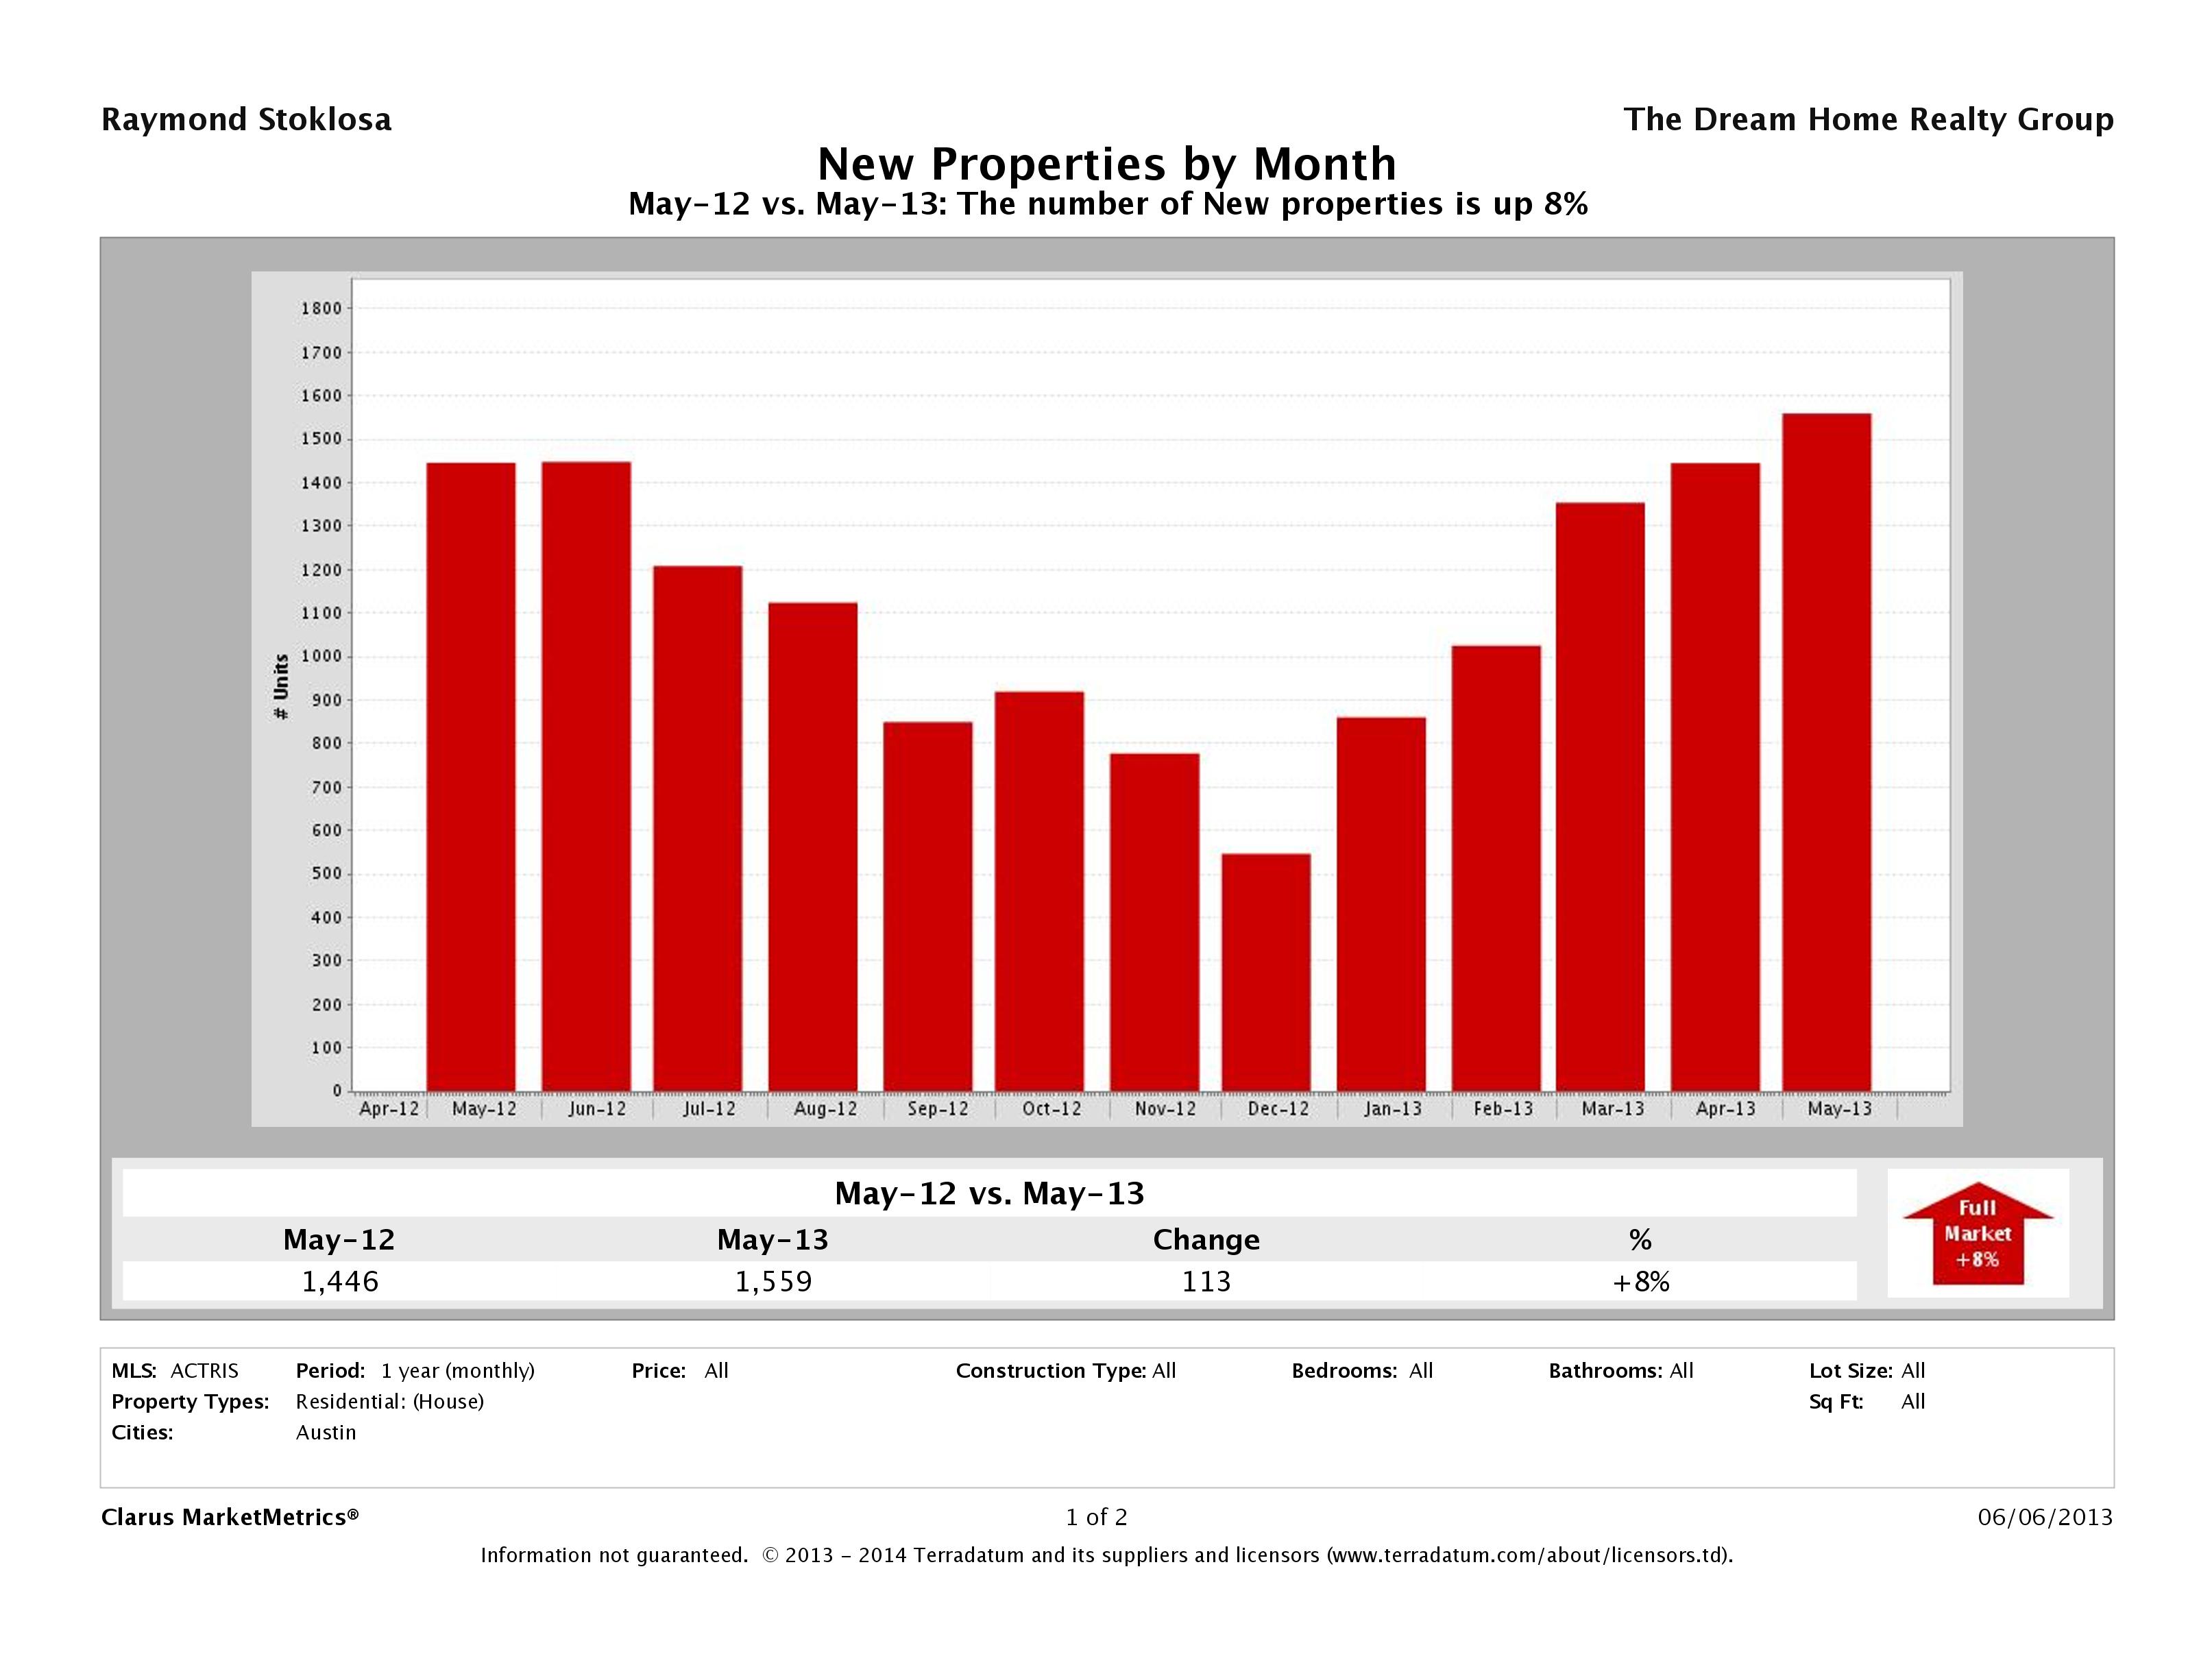
Number of Homes Listed for Sale Up 8%
In May 2013, we saw an 8% increase in the number of homes being introduced to the market than in May 2012. In May 2013, there were 1,559 homes listed for sale in Austin compared to 1,446 in May 2012. This is another indicator of just how many buyers are out there. With only a slight increase in the number of homes that are being listed for sale, we saw a remarkable increase in the number of homes sold meaning even the less desirable homes are selling. If you need to sell, strike while the iron is hot. Buyers are competitive and are out in full force. With prices going up, buyers are settling for a smaller home or a more expensive home than they would in a weaker market. Take advantage of market conditions to get the highest possible price for your home.
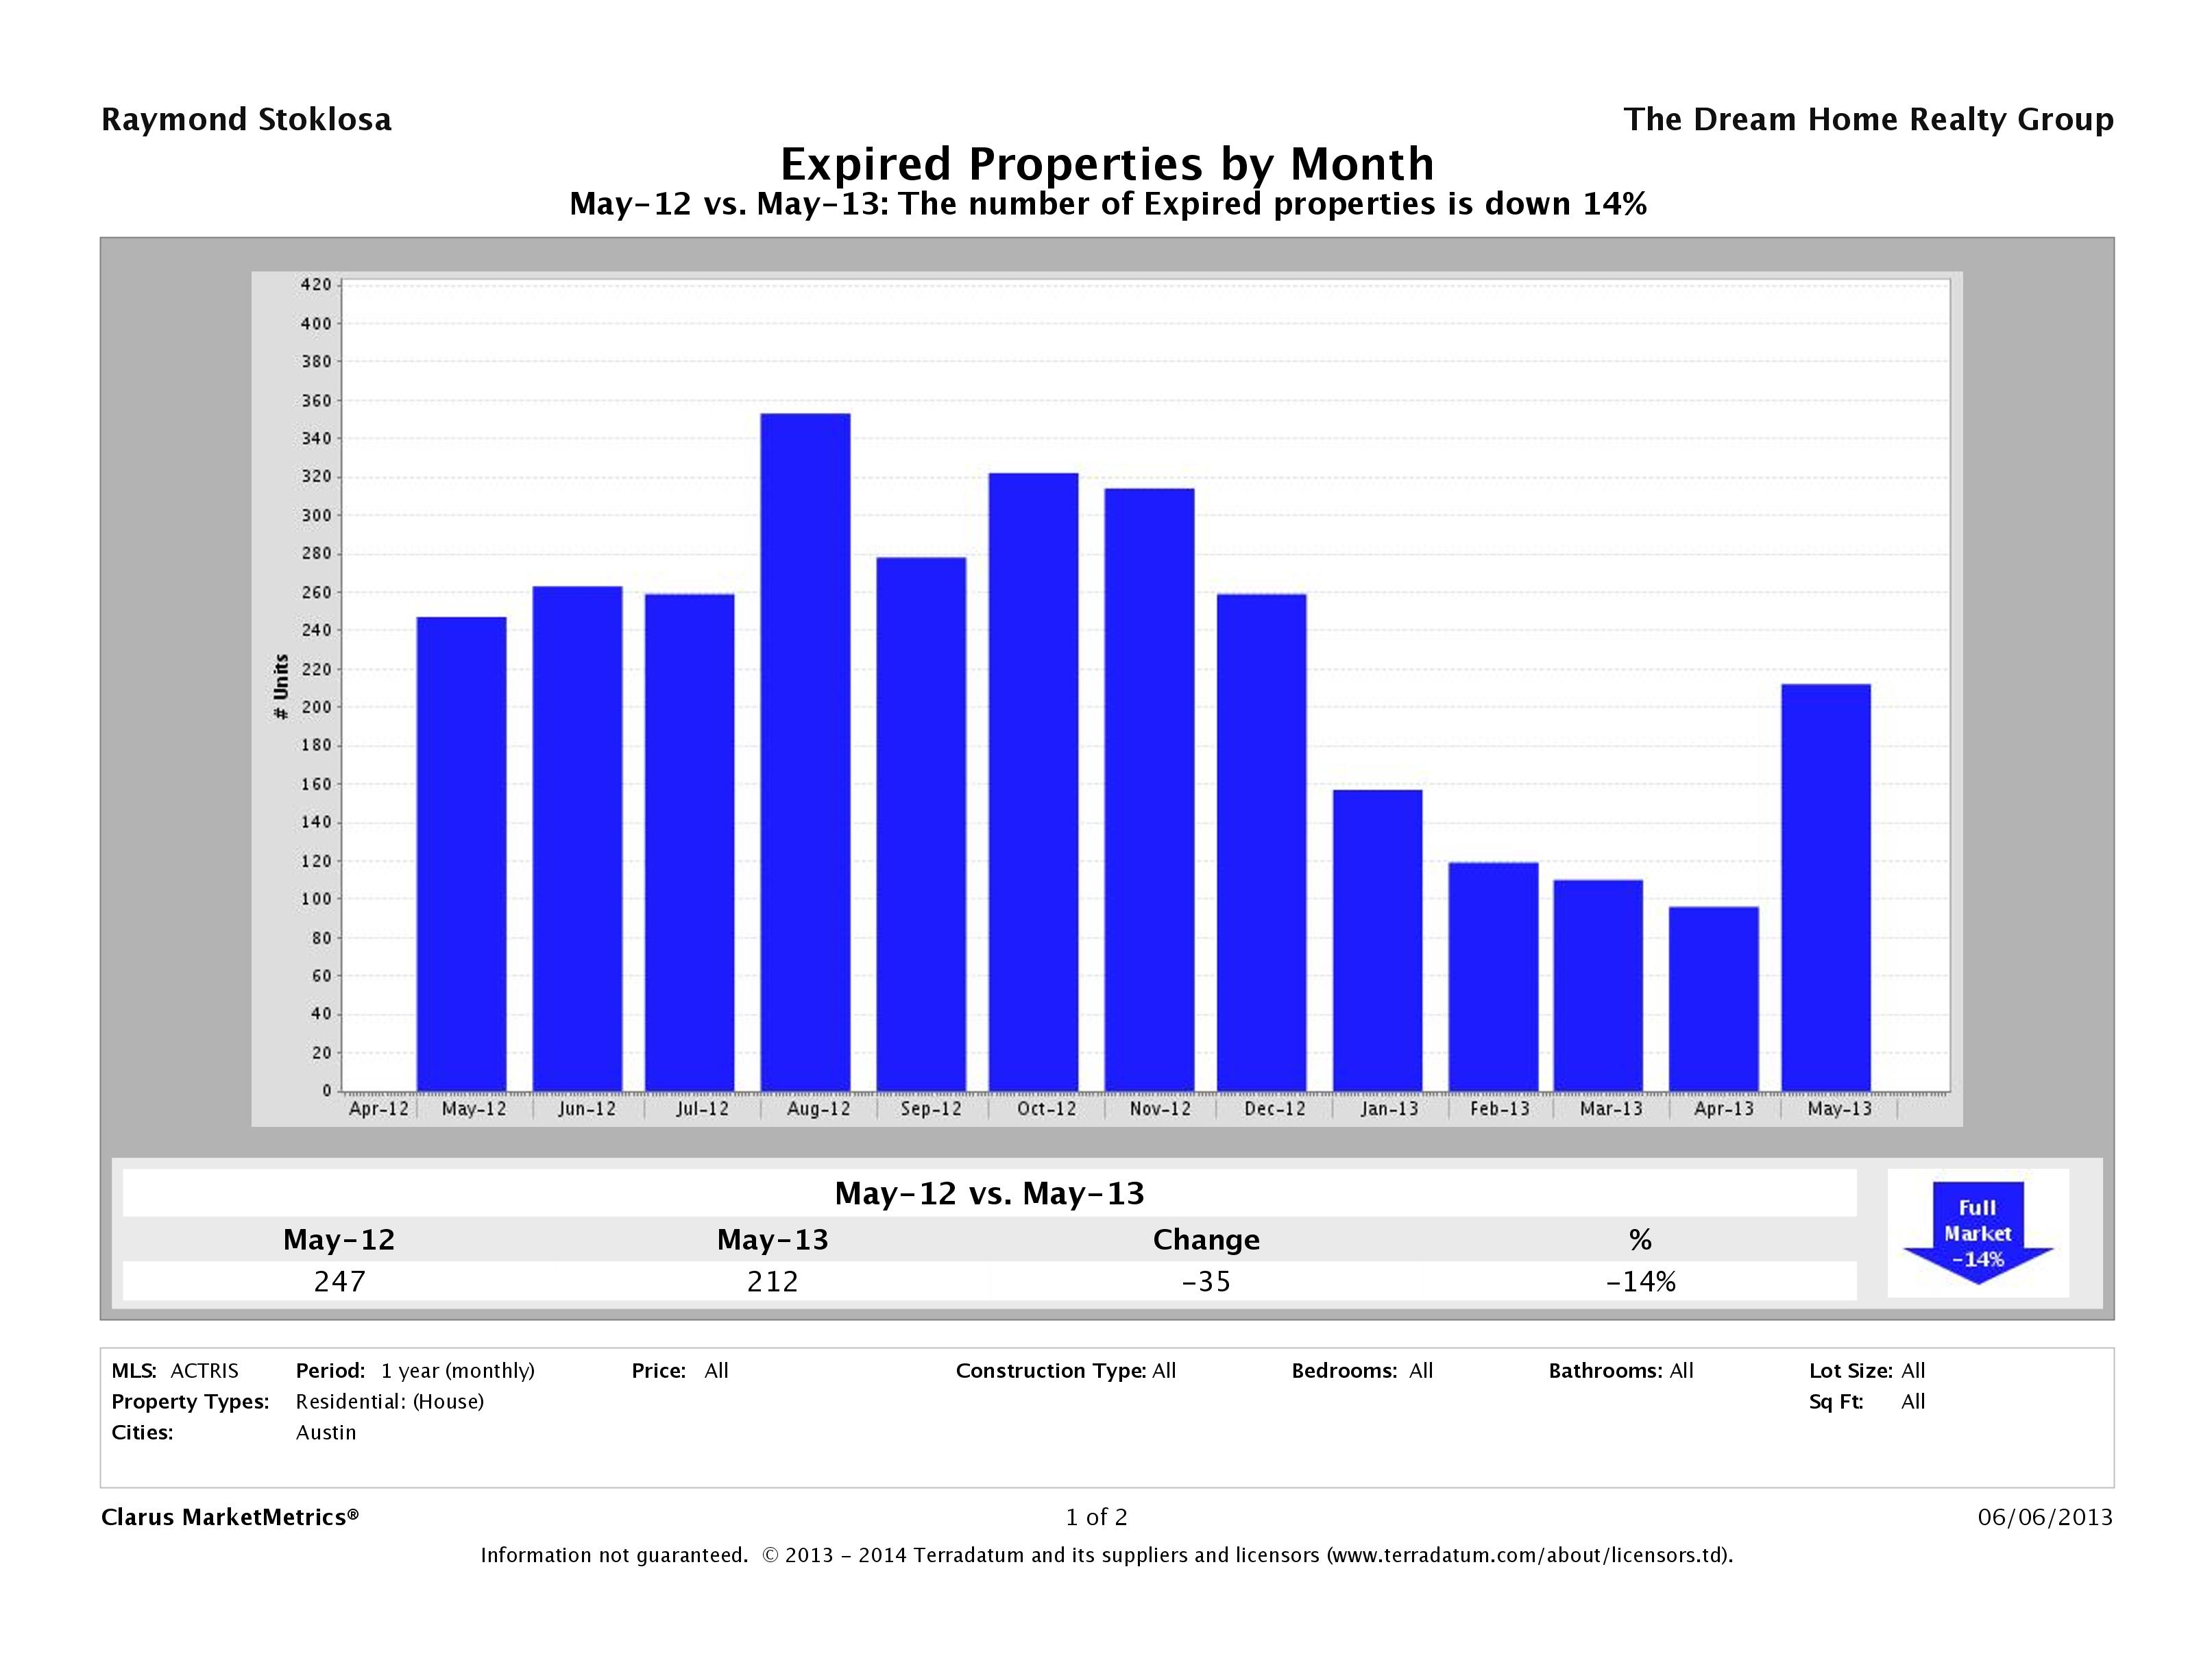
Number of Homes Taken Off the Market Down 14%
Almost twice as many homes were taken off the market (expired) in May 2013 compared to April 2013, which is likely a result of the time of year. Sometimes unsuccessful sellers take their homes off the market in the Summer to accomodate vacations and kids being home from school. In May 2012, 247 homes were taken off the market and in May 2013, 212 were taken off the market. Though more homes were taken off the market this month than last month, we still saw a 14% decrease in year over year numbers, which is another indicator of hte strength of the market.
Did your home expire? Check out our Austin Home Not Selling resources page to find out why.
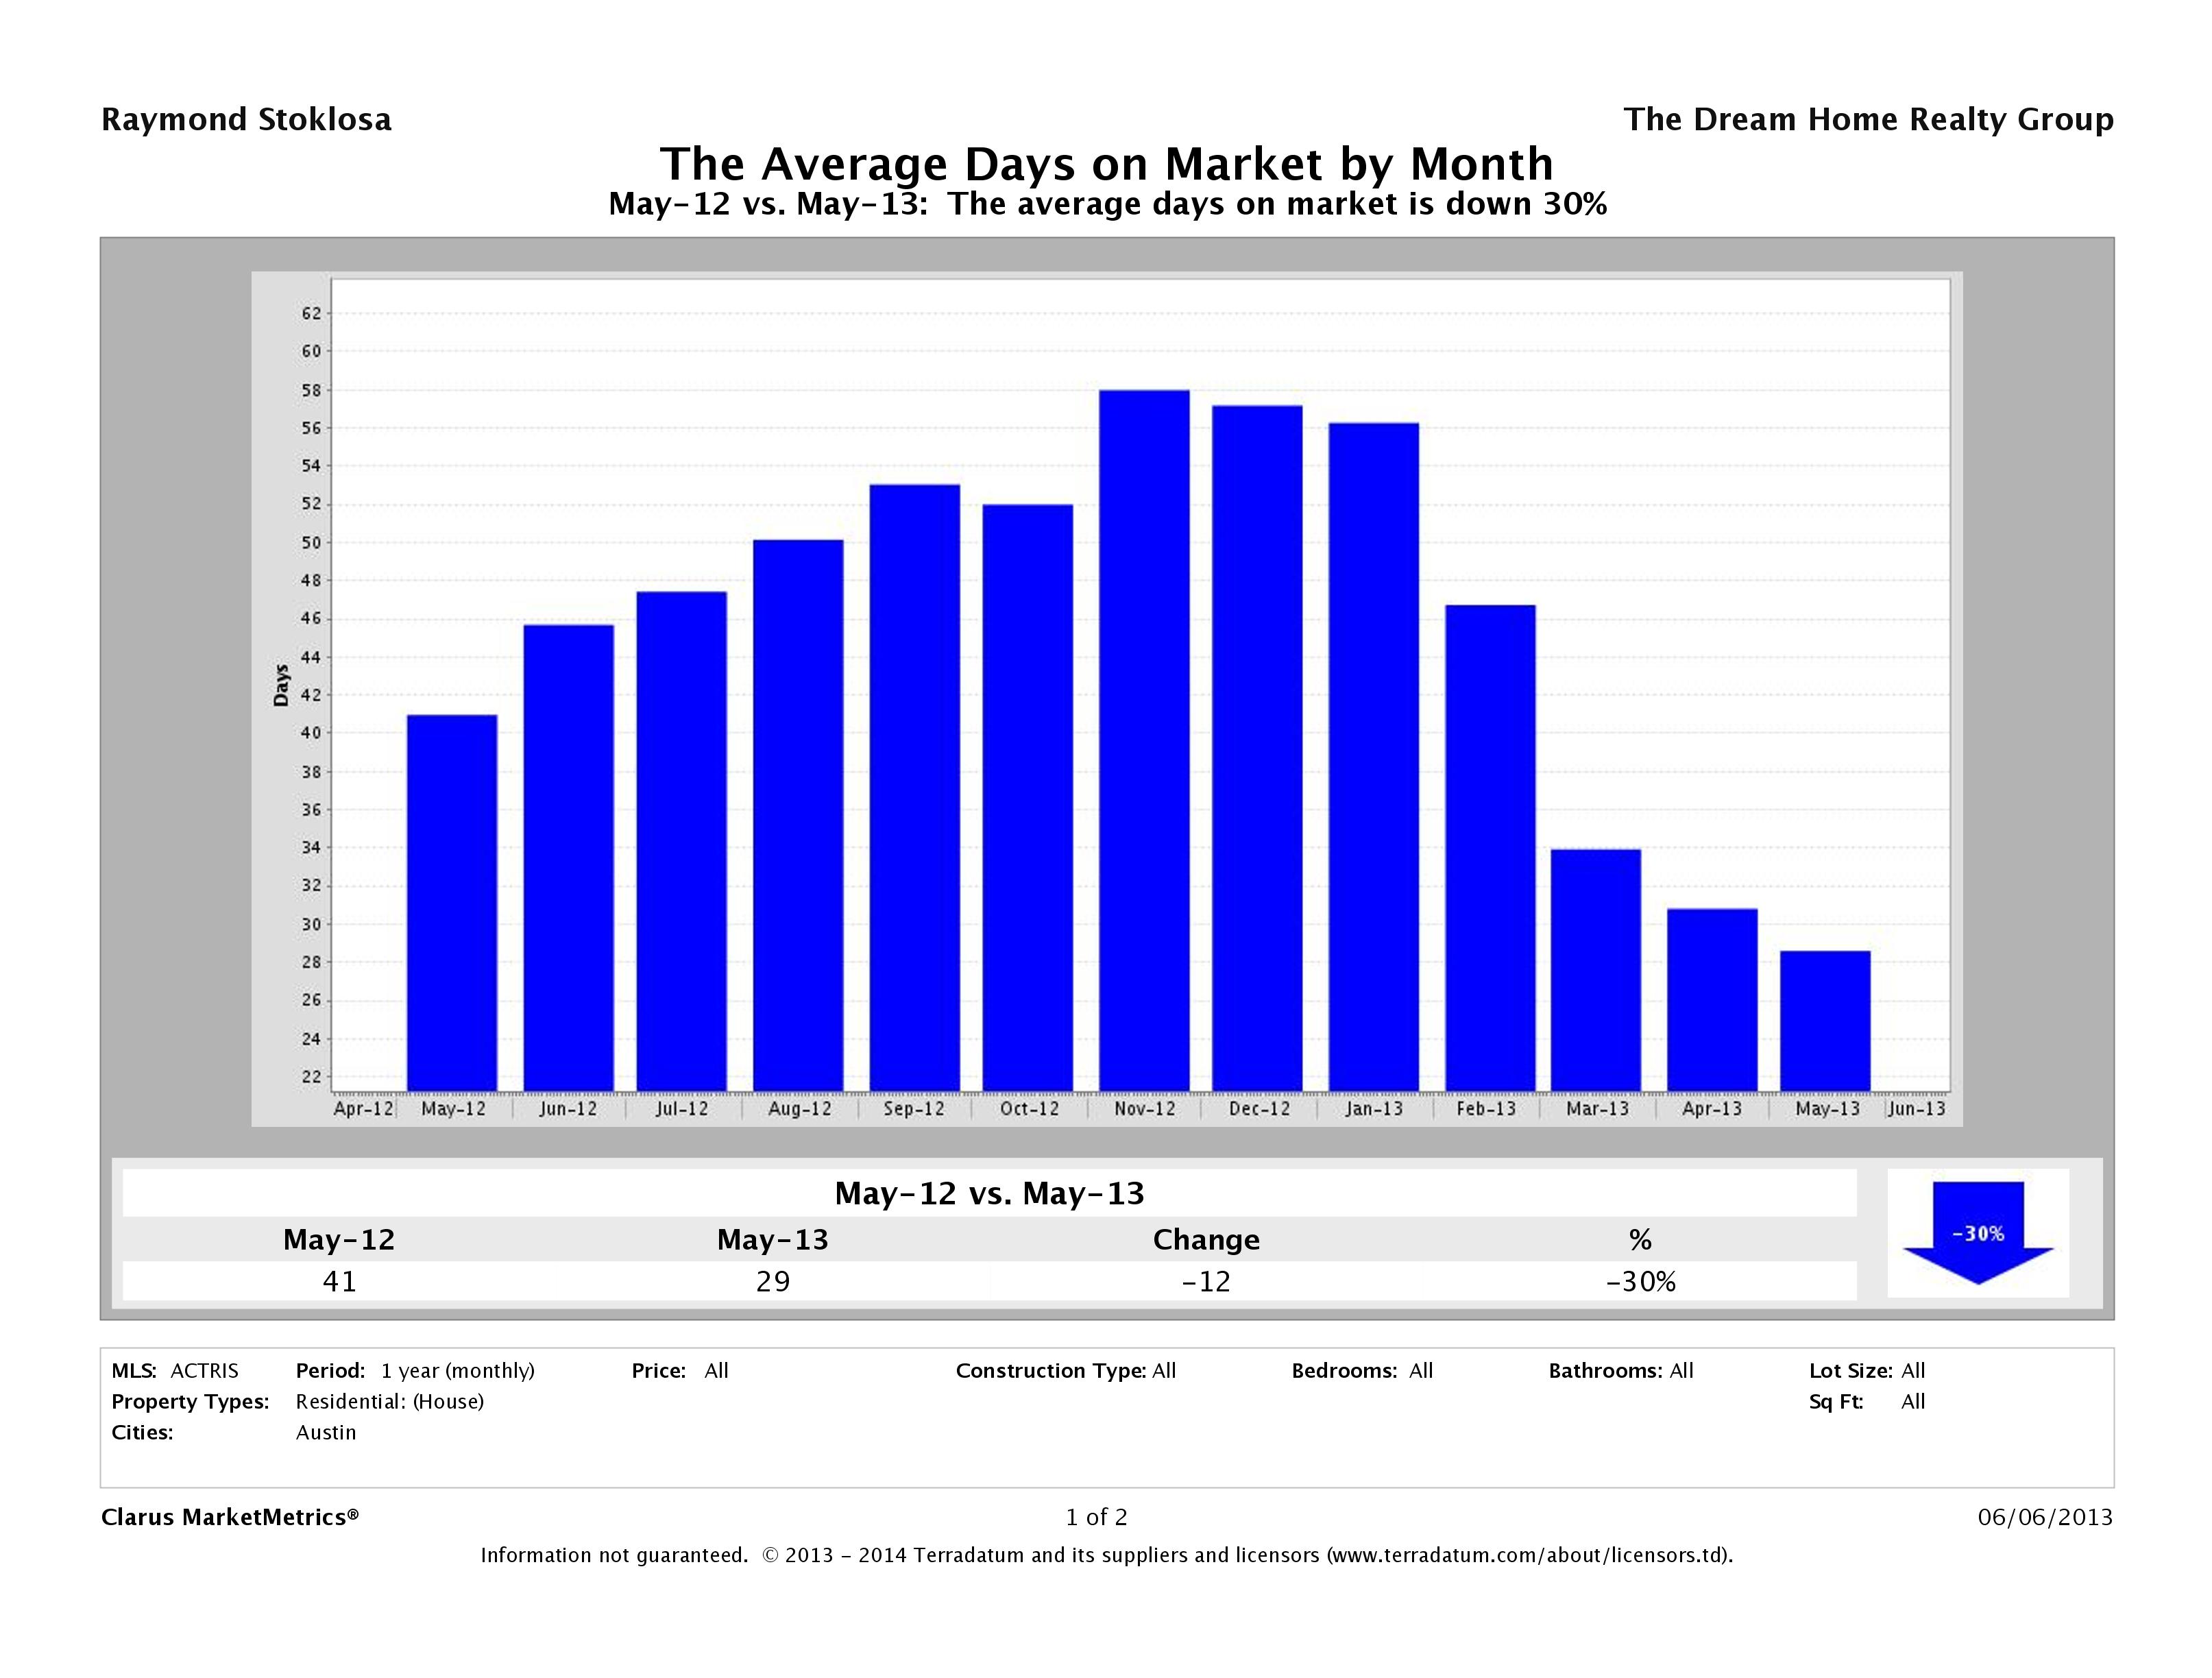
Time to Sell Home in Austin Down 30%
In May 2012, it took, on average, 41 days to sell a home in Austin while in May 2013, it took around 29 days. A normal market is considered 90 days, so 29 days is incredibly fast and 2 days faster than April 2013. Remember, this figure takes into account all of Austin. In the more desirable neighborhoods, we’re seeing this number go way down – some averaging just a few days and others even just a few hours.
Supply is Down 21% and Demand is Up 10%
This month we’ve seen a 21% decrease in supply (number of properties for sale) and a 10% increase in demand (number of sold properties). Yet another indicator more residents are deciding to stay put while others continue to move to Austin in record numbers or decide to stop throwing money away on rent.
Median for Sale Up 18% vs Median Sold Price Up 8%
This chart compares the Median for Sale Price vs the Median Sold Price to show their relationship. In Austin, we saw an 18% increase in the median for sale price and an 8% increase in the median sold price of a single family home in year over year numbers. As we saw the last few months, sellers appear to be more successful at getting buyers to come up to their price, even though they are setting higher list prices, an indication of the strength of the market.
Source: Clarus Market Metrics, ACTRIS Sold Data
May 2013 Real Estate Price Report – Strictly Numbers
For those of you who prefer to see the actual hard numbers, we’ve included the figures for May 2013 Austin home sales below. The most expensive home that sold in May 2013 was $3,545,000 and the least expensive home sold for $0, though that appears to be a mistake in the data. Homes range in size from 492 sqft-10,379 sqft with an average size of 2,348 sqft. The average price per square foot was $160.27 with the lowest being $36.06/sqft and the highest being $634.32/sqft. It took, on average, 27 days to sell a home in Austin and sellers received, on average, 99.67% of their list prices.
| Beds | Baths | SqFt | Listing Price | LP/SqFt | Selling Price | SP/SqFt | SP/LP | SP/OLP | DOM | |
|---|---|---|---|---|---|---|---|---|---|---|
| High | 6 | 7 | 10,379 | $3,750,000 | $667.71 | $3,545,000 | $634.32 | 146.46% | 0% | 386 |
| Low | 1 | 1 | 492 | $40,000 | $32.05 | $0 | $36.06 | 60.71% | 0% | 0 |
| Average | 4 | 2 | 2,348 | $389,740 | $161.36 | $383,575 | $160.27 | 99.67% | 0% | 27 |
| Median | 3 | 2 | 2,103 | $299,900 | $136.96 | $300,000 | $136.77 | 100% | 0% | 7 |
| Search Criteria | |||
|---|---|---|---|
| Status | Sold | Sold Date | 2012 |
| Property Type | Single Family Homes | Number Sold | 1,201 |
| Source: | ABoR Sales Data | Area | Austin |
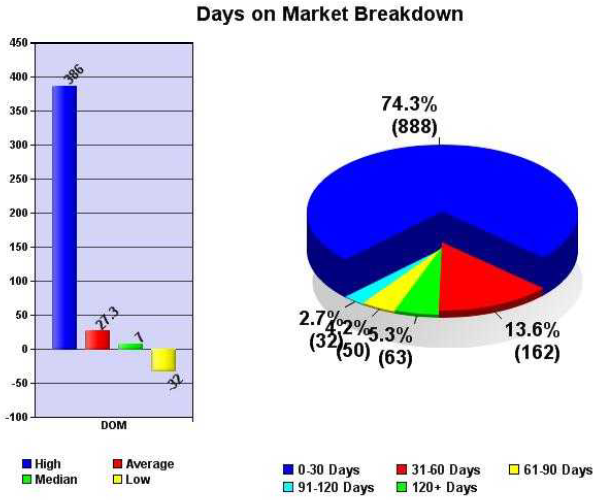
May 2013 Days on Market Report
The overwhelming majority (73.94%) of the 1,201 homes that sold in Austin in May 2013 (888) sold in less than 30 days and received, on average, 100.54% of their list prices. As homes stayed on the market longer, sellers received less than their list prices with homes that have been for sale for 120 days or more receiving, on average, 96.17% of their list prices. The lesson here? Homes that are priced right from the beginning sell quickly and for list price, or even a little bit more.
| 0-30 Days | 31-60 Days | 61-90 Days | 91-120 Days | 120+ Days | |
|---|---|---|---|---|---|
| No. of Listings | 888 | 162 | 50 | 32 | 63 |
| Breakdown % | 73.94% | 13.49% | 4.16% | 2.66% | 5.25% |
| Avg % SP/LP | 100.54% | 97.49% | 95.75% | 96.28% | 96.17% |
May 2013 Price Analysis Report
The majority of the homes that sold in Austin in May 2013 were priced below $500,000, which is to be expected. You’ll also see that the lower priced homes sold faster than the higher priced homes, which is due largely in part to the increased market for homes below $500k. But, this month we do see homes in the $500k’s and $600k’s selling about as fast as hones in the $200k’s, which shows the strength of the market for trade up homes.
| Price Range | Quantity | Average DOM |
|---|---|---|
| $149,999 or under | 112 | 27 |
| $150,000 – $199,999 | 167 | 22 |
| $200,000 – $249,999 | 187 | 17 |
| $250,000 – $299,999 | 129 | 21 |
| $300,000 – $349,999 | 106 | 20 |
| $350,000 – $399,999 | 106 | 34 |
| $400,000 – $449,999 | 84 | 33 |
| $450,000 – $499,999 | 58 | 25 |
| $500,000 – $549,999 | 52 | 16 |
| $550,000 – $599,999 | 30 | 18 |
| $600,000 – $699,999 | 57 | 30 |
| $700,000 – $799,999 | 36 | 67 |
| $800,000 – $899,999 | 23 | 40 |
| $900,000 – $999,999 | 12 | 34 |
| $1,000,000 or over | 40 | 88 |
| Total | 1,201 | 27 |
May 2013 Summary Price Report
Below you’ll find a breakdown of the sales prices of homes in Austin. The average price of a home that sold in May 2013 was $383,575 and the median price was $300,000.
| Summary | List Price | Sale Price |
|---|---|---|
| High | $3,750,000 | $3,545,000 |
| Low | $40,000 | $0 |
| Average | $389,707 | $383,575 |
| Median | $299,900 | $300,000 |
Time to Buy? Sell?
As we always say, the best time to buy or sell a home is when you need to buy or sell. If you have a house to sell, selling when its a buyers market may hurt you on the selling end, but you’ll make it up on the buying end. If you’re trying to get into the market for the first time, the only way you’ll know that we’ve “hit bottom” is when its in the rear view mirror. Work with professionals who can help you analyze your financial and lifestyle to determine if now is the right time to buy or sell.
Looking strictly at the numbers, it appears the recommendation for this month is (again)…it’s time to sell. With inventory at record lows, a home that’s priced right will have no problem finding a buyer. Buyers again came out in record numbers yet again in May 2013 with a 10% increase in the number of contracts received by sellers in year over year numbers. As we head into May 2013, buyers who have been waiting for more inventory will continue their searches. Get your home on the market now and be moved into your new home by the beginning of the school year. If you’re looking to sell, we can help you get top dollar for your home in the shortest time. For more info about the best home selling program in Austin, visit Sell My Austin Home.
If you’re a buyer, that doesn’t mean sit on the fence and wait. Interest rates have jumped up a bit, but are still at all time lows, which could mean the difference in hundreds of dollars to your payment. As more and more inventory gets snatched up, you’ll find less and less available. Waiting until the market slows down could mean you could afford less home if interests rates go up. And, as buyers continue to snatch up everything, market values will go up as well. If you’re looking to get into the market, the best time to find a great deal is any time you can. For more info about our Home Buyer Representation Program, check out Austin Buyer Brokers.
Questions About the Austin Real Estate Price Report?
Do you have questions about this Austin Real Estate Price Report? Call us at (512) 827-8323 or email us at info@11OaksRealty.com and we’ll help you in any way we can. If you’re looking to buy or sell Austin real estate, don’t forget to check out our Buyer Resources and our Seller Resources for more tips.
Leave a Reply