Eleven Oaks Realty is proud to present their July 2016 Austin Real Estate Price Report measuring activity in the Austin single family home market.
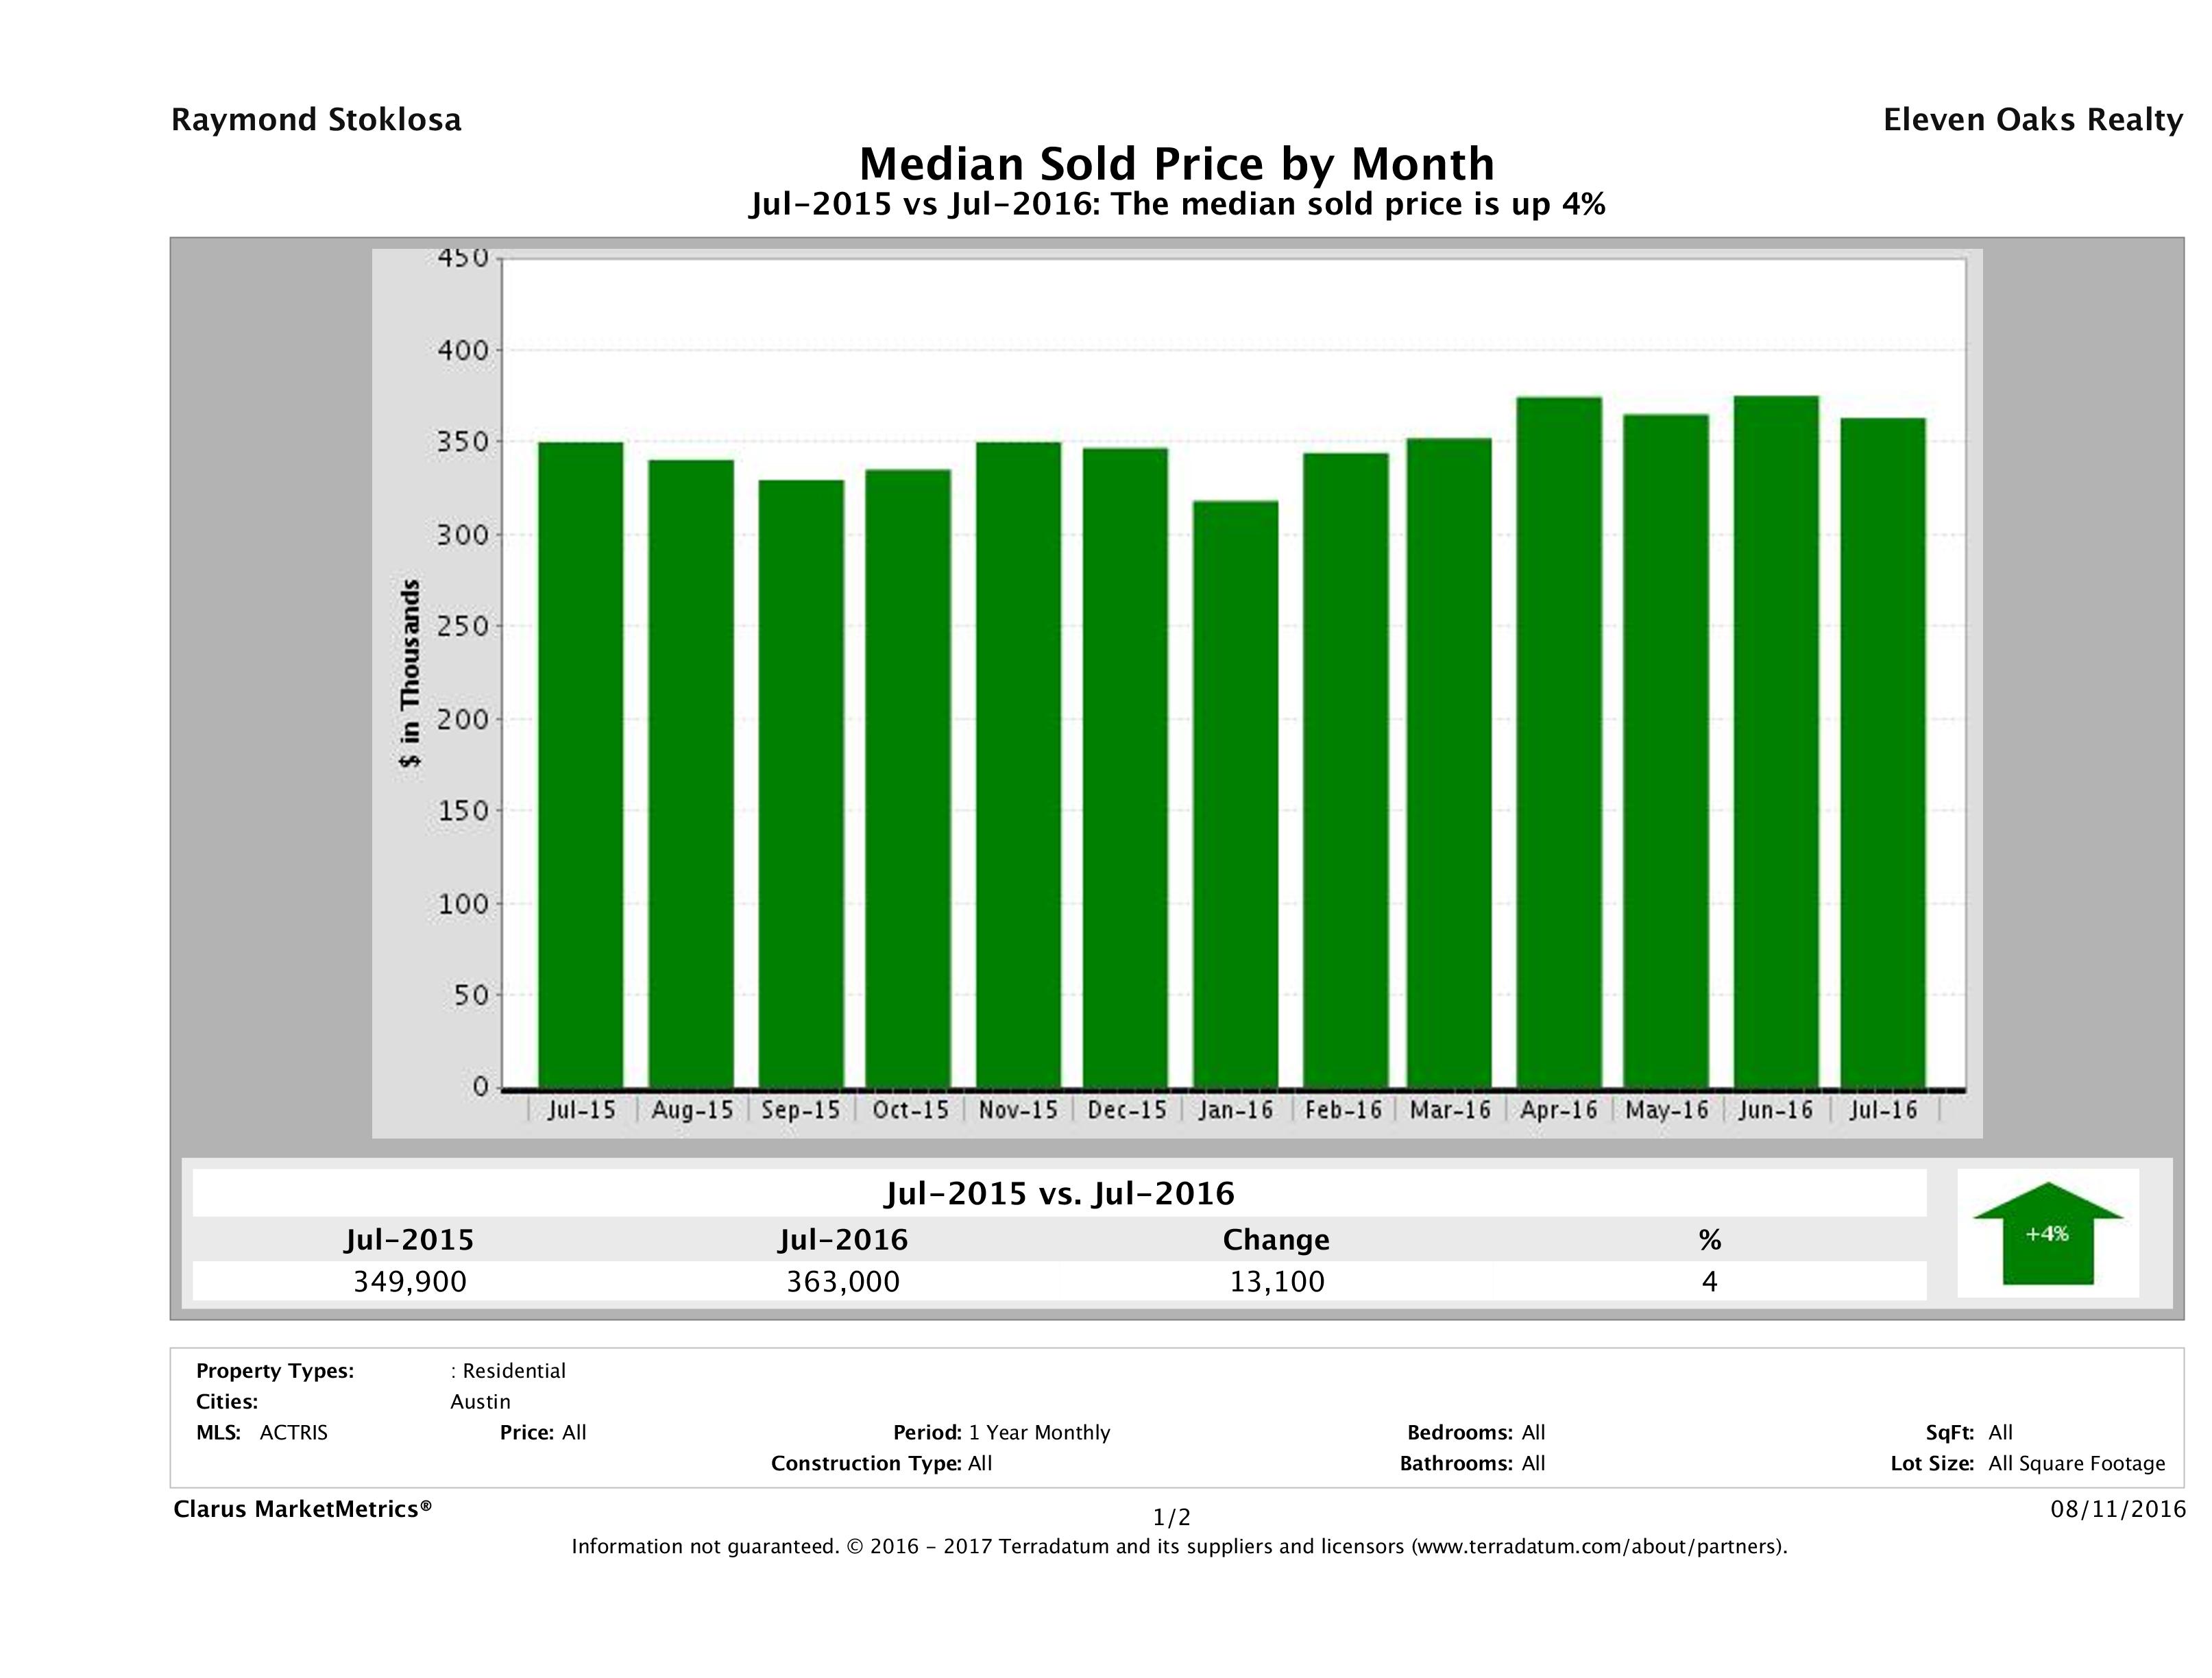
Austin Median Home Price Up 4%
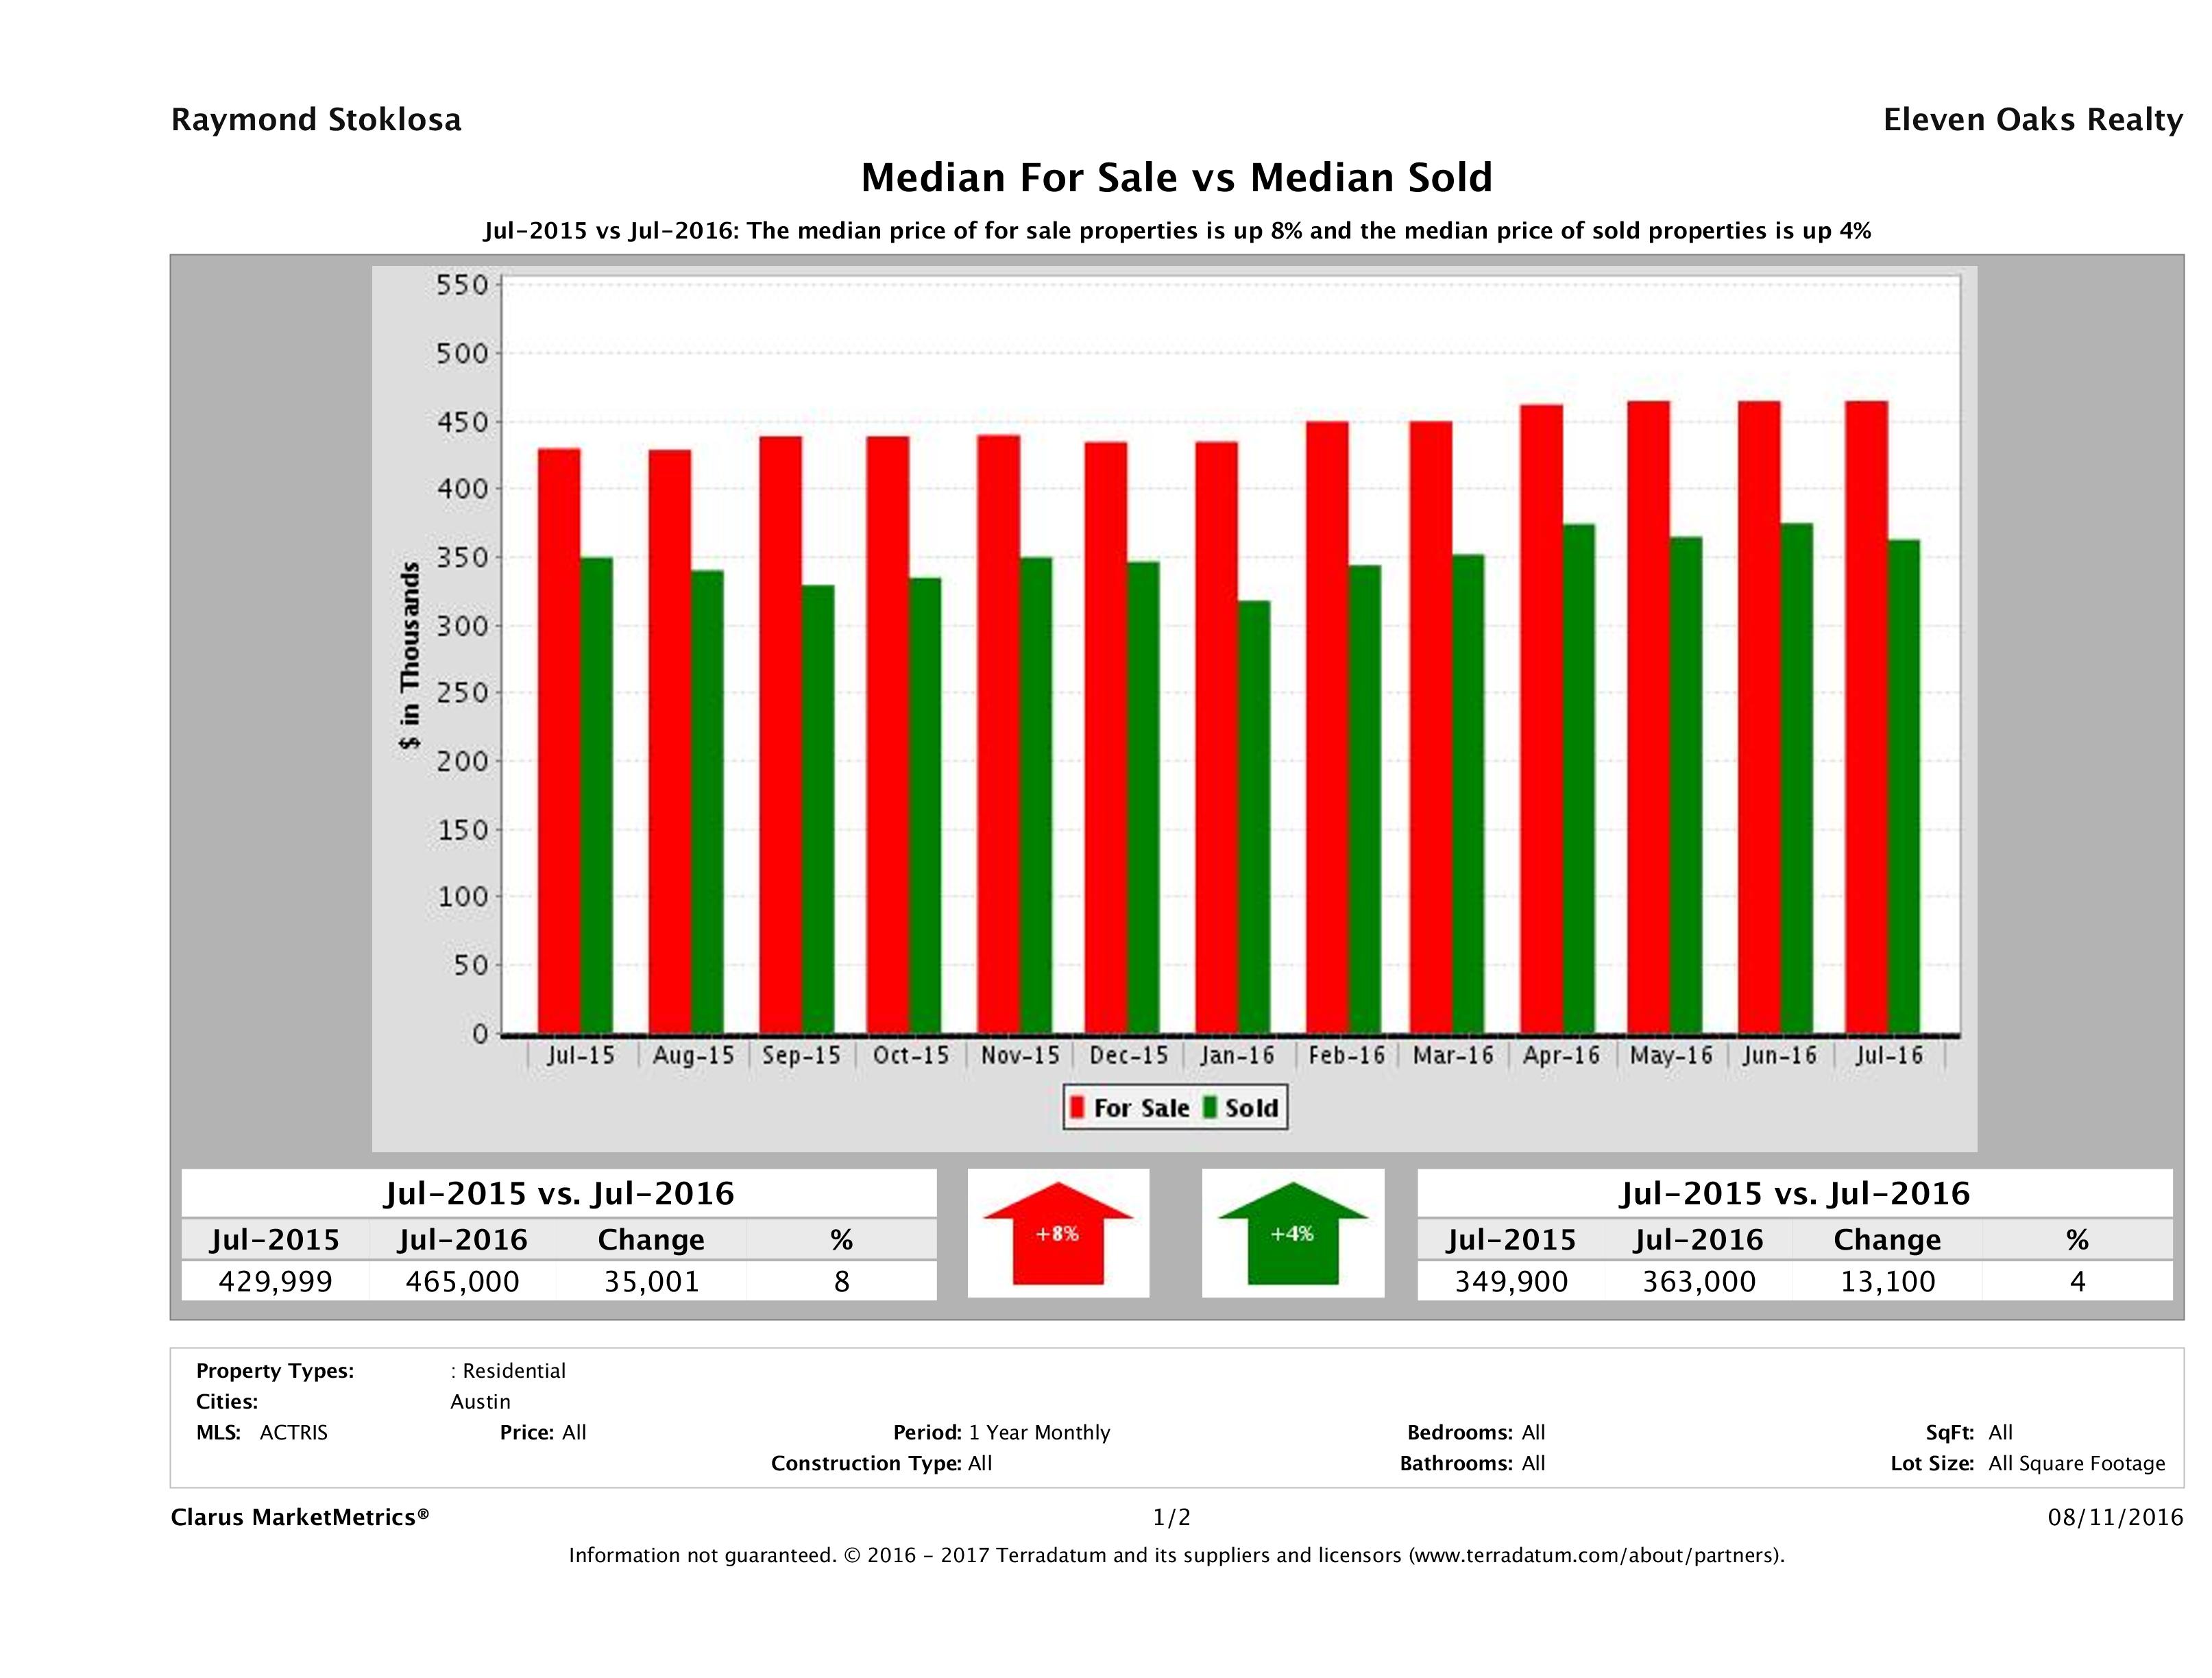
The biggest story in this month’s Austin Real Estate Price Report comes by way of median home prices. For the 23rd month in a row, the median price of a home in Austin outpaced the previous year. The median price of an Austin home in July 2015 was $349,900 compared to $363,000 in July 2016, marking a 4% increase in year over year numbers.
Median home price helps us see the distribution of homes sold and does not really give us an indication of the increase or decrease in a particular home’s market value. To analyze market value, we’d have to take an in depth look at a neighborhood. If you’re looking for something like that, please check out our Austin Home Values Report.
What does this mean to buyers? With 23 straight months of price increases, it doesn’t look like we’re going to see a pricing slow down any time soon. This month, we didn’t see as significant an increase as we saw last month, but we still saw a stable increase compared to last year. If you’re looking to buy a home in Austin, it doesn’t appear waiting is a good strategy. Historically, August has been a good month for buyers in terms of negotiating. If you can catch a seller who needs to move on, they might be willing to sell for less than what a seller who is testing the market might take. Start your search now, be diligent with your search and don’t be afraid to negotiate.
What does this mean to sellers? If you’re thinking of selling, know buyers continue to pay more than they would have paid last year. Even though prices are going up, that doesn’t mean you just pop a sign in your yard today and cash a big check tomorrow. The most successful sellers spend some time preparing their homes to sell. Work with a Realtor to help you make smart improvements and maximize the return on the dollars you spend preparing your home to meet its next owner.
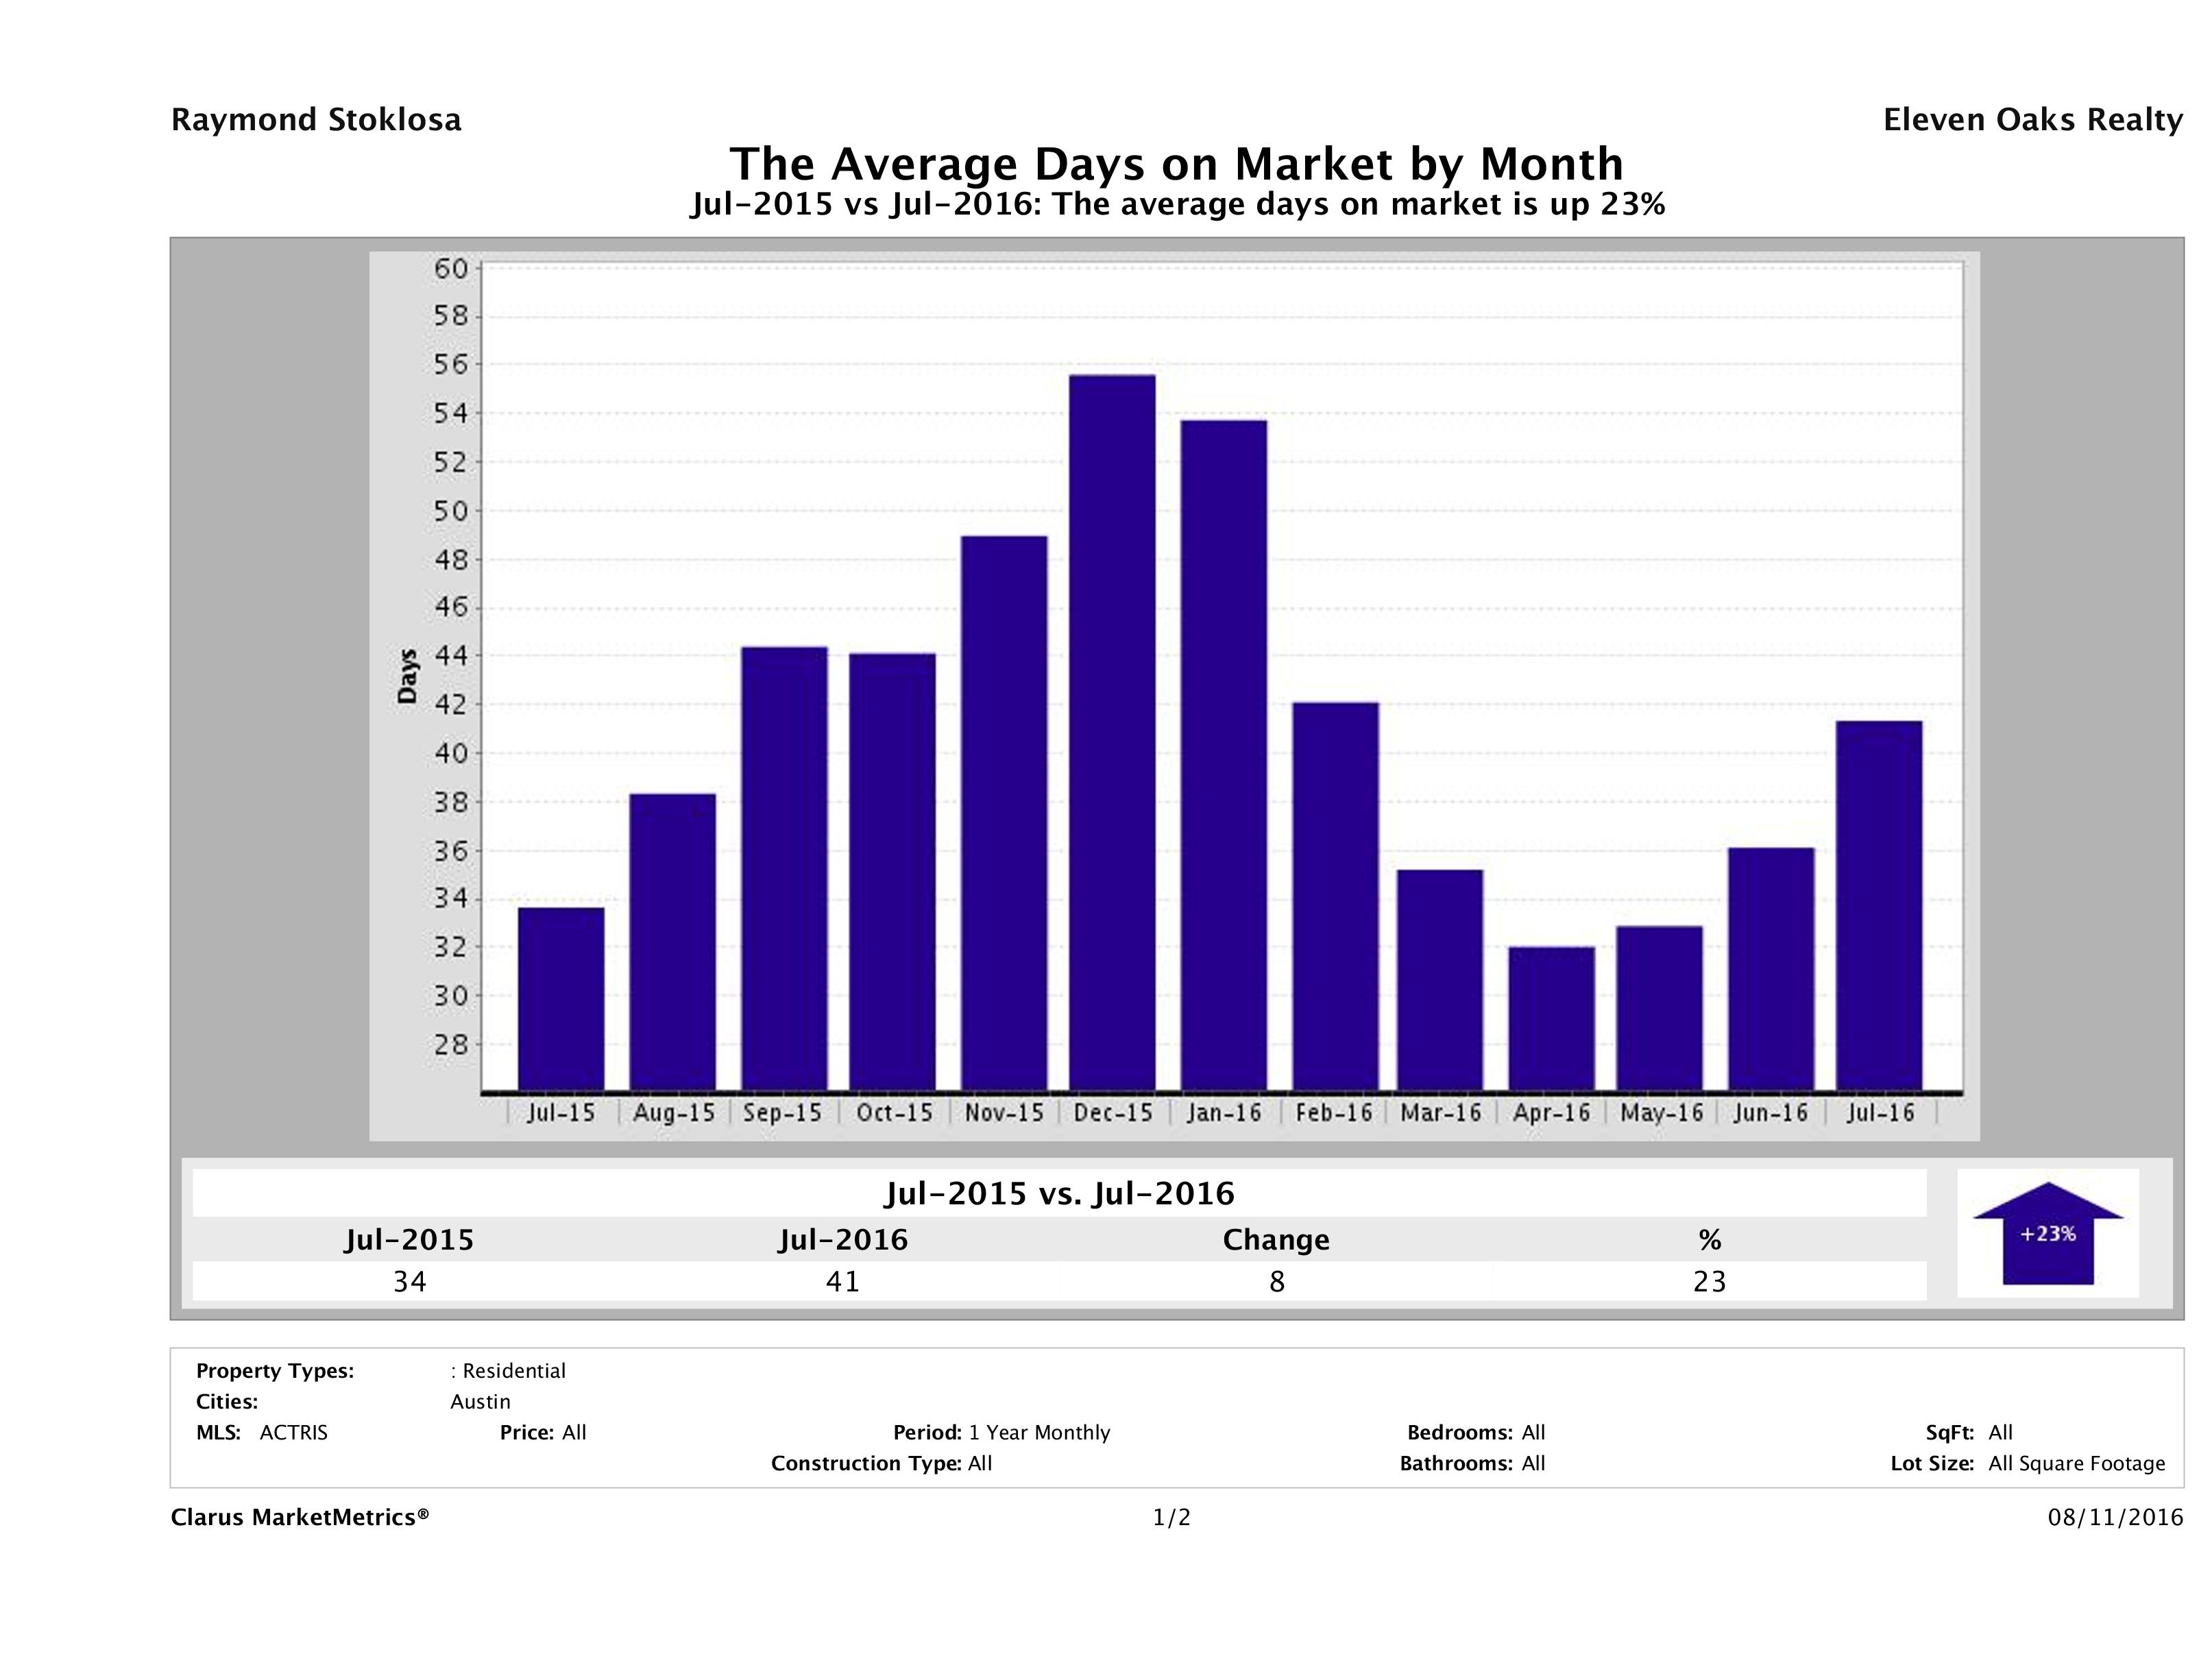
23% Increase in Time to Sell Home in Austin
In July 2016, it took 41 days to sell a home in Austin, on average, compared to 34 days in July 2015, marking a 23% increase in year over year numbers. Again this month, it is taking a few more days to sell Austin homes. But, buyers are still willing to pay more, which should be positive news for sellers.
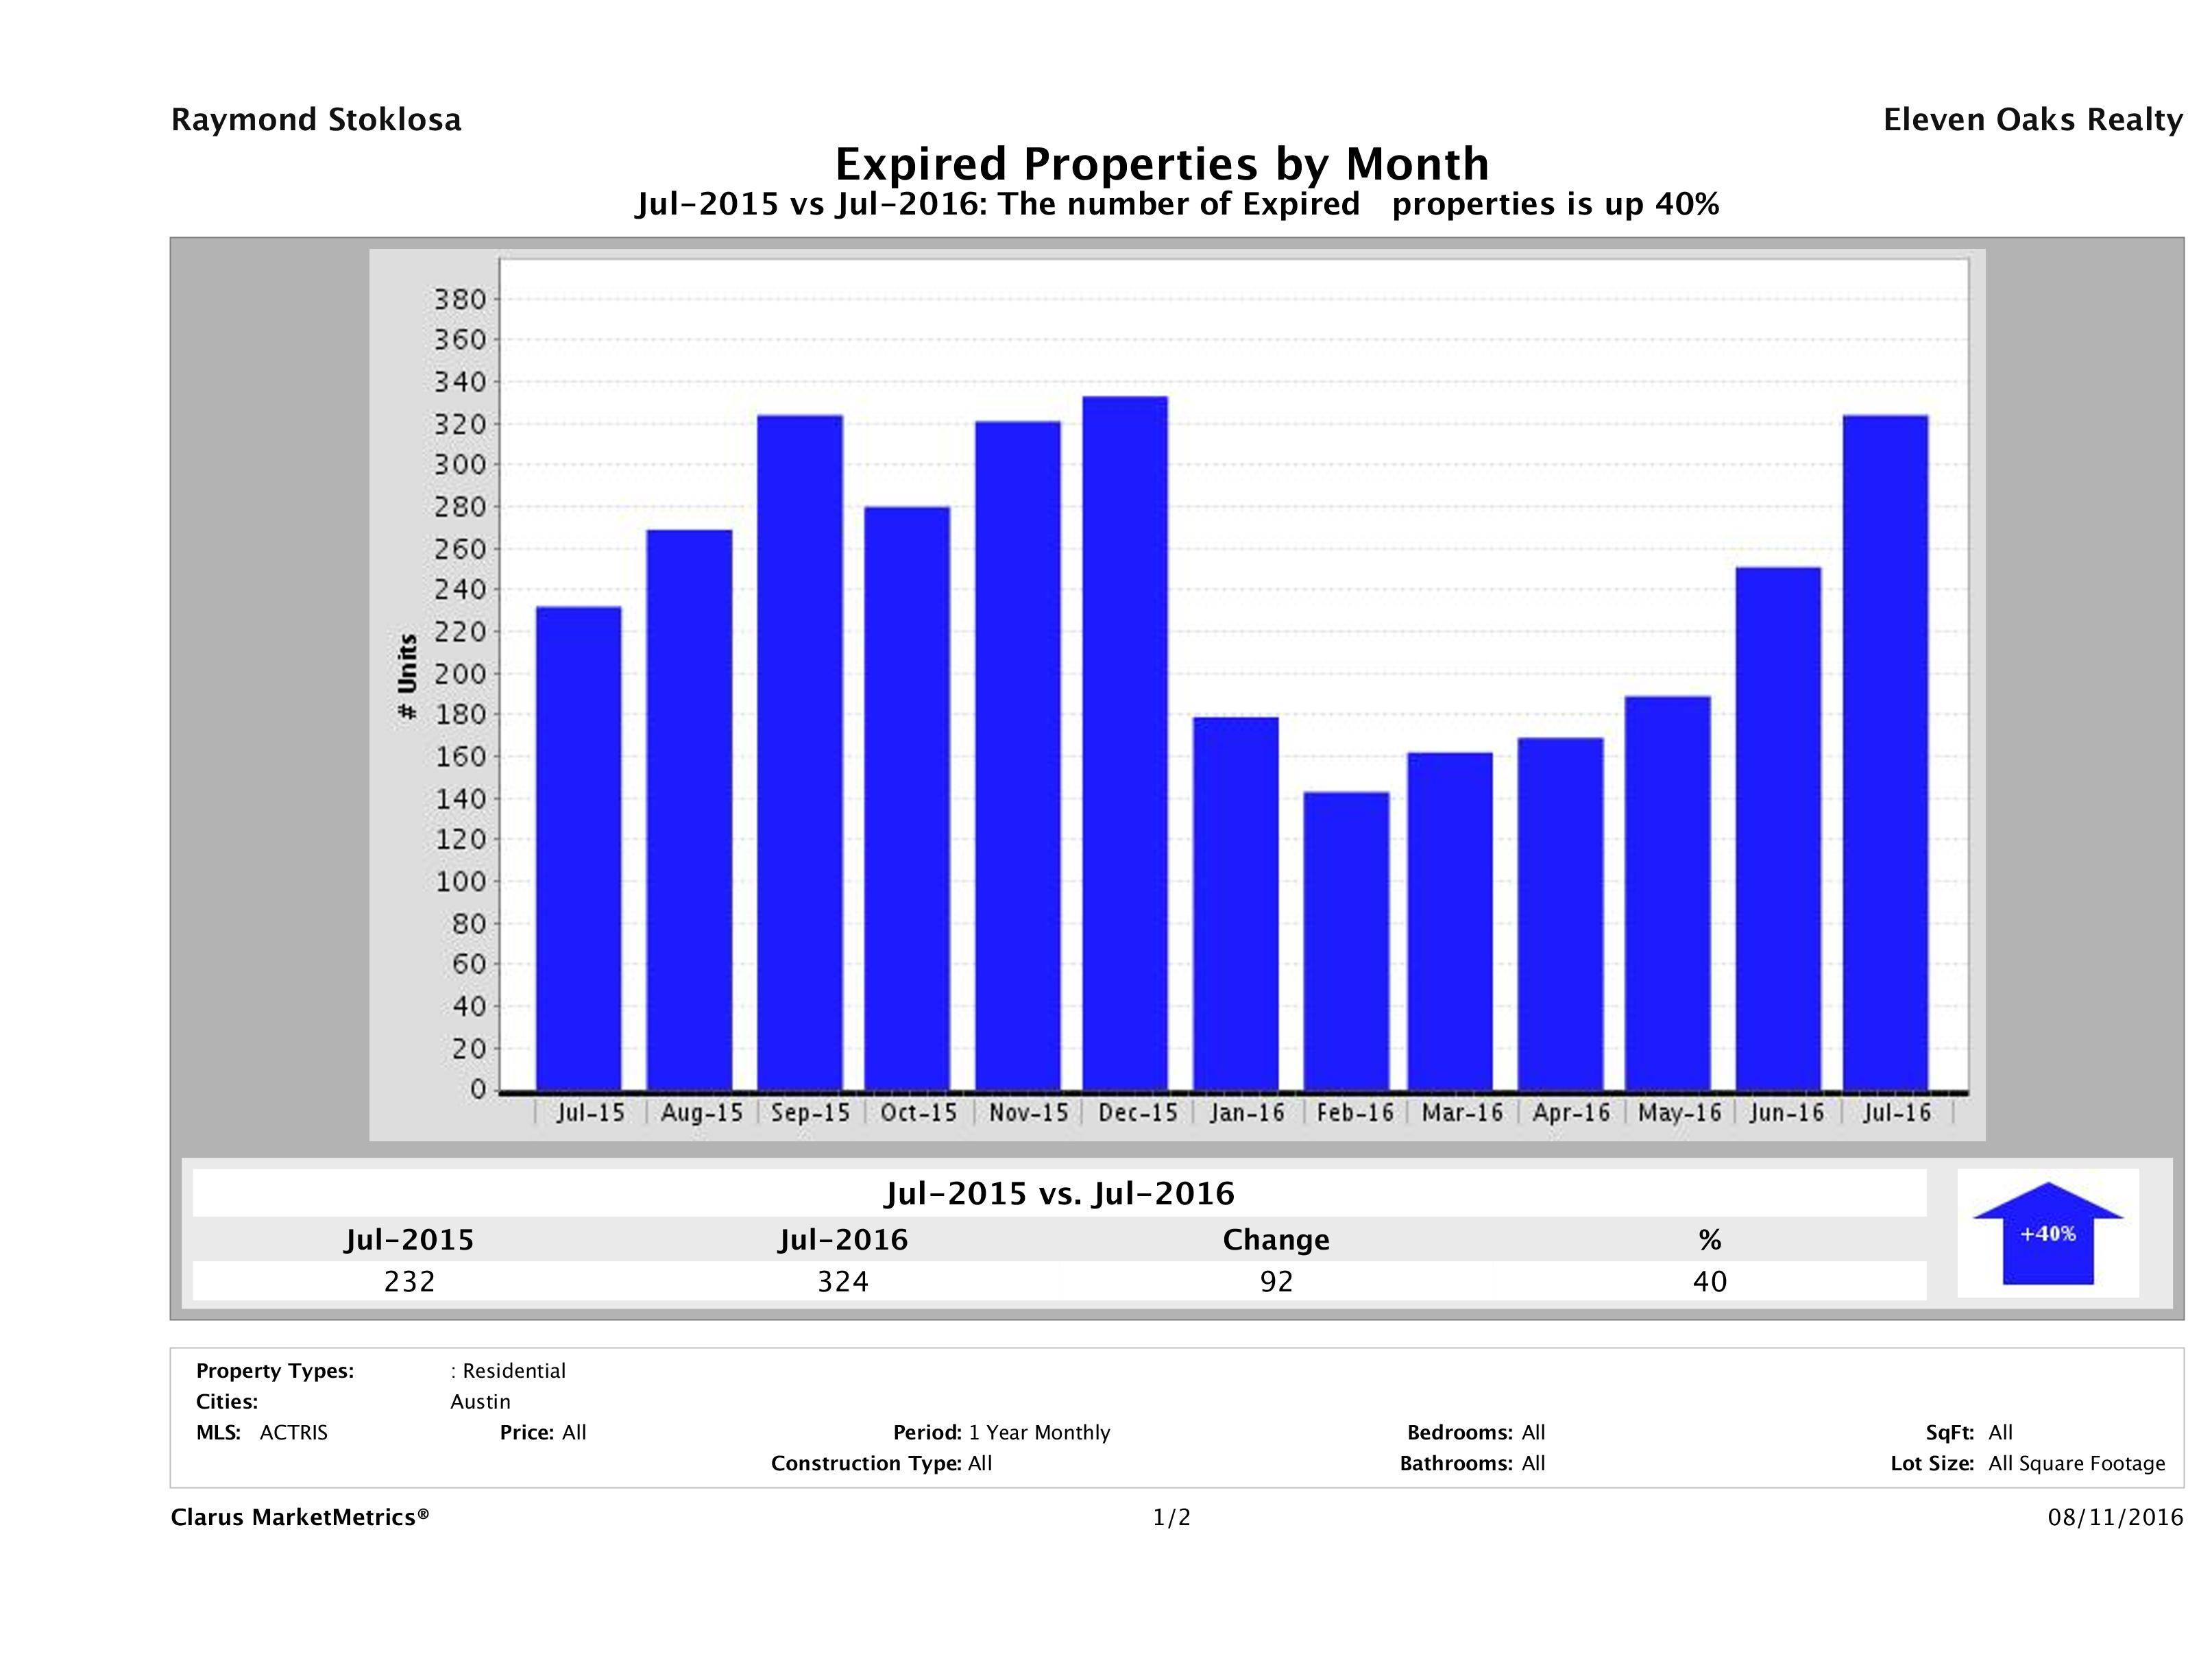
Number of Homes Taken Off the Market Up 40%
In July 2016, there were 324 homes taken off the market compared to 232 in July 2015. This marked a 40% (92 home) increase in year over year numbers. For the last several months, we’ve seen an increase in the number of homes taken off the market. It seems that sellers who aren’t getting their price are opting not to sell, rather than reducing to a price that would find a buyer.
If you need to sell and your home was priced right, maybe there was something else going on. The biggest culprits we see are incorrect info in the MLS and poor marketing. Check out our Austin Home Marketing Plan to see how your homes would be marketed.
Having trouble selling your home? Check out our Austin Home Not Selling resources page to find out why.
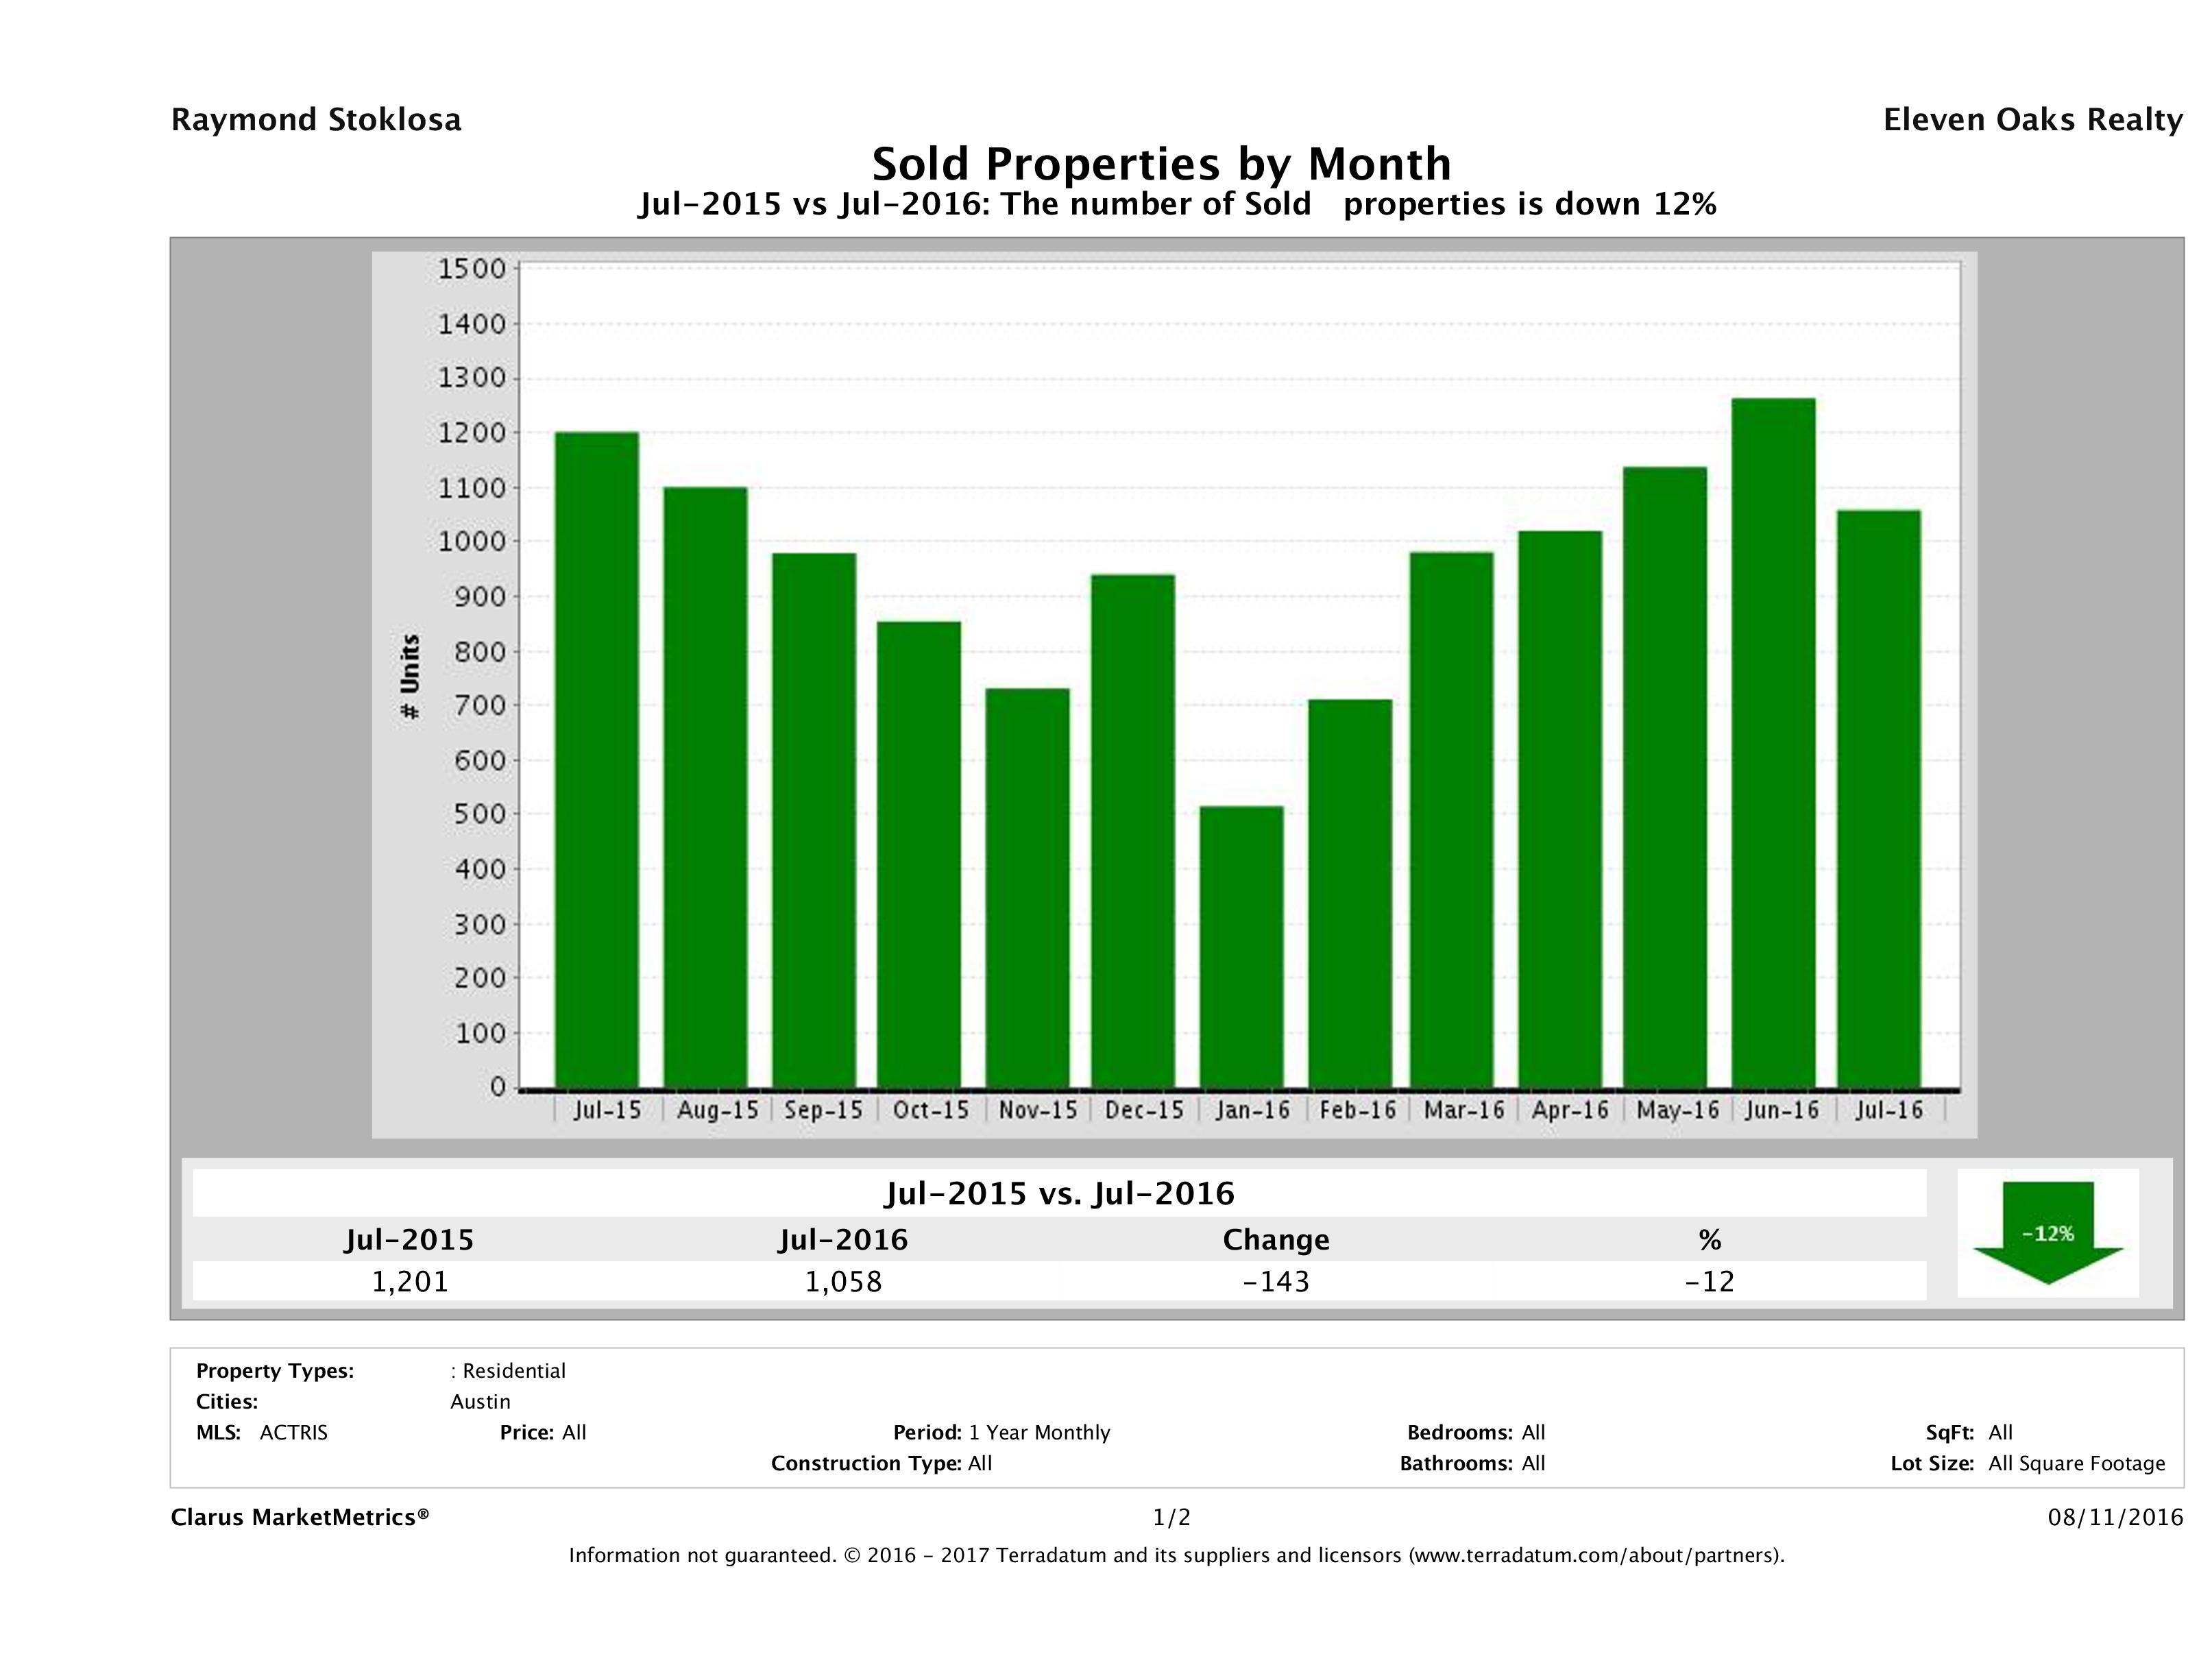
12% Decrease in the Number of Sold Homes in Austin
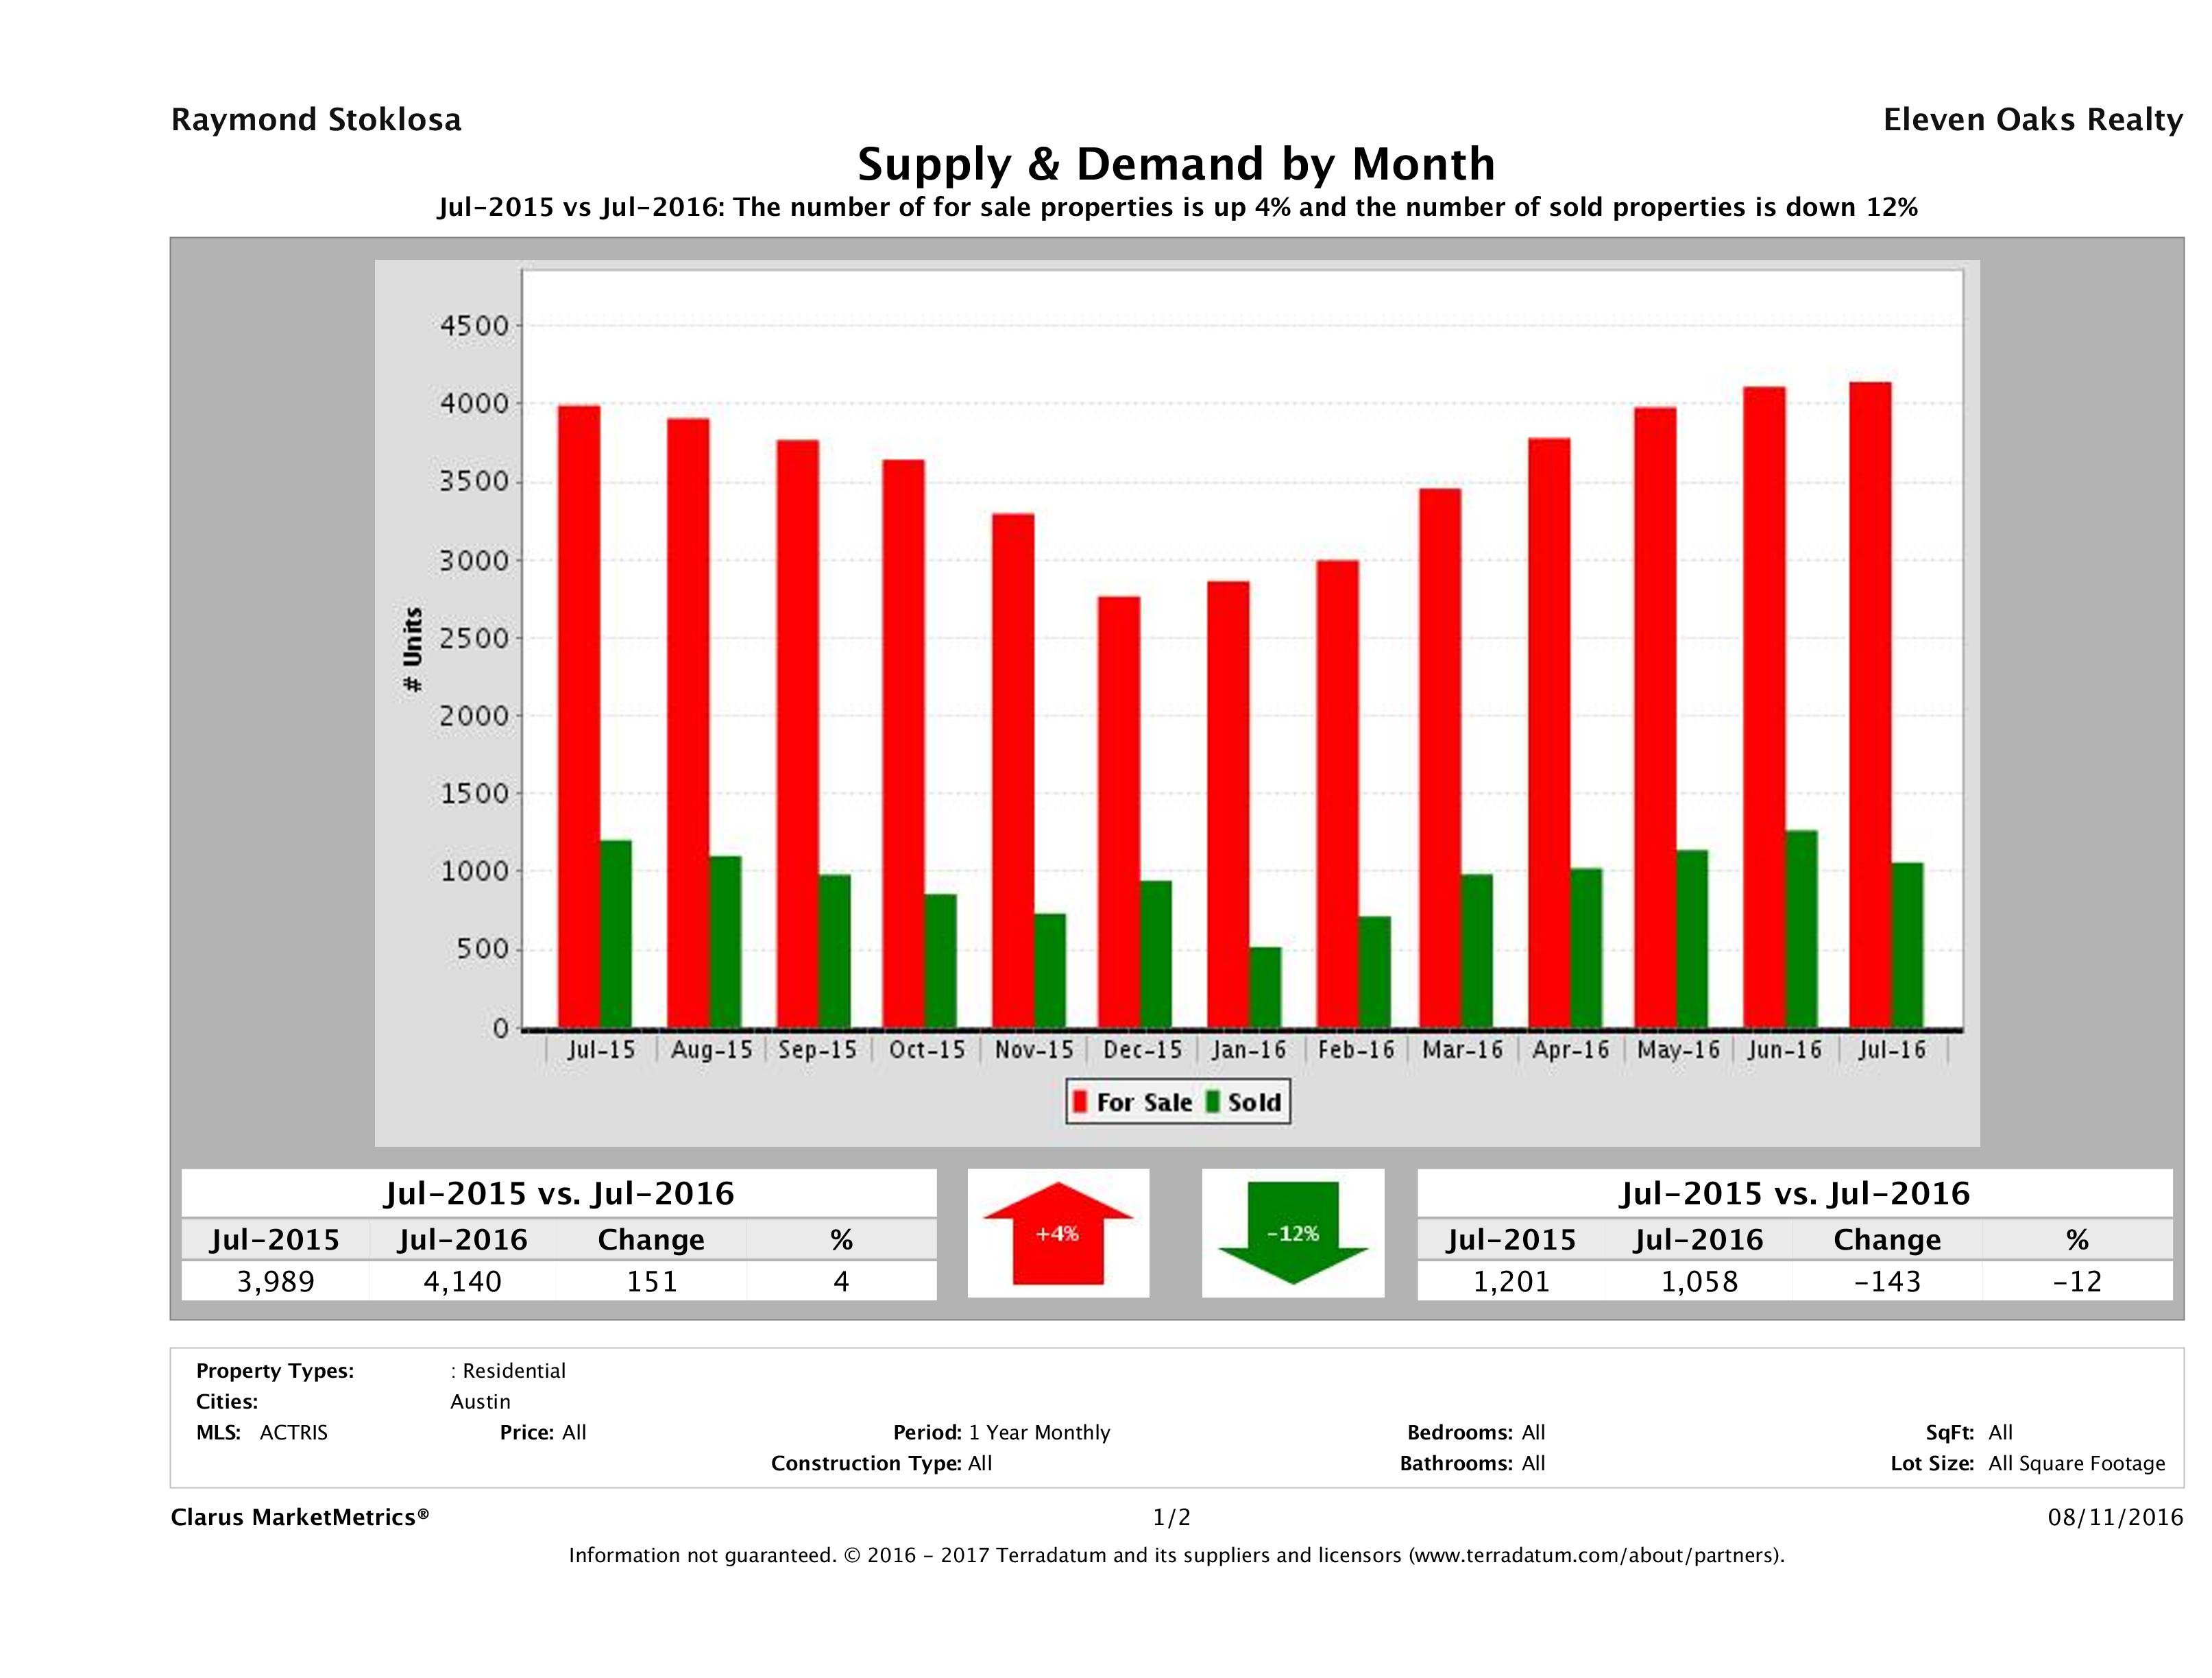
In July 2016, Austin saw a 12% decrease in the number of homes sold from July 2015 to July 2016. In July 2016, we saw 1,058 homes sell in Austin compared to 1,201 in July 2015 marking a 12% (143 home) decrease in year over year numbers.
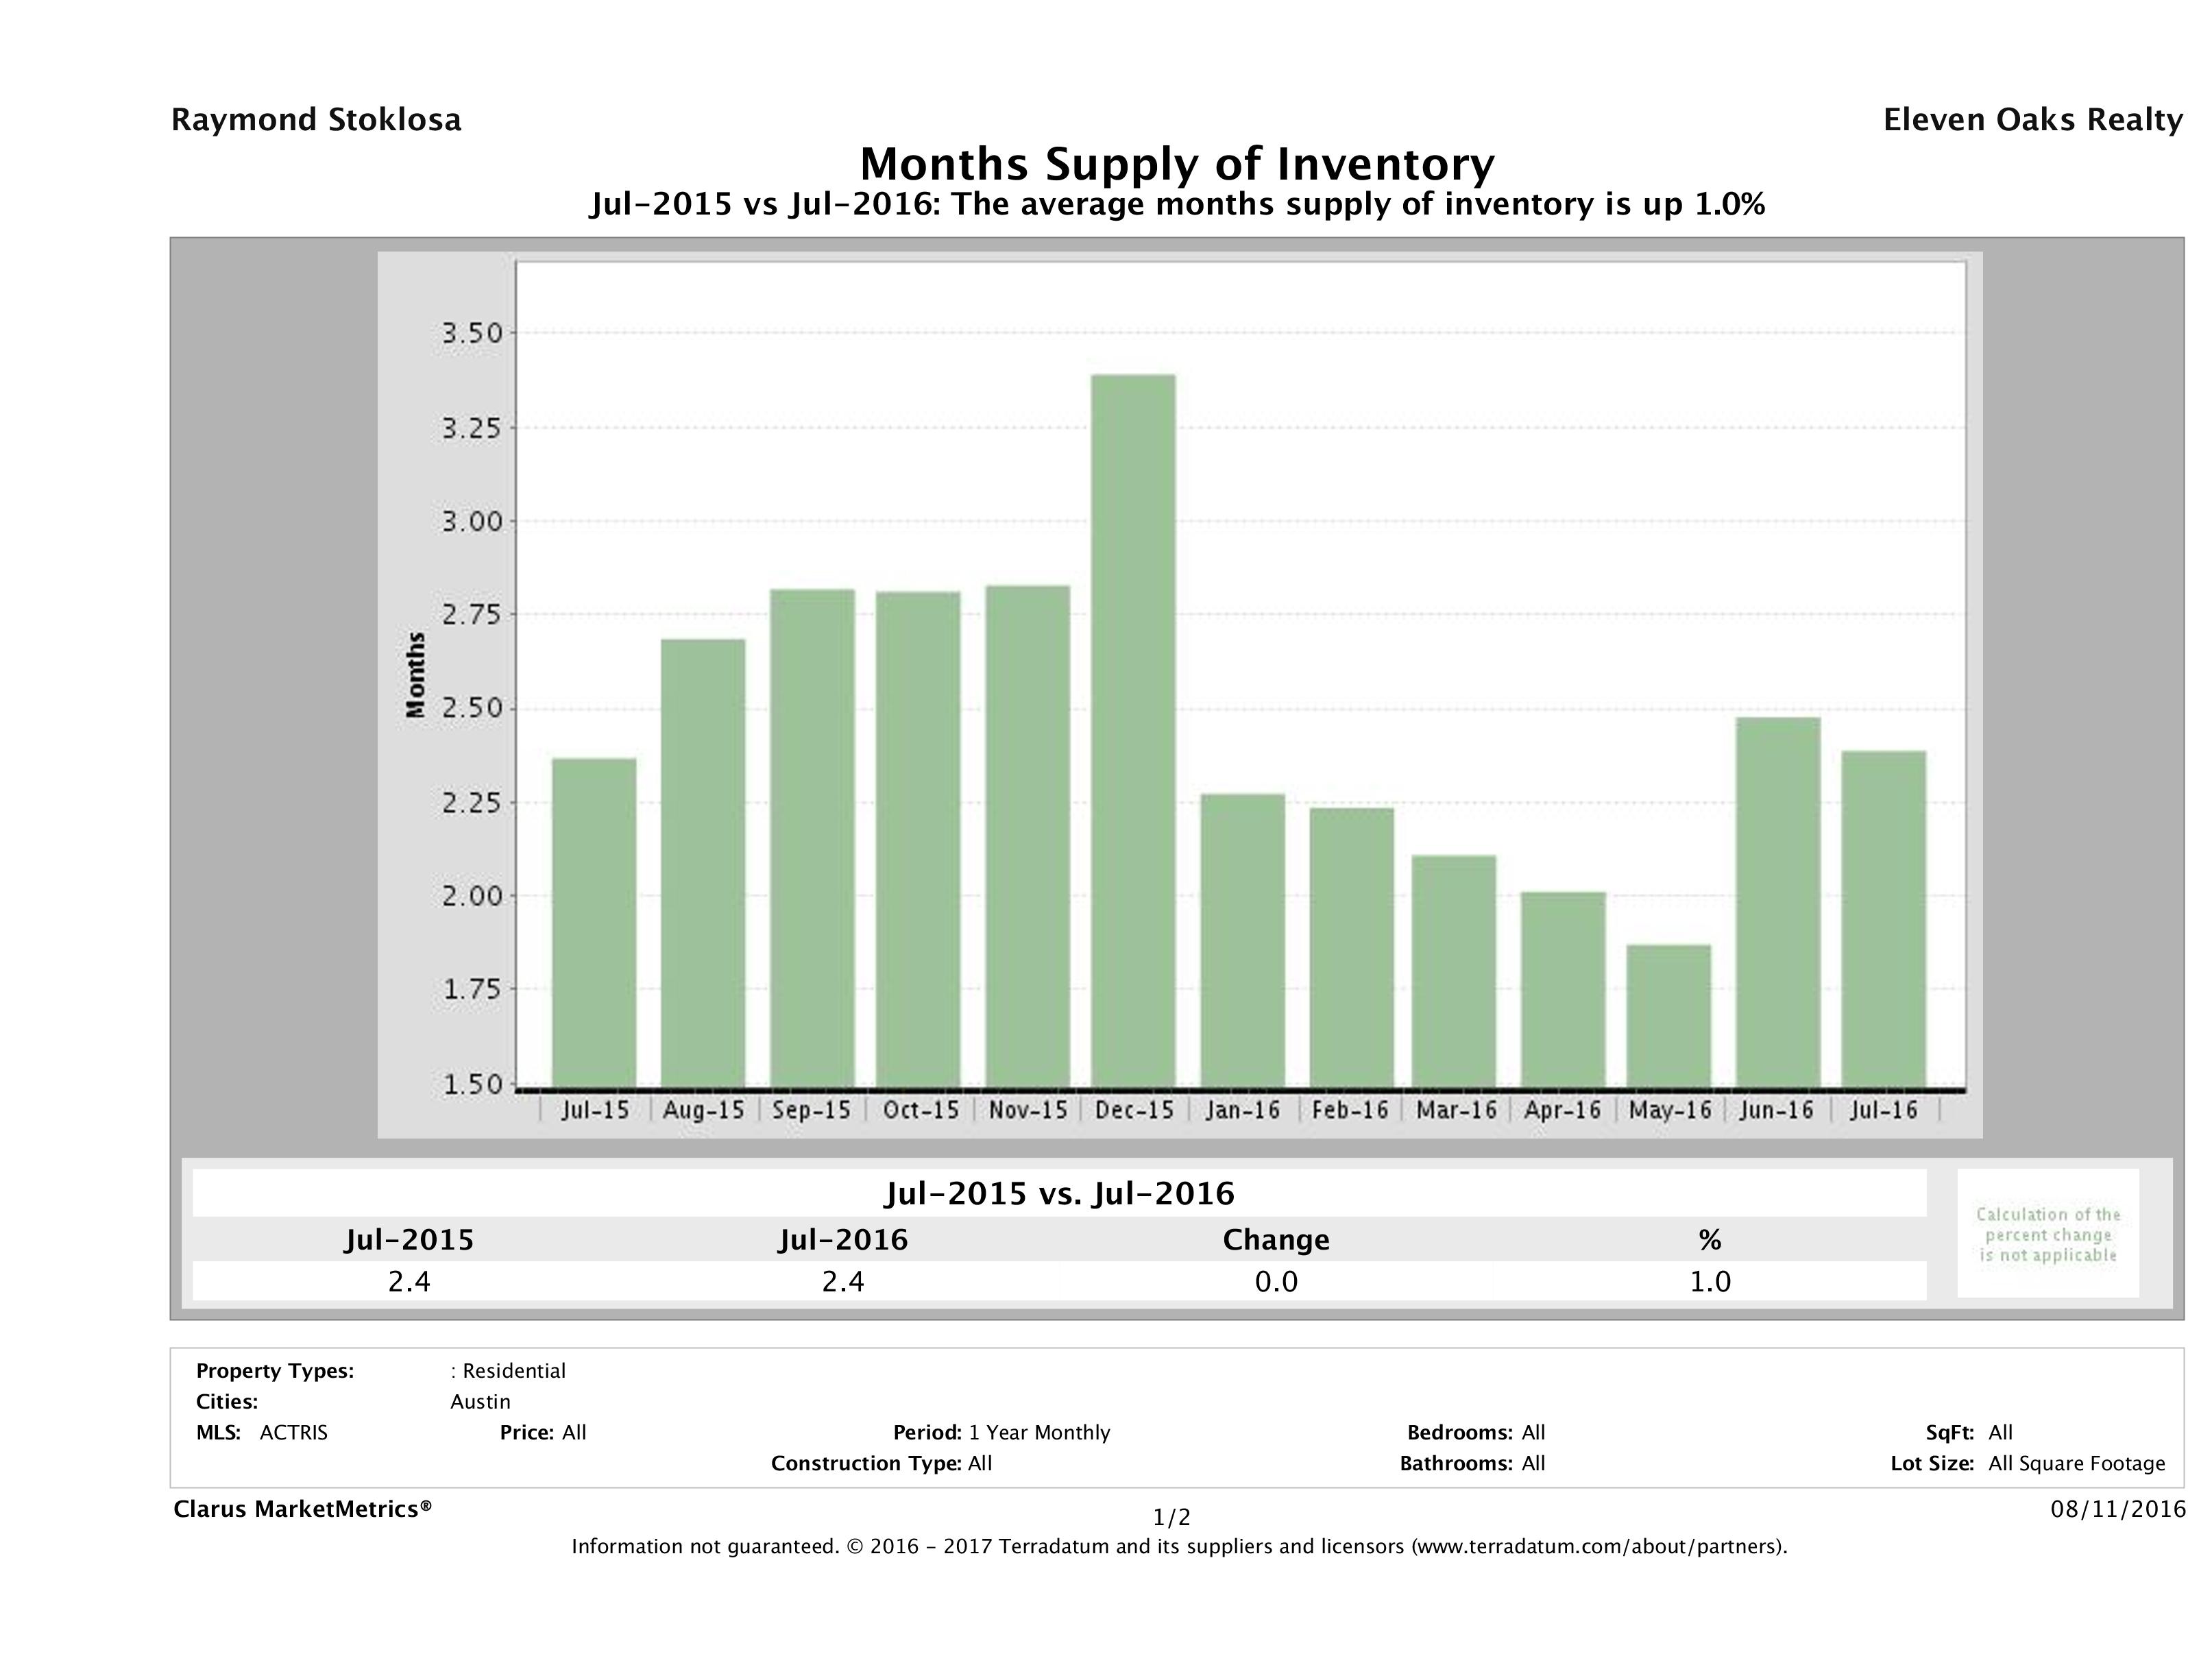
Austin Housing Inventory Up 1%
In July 2016, we saw 2.4 months of inventory on the market, compared to 2.4 months of inventory in July 2015, marking a 1% increase in year over year numbers. For the past two months, we’ve seen an increase in inventory, which should be good news for buyers looking for more choices.
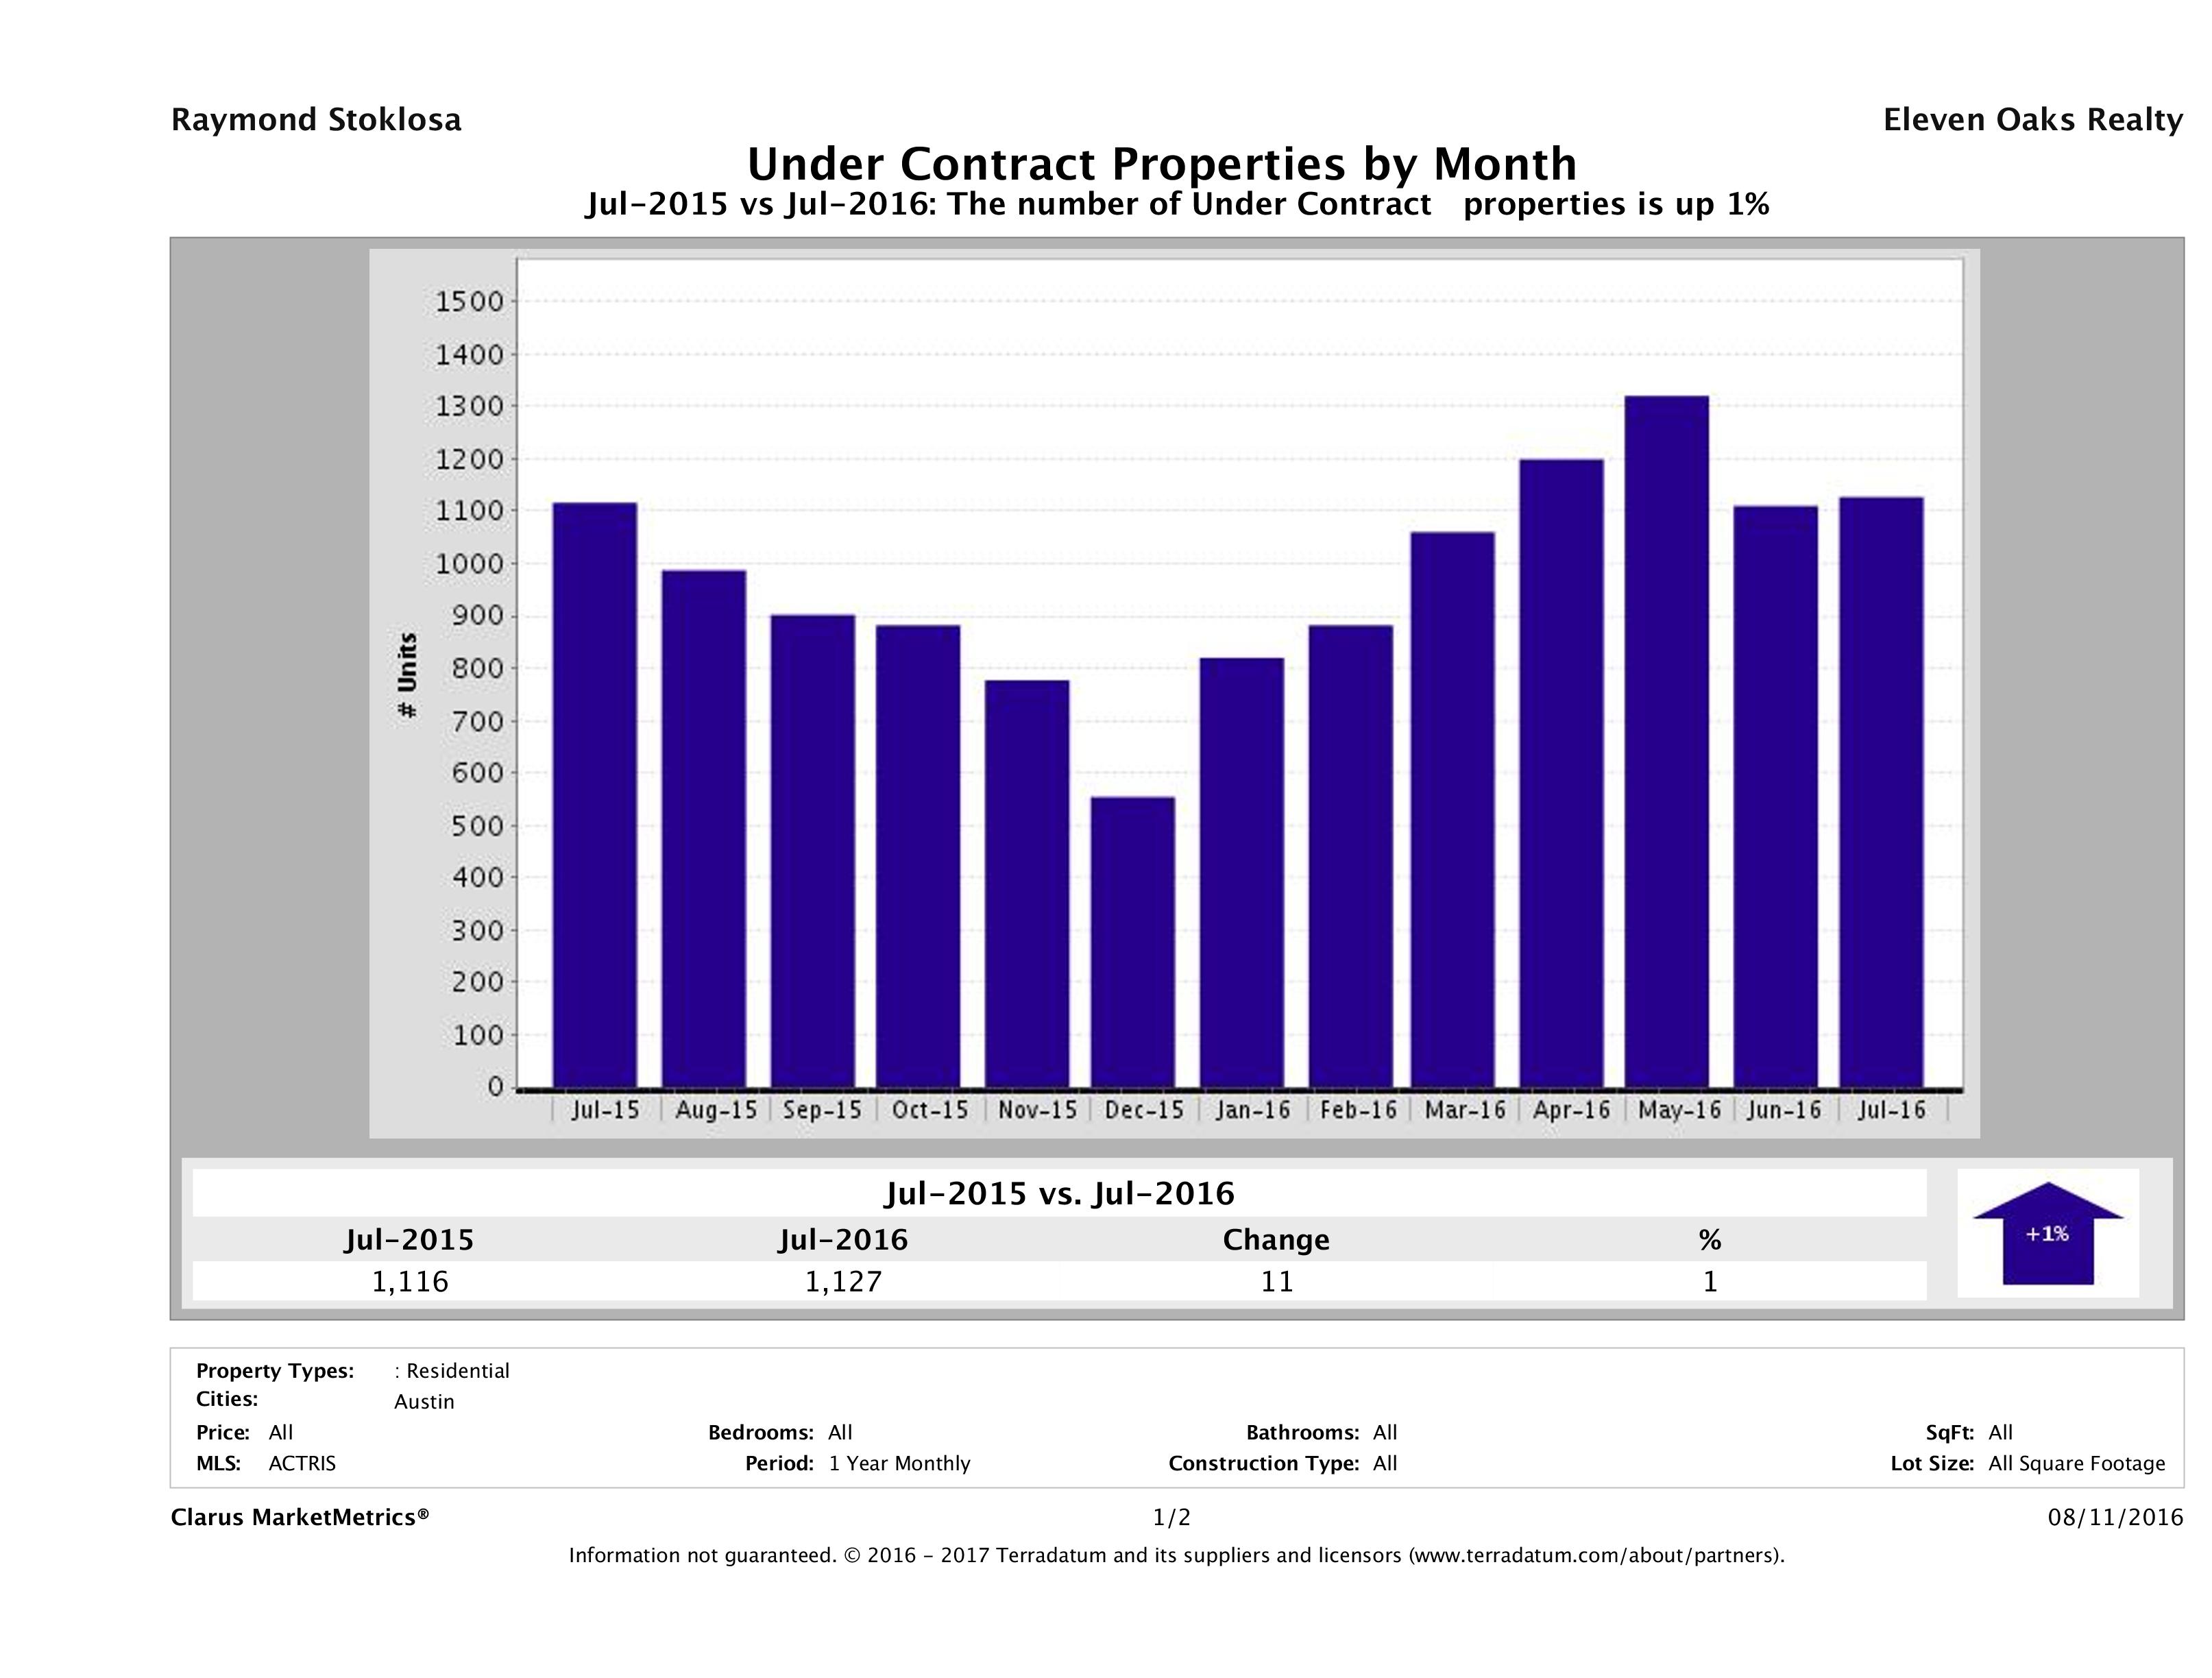
Austin Homes Under Contract Up 1%e
In July 2016, 1,127 homes went pending (under contract) in Austin compared to 1,116 in July 2015, marking a 1% (11 home) increase in year over year numbers.
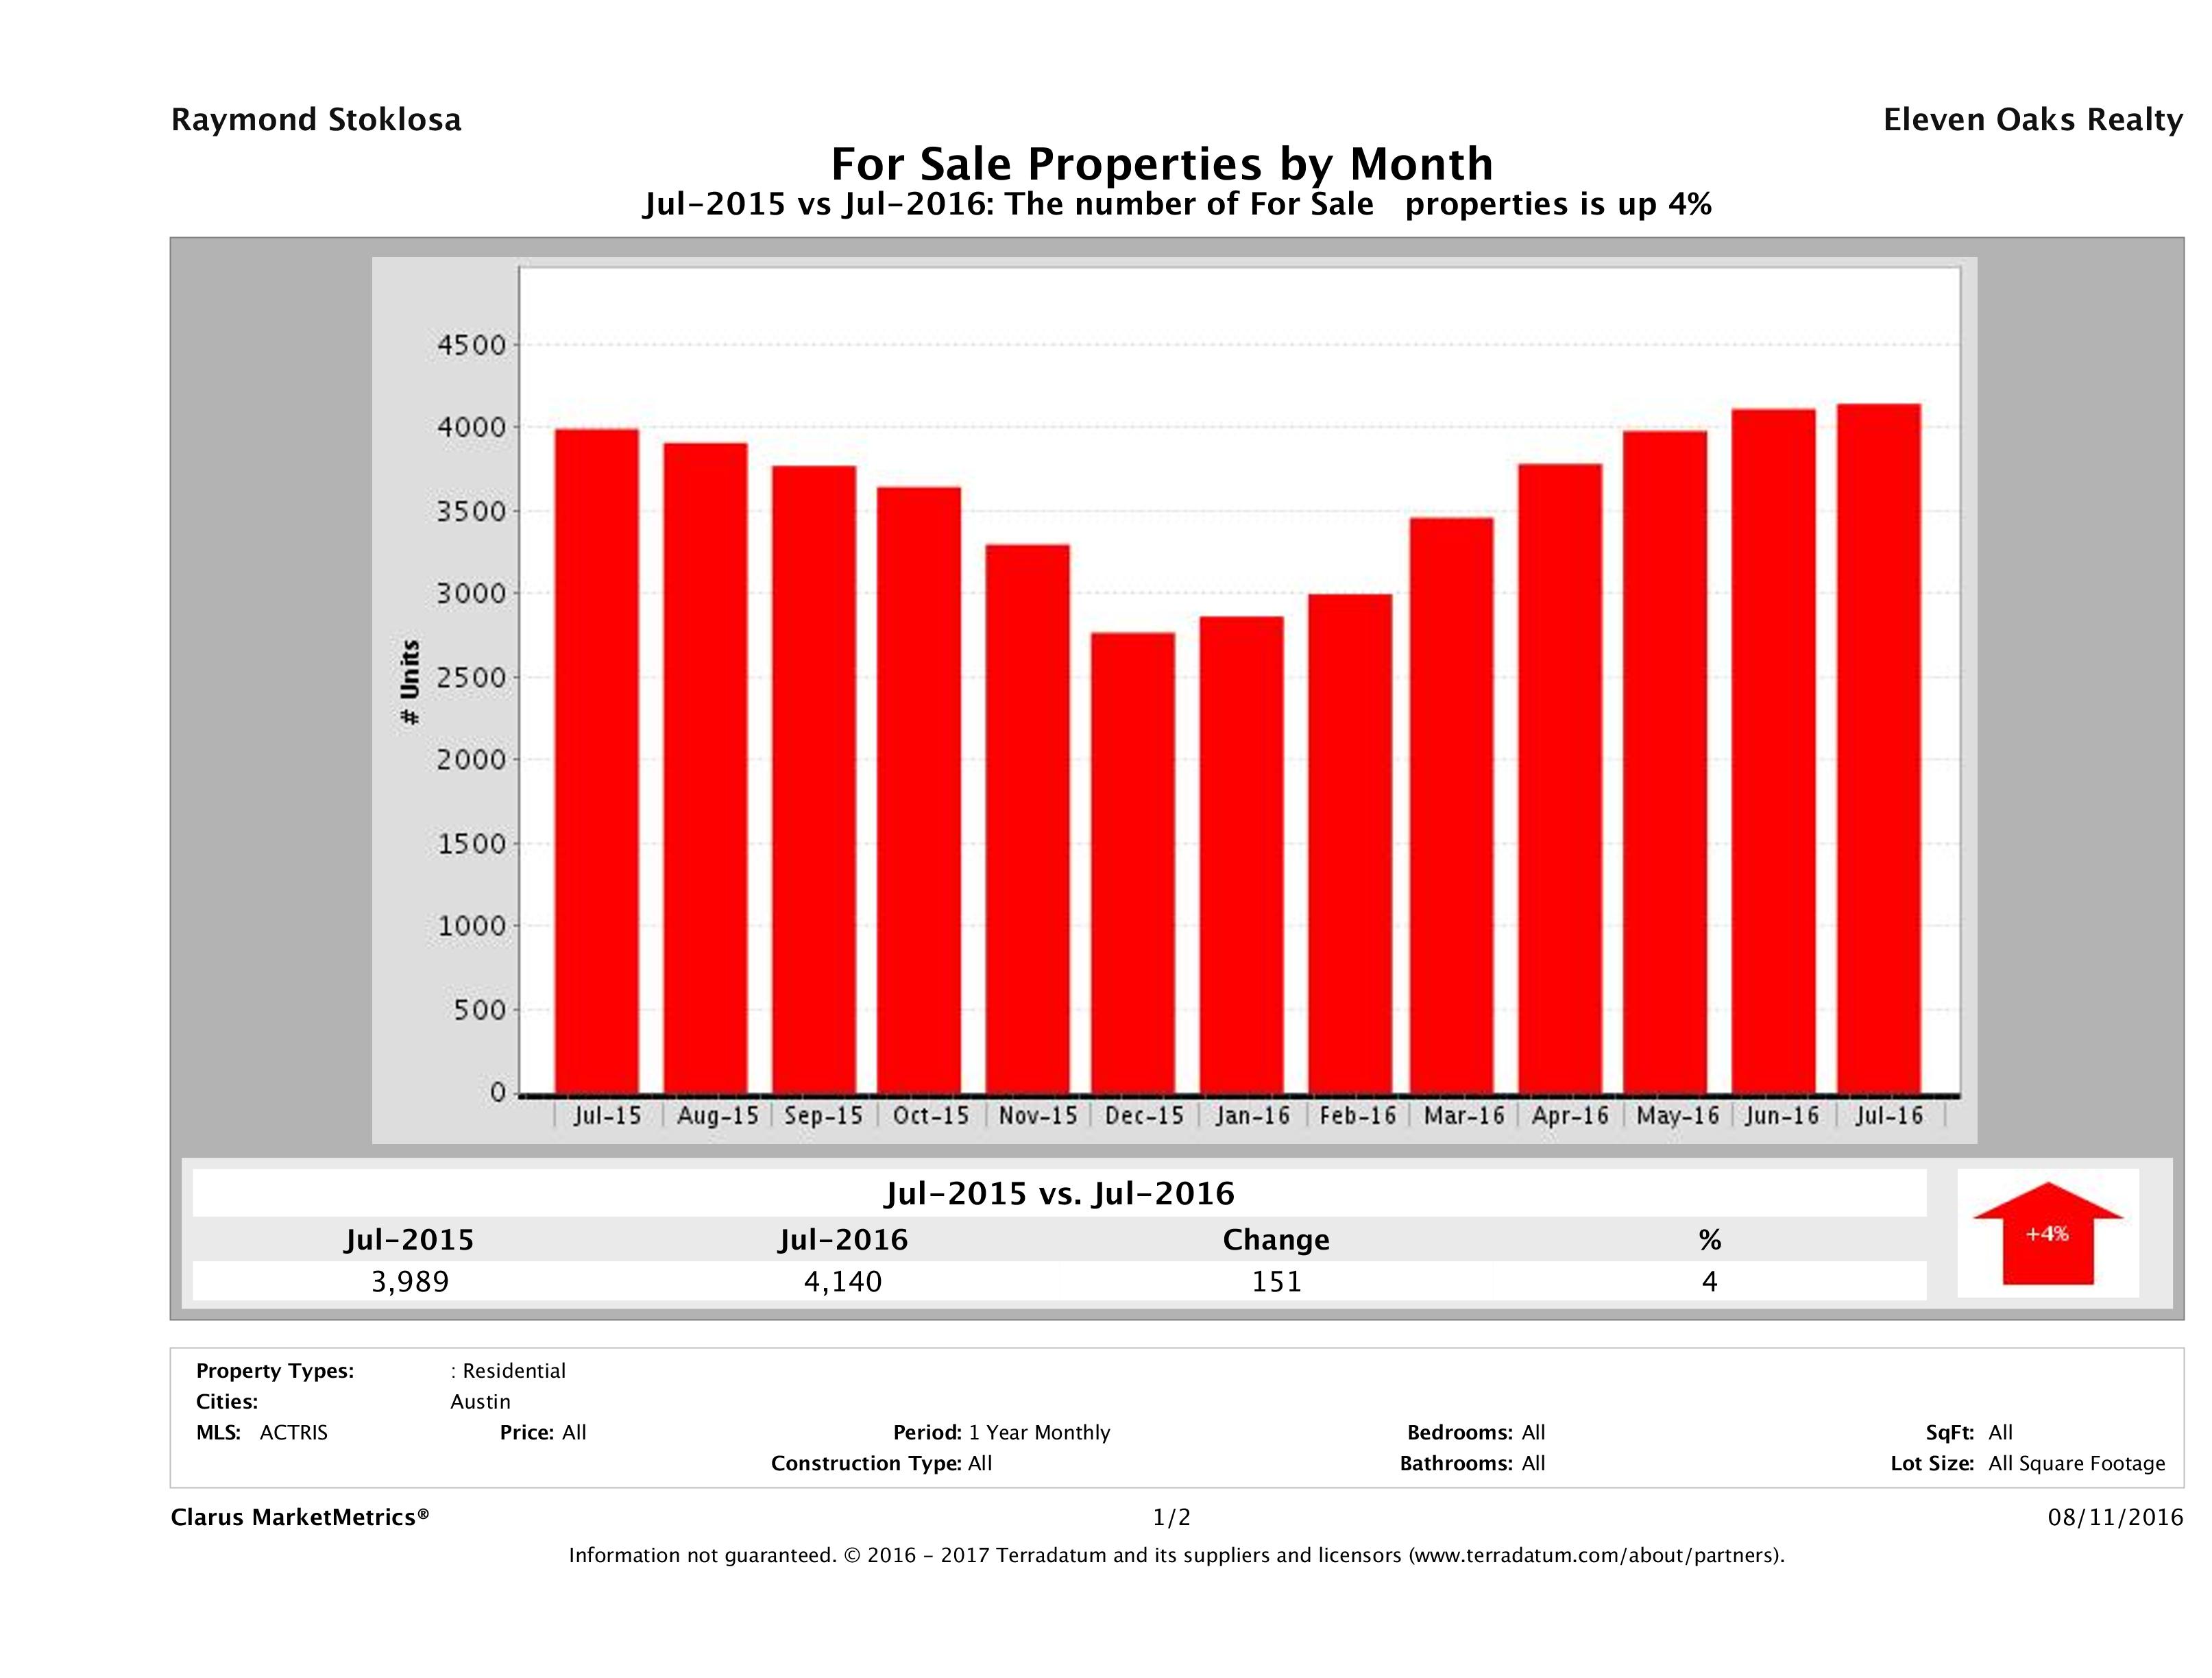
4% Increase in Number of Homes on the Market
In July 2016, we had 4,140 homes for sale in Austin, compared to 3,989 in July 2015, showing a 4% (151 home) increase in year over year numbers. Sellers seem to be much more confident in the direction of the market and are listing their homes for sale.
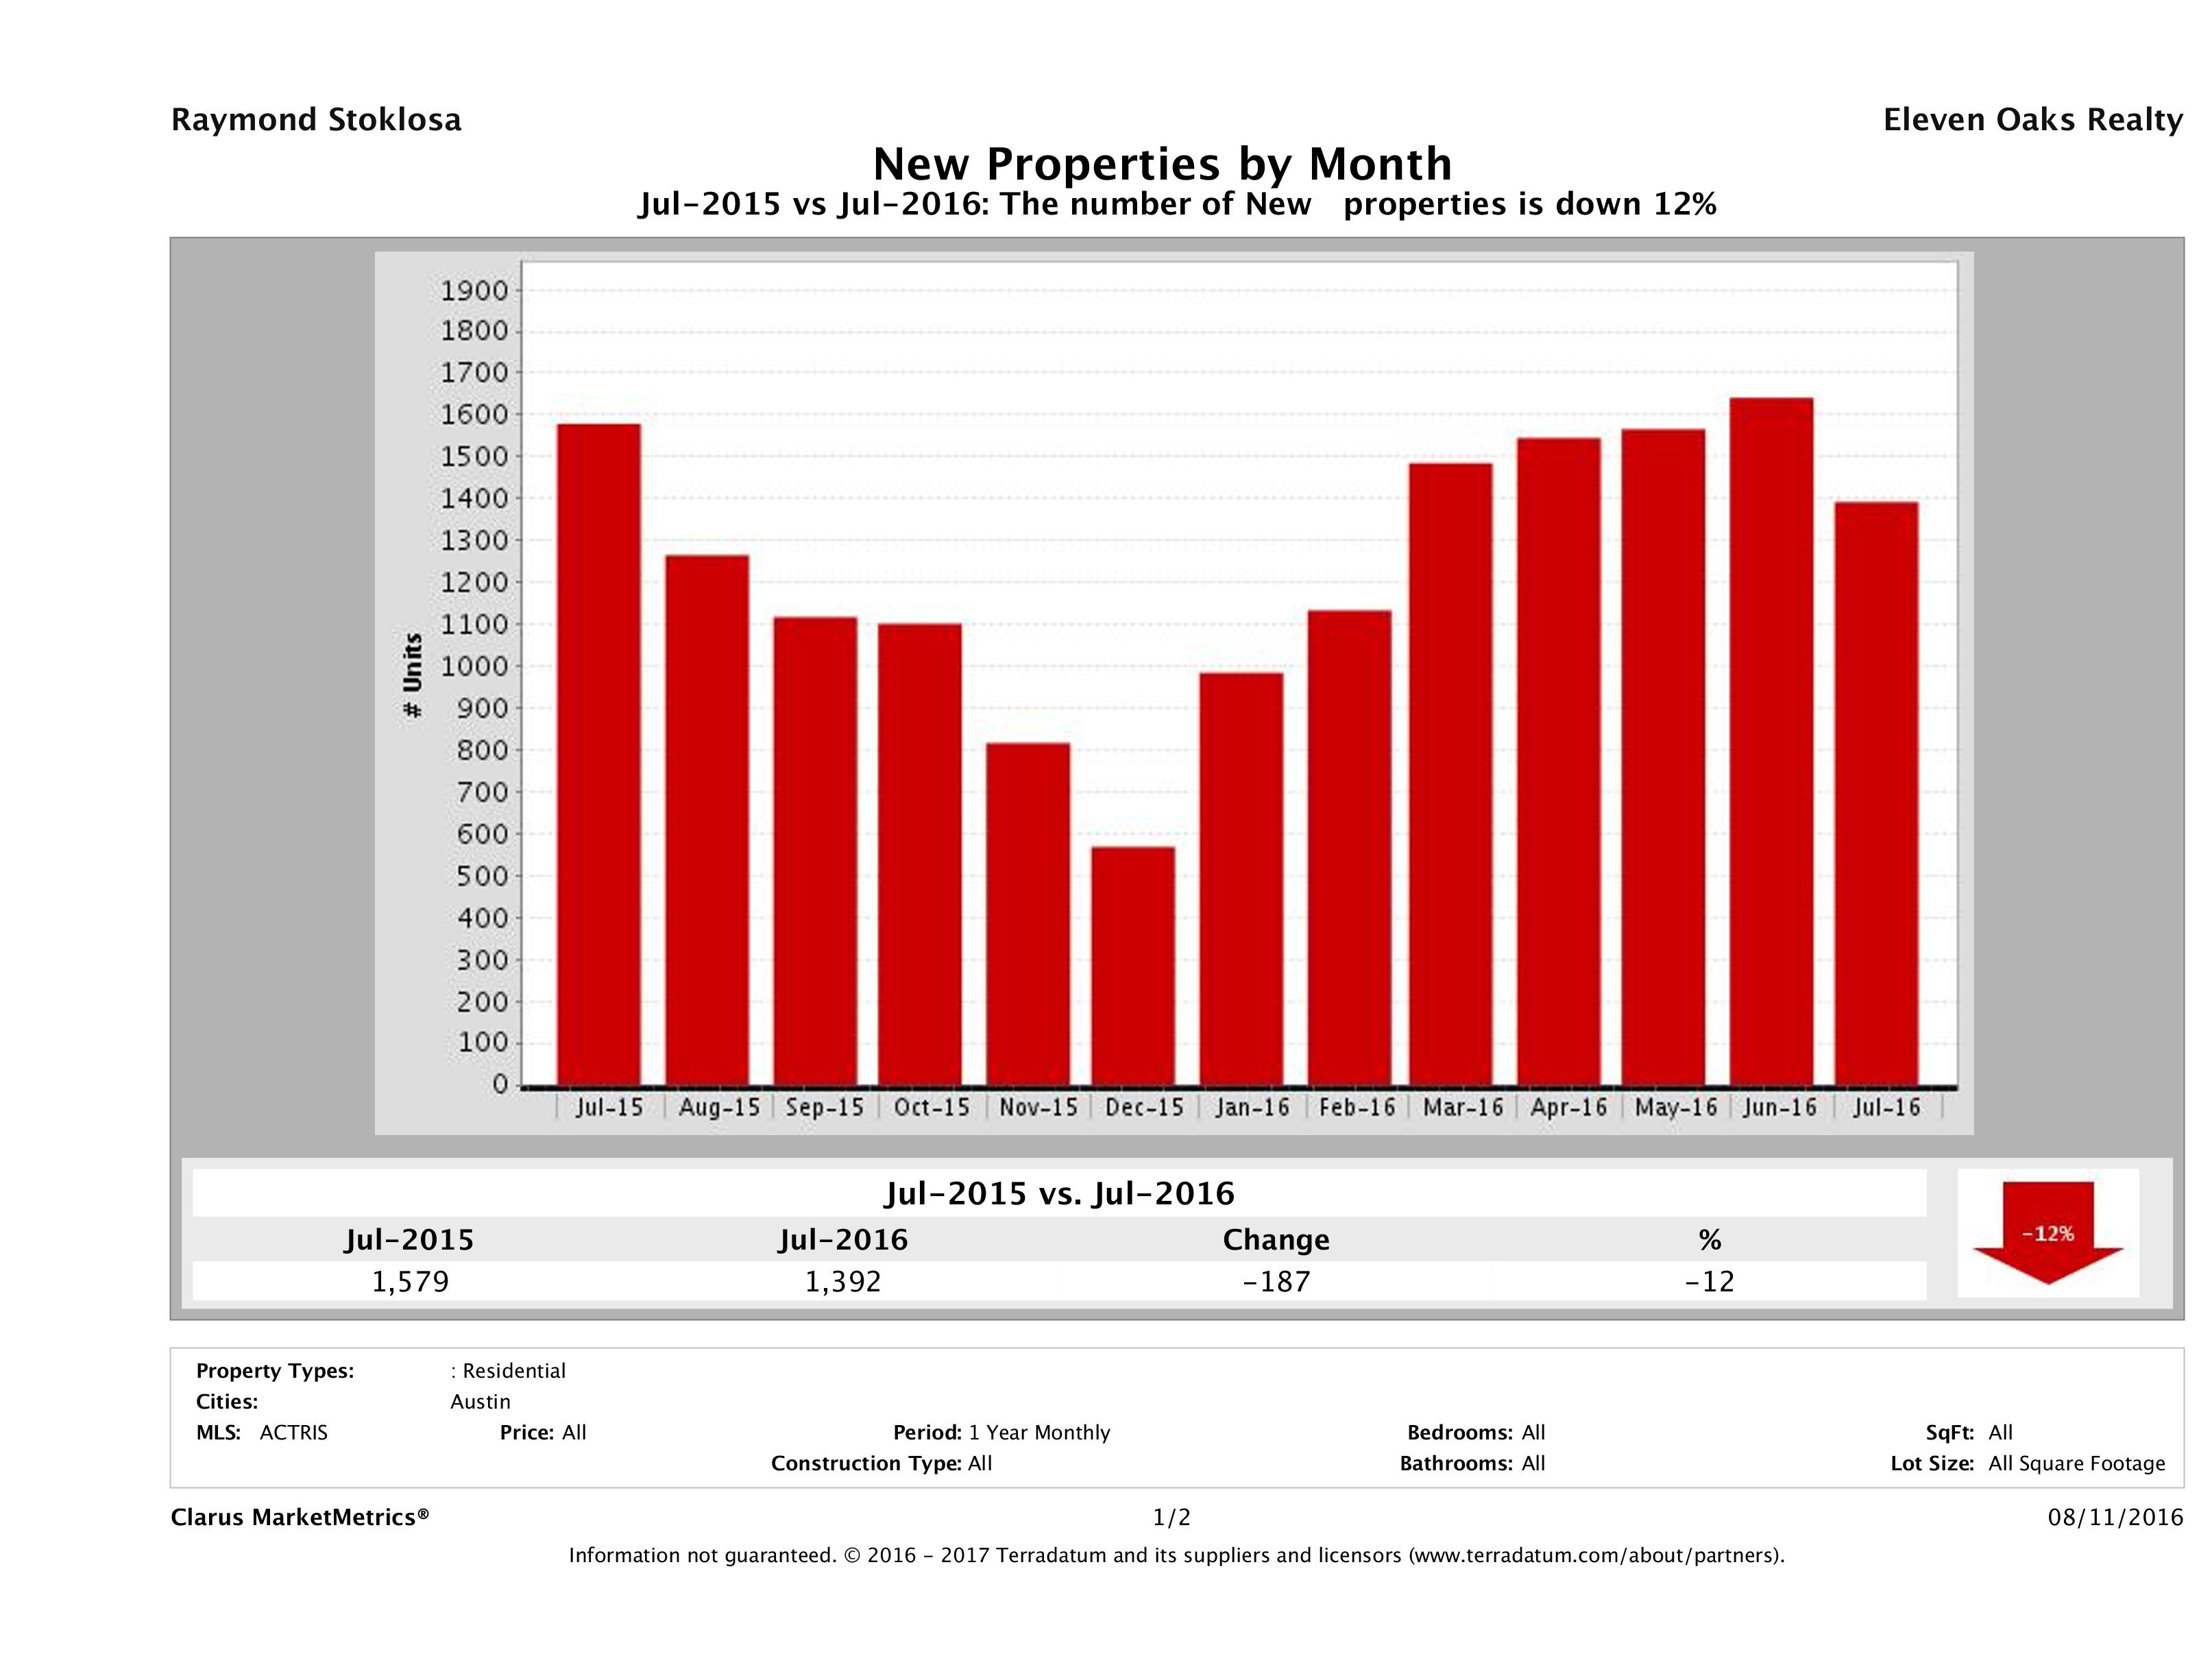
Number of Homes Listed for Sale Down 12%
In July 2016, we saw 1,392 homes introduced to the market compared to 1,579 in July 2015, marking a 12% (187 home) decrease. This month we saw a significant drop off in the number of new listings that came on the market. It will be interesting how that affects supply next month.
Supply Up 4% and Demand is Down 12%
This month we saw a 4% increase in supply (number of properties for sale) and a 12% decrease in demand (number of sold properties). With supply outpacing demand, buyers might have a slight edge in a negotiation.
Median for Sale Up 8% vs Median Sold Price Up 4%
This chart compares the Median for Sale Price vs the Median Sold Price to show their relationship. In Austin, we saw an 8% increase in the median for sale price and a 4% increase in the median sold price of a single family home in year over year numbers. It seems buyers have been able to negotiate a little bit more this month.
Source: Clarus Market Metrics, ACTRIS Sold Data
July 2016 Austin Real Estate Price Report – Strictly Numbers
For those of you who prefer to see the actual numbers, we’ve included the figures for July 2016 Austin home sales below. The most expensive home that sold in July 2016 sold for $8,931,679 and the least expensive home sold for $15,000. Homes ranged in size from 560 sqft – 20,117 sqft with an average size of 2,284 sqft. The average price per square foot for a home that sold in Austin in July 2016 was $203.32 with the lowest being $5.77/sqft and the highest being $1,022.40/sqft. It took, on average, 34 days to sell a home in Austin and sellers received, on average, 97.43% of their original list prices.
| Beds | Baths | SqFt | List Price | LP/SqFt | Sold Price | SP/SqFt | SP/LP | SP/OLP | ADOM | |
|---|---|---|---|---|---|---|---|---|---|---|
| Min | 1 | 1 | 560 | $19,900 | $7.65 | $15,000 | $5.77 | 51.84% | 42.86% | 0 |
| Max | 7 | 14 | 20,117 | $9,900,000 | $1,078.66 | $8,931,679 | $1,022.40 | 125.63% | 122.22% | 446 |
| Avg | 4 | 3 | 2,284 | $462,657 | $206.14 | $453,754 | $203.32 | 98.91% | 97.43% | 34 |
| Median | 3 | 3 | 2,103 | $371,945 | $175.67 | $362,500 | $174,18 | 99.37% | 98.73% | 10 |
| Search Criteria | |||
|---|---|---|---|
| Status | Sold | Sold Date | July 2016 |
| Property Type | Single Family Homes | Number Sold | 1,066 |
| Source: | ABoR Sales Data | Area | Austin |
Time to Buy? Sell?
As we always say, the best time to buy or sell a home is when you need to buy or sell. If you have a house to buy, buying when its a sellers market may hurt you on the buying end, but you’ll make it up on the selling end. If you’re trying to get into the market for the first time, the only way you’ll know that we’ve “hit bottom” is when its in the rear view mirror. Work with professionals who can help you analyze your financial and lifestyle to determine if now is the right time to buy or sell.
Looking strictly at the numbers, it appears the recommendation for this month is – it’s time to buy. Again this month, supply outpaced demand, which will give buyers a slight edge over previous years. Inventory is still limited, but has increased compared to last year, giving buyers more choices than they’ve had. If you’re looking to buy, don’t let the average time to sell make you complacent. Remember, this is a city wide number. If you’re wanting to live in a highly desirable neighborhood, you may only get a day or two to make a decision. Buyers who are proactive and decisive about their search can beat slower buyers to the best homes.
If you haven’t started your home search, get started now. Though we’re seeing multiple offers, it doesn’t seem to be at the level it was last year. Could be buyers are being more selective with their search or we don’t have as many buyers as we had last year. Start your search now and you’ll have the luxury of more choices without the fierce competitive we have seen in previous years. If you’re looking to buy, we can help you be successful, even in this competitive market. We know the market and know how to get the best deal for a buyer. For more info about buying a home, visit Buy a Home in Austin.
If you need to sell, wait until after Labor Day if you can. August is a historically slow month with kids going back to school. Families are taking their last vacations and are getting their kids settled. After Labor Day, they’ll pick up their home search and be more focused. Take August to prepare your home to sell and you’ll be ready when buyers are back in the market.
If you’re a seller who needs to sell, work with a professional Realtor who can help you position your home as the best value on the market. There are still highly motivated buyers in the market who are ready to make stronger offers than they were last year. With 2.4 months of inventory, we are still in a seller’s market. Check out our 88 Ways to Sell Your Home Faster and For More Money for some tips on how you can prepare your home to meet the market. For more info about our Home Selling Program and why it is the best in Austin, check out Sell My Austin Home.
Curious How Much You Could Sell Your Austin Home For?
Our Market Snapshot Tool is for you. With just your zip code, we’ll email you a detailed report showing what homes in your neighborhood sold for, how long it took to sell and how the market is trending. Though our Austin Real Estate Price Report is helpful in gauging the overall trend of the market, it doesn’t address neighborhoods specifically. If you’re looking for that type of report, put in your name and zip code below and our system will email you a Neighborhood Market Report.
Questions About the Austin Real Estate Price Report?
Do you have questions about this Austin Real Estate Price Report? Call us at (512) 827-8323 or email us at info@11OaksRealty.com and we’ll help you in any way we can. If you’re looking to buy or sell Austin real estate, don’t forget to check out our Buyer Resources and our Seller Resources for more tips.
Leave a Reply