Eleven Oaks Realty is proud to present their August 2016 Austin Real Estate Price Report measuring activity in the Austin single family home market.
Austin Median Home Price Up 10%
The biggest story in this month’s Austin Real Estate Price Report comes by way of median home prices. For the 24th month in a row, the median price of a home in Austin outpaced the previous year. The median price of an Austin home in August 2015 was $340,380 compared to $375,000 in August 2016, marking a 10% increase in year over year numbers.
Median home price helps us see the distribution of homes sold and does not really give us an indication of the increase or decrease in a particular home’s market value. To analyze market value, we’d have to take an in depth look at a neighborhood. If you’re looking for something like that, please check out our Austin Home Values Report.
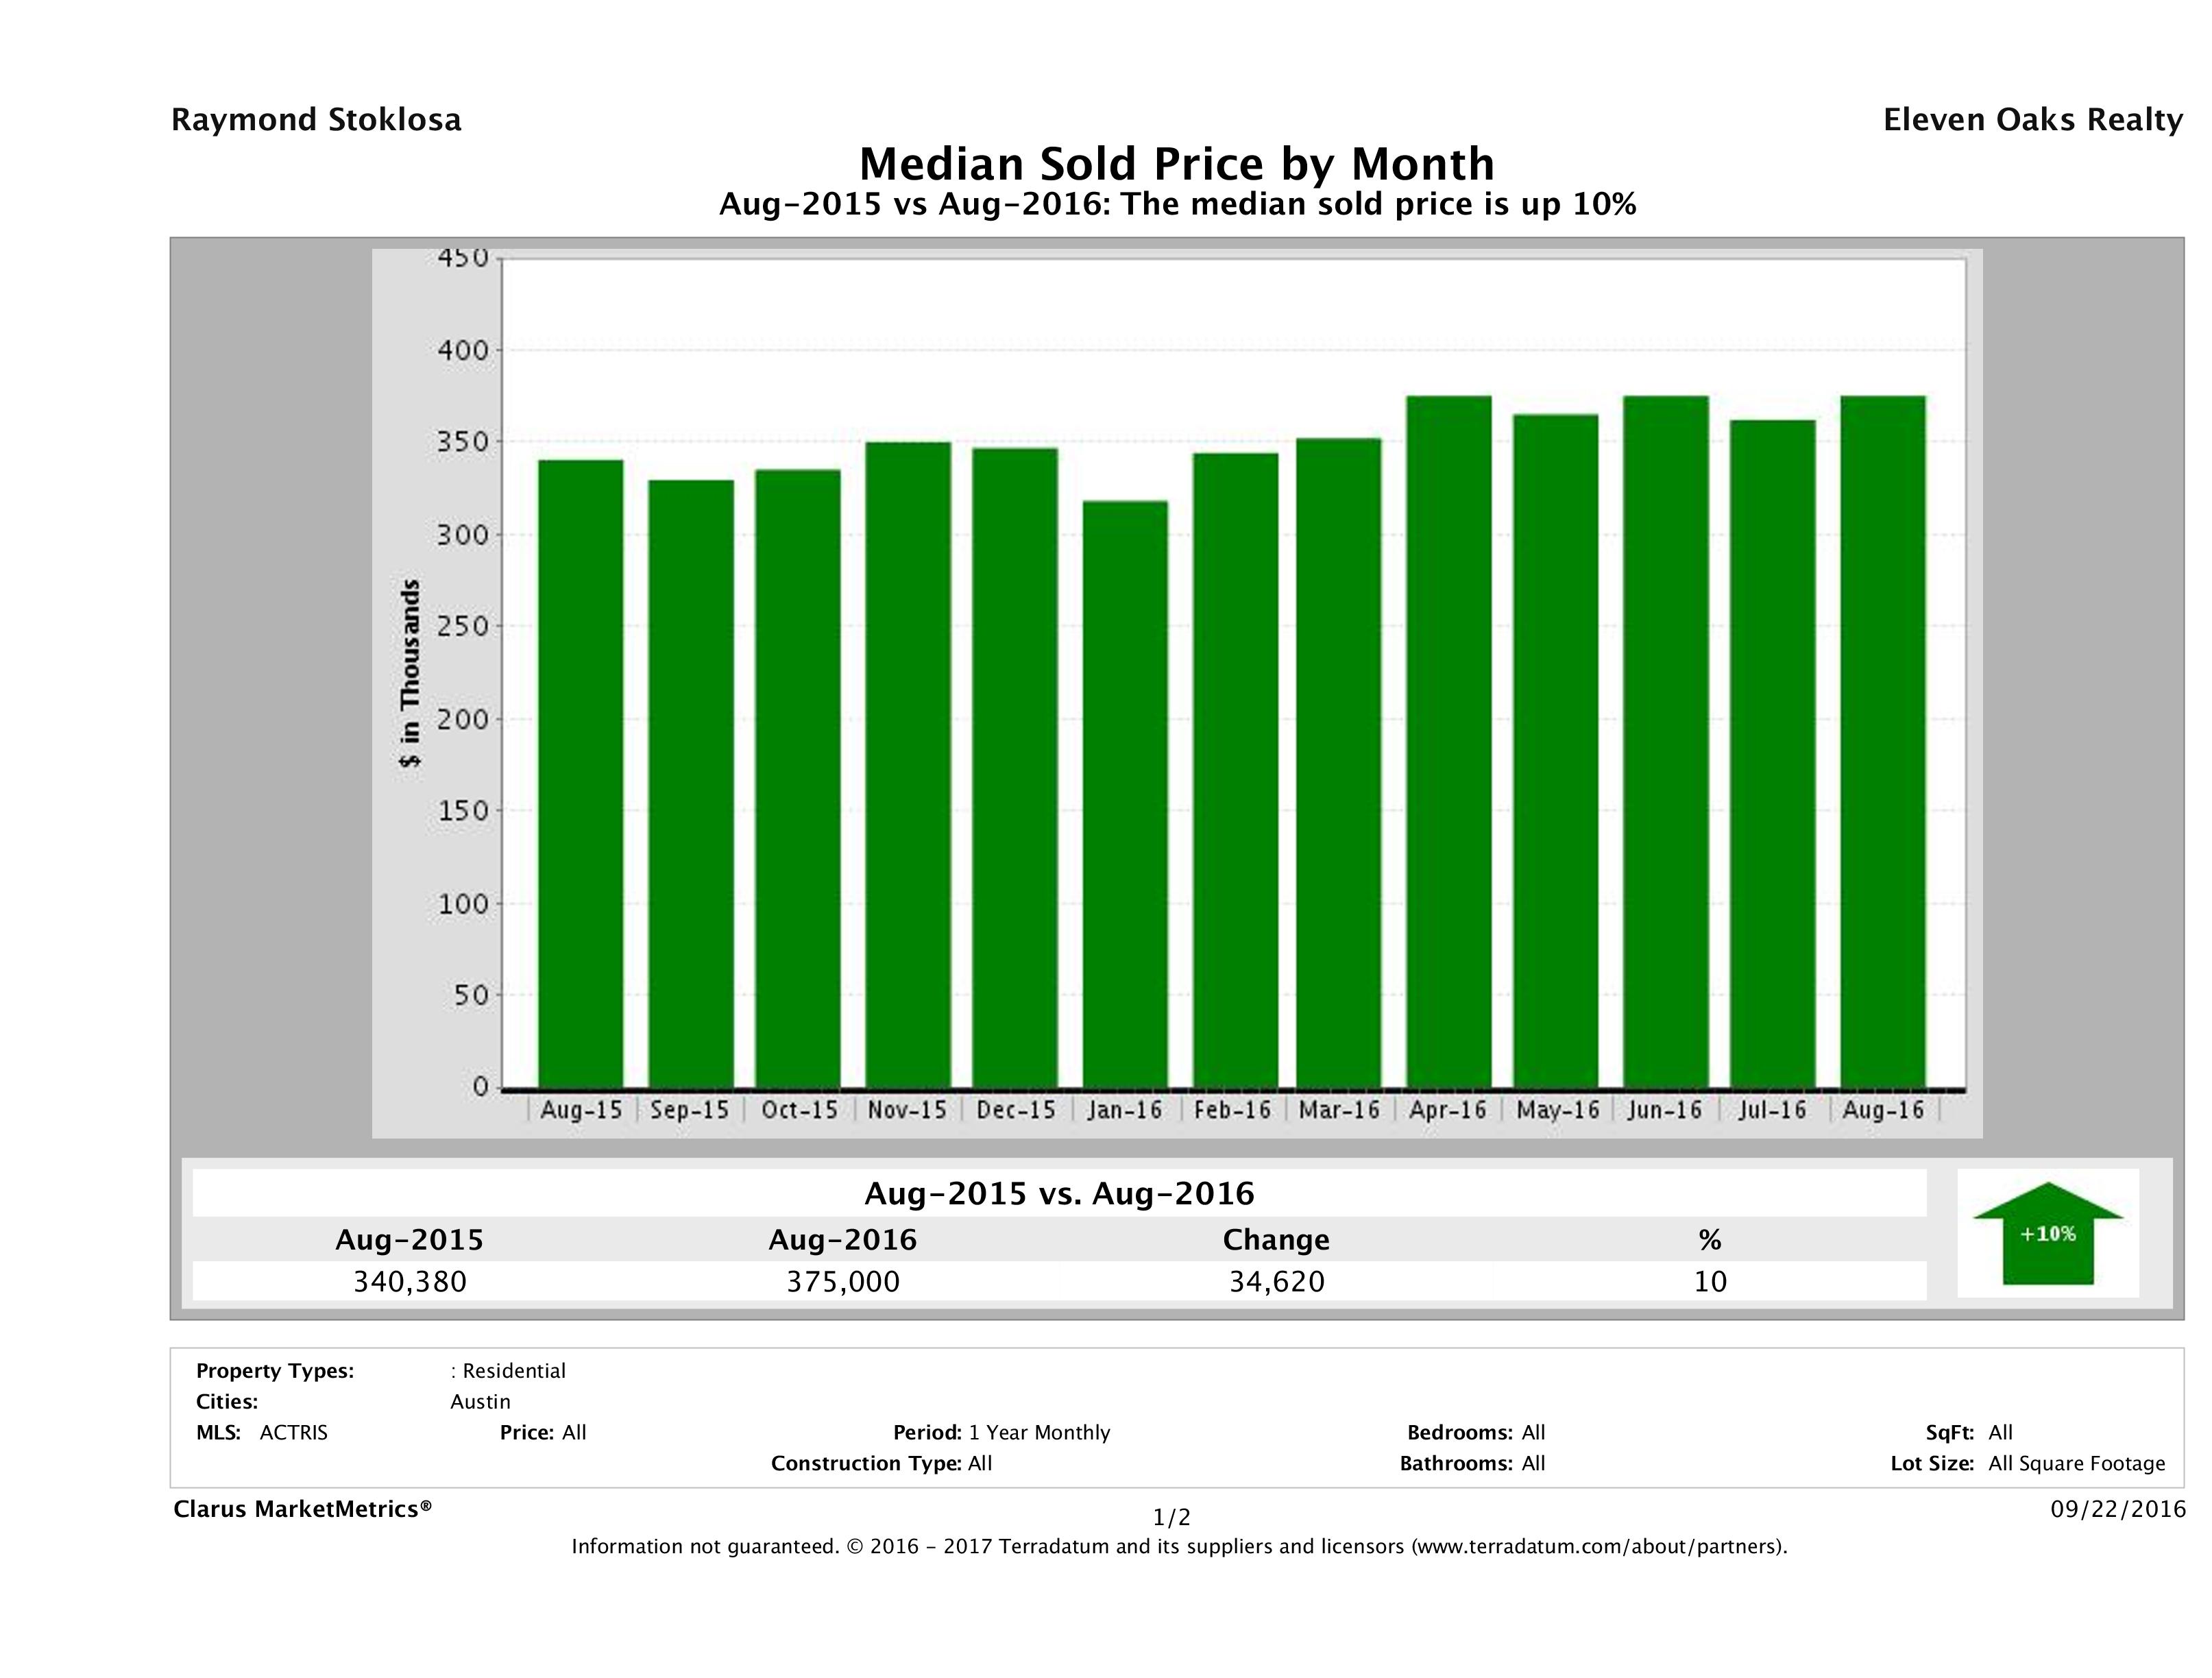
What does this mean to buyers? Prices have gone up steadily for the past two years and it doesn’t look like we’re going to see a pricing slow down any time soon. This month, we saw a pretty significant increase at 10%, especially when you consider August is typically a slower month for sales. Historically, Winter has been the best time of year for buyers in Austin to get a good deal. Get pre-approved now, so you’re ready to go when you find the right house. If you are diligent with your search, you should be able to find a home in your target neighborhood.
What does this mean to sellers? If you’re thinking of selling, take comfort in the fact that buyers are still willing to pay more than they were last year, even during a slower month like August. But, don’t get complacent. Even though prices are going up, that doesn’t mean you just pop a sign in your yard today and cash a big check tomorrow. The most successful sellers spend some time preparing their homes to sell. Work with a Realtor to help you make smart improvements and maximize the return on the dollars you spend preparing your home to meet its next owner.
19% Increase in Time to Sell Home in Austin
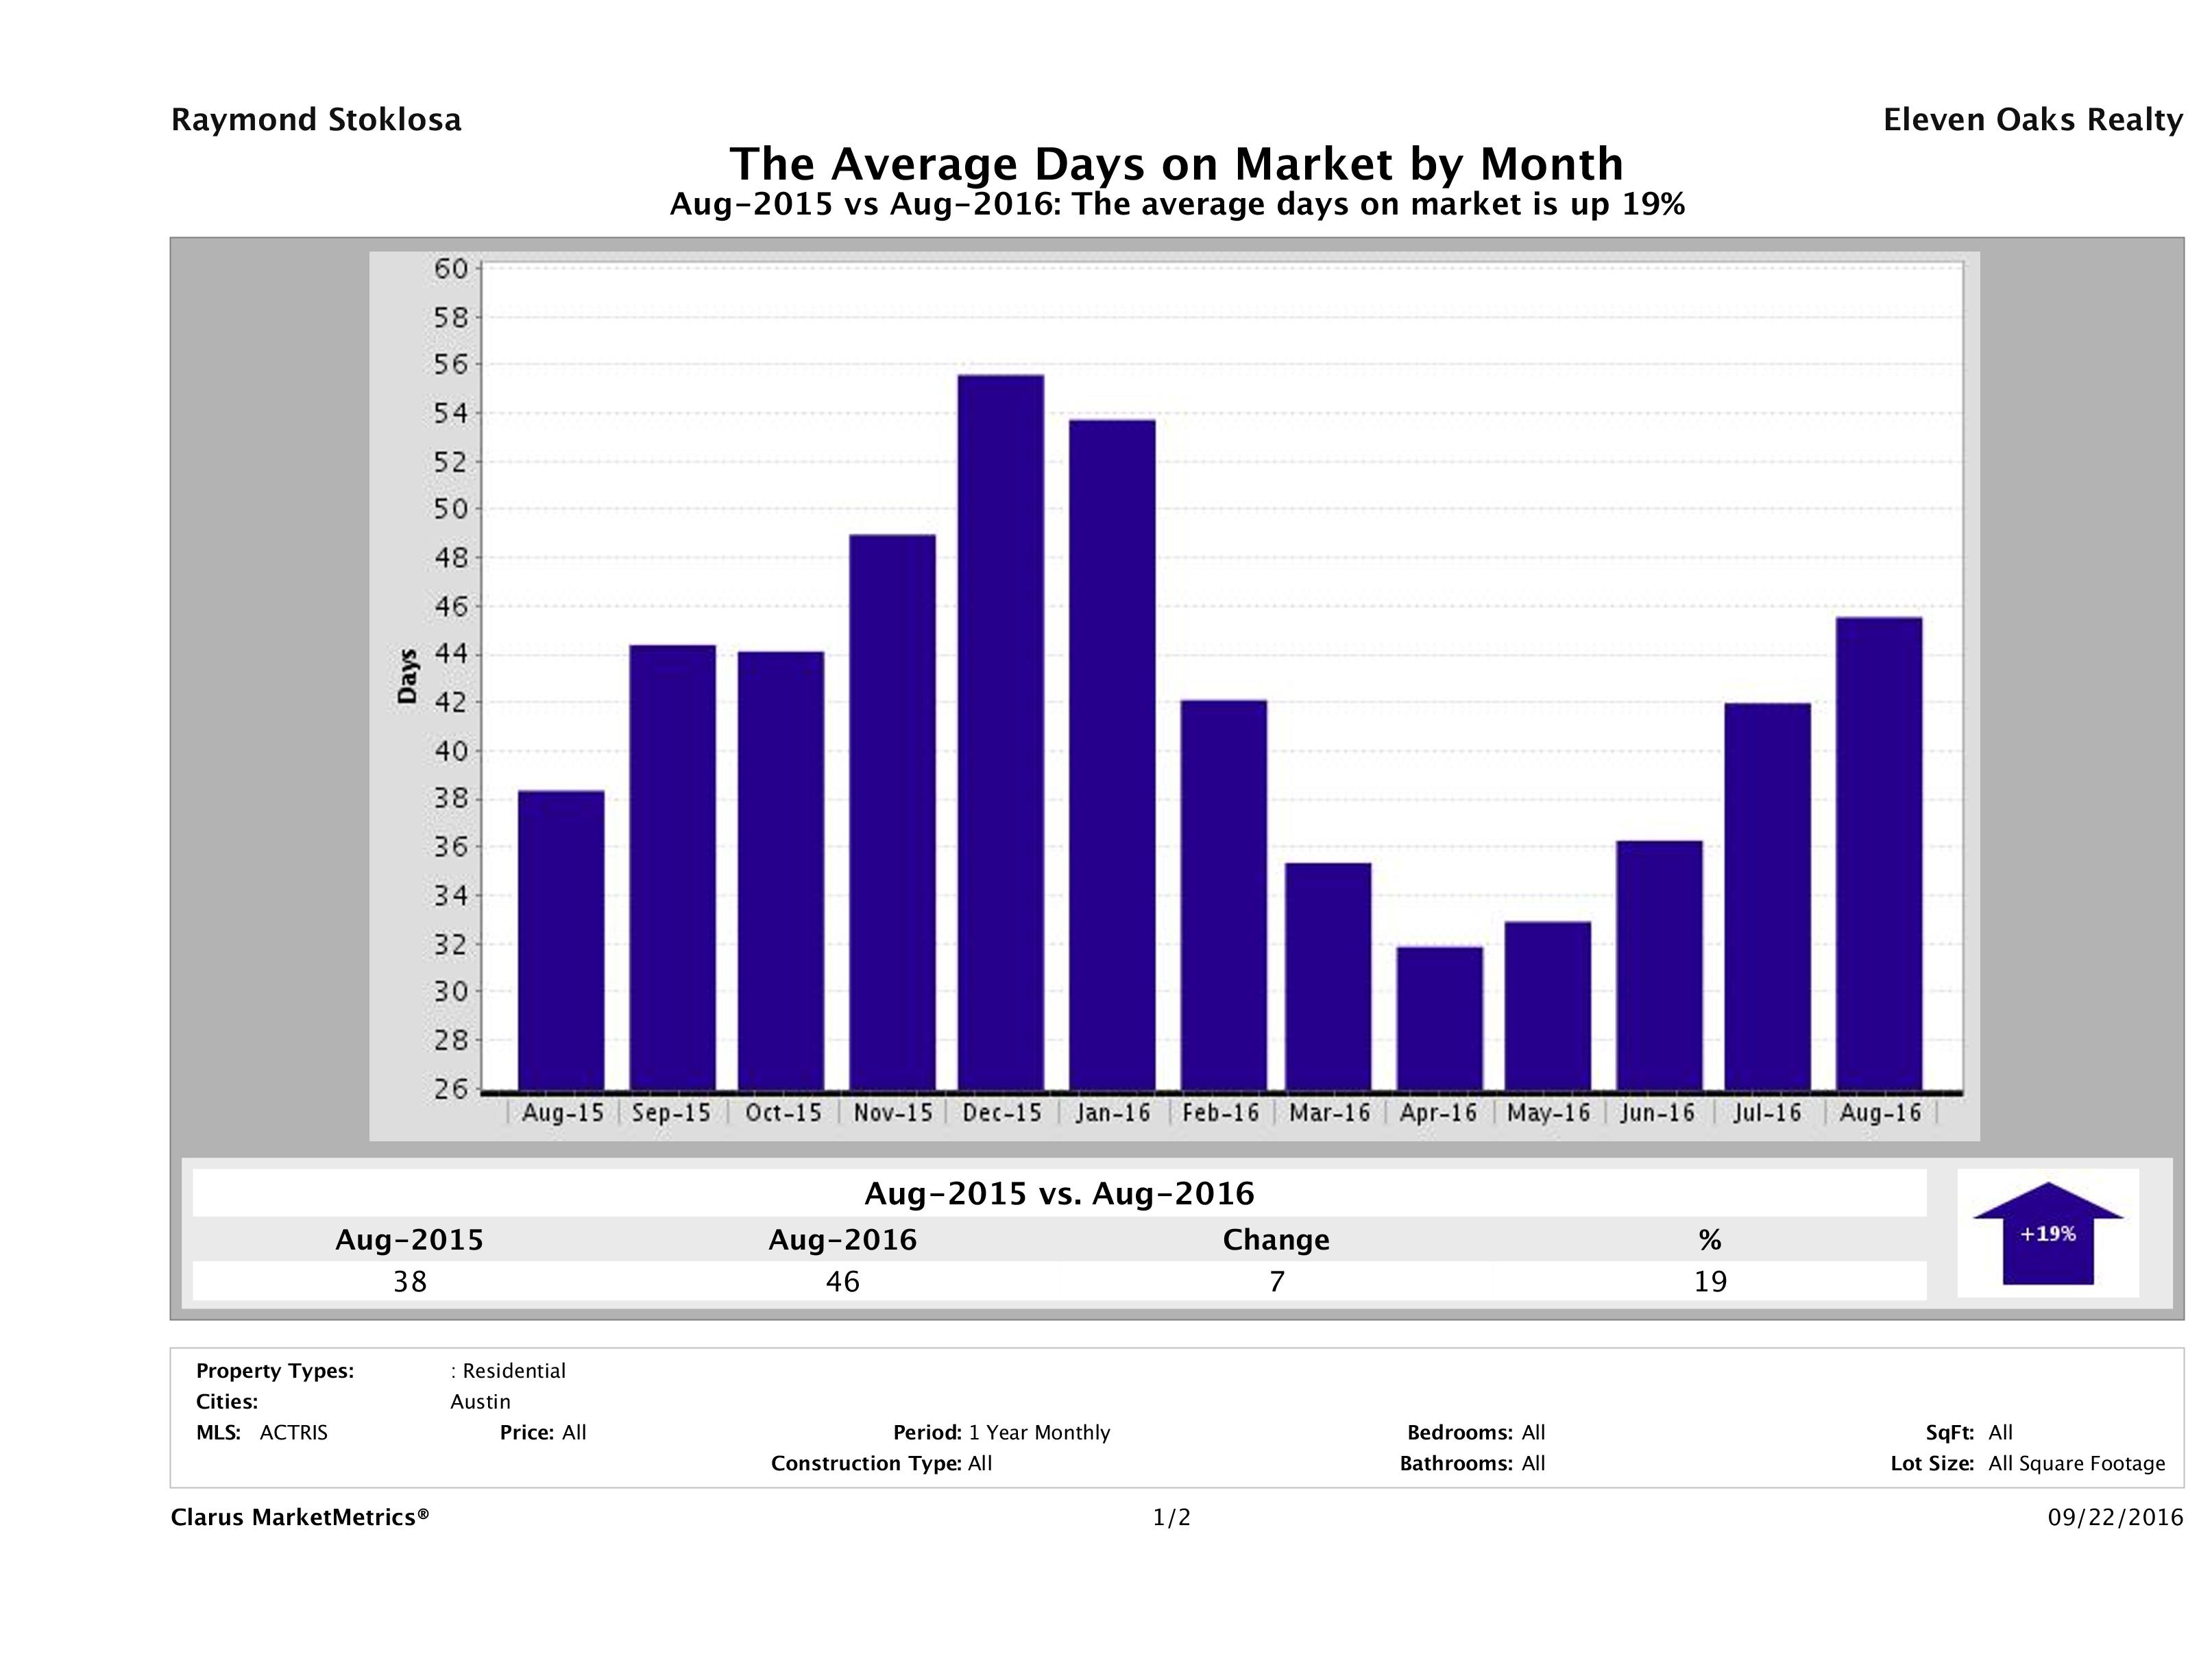
In August 2016, it took 46 days to sell a home in Austin, on average, compared to 38 days in August 2015, marking a 19% increase in year over year numbers. An increase in days on market is a trend we’ve been seeing this year. Though buyers are willing to pay more, they are taking more time to make a decision.
Number of Homes Taken Off the Market Up 29%
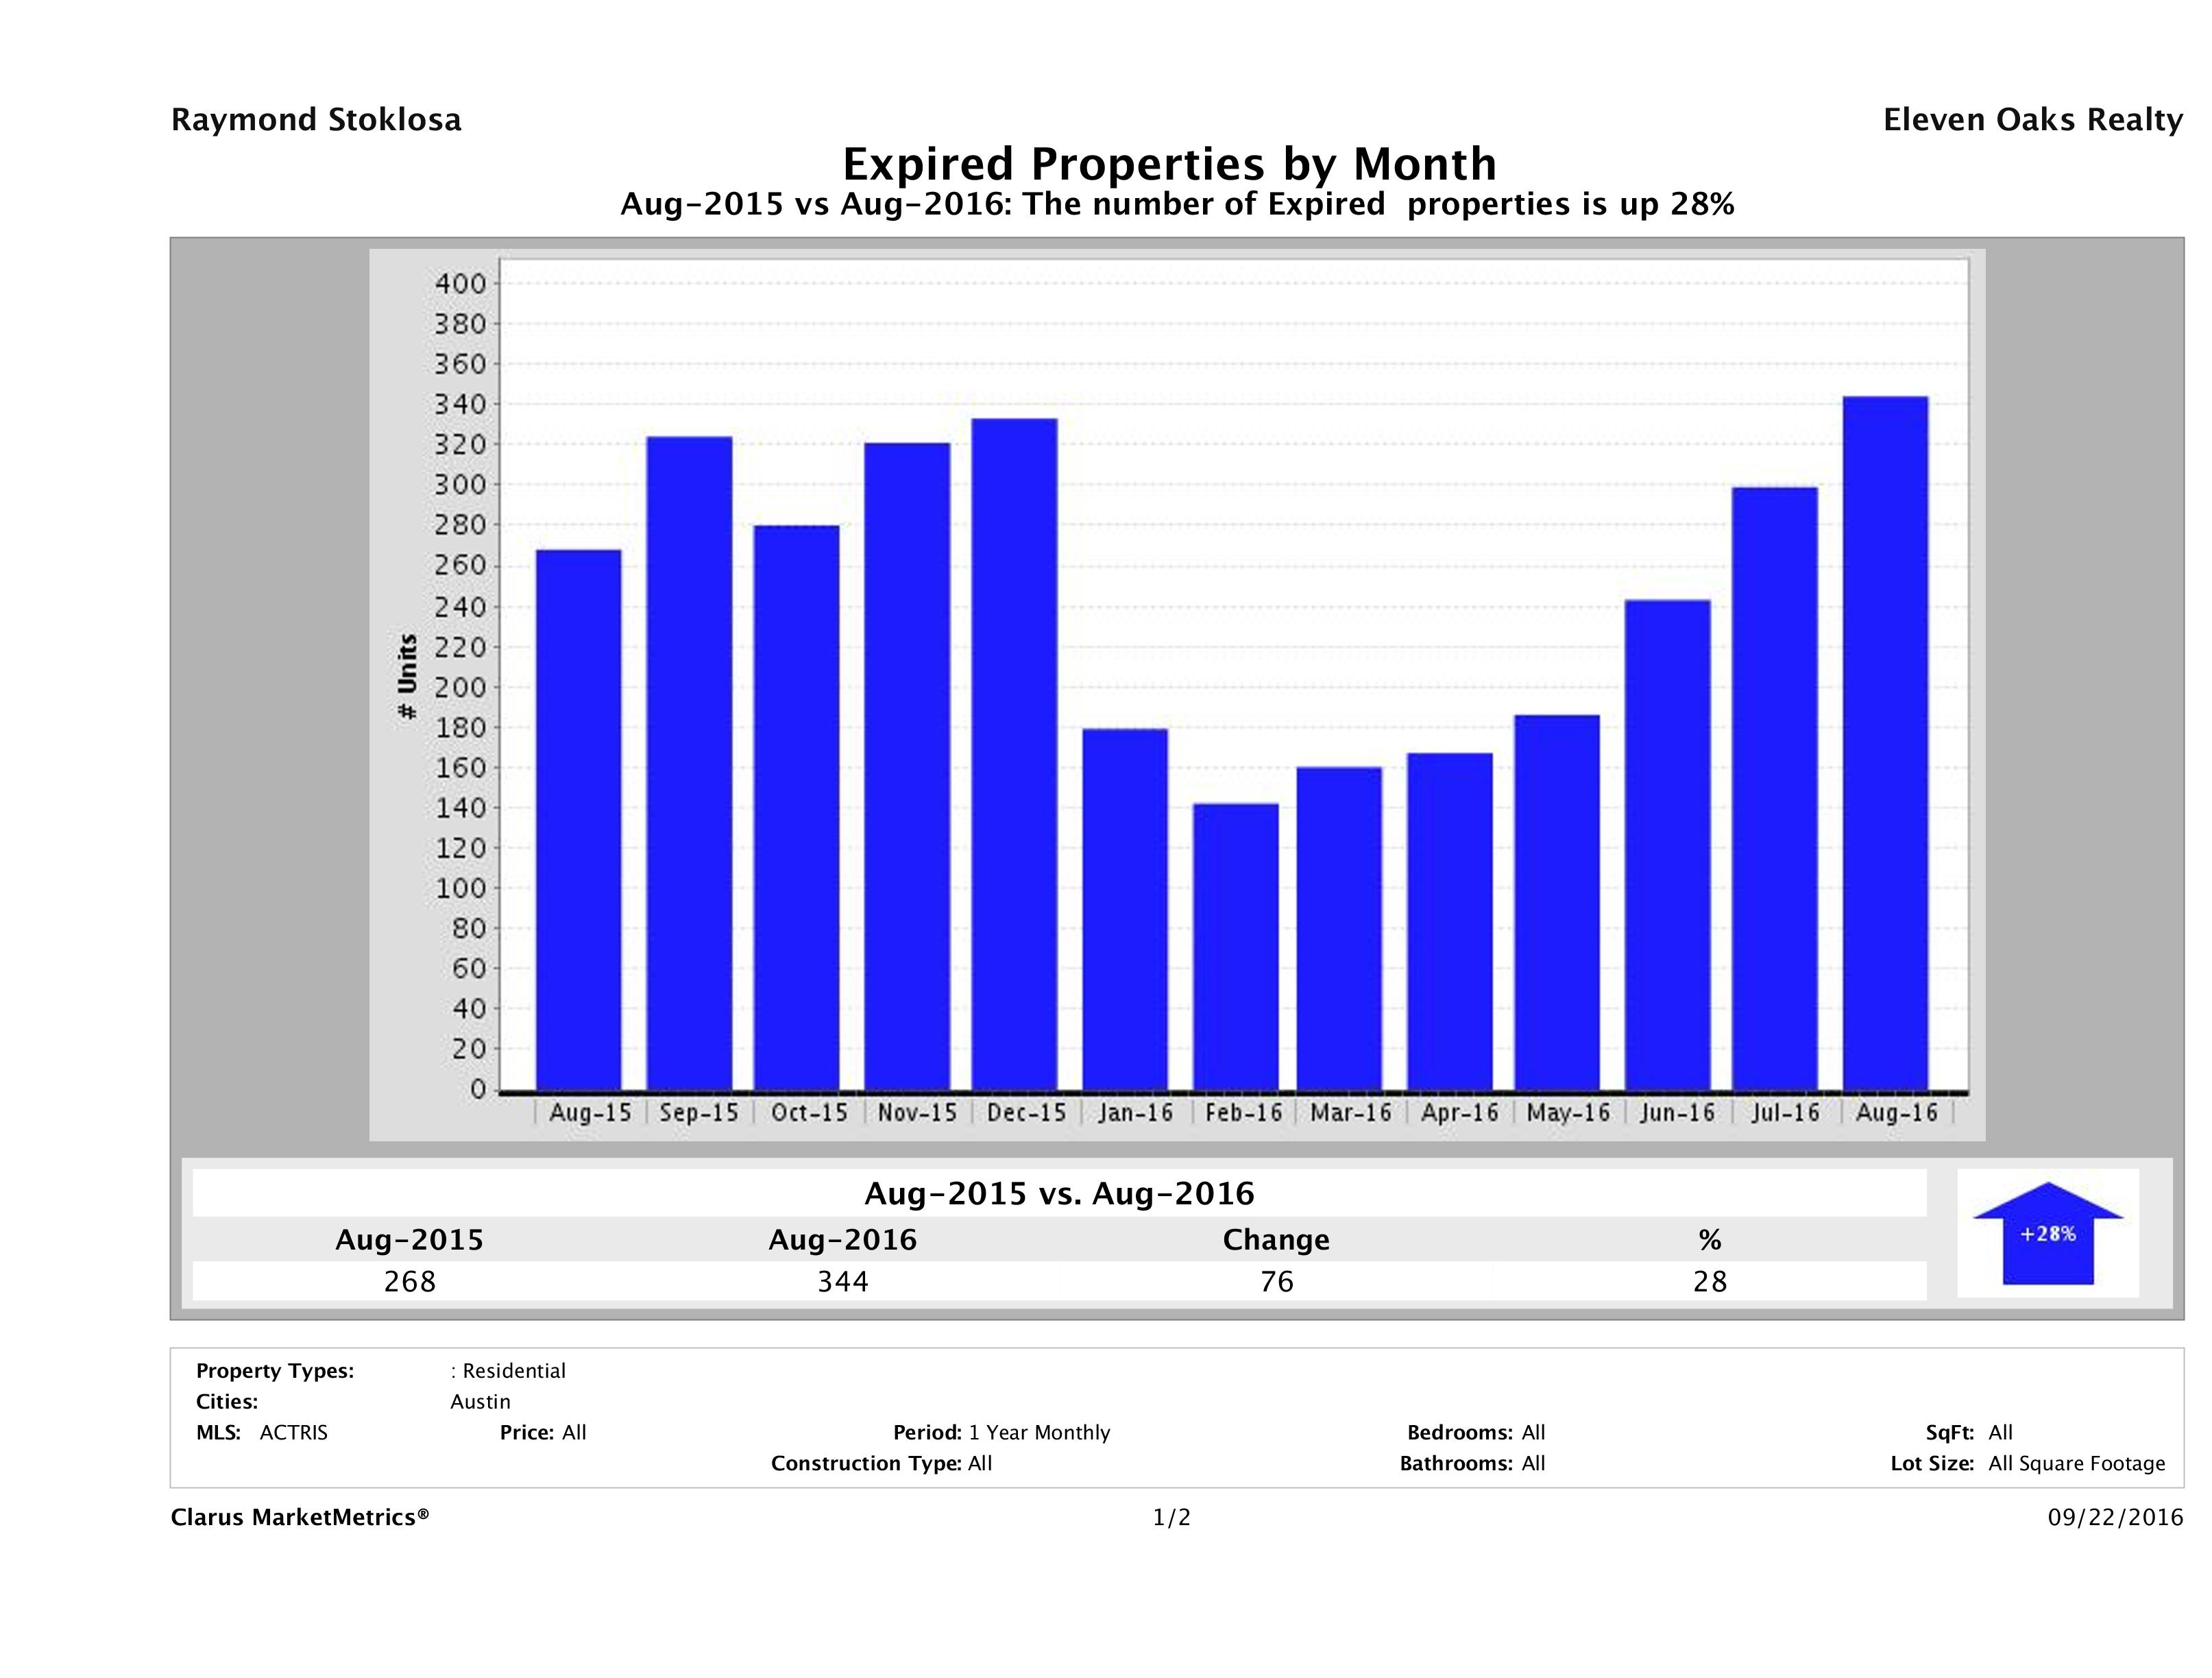
In August 2016, there were 344 homes taken off the market compared to 268 in August 2015. This marked a 28% (76 home) increase in year over year numbers. This increase in the number of homes taken off the market is to be expected in a seller’s market, especially when it has been a seller’s market for a few years. Sellers have their eyes on a big number and when they can’t get it, they take their homes off the market rather than adjusting the price to a number that is acceptable to the market.
If you need to sell and your home was priced right, maybe there was something else going on. The biggest culprits we see are incorrect info in the MLS and poor marketing. Check out our Austin Home Marketing Plan to see how your homes would be marketed.
Having trouble selling your home? Check out our Austin Home Not Selling resources page to find out why.
3% Increase in the Number of Sold Homes in Austin
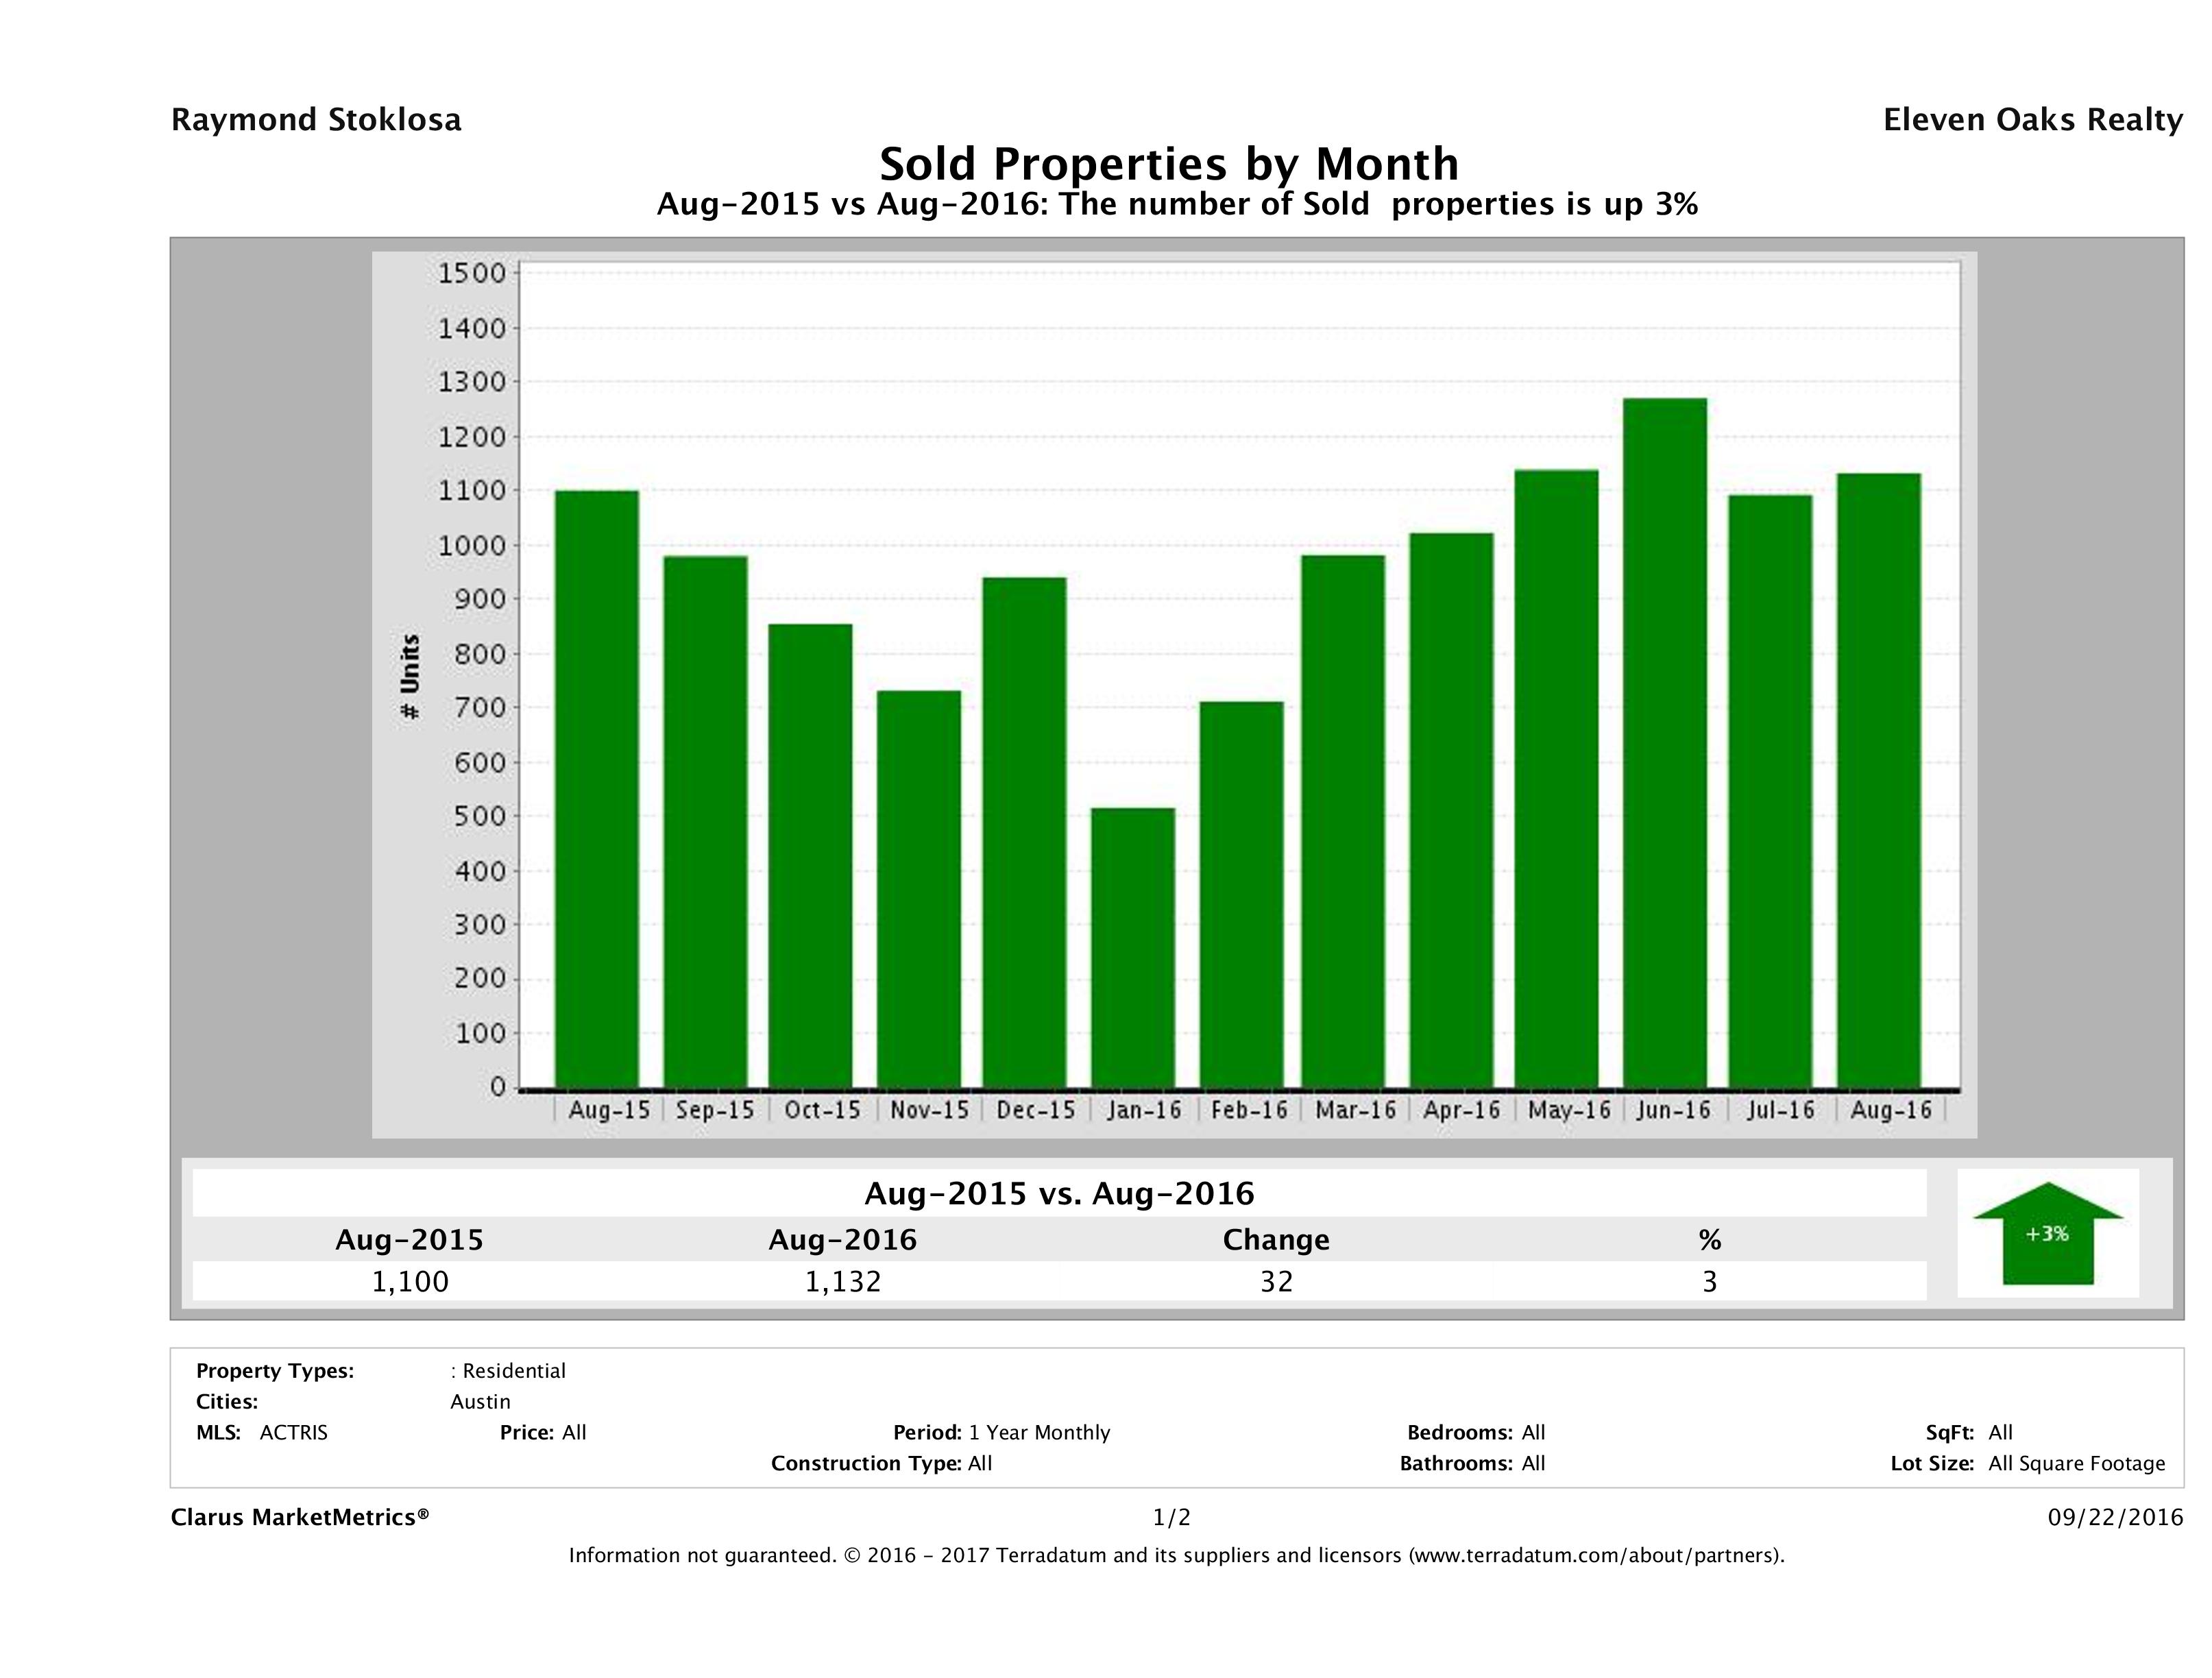
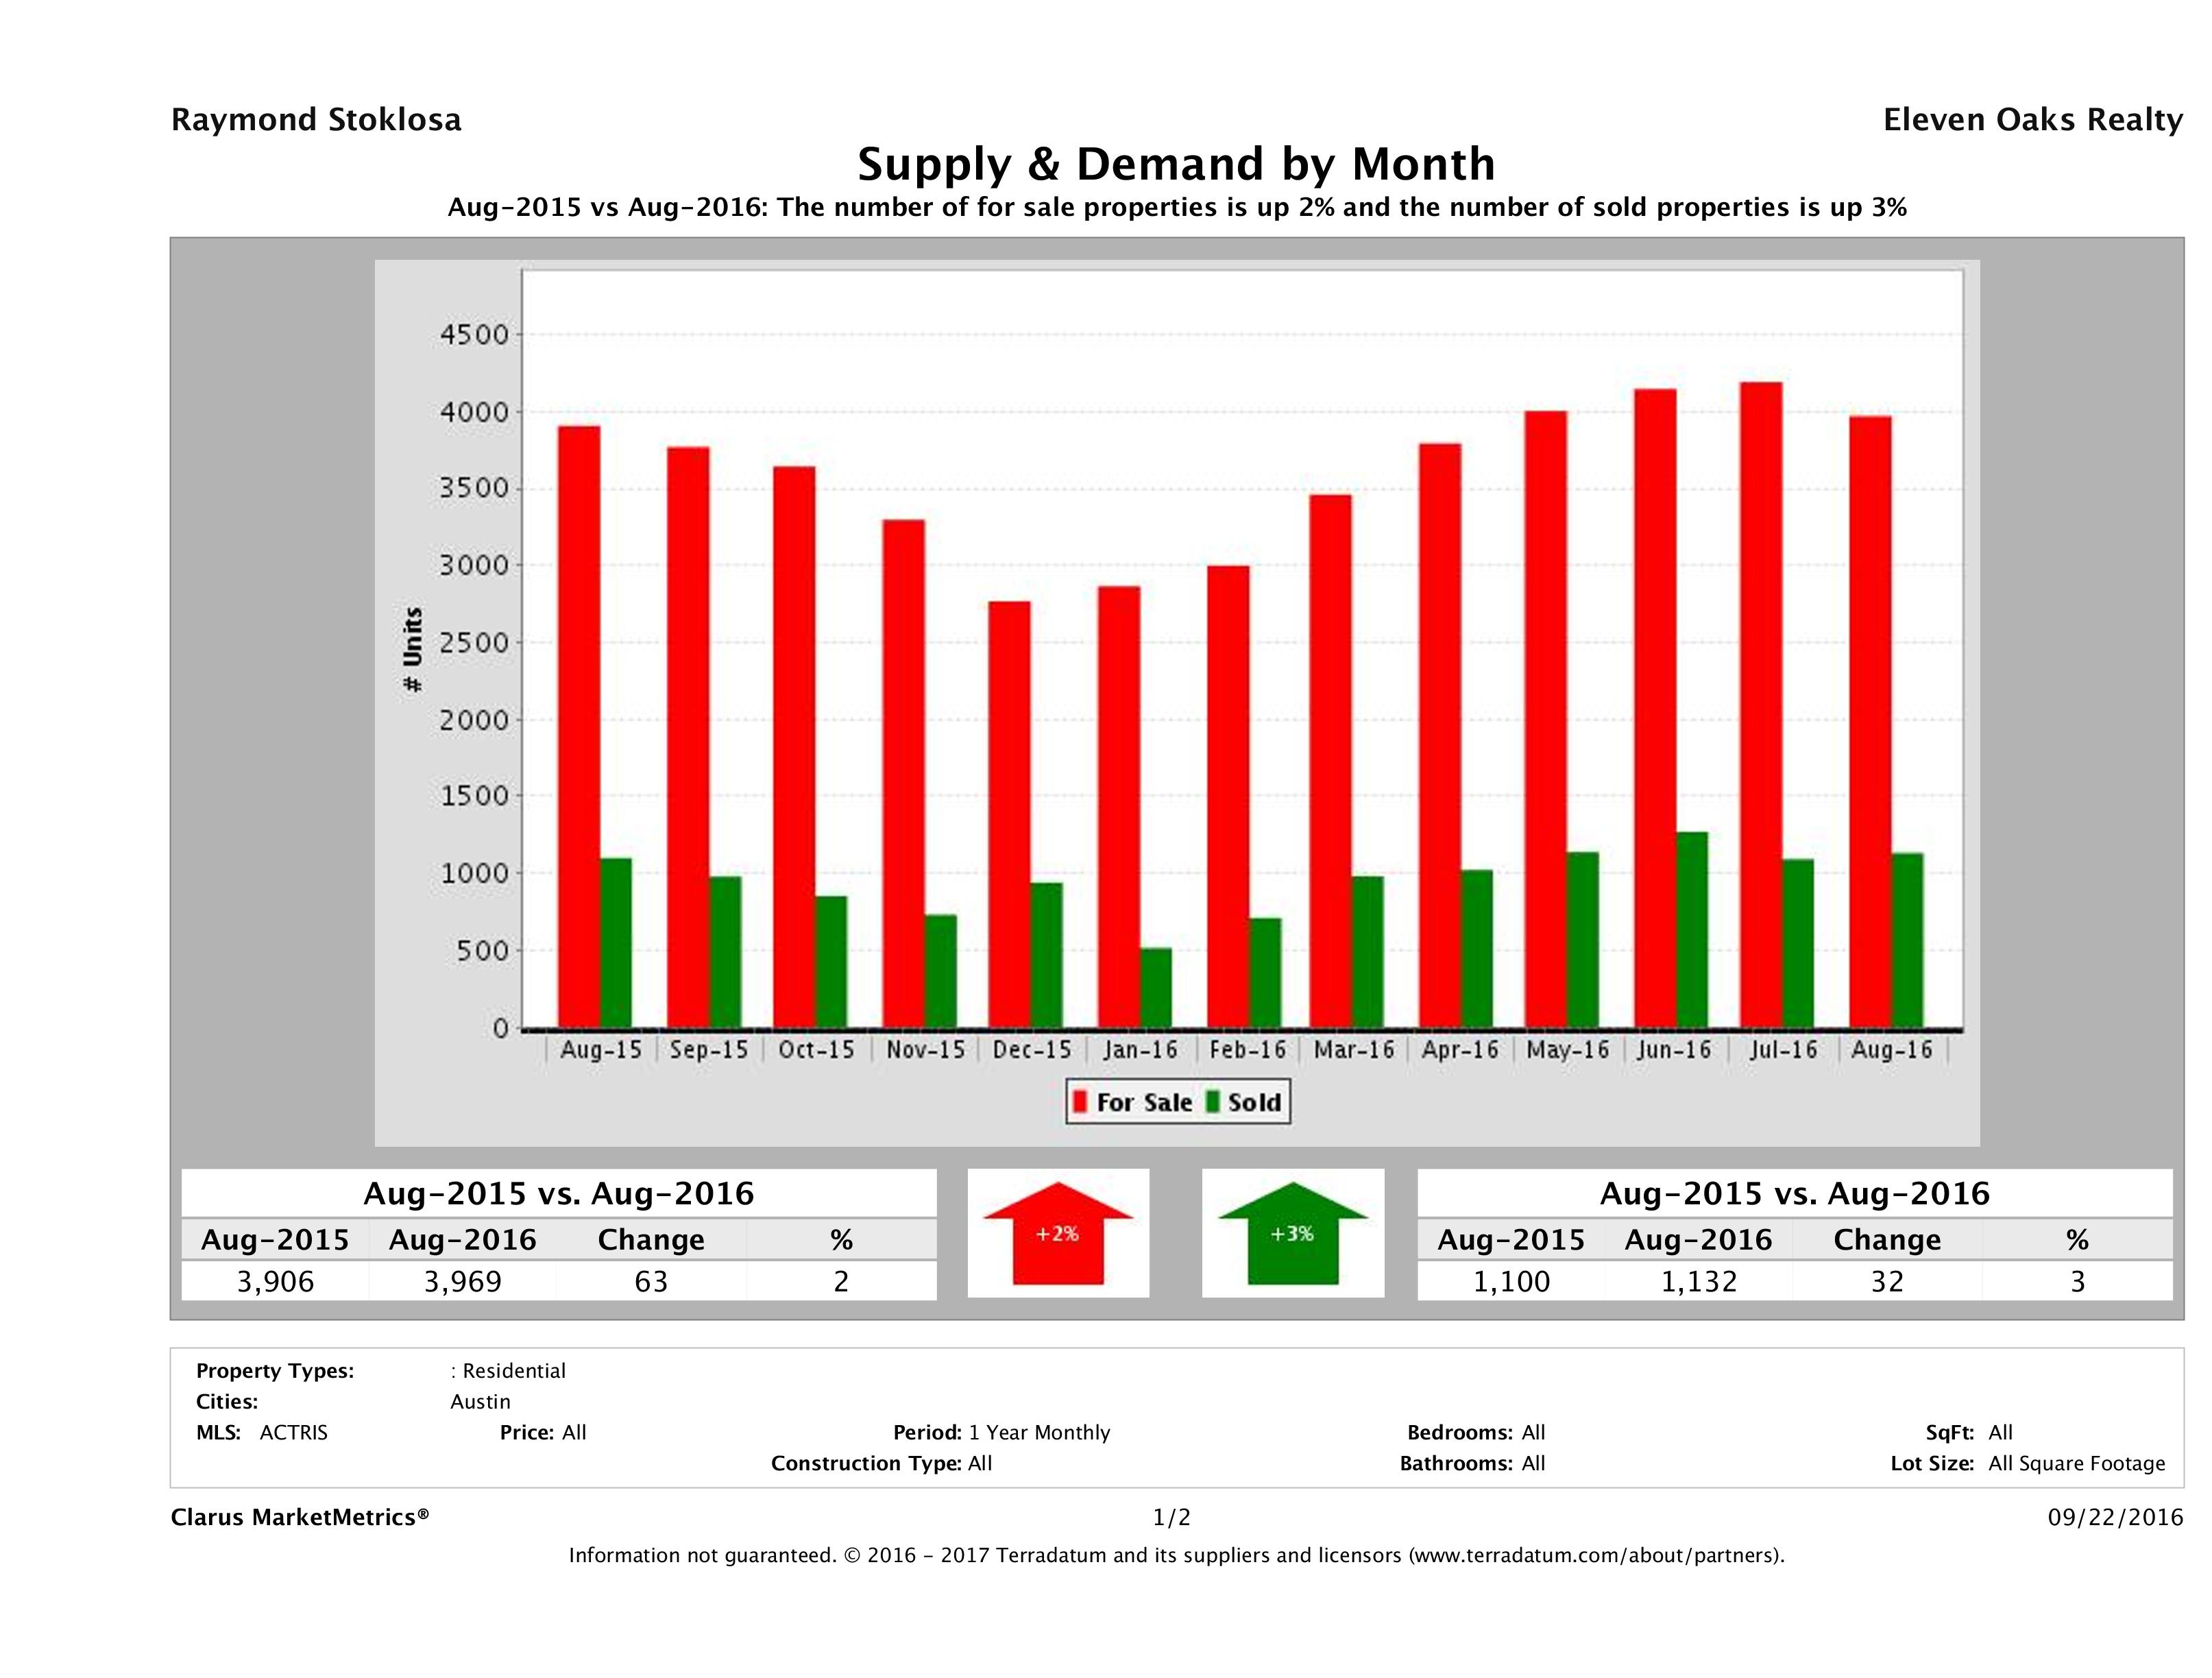
In August 2016, Austin saw a 3% increase in the number of homes sold from August 2015 to August 2016. In August 2016, we saw 1,132 homes sell in Austin compared to 1,100 in August 2015 marking a 3% (32 home) increase in year over year numbers.
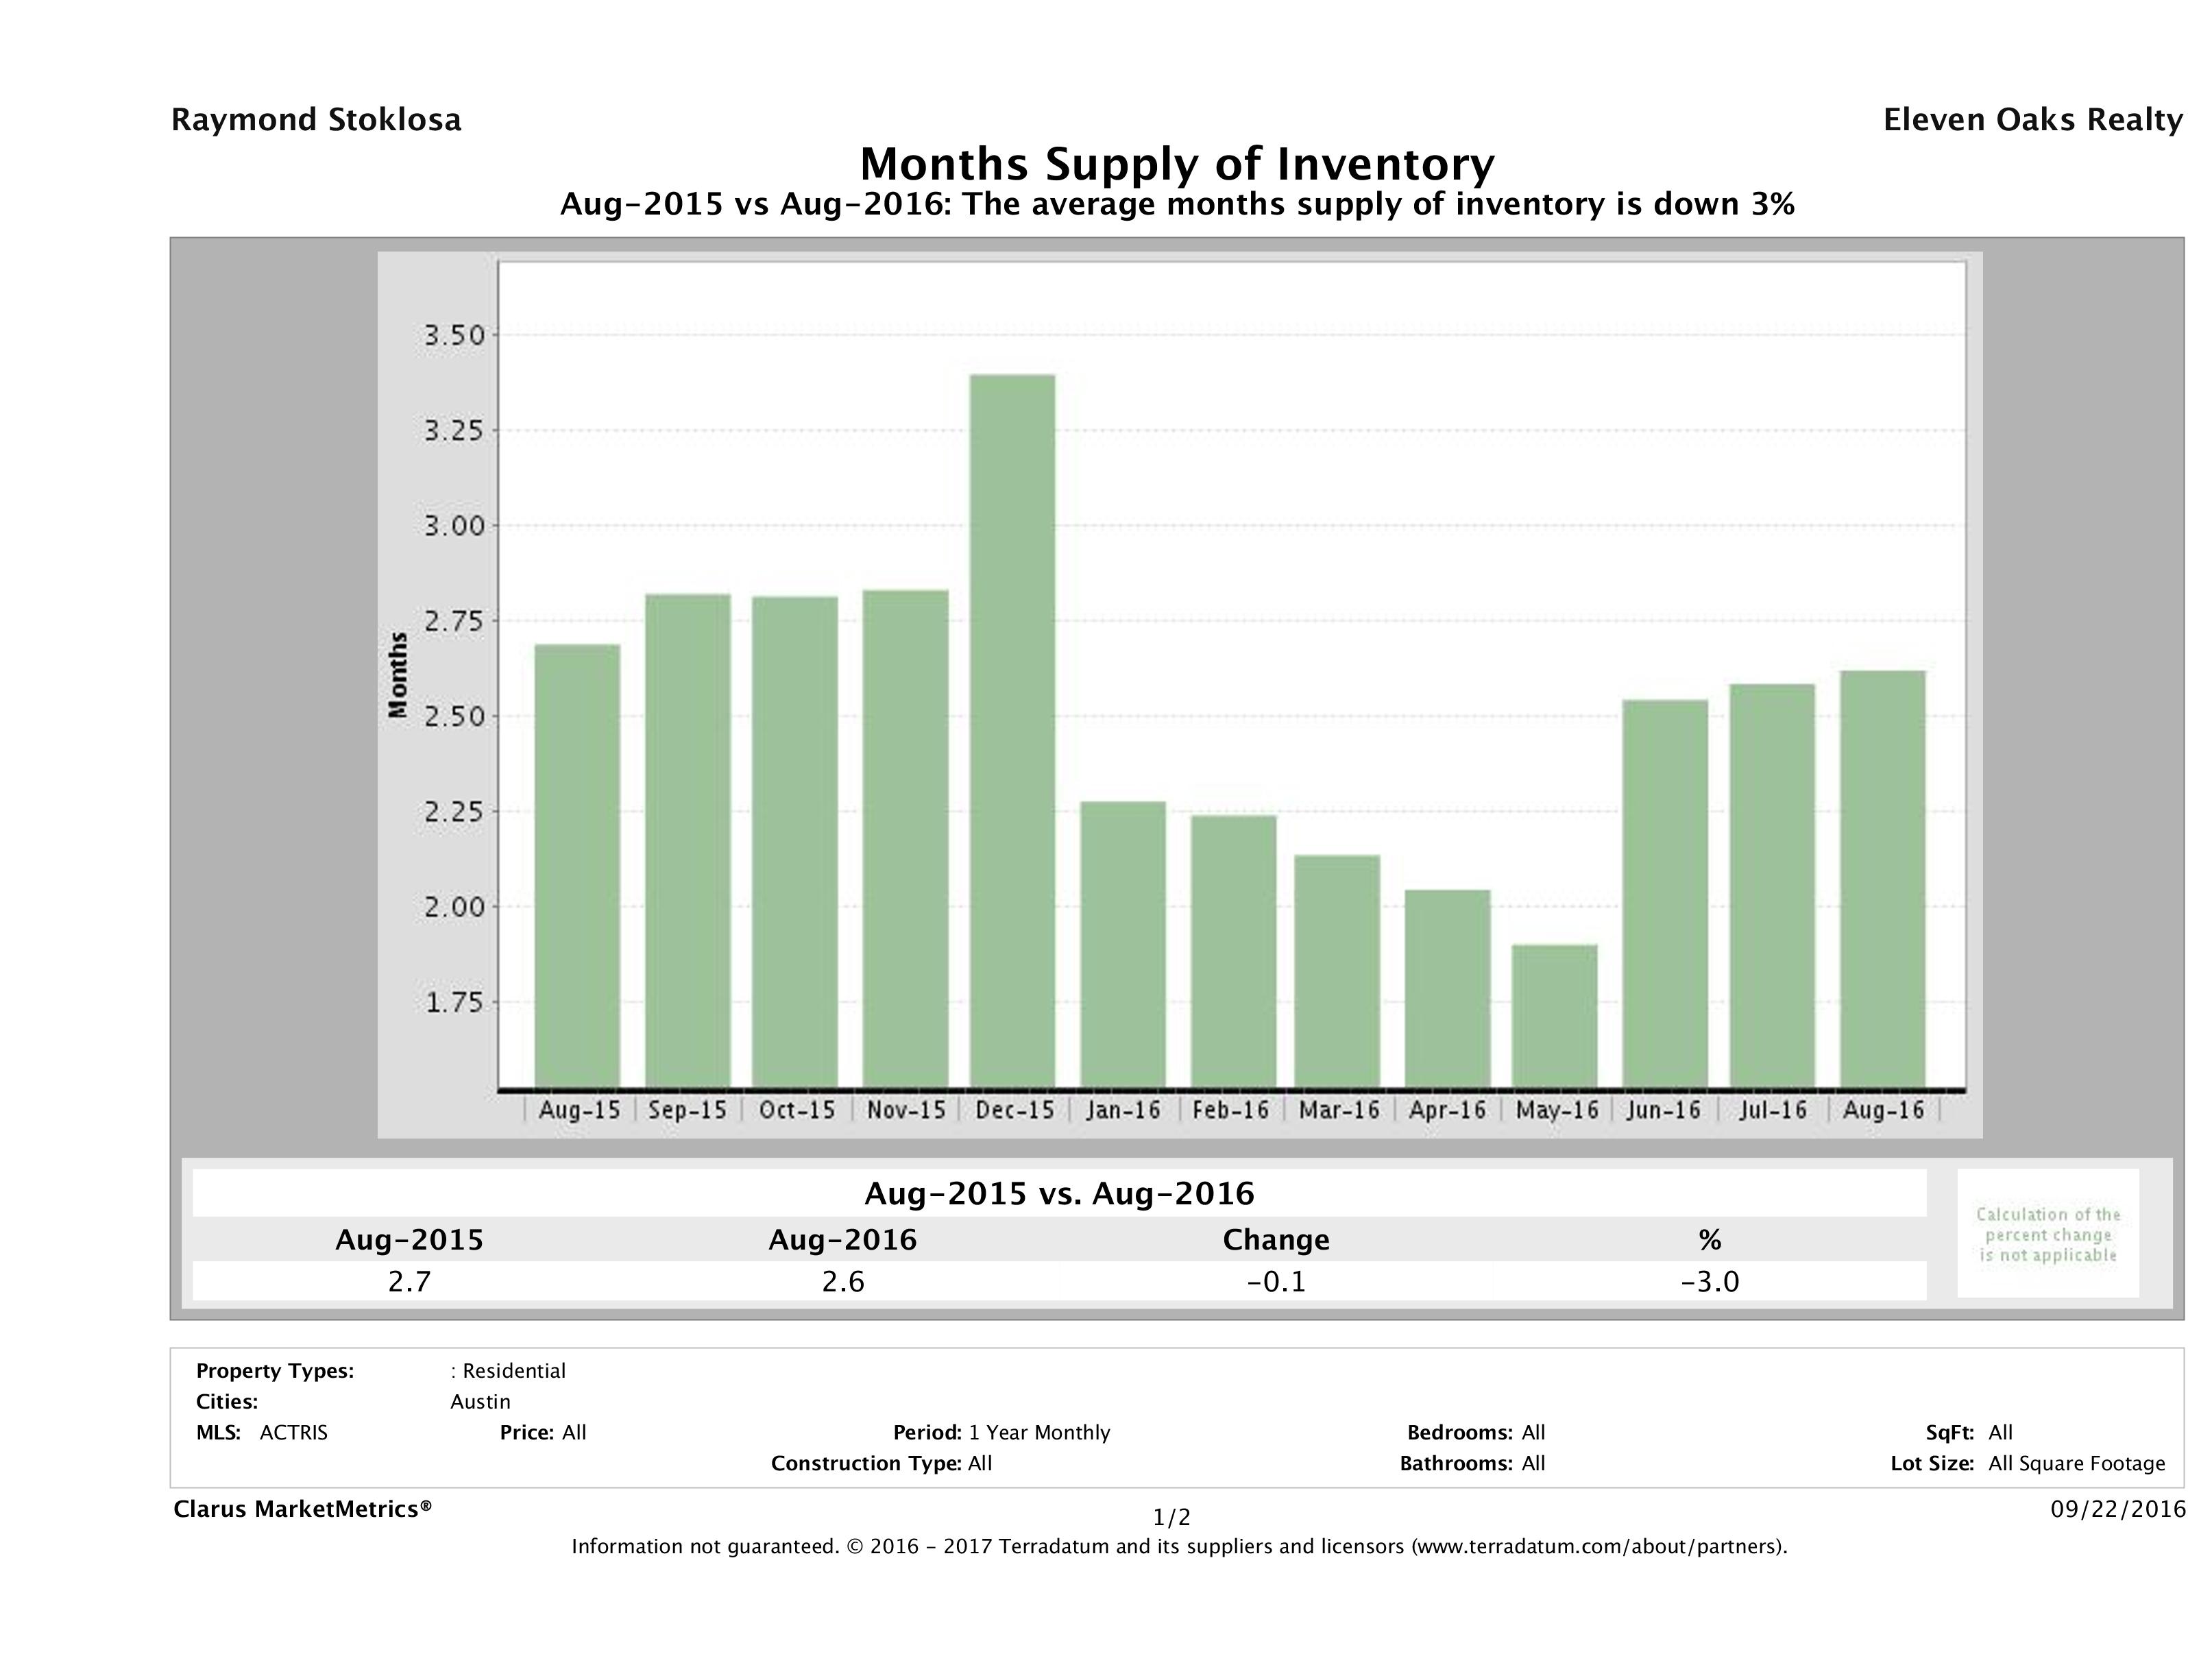
Austin Housing Inventory Down 3%
In August 2016, we saw 2.6 months of inventory on the market, compared to 2.7 months of inventory in August 2015, marking a 3% decrease in year over year numbers.
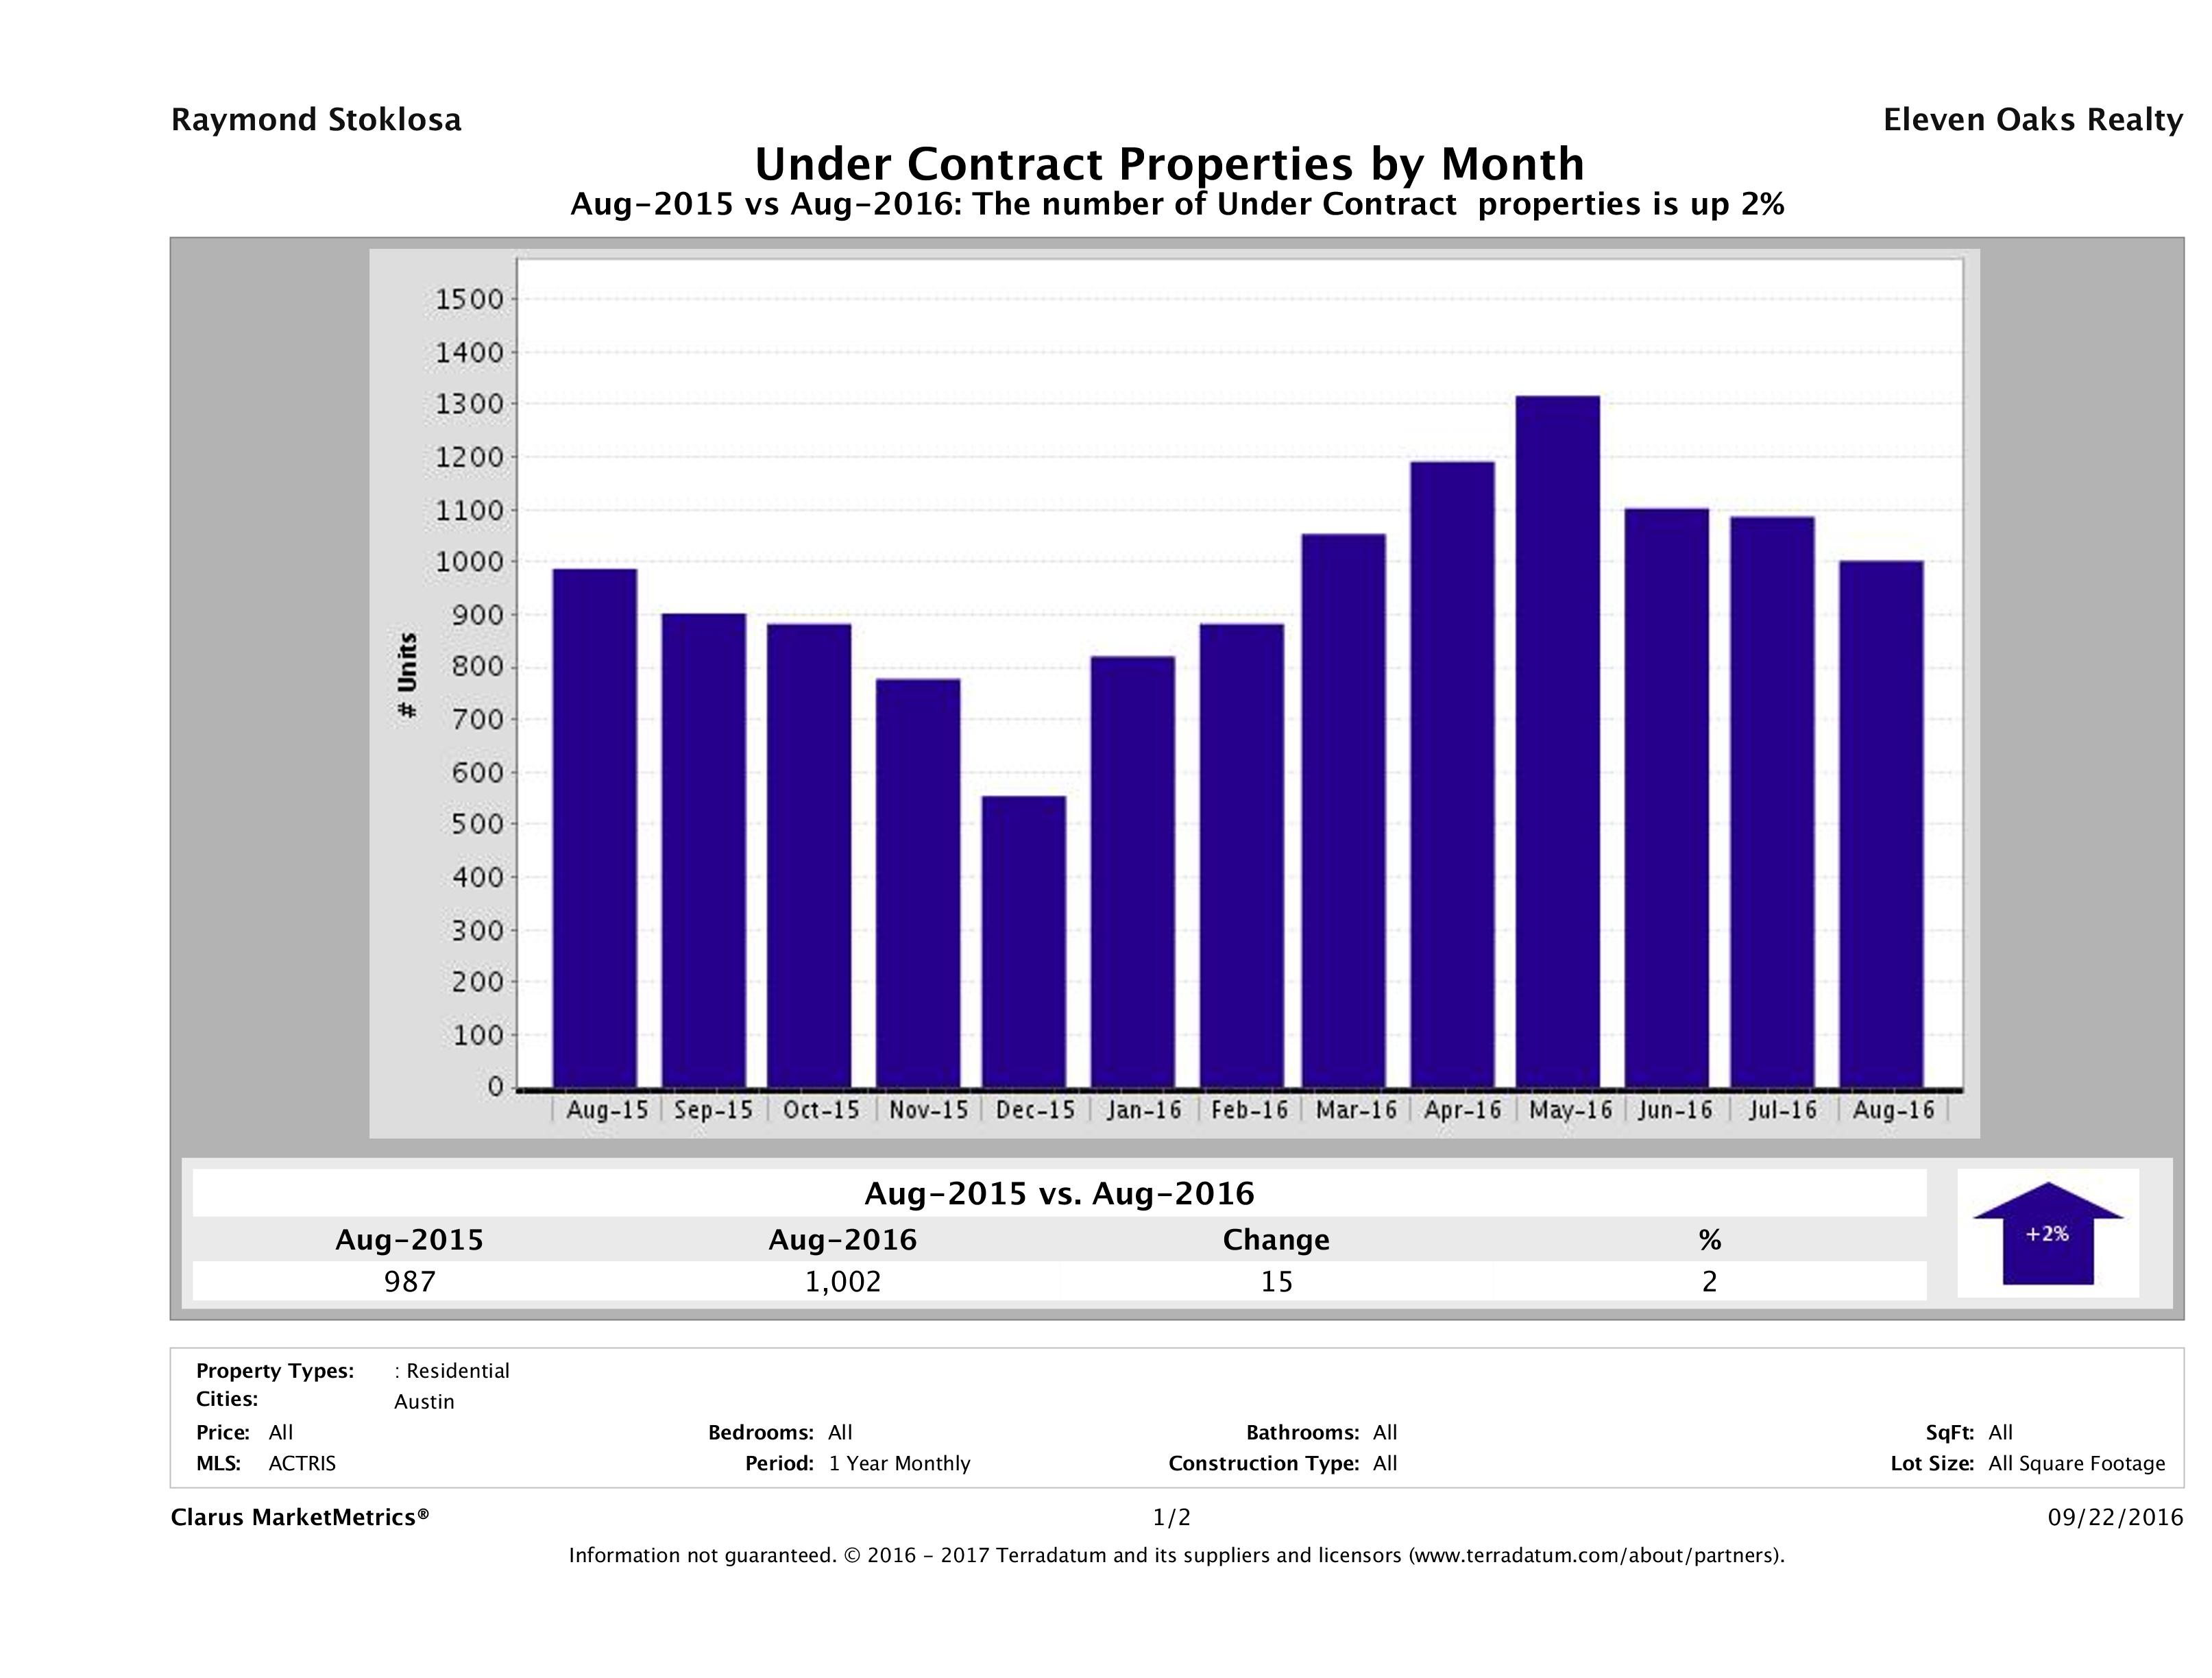
Austin Homes Under Contract Up 2%
In August 2016, 1,002 homes went pending (under contract) in Austin compared to 987 in August 2015, marking a 2% (15 home) increase in year over year numbers.
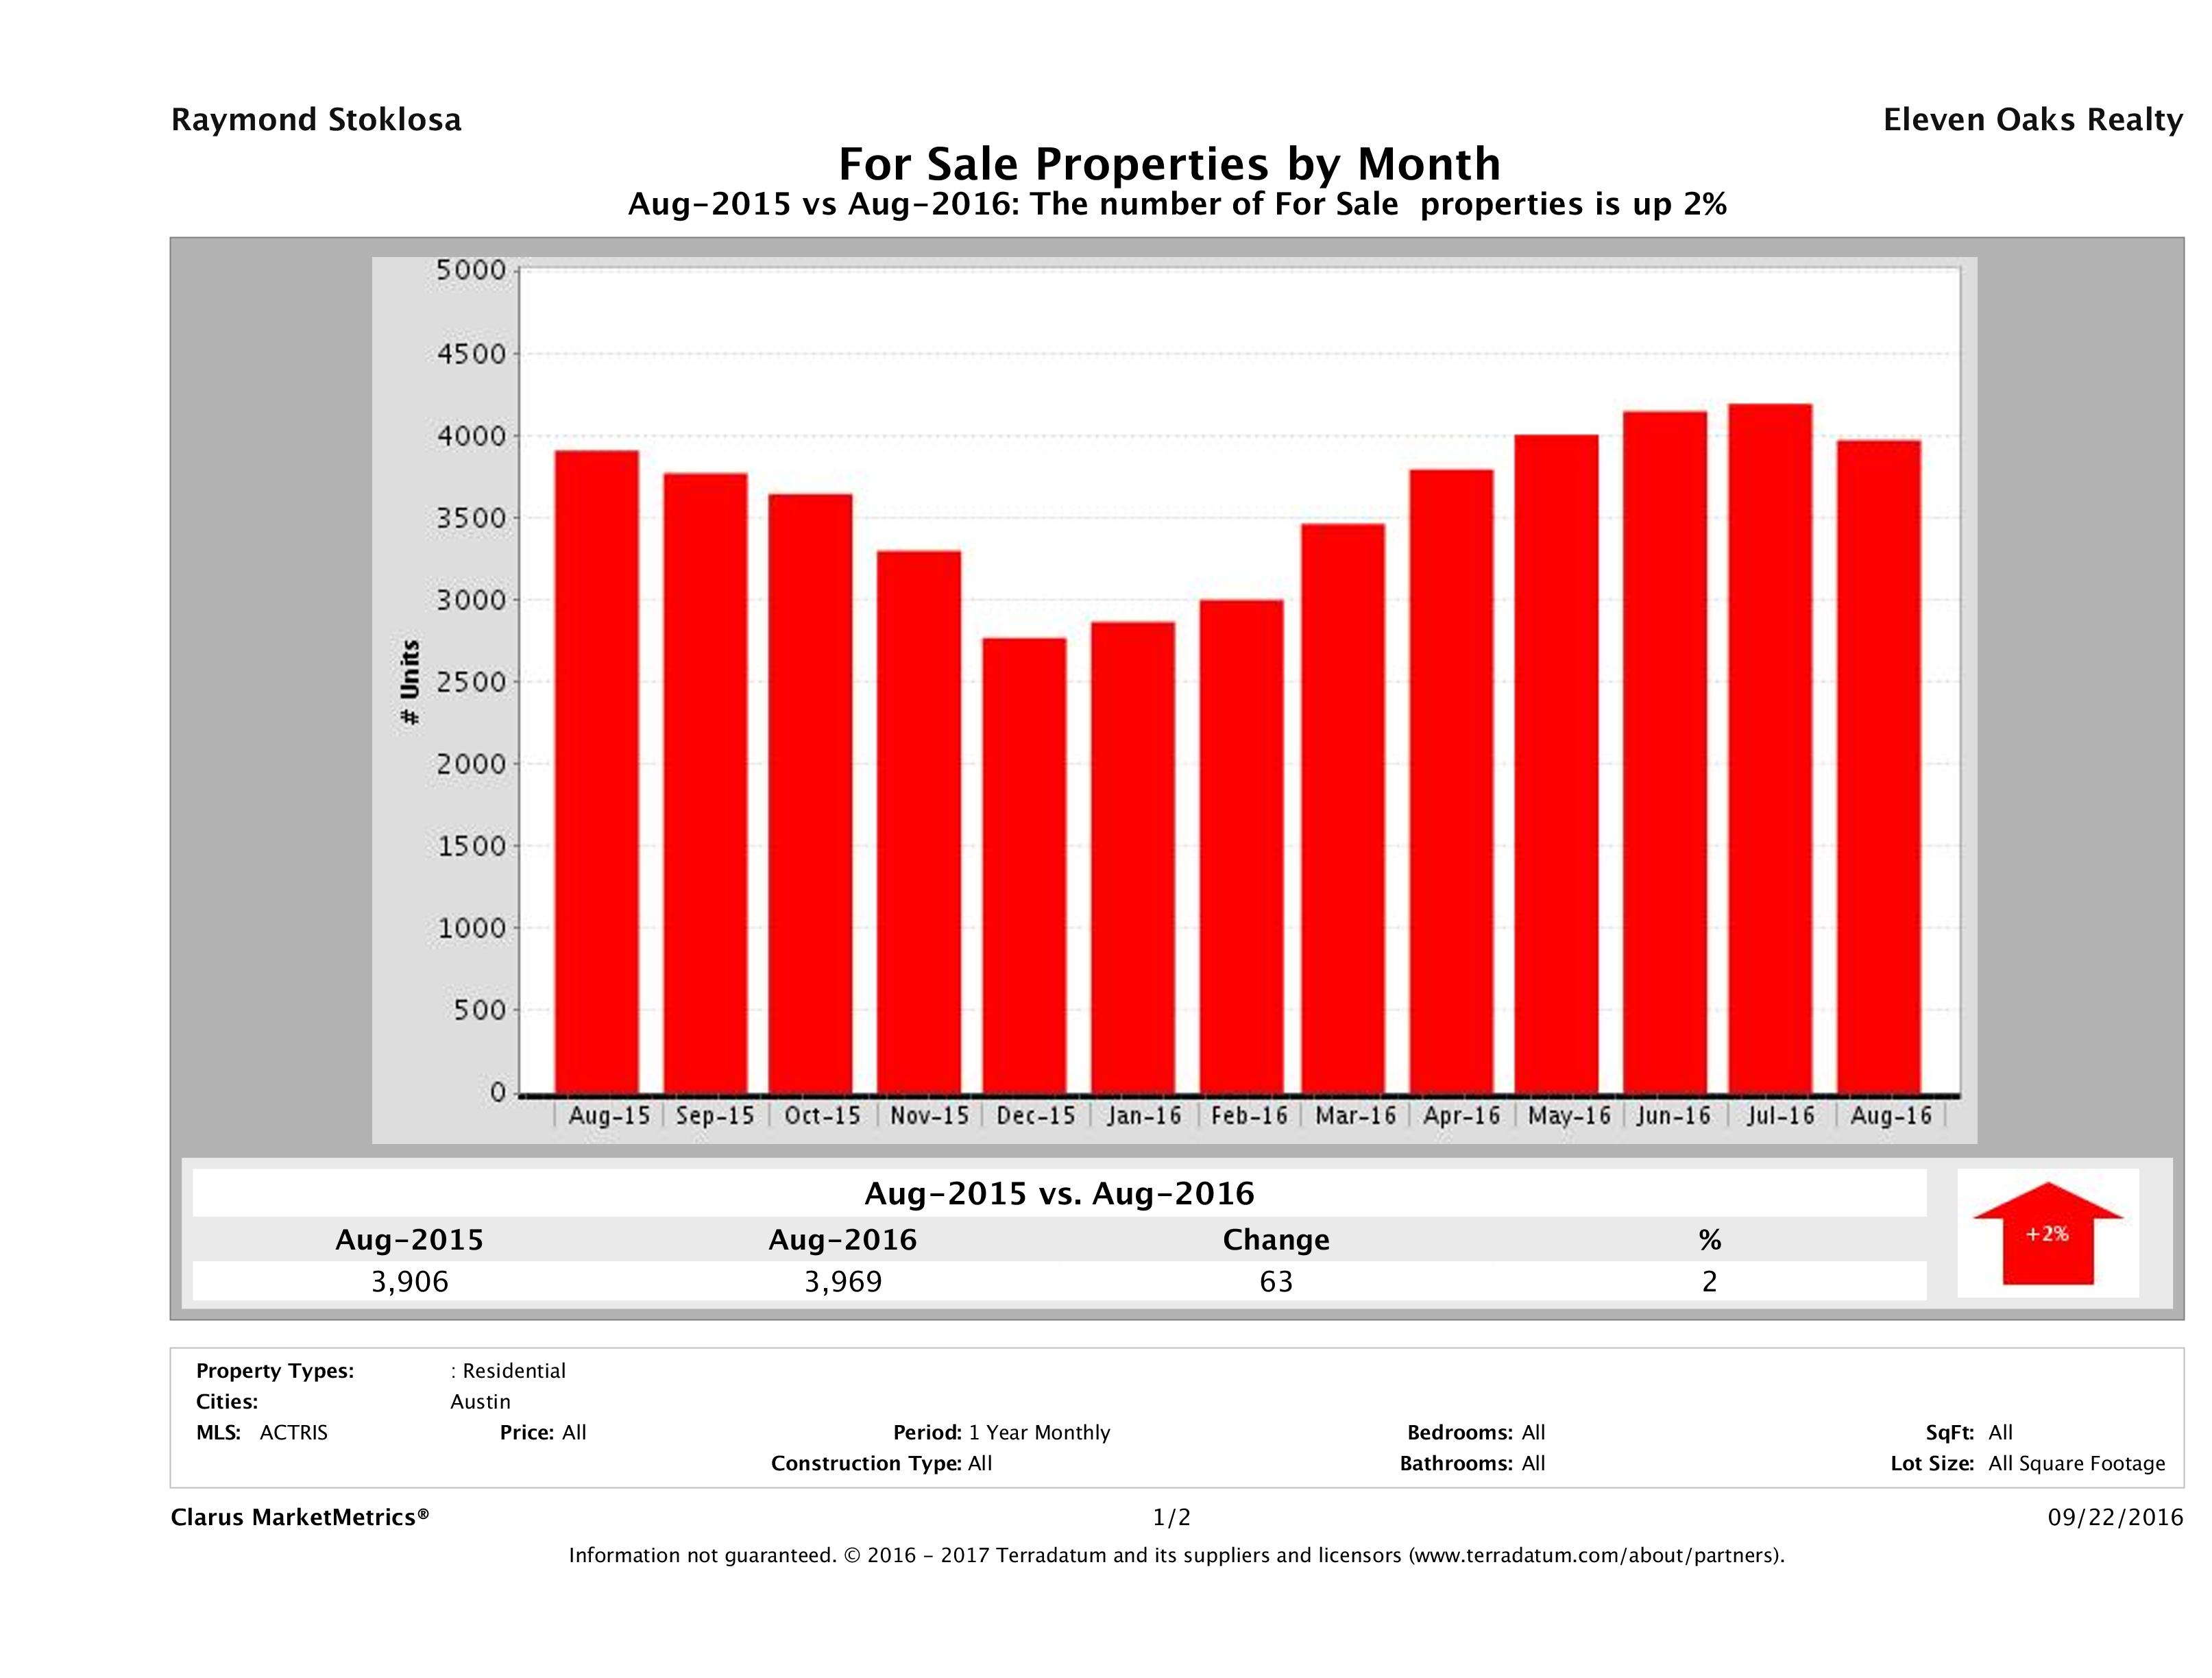
2% Increase in Number of Homes on the Market
In August 2016, we had 3,969 homes for sale in Austin, compared to 3,906 in August 2015, showing a 2% (63 home) increase in year over year numbers. This should be good news for buyers who are looking for more choices.
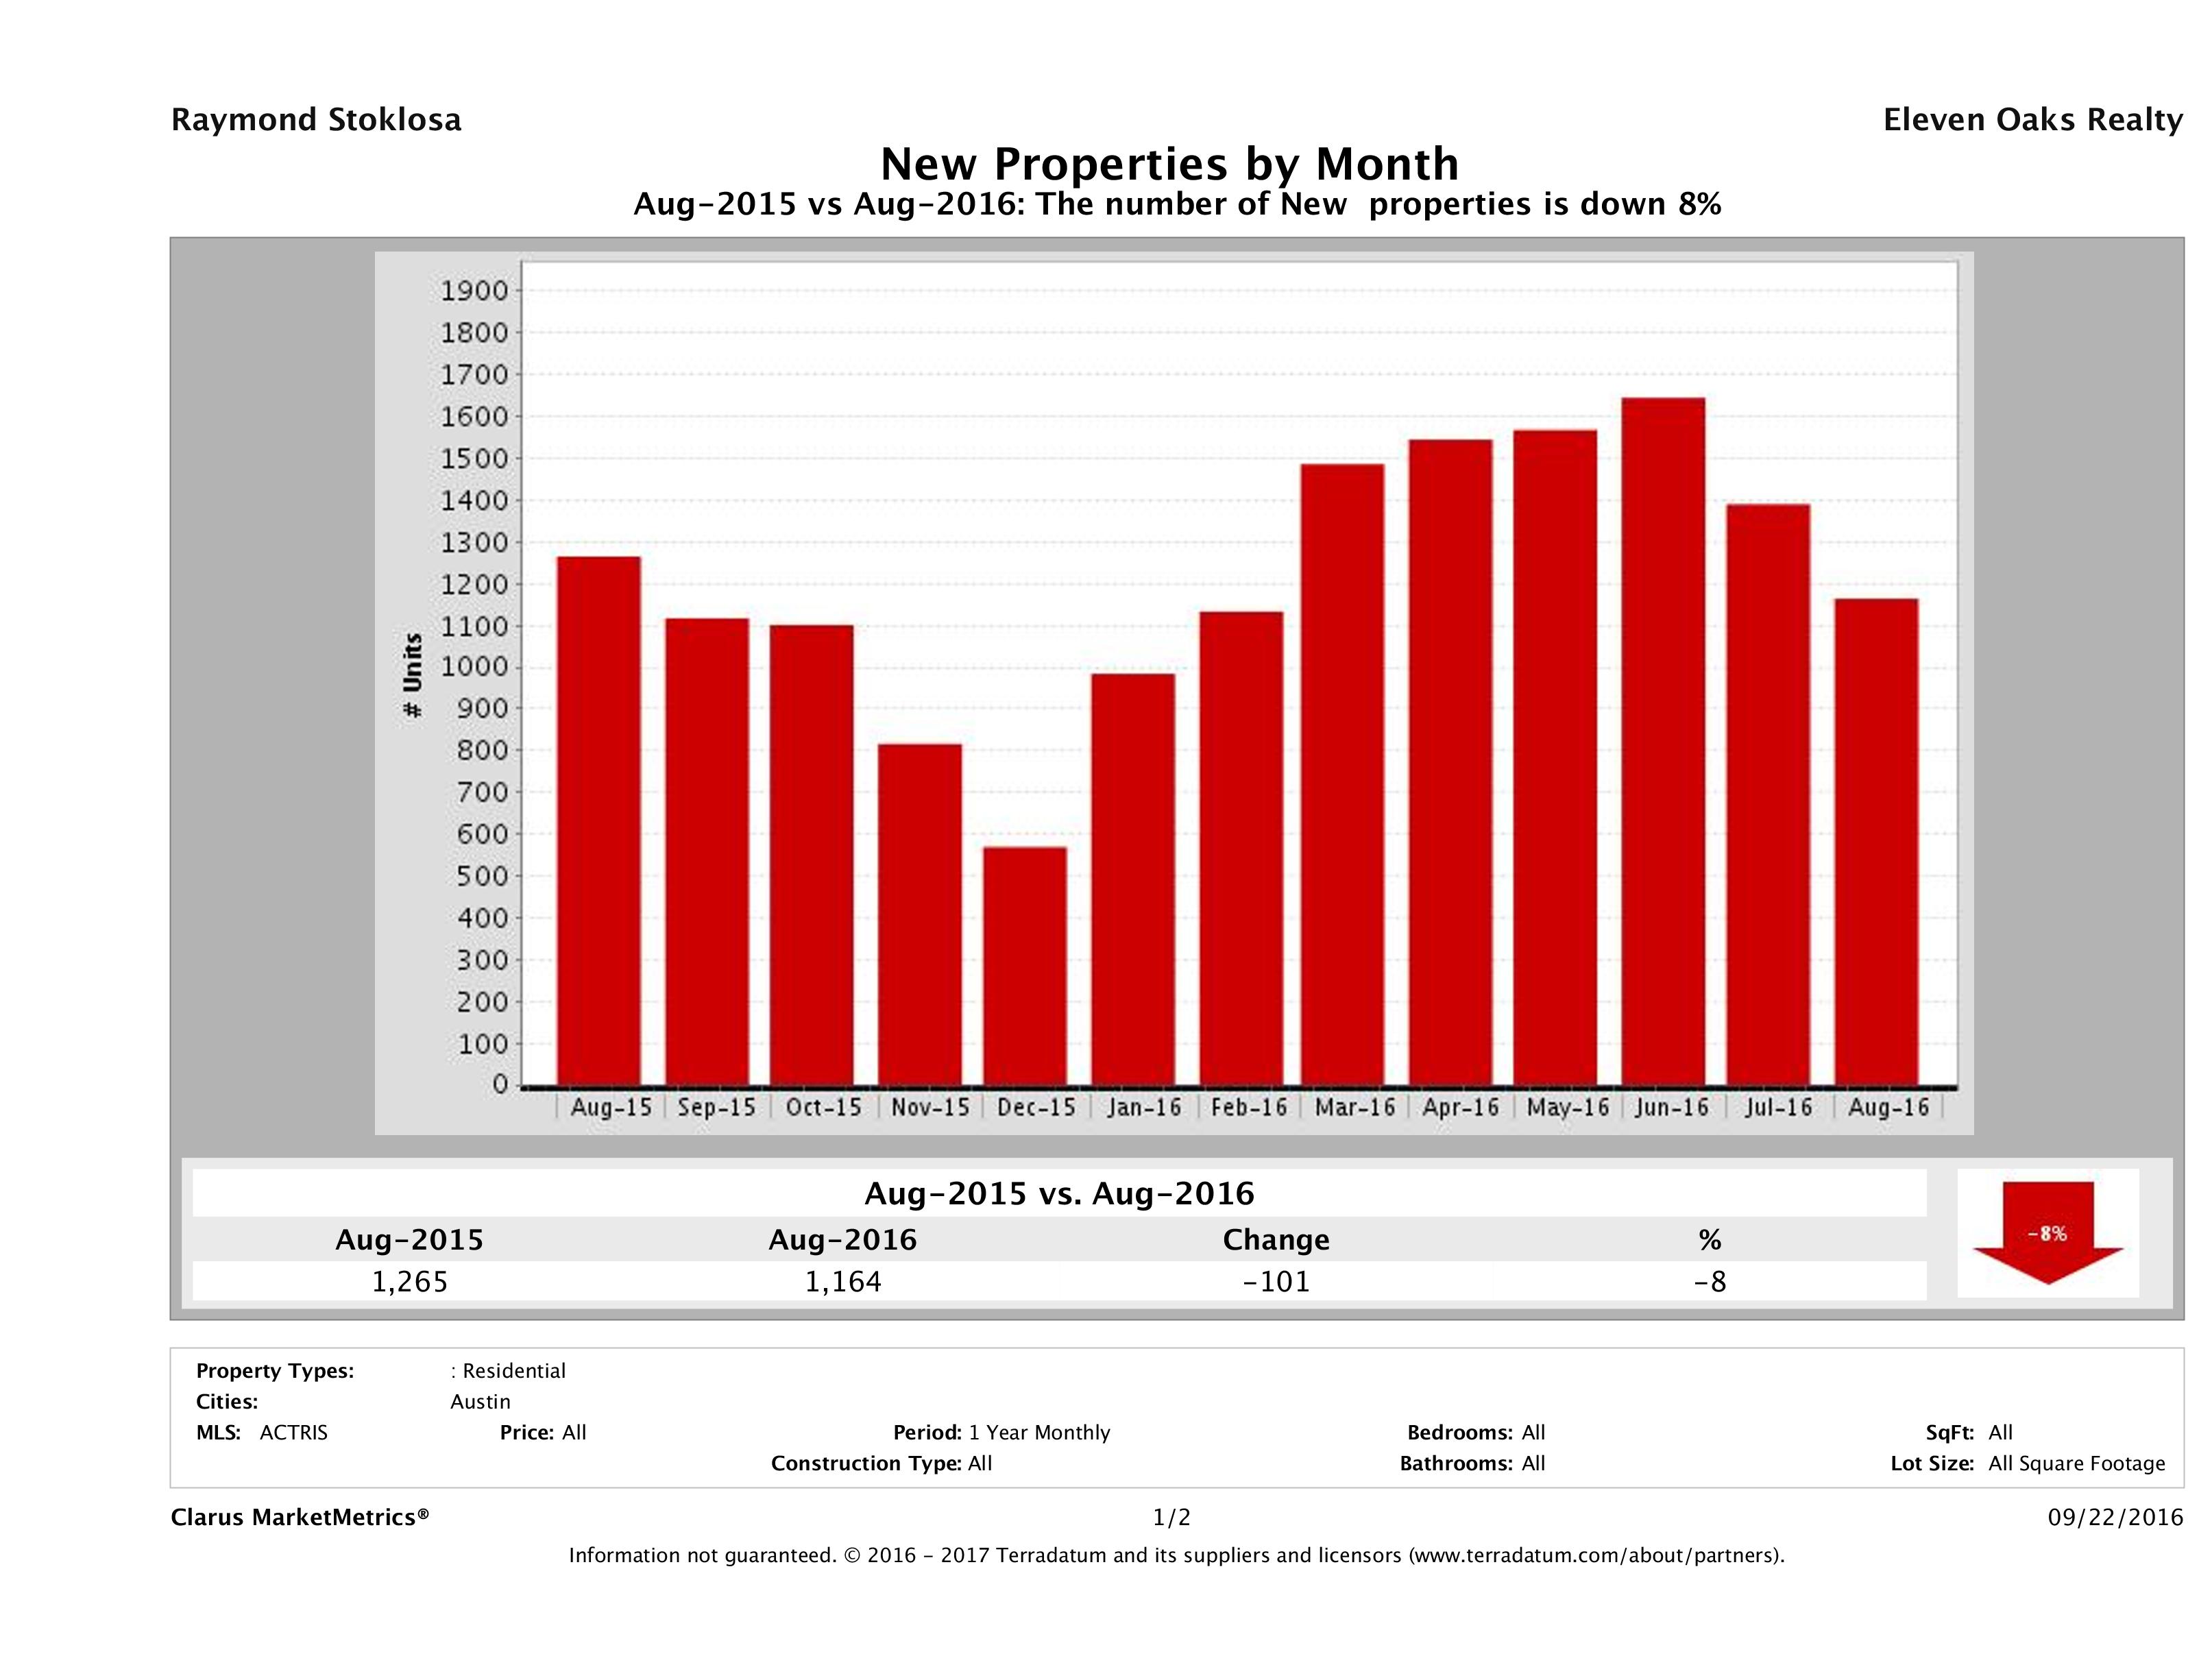
Number of Homes Listed for Sale Down 8%
In August 2016, we saw 1,164 homes introduced to the market compared to 1,265 in August 2015, marking an 8% (101 home) decrease. Again this month we saw a drop off in the number of homes introduced to the Austin real estate market. If we continue to see a decrease in homes listed, inventory numbers will continue to drop.
Supply Up 2% and Demand is Up 3%
This month we saw a 2% increase in supply (number of properties for sale) and a 3% increase in demand (number of sold properties).
Median for Sale Up 6% vs Median Sold Price Up 10%
This chart compares the Median for Sale Price vs the Median Sold Price to show their relationship. In Austin, we saw a 6% increase in the median for sale price and a 10% increase in the median sold price of a single family home in year over year numbers. Though sellers are setting higher prices, buyers are willing to pay more than they were last year for the right home.
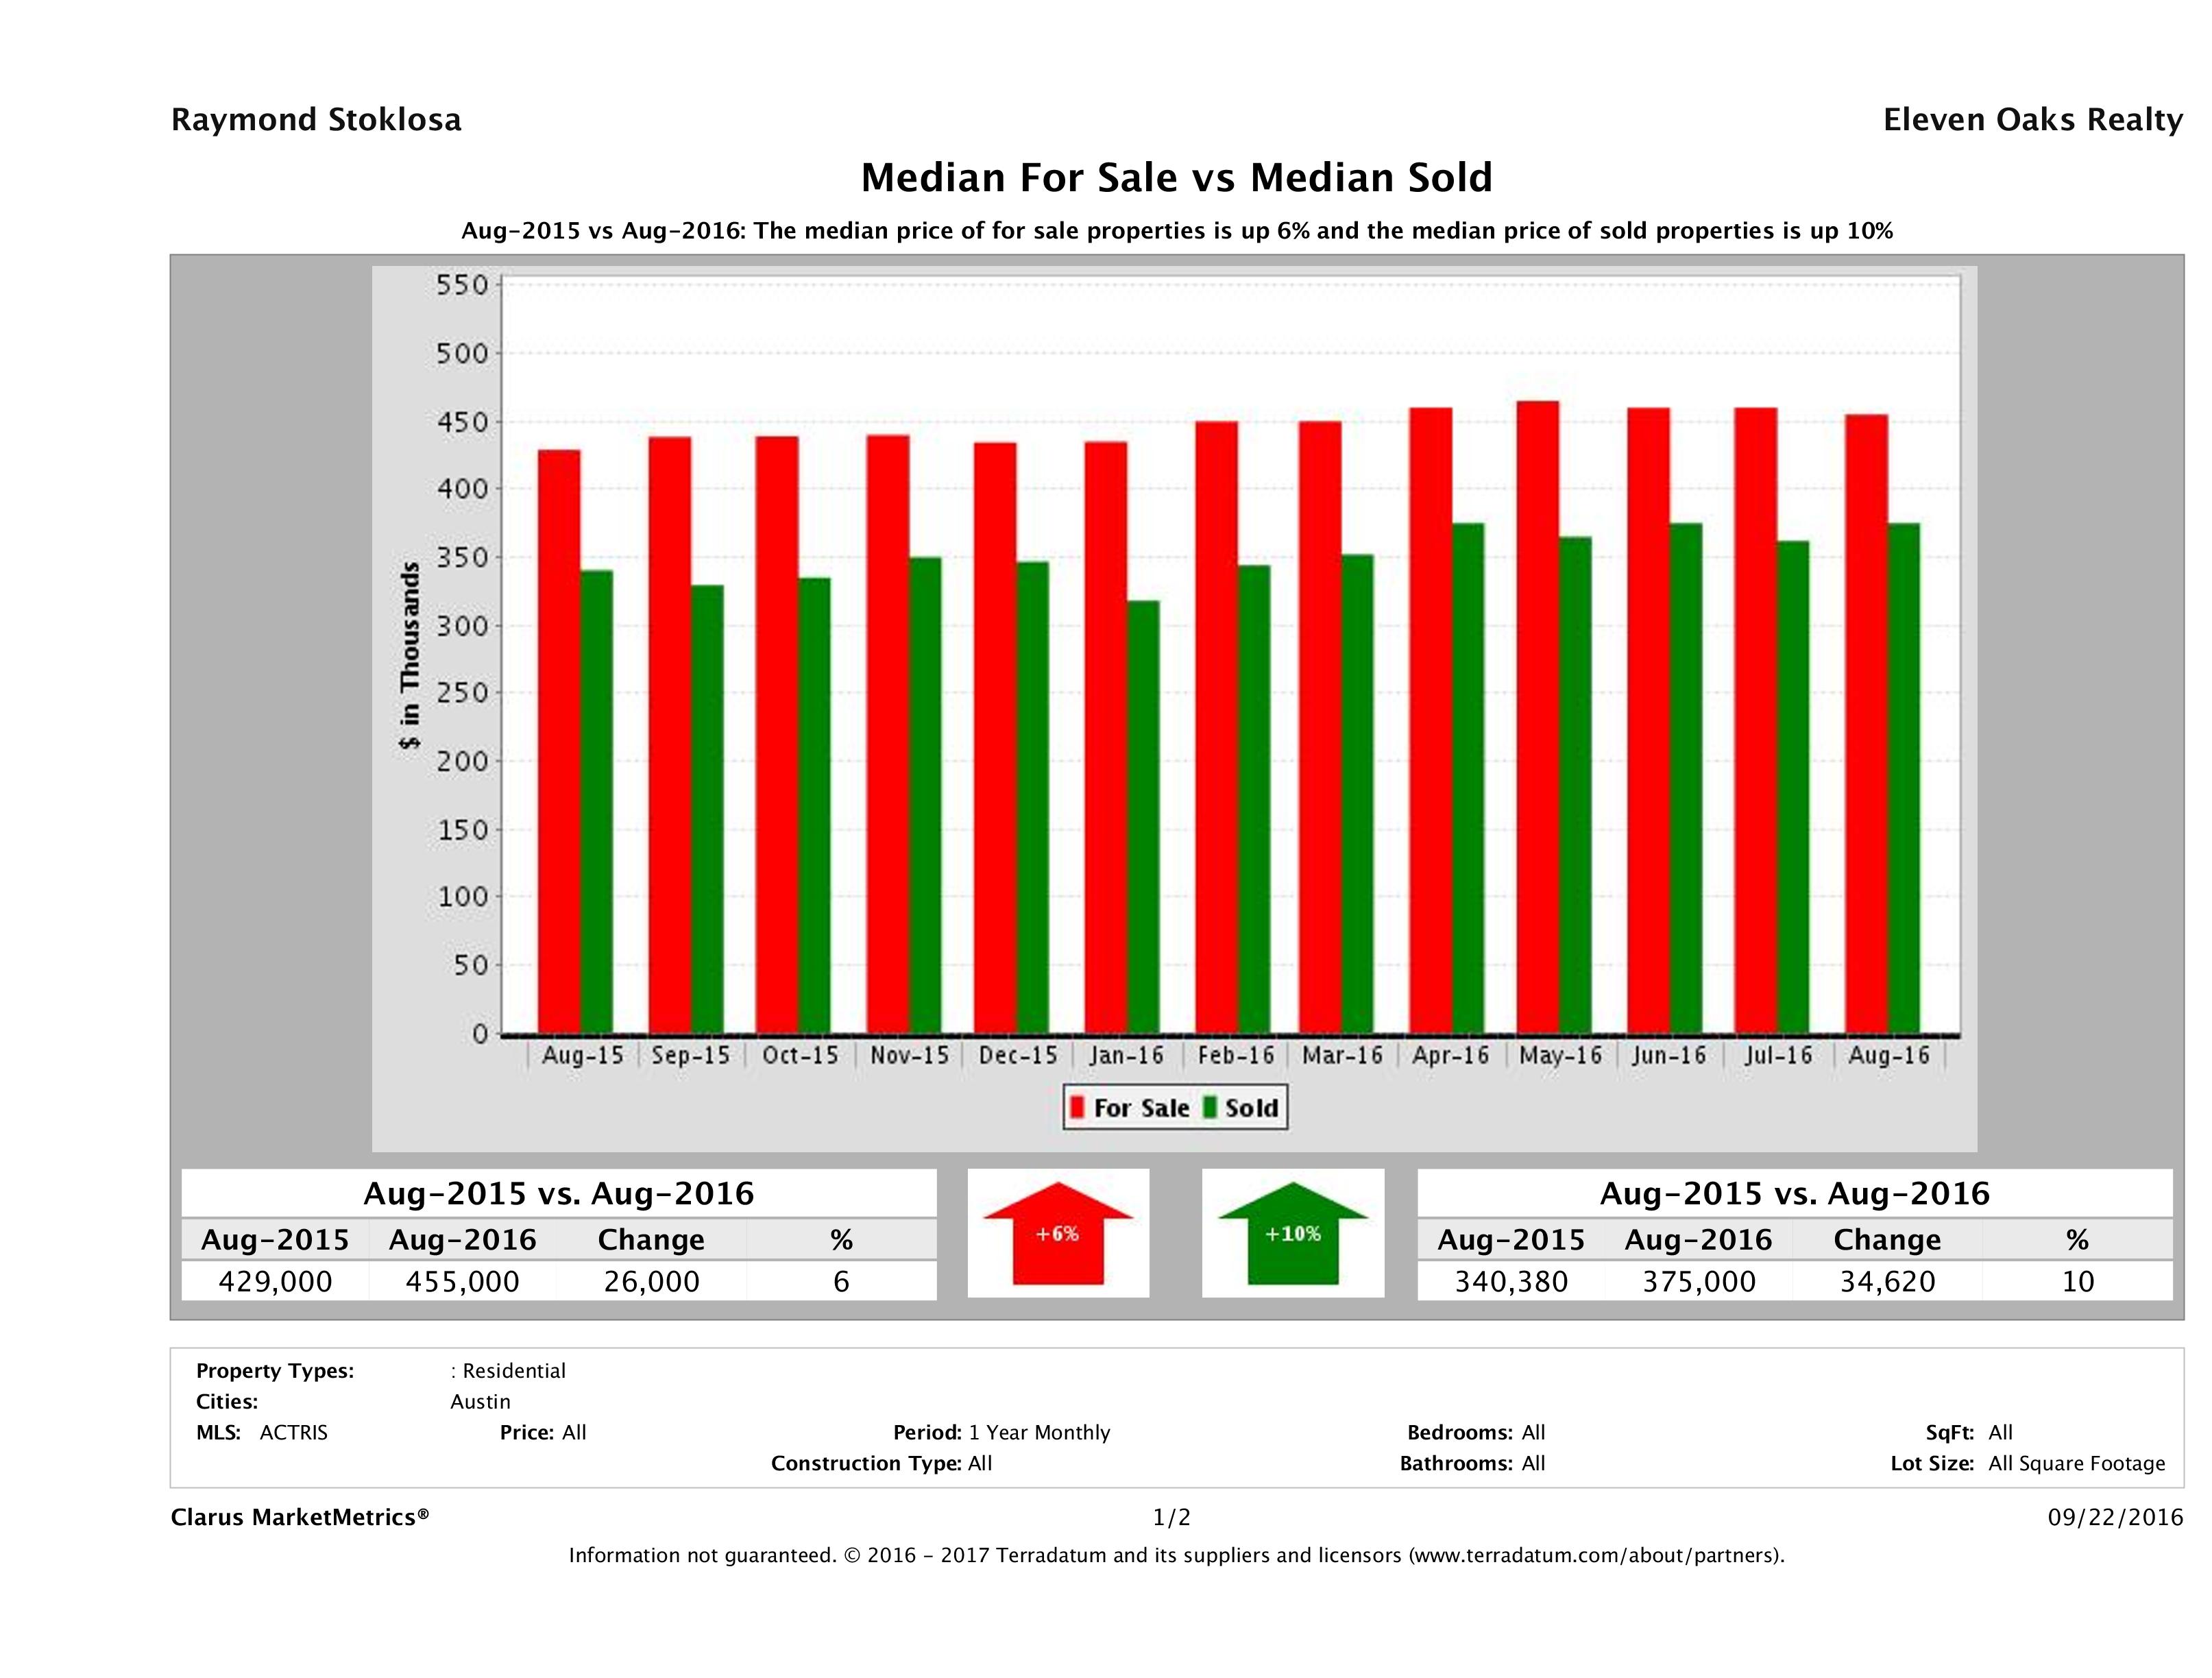
Source: Clarus Market Metrics, ACTRIS Sold Data
August 2016 Austin Real Estate Price Report – Strictly Numbers
For those of you who prefer to see the actual numbers, we’ve included the figures for August 2016 Austin home sales below. The most expensive home that sold in August 2016 sold for $3,386,600 and the least expensive home sold for $25,000. Homes ranged in size from 600 sqft – 8,299 sqft with an average size of 2,323 sqft. The average price per square foot for a home that sold in Austin in August 2016 was $203.05 with the lowest being $9.62/sqft and the highest being $582.17/sqft. It took, on average, 40 days to sell a home in Austin and sellers received, on average, 96.20% of their original list prices.
| Beds | Baths | SqFt | List Price | LP/SqFt | Sold Price | SP/SqFt | SP/LP | SP/OLP | ADOM | |
|---|---|---|---|---|---|---|---|---|---|---|
| Min | 1 | 1 | 600 | $110,000 | $48.08 | $25,000 | $9.62 | 20.00% | 20.00% | 0 |
| Max | 6 | 8 | 8,299 | $3,995,000 | $619.83 | $3,386,600 | $582.17 | 142.06% | 158.18% | 787 |
| Avg | 4 | 3 | 2,323 | $473,977 | $207.45 | $461,841 | $203.05 | 98.09% | 96.20% | 40 |
| Median | 3 | 3 | 2,085 | $379,000 | $176.26 | $375,000 | $173.63 | 98.66% | 97.43% | 18 |
| Search Criteria | |||
|---|---|---|---|
| Status | Sold | Sold Date | August 2016 |
| Property Type | Single Family Homes | Number Sold | 1,144 |
| Source: | ABoR Sales Data | Area | Austin |
Time to Buy? Sell?
As we always say, the best time to buy or sell a home is when you need to buy or sell. If you have a house to buy, buying when its a sellers market may hurt you on the buying end, but you’ll make it up on the selling end. If you’re trying to get into the market for the first time, the only way you’ll know that we’ve “hit bottom” is when its in the rear view mirror. Work with professionals who can help you analyze your financial and lifestyle to determine if now is the right time to buy or sell.
Looking strictly at the numbers, it appears the recommendation for this month is – it’s time to sell. Sellers have a small window of opportunity to get their homes on the market before the historically slower, Winter months. With median prices up 10%, demand up slightly over supply and a decrease in new inventory coming online, sellers are in a stable position. But, they should act quickly. Winter generally slows the market down and the edge shifts towards buyers. Does your window need roller shutters, to keep yourself and your family warm? If so, visit the provided link and have a look; you will be pleasantly surprised.
If you’re a seller who needs to sell, work with a professional Realtor who can help you position your home as the best value on the market. There are still highly motivated buyers in the market who are ready to make stronger offers than they were last year. With 2.6 months of inventory, we are still in a seller’s market. Check out our 88 Ways to Sell Your Home Faster and For More Money for some tips on how you can prepare your home to meet the market. For more info about our Home Selling Program and why it is the best in Austin, check out Sell My Austin Home.
Buyers might want to hold tight. Though inventory is up, we would expect it to go up even more as we head into Winter. If demand doesn’t increase, we’ll have a prime opportunity for buyers to get better deals starting in October of November. Use this time to prepare to buy. Get pre-approved by a local mortgage lender. Start researching neighborhoods and learning which would be the best fit for you. Then, start taking a look at homes. This way when you are ready to buy, you have seen enough homes where you’ll know the right one when it comes up. If you’re looking to buy, we can help you be successful, even in this competitive market. We know the market and know how to get the best deal for a buyer. For more info about buying a home, visit Buy a Home in Austin.
Curious How Much You Could Sell Your Austin Home For?
Our Market Snapshot Tool is for you. With just your zip code, we’ll email you a detailed report showing what homes in your neighborhood sold for, how long it took to sell and how the market is trending. Though our Austin Real Estate Price Report is helpful in gauging the overall trend of the market, it doesn’t address neighborhoods specifically. If you’re looking for that type of report, put in your name and zip code below and our system will email you a Neighborhood Market Report.
Questions About the Austin Real Estate Price Report?
Do you have questions about this Austin Real Estate Price Report? Call us at (512) 827-8323 or email us at info@11OaksRealty.com and we’ll help you in any way we can. If you’re looking to buy or sell Austin real estate, don’t forget to check out our Buyer Resources and our Seller Resources for more tips.
Leave a Reply