Eleven Oaks Realty is proud to present their August 2013 Austin Real Estate Price Report measuring activity in the Austin single family home market.
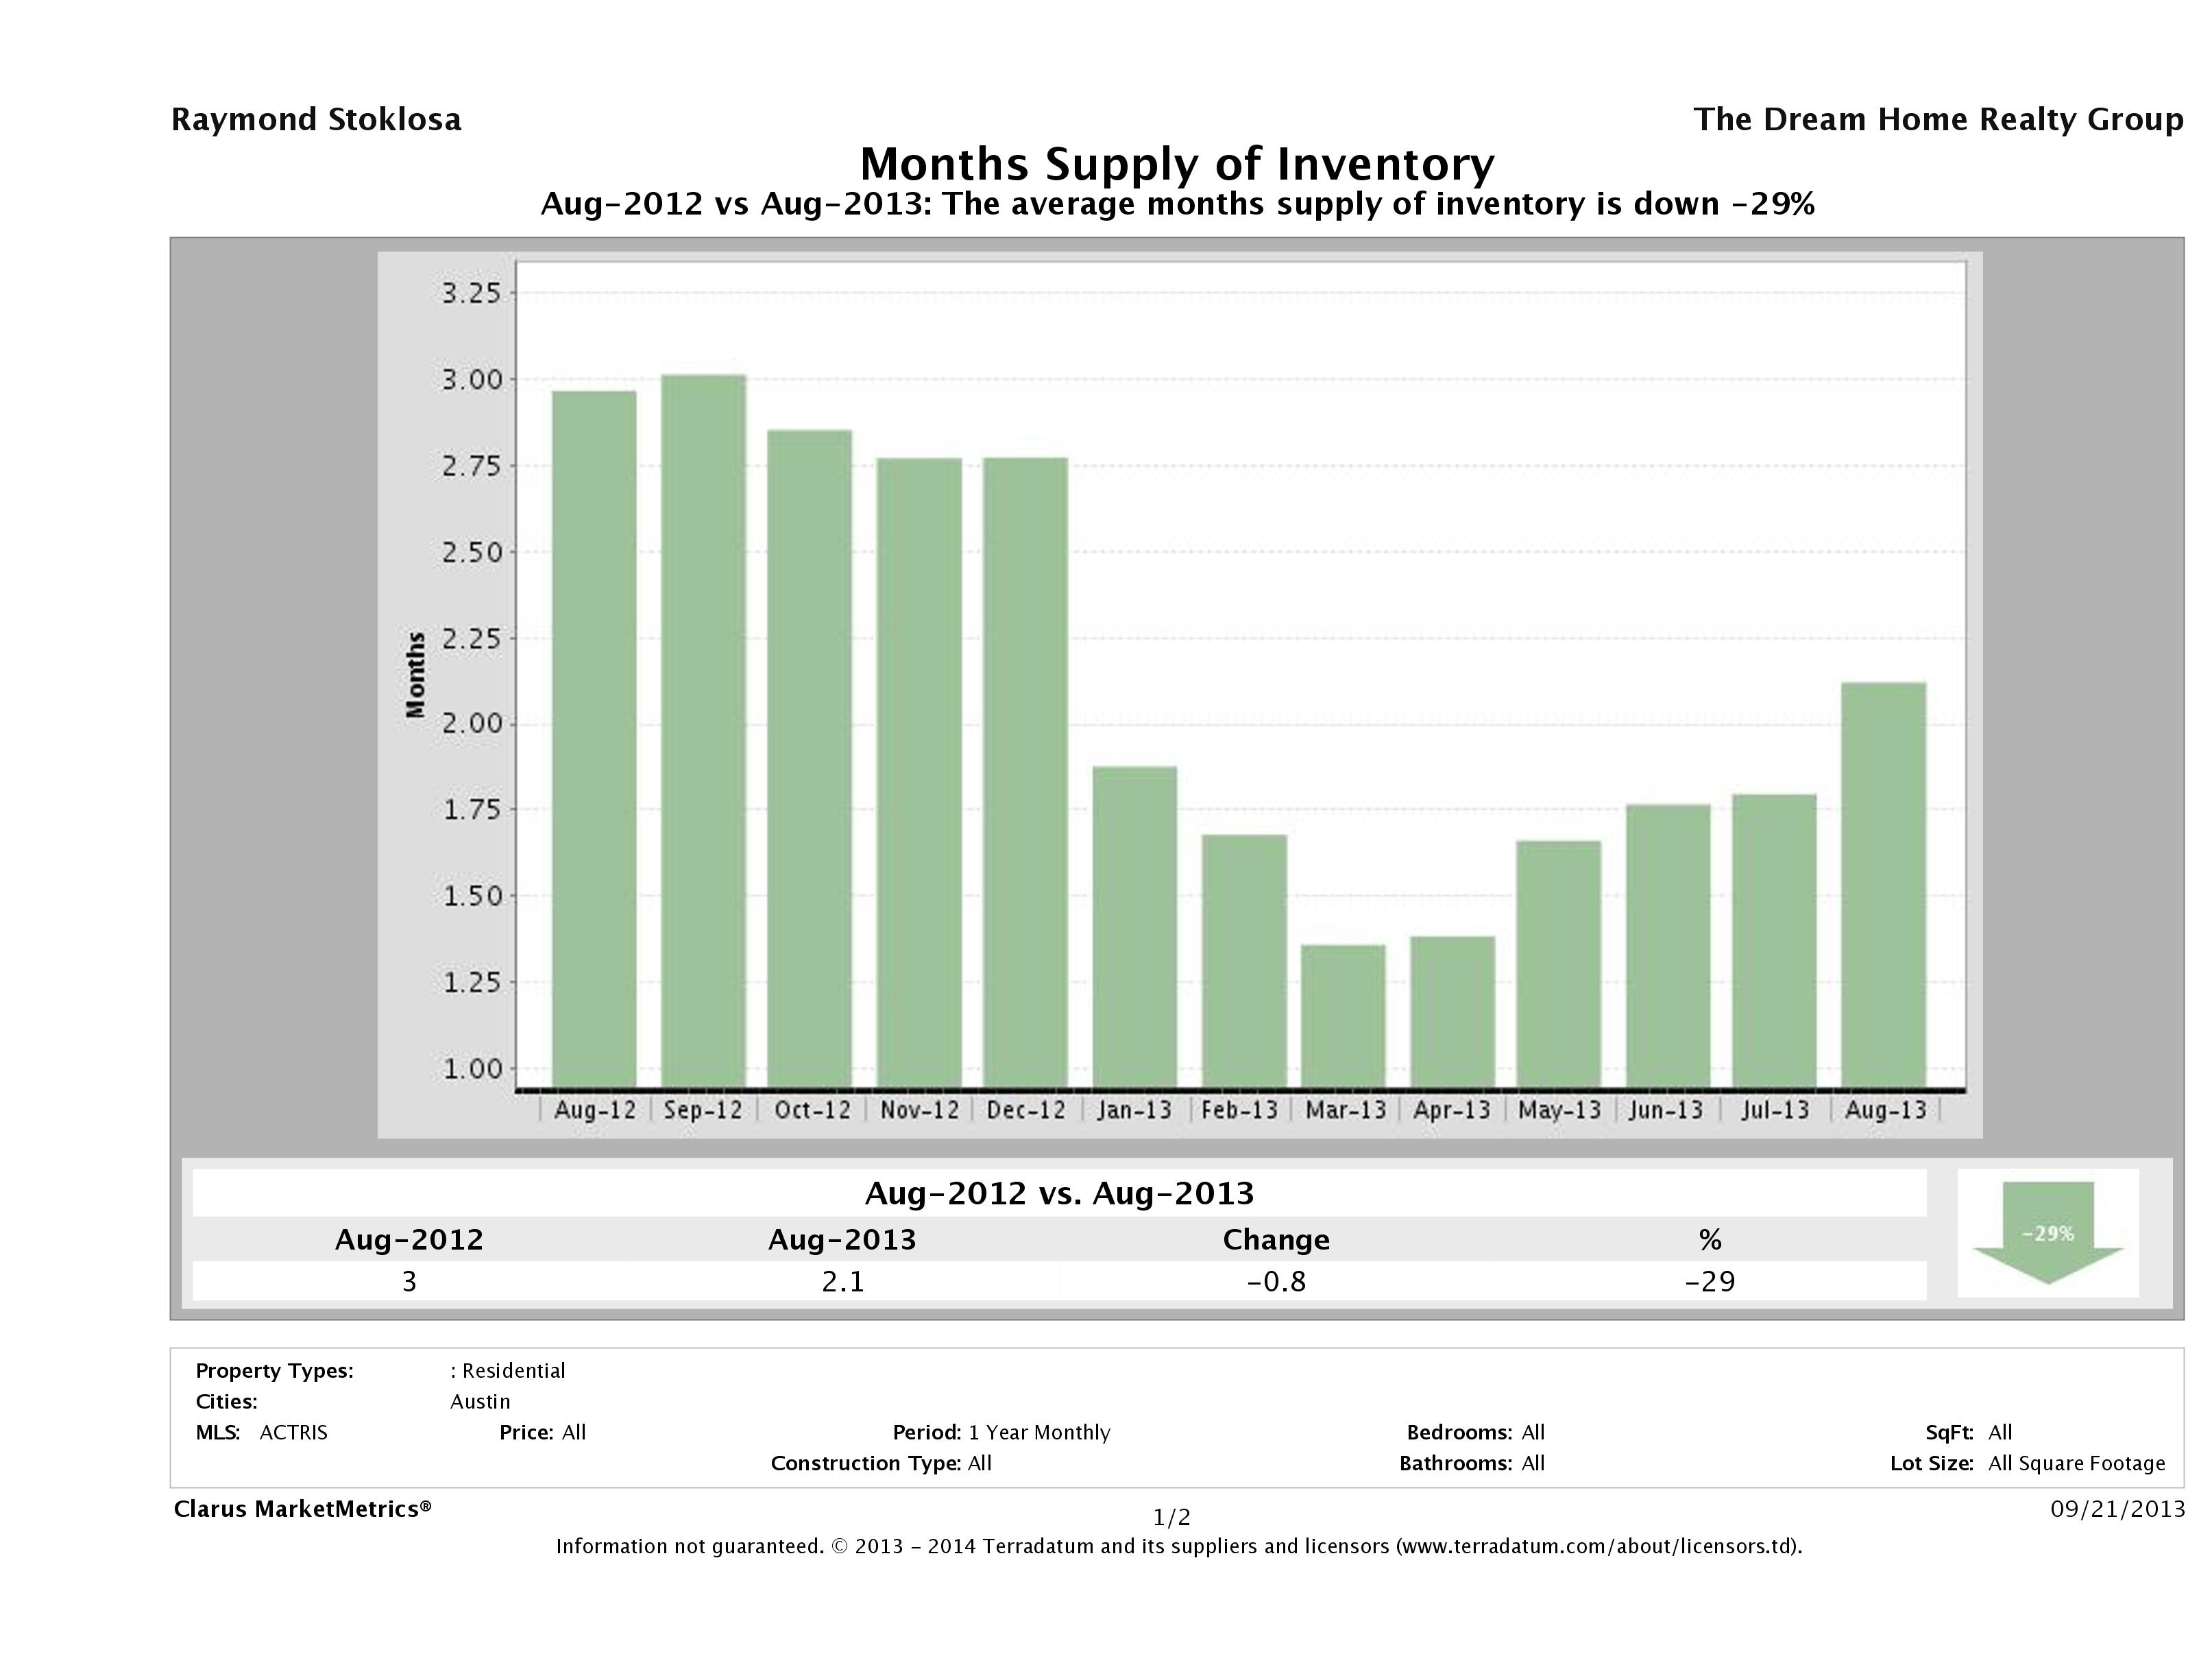
Austin Housing Inventory Down 29%
I almost feel like a broken record to report again as we’ve been saying for the past several months, inventory for single family homes in Austin is down in year over year numbers. In August 2013, we saw a 29% decrease in months supply of inventory in year over year numbers. With a slightly different twist than we’re used to, we’re seeing an increase in inventory from June 2013 and July 2013 numbers. Over the past month or two, we’re seeing sellers who think they can get what they would have gotten when the market was at it’s frenzy of Spring and Summer. Sellers priced right will get their money quickly, but sellers who are unrealistic are facing buyers who are tired of getting pushed around with multiple offers. Though activity is still strong, buyers are waiting for homes that meet their exact search criteria before pulling the trigger. It seems increased interest rates have made buyers pause and think about what they want, rather than throwing money at sellers as we saw in the Spring market. Even still, we have only 2.1 months of inventory available, which is still very low considering this is a city wide average. In August 2012, we saw 3 months of inventory, which is only a 0.8 month decrease, but still significant at 29%.
What does this mean to buyers? Take advantage of this slight slow down in the market. Sure, interest rates are a bit higher than we saw earlier in the year, but they are still under 5%, which is historically incredibly low. What you might lose in monthly cost by this interest rate increase, might be made up with reduced prices. Homes that are priced right for this market are still selling quickly, so don’t wait weeks to go out and see homes that seem to match your search criteria. Be proactive and beat other, lazy buyers to the punch.
What does this mean to sellers? If you’re thinking about selling, get your home on the market as quickly as you can and price it right. Though rising interest rates have caused buyers to pause and take inventory, there are still motivated buyers looking for homes to buy. Price it right now and you’ll get your home sold and moved before the slower, winter months. Historically, we see homes that sell in Fall get more money than homes that sell in Winter. Even though Austin doesn’t have a hard core Winter with snow and bad weather, we still see a slow down in buyer activity. Less buyers means less demand. Plus, if you can sell during Fall and buy during Winter, you might end up timing your move right to sell for as much as you can and buy for as little as you can.
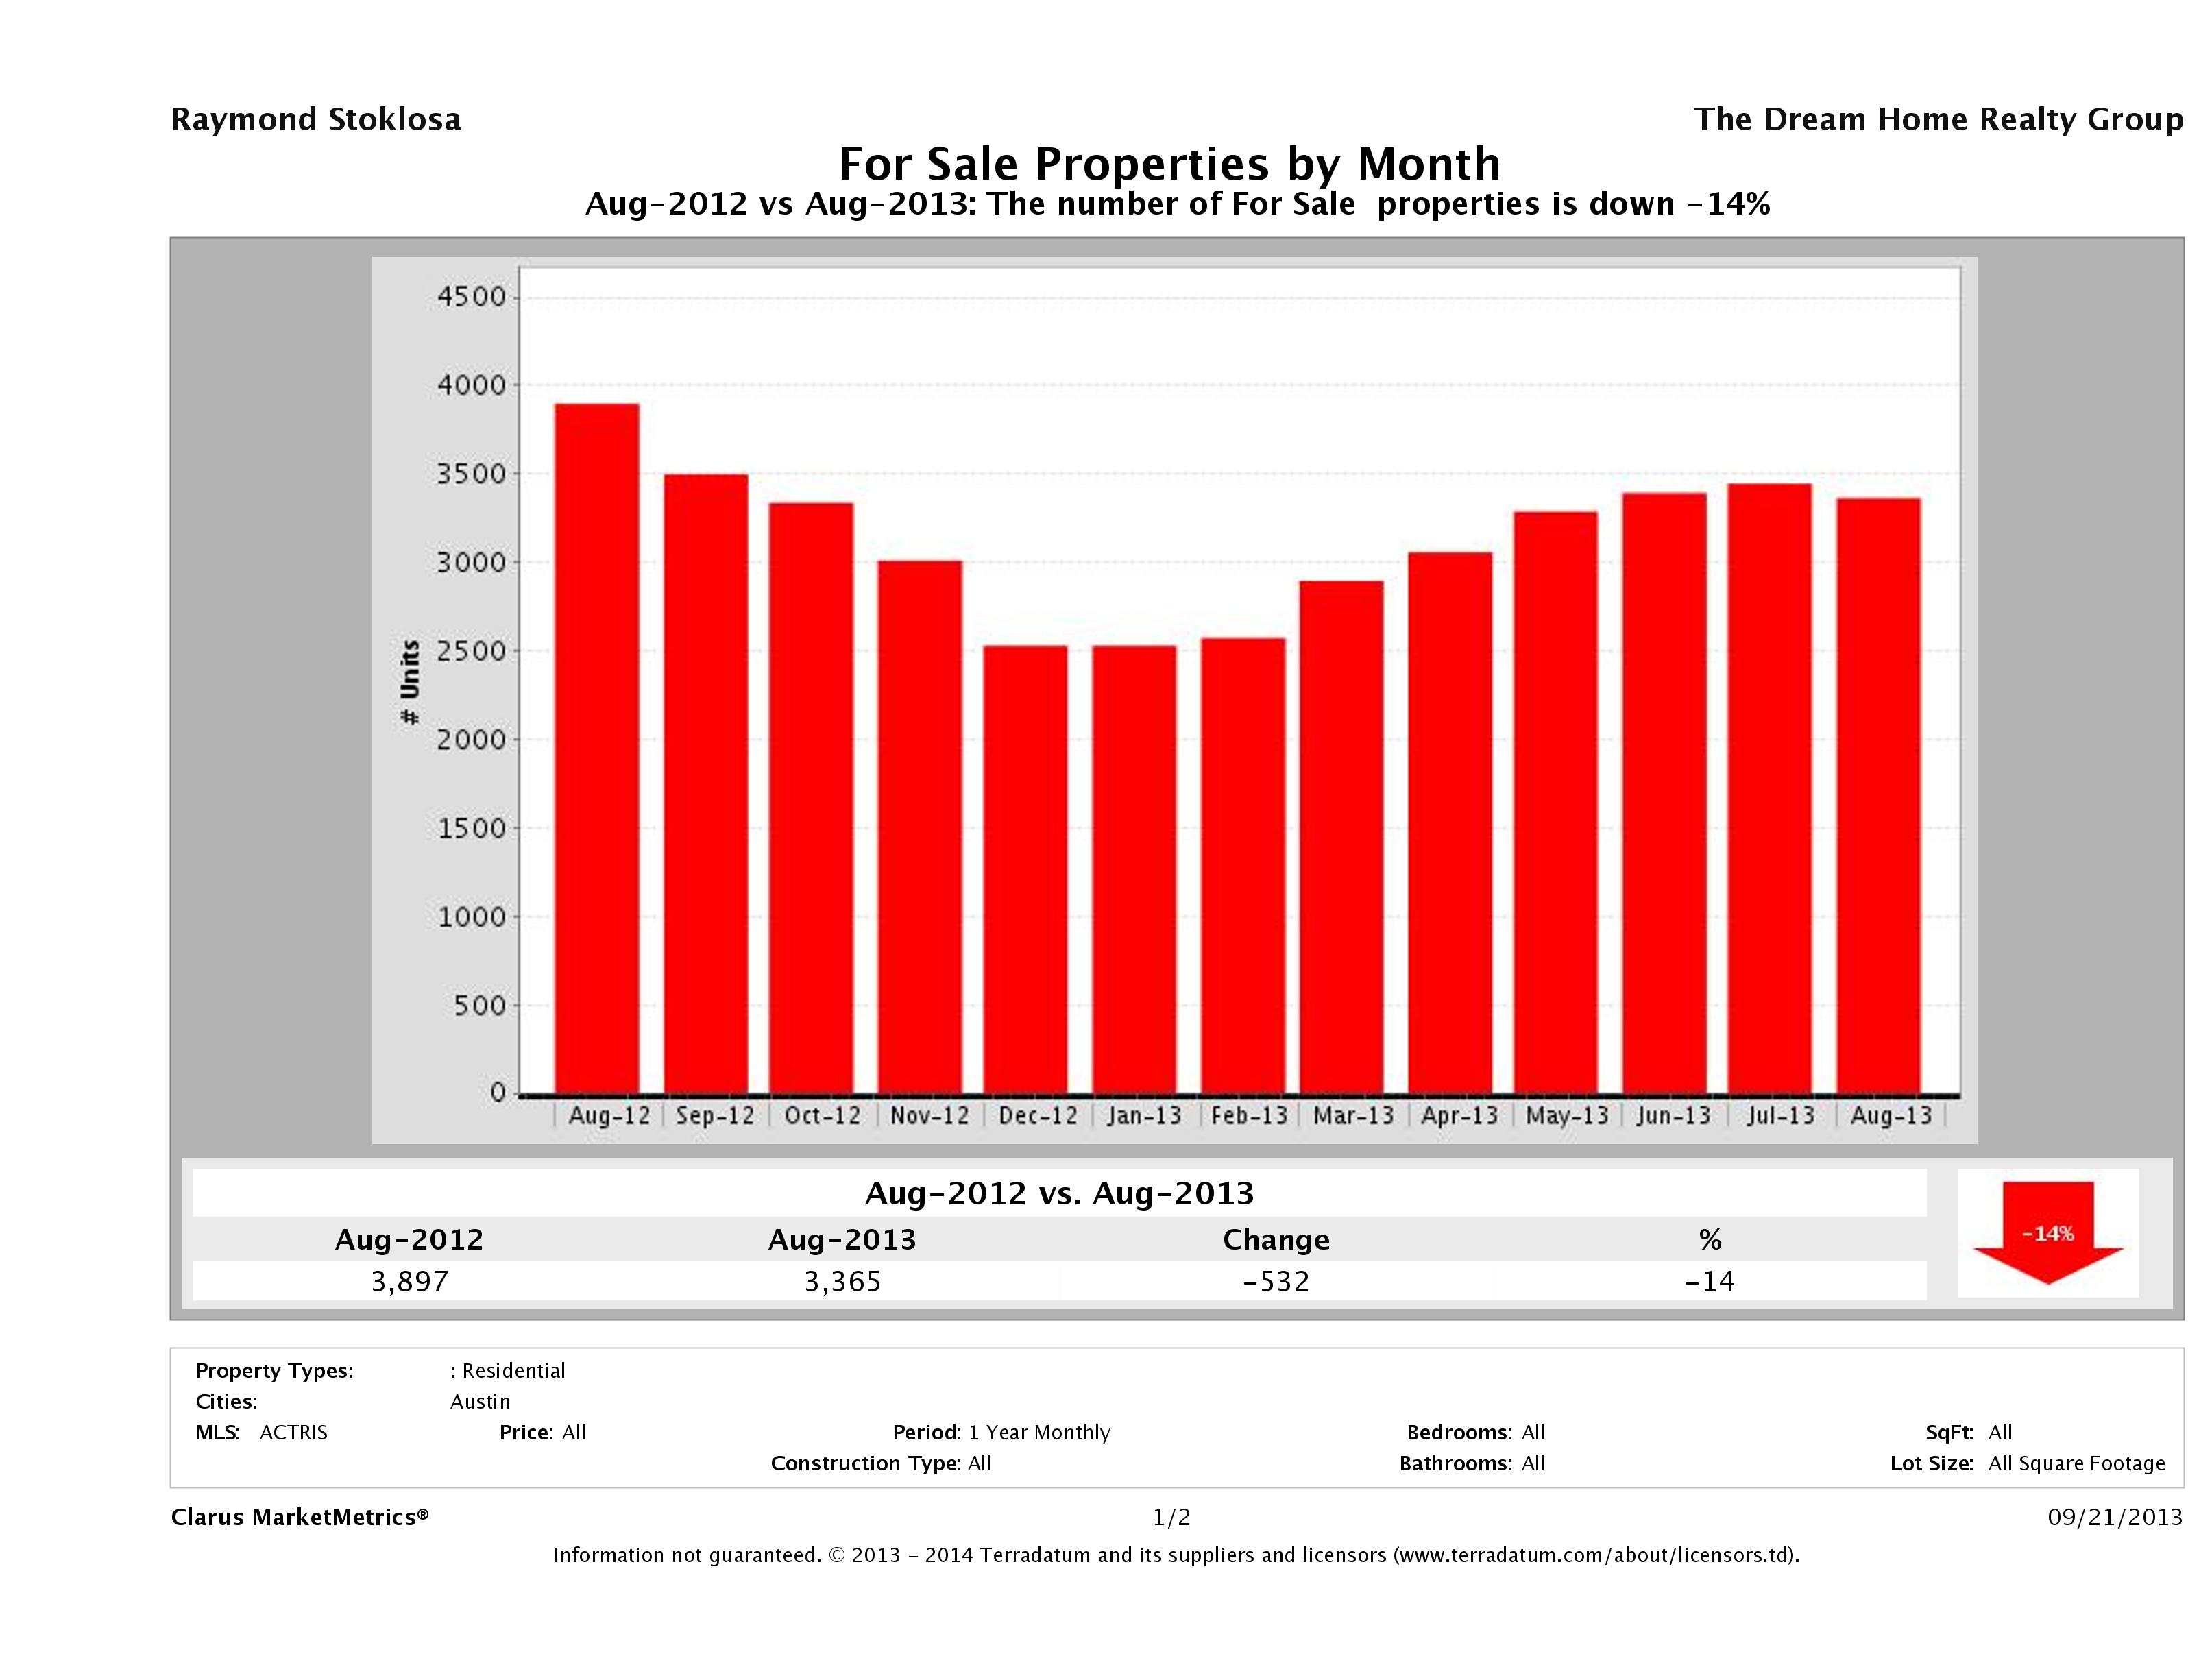
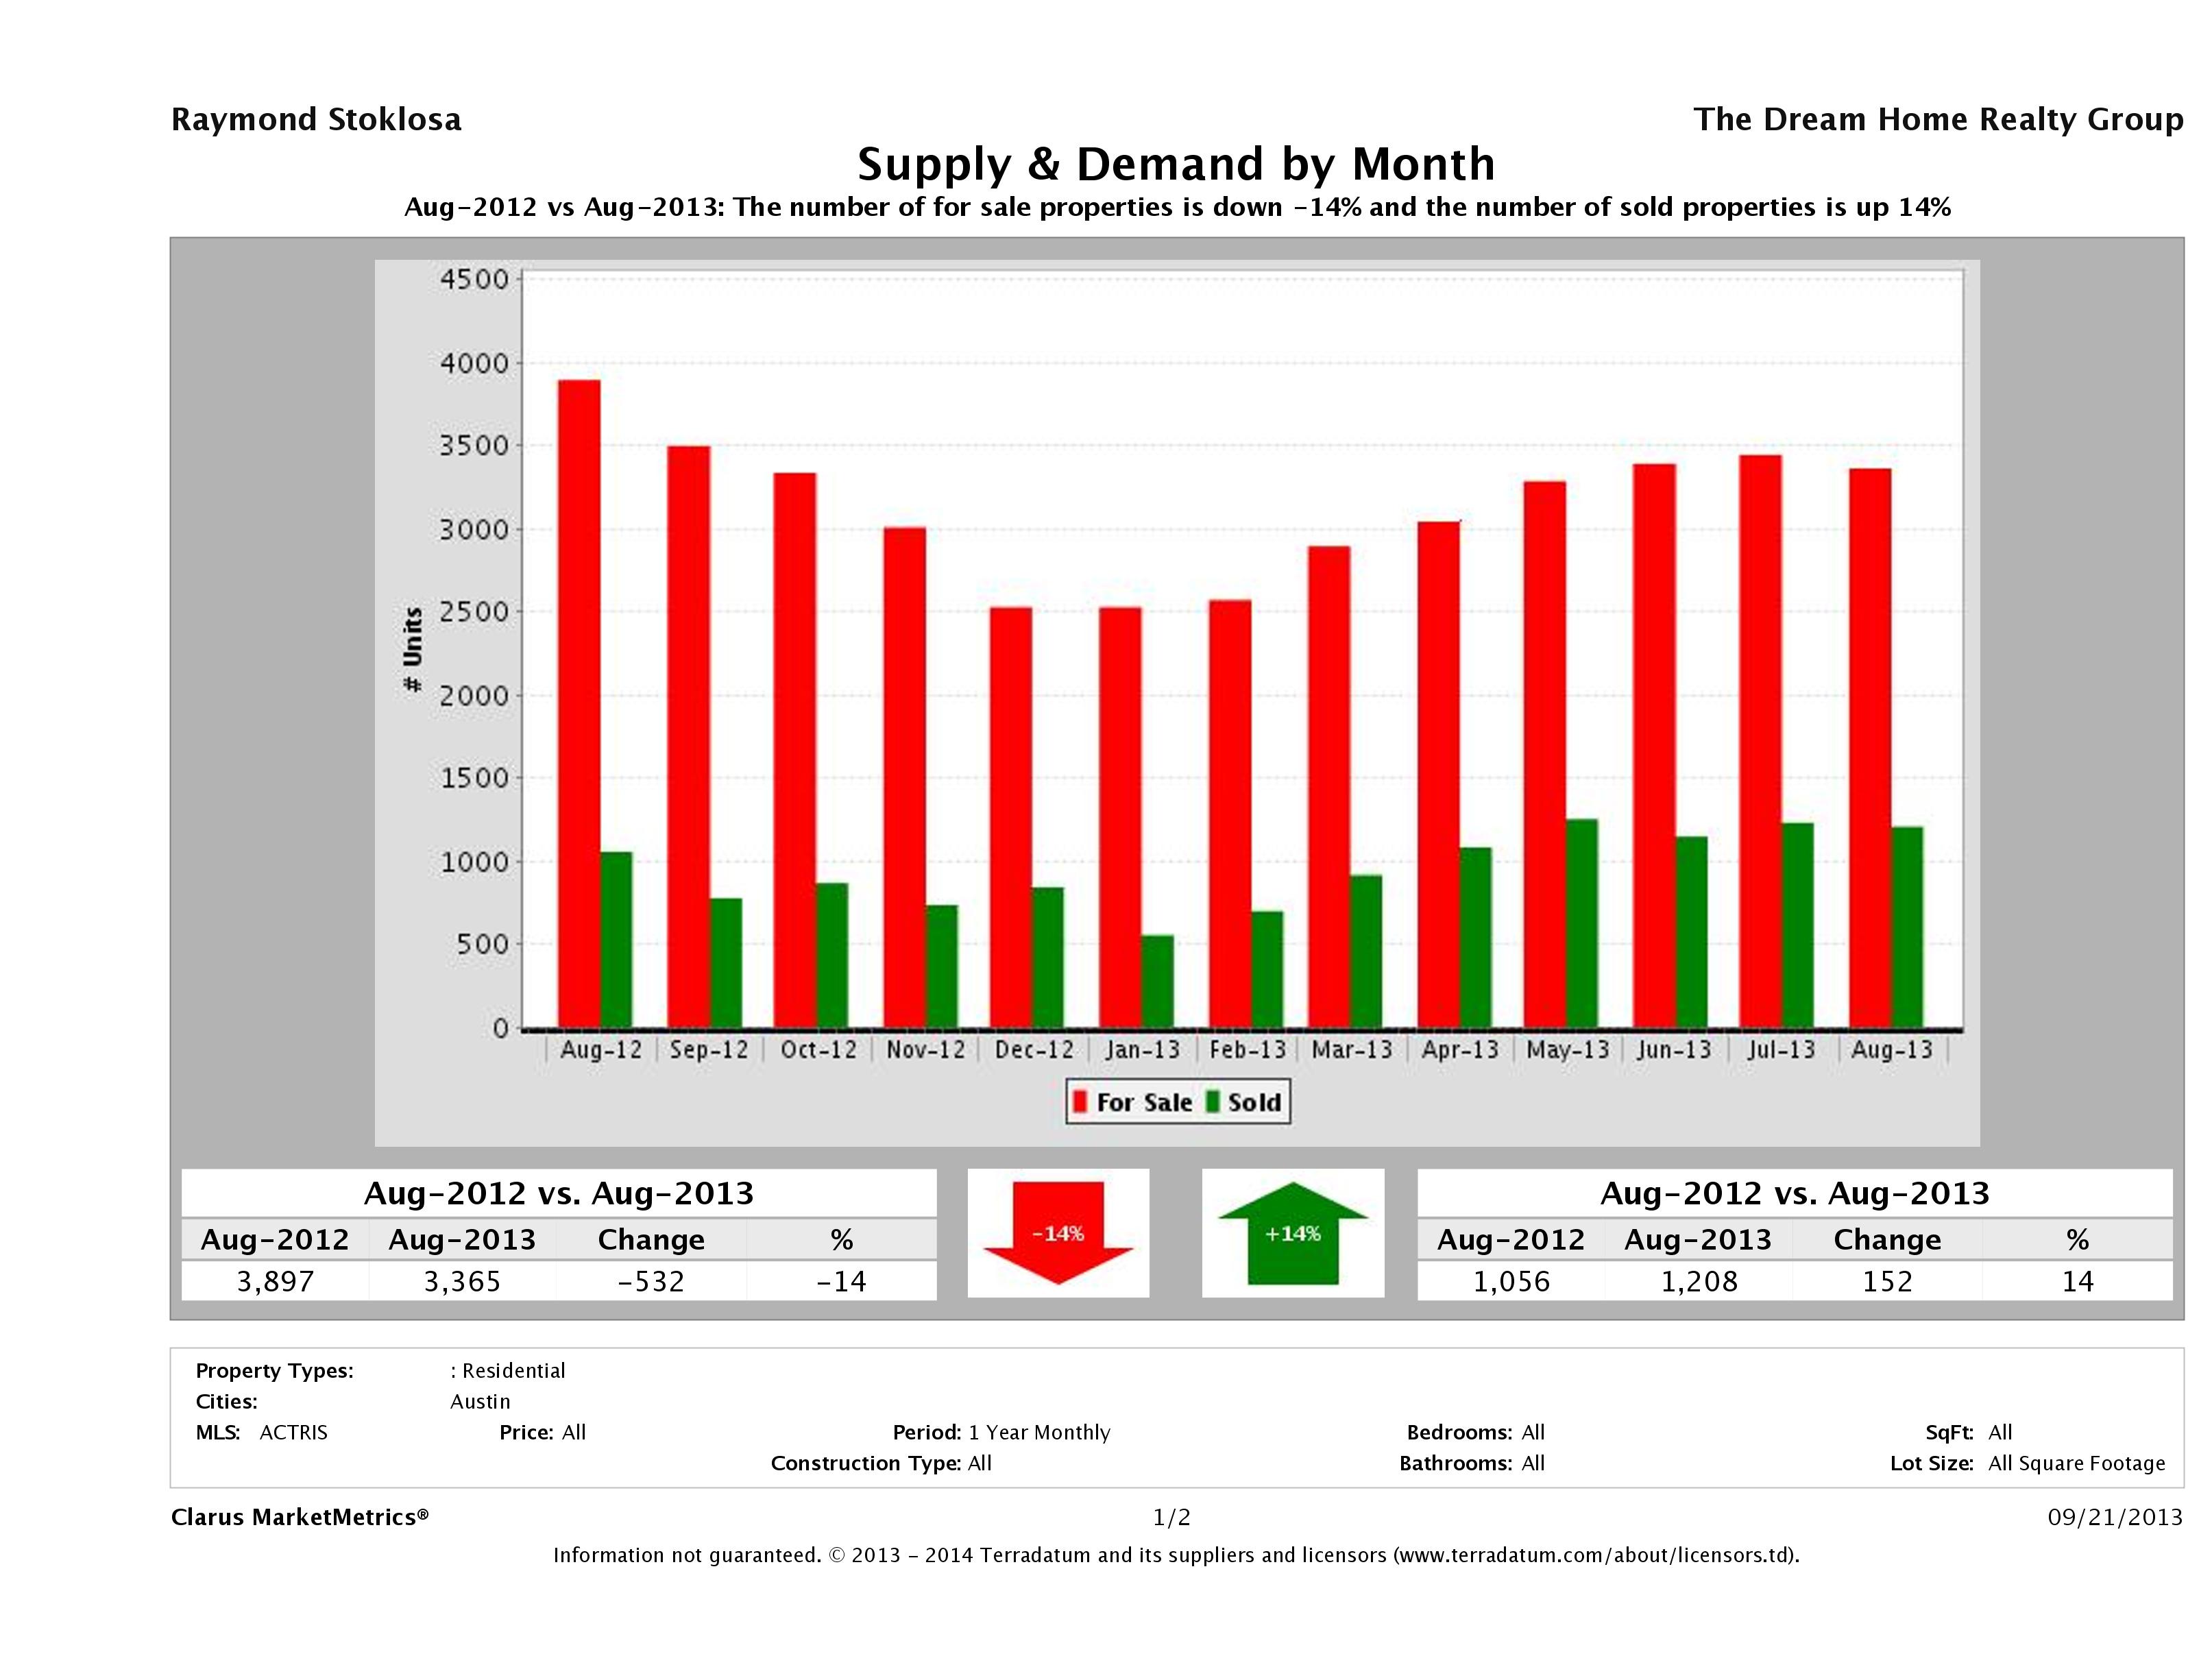
14% Fewer Homes on the Market than August 2012
In August 2013, we had 3,365 homes for sale in Austin, compared to 3,897 in August 2012. Though this isn’t a huge decrease, it is still much less than we’re used to which confirms buyer demand is strong.
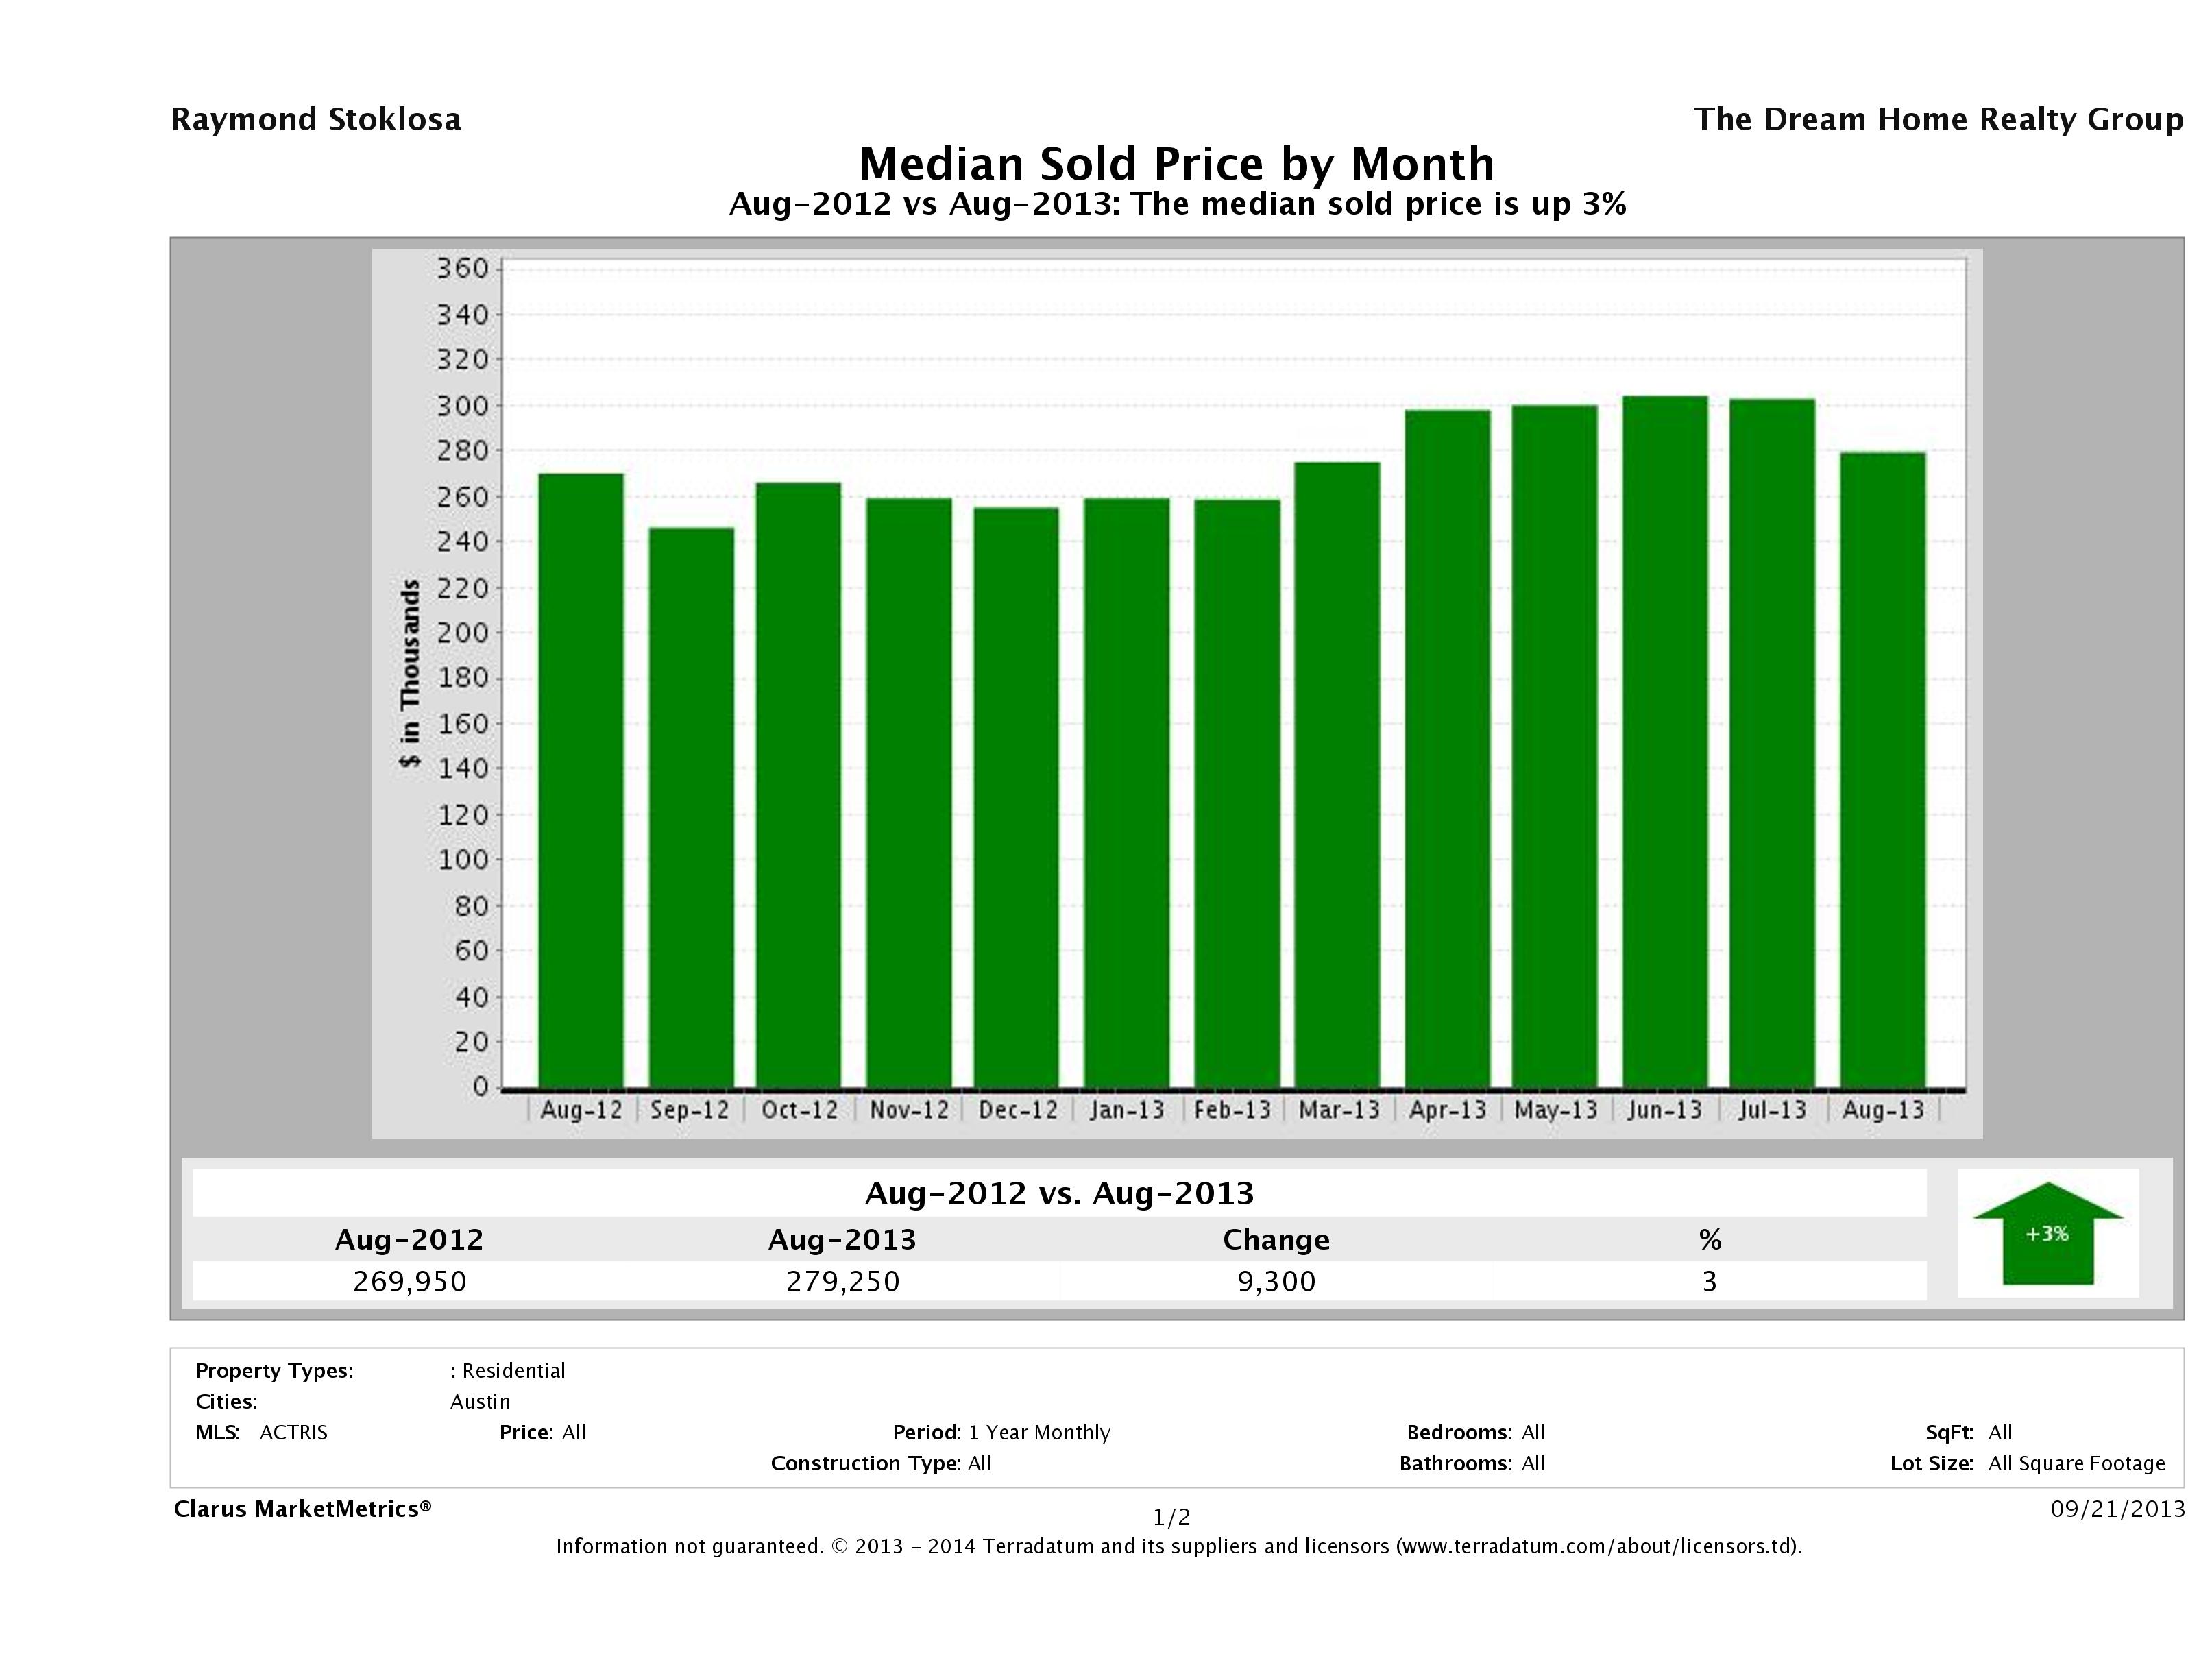
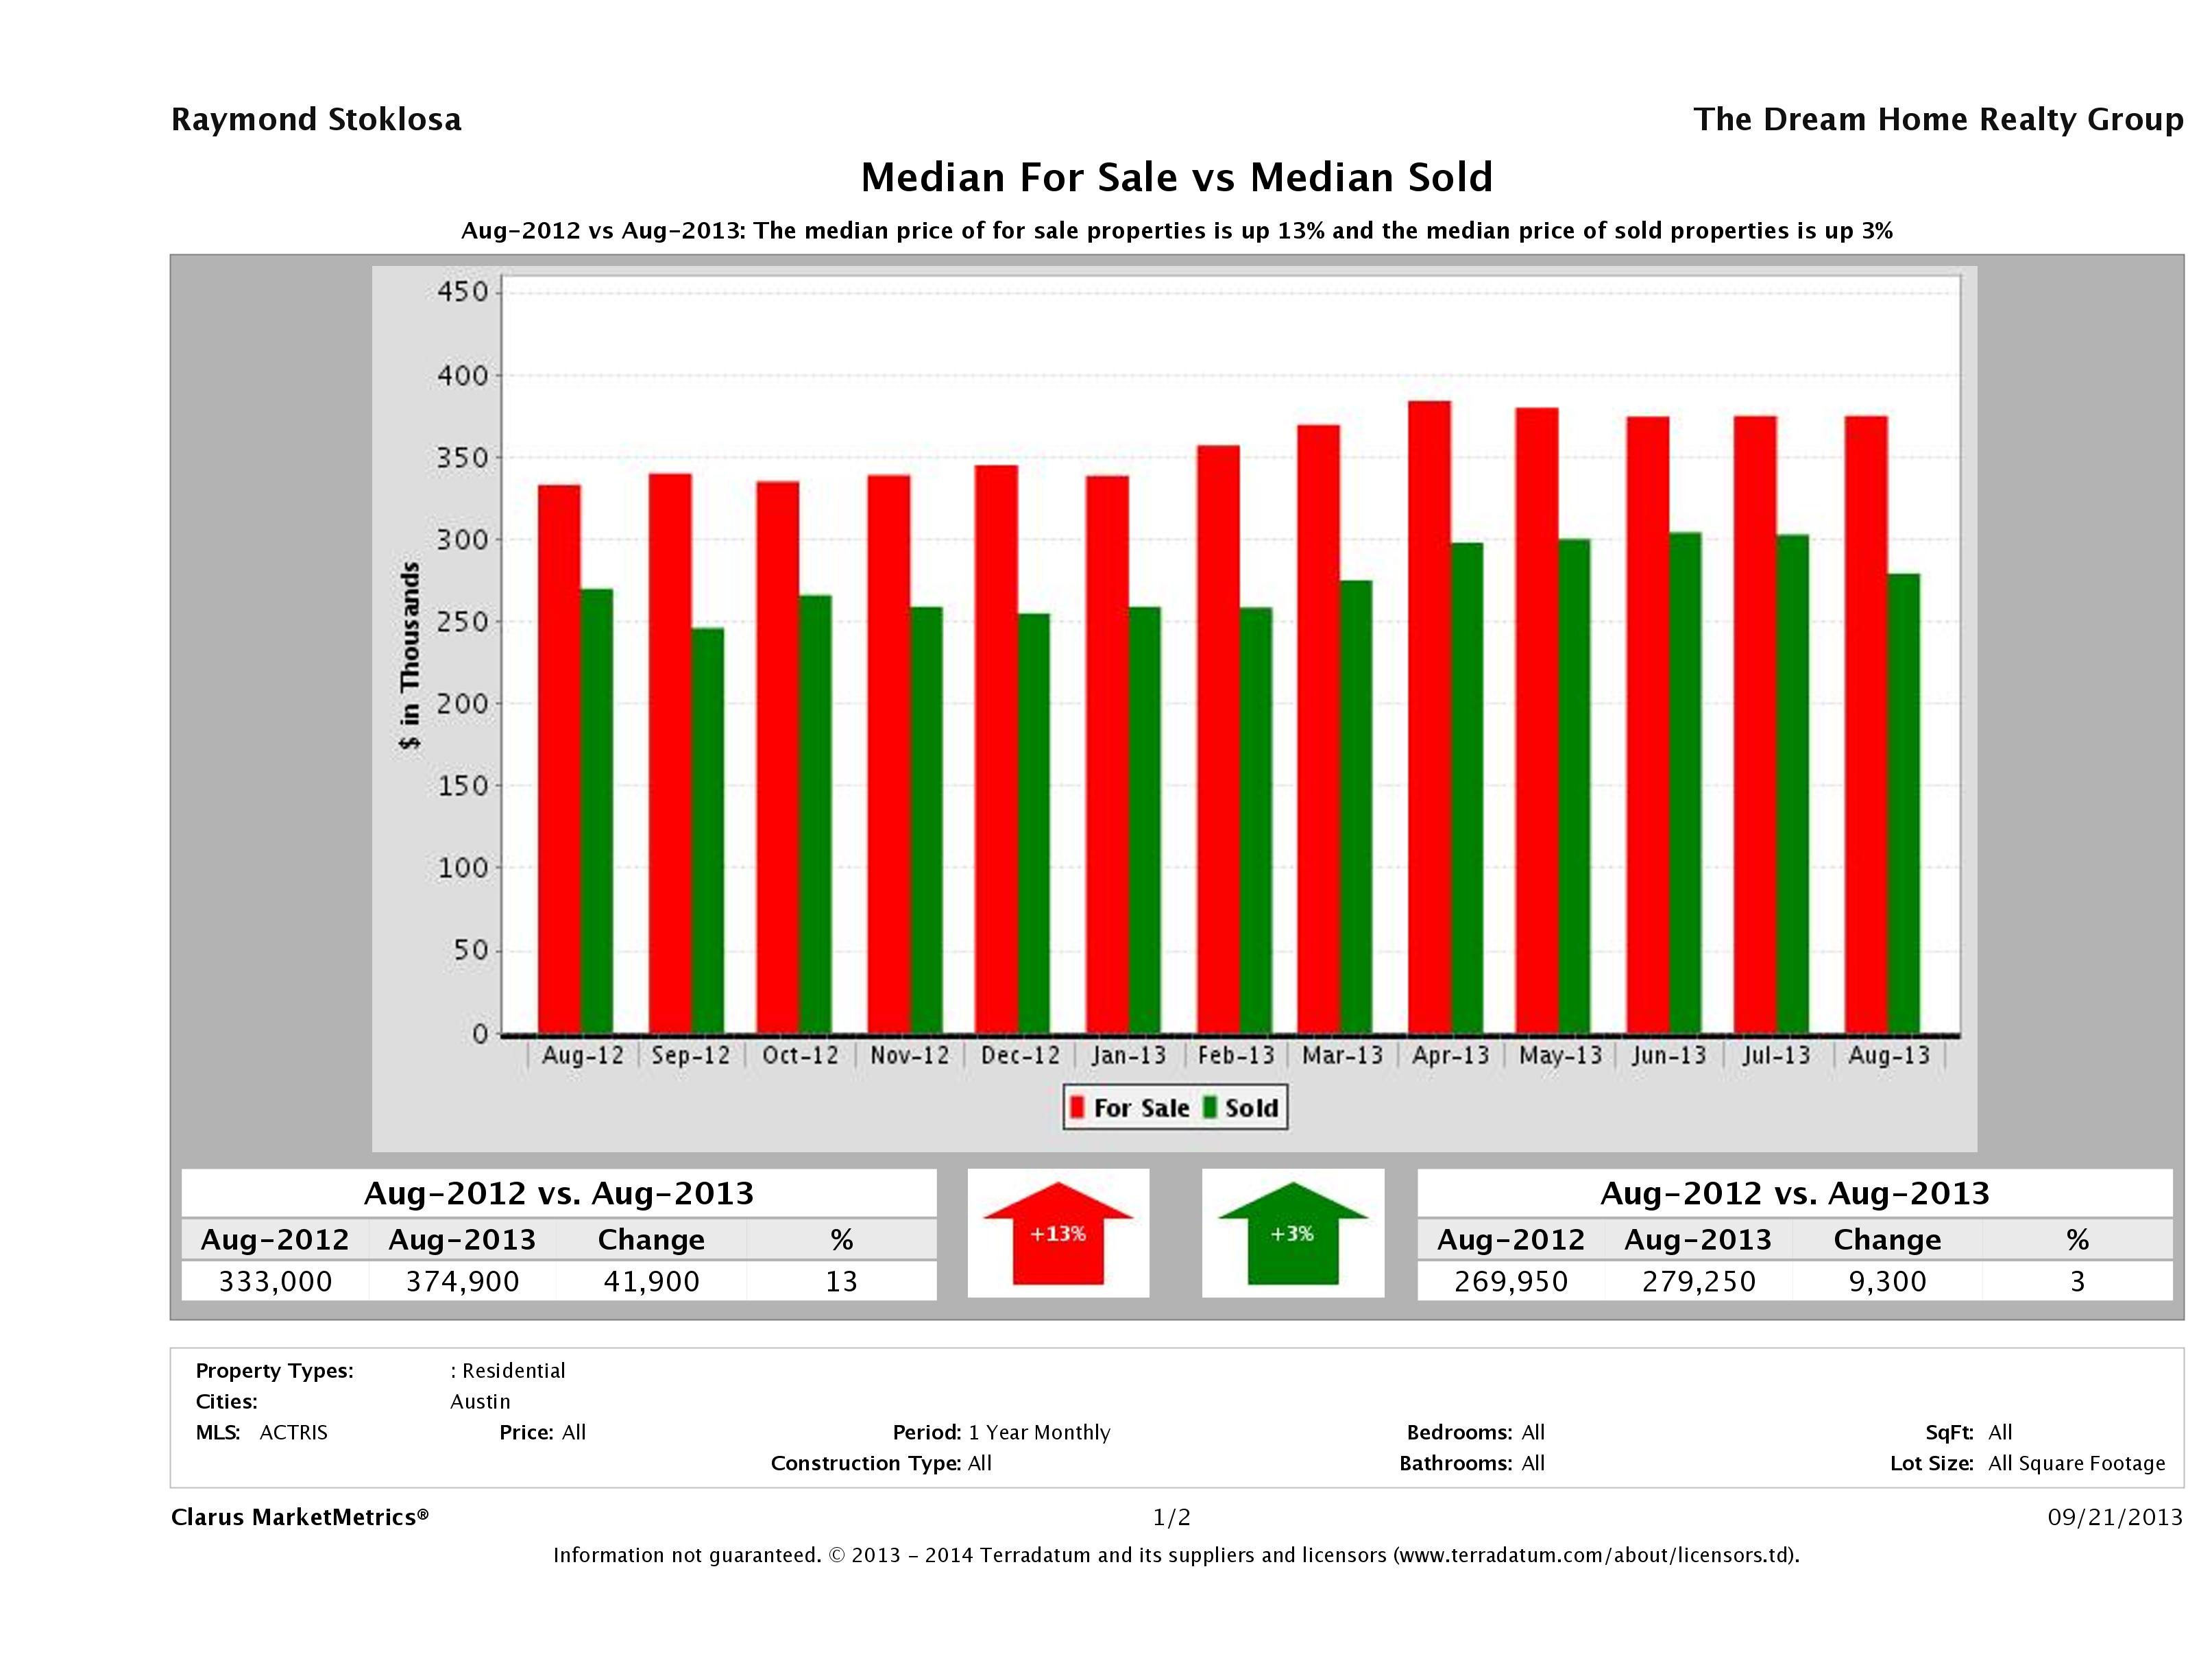
Austin Median Home Price Up 3%
This month, we saw a 3% increase in the median home sale price of a home in Austin. In August 2013, the median home price was $279,250 compared to $269,950 in August 2012. Median home price helps us see the distribution of homes being sold and does not really give us an indication of the increase or decrease in a particular home’s market value. To analyze market value, we’d have to take an in depth look at a neighborhood. If you’re looking for something like that, please check out our Austin Neighborhood Market Reports.
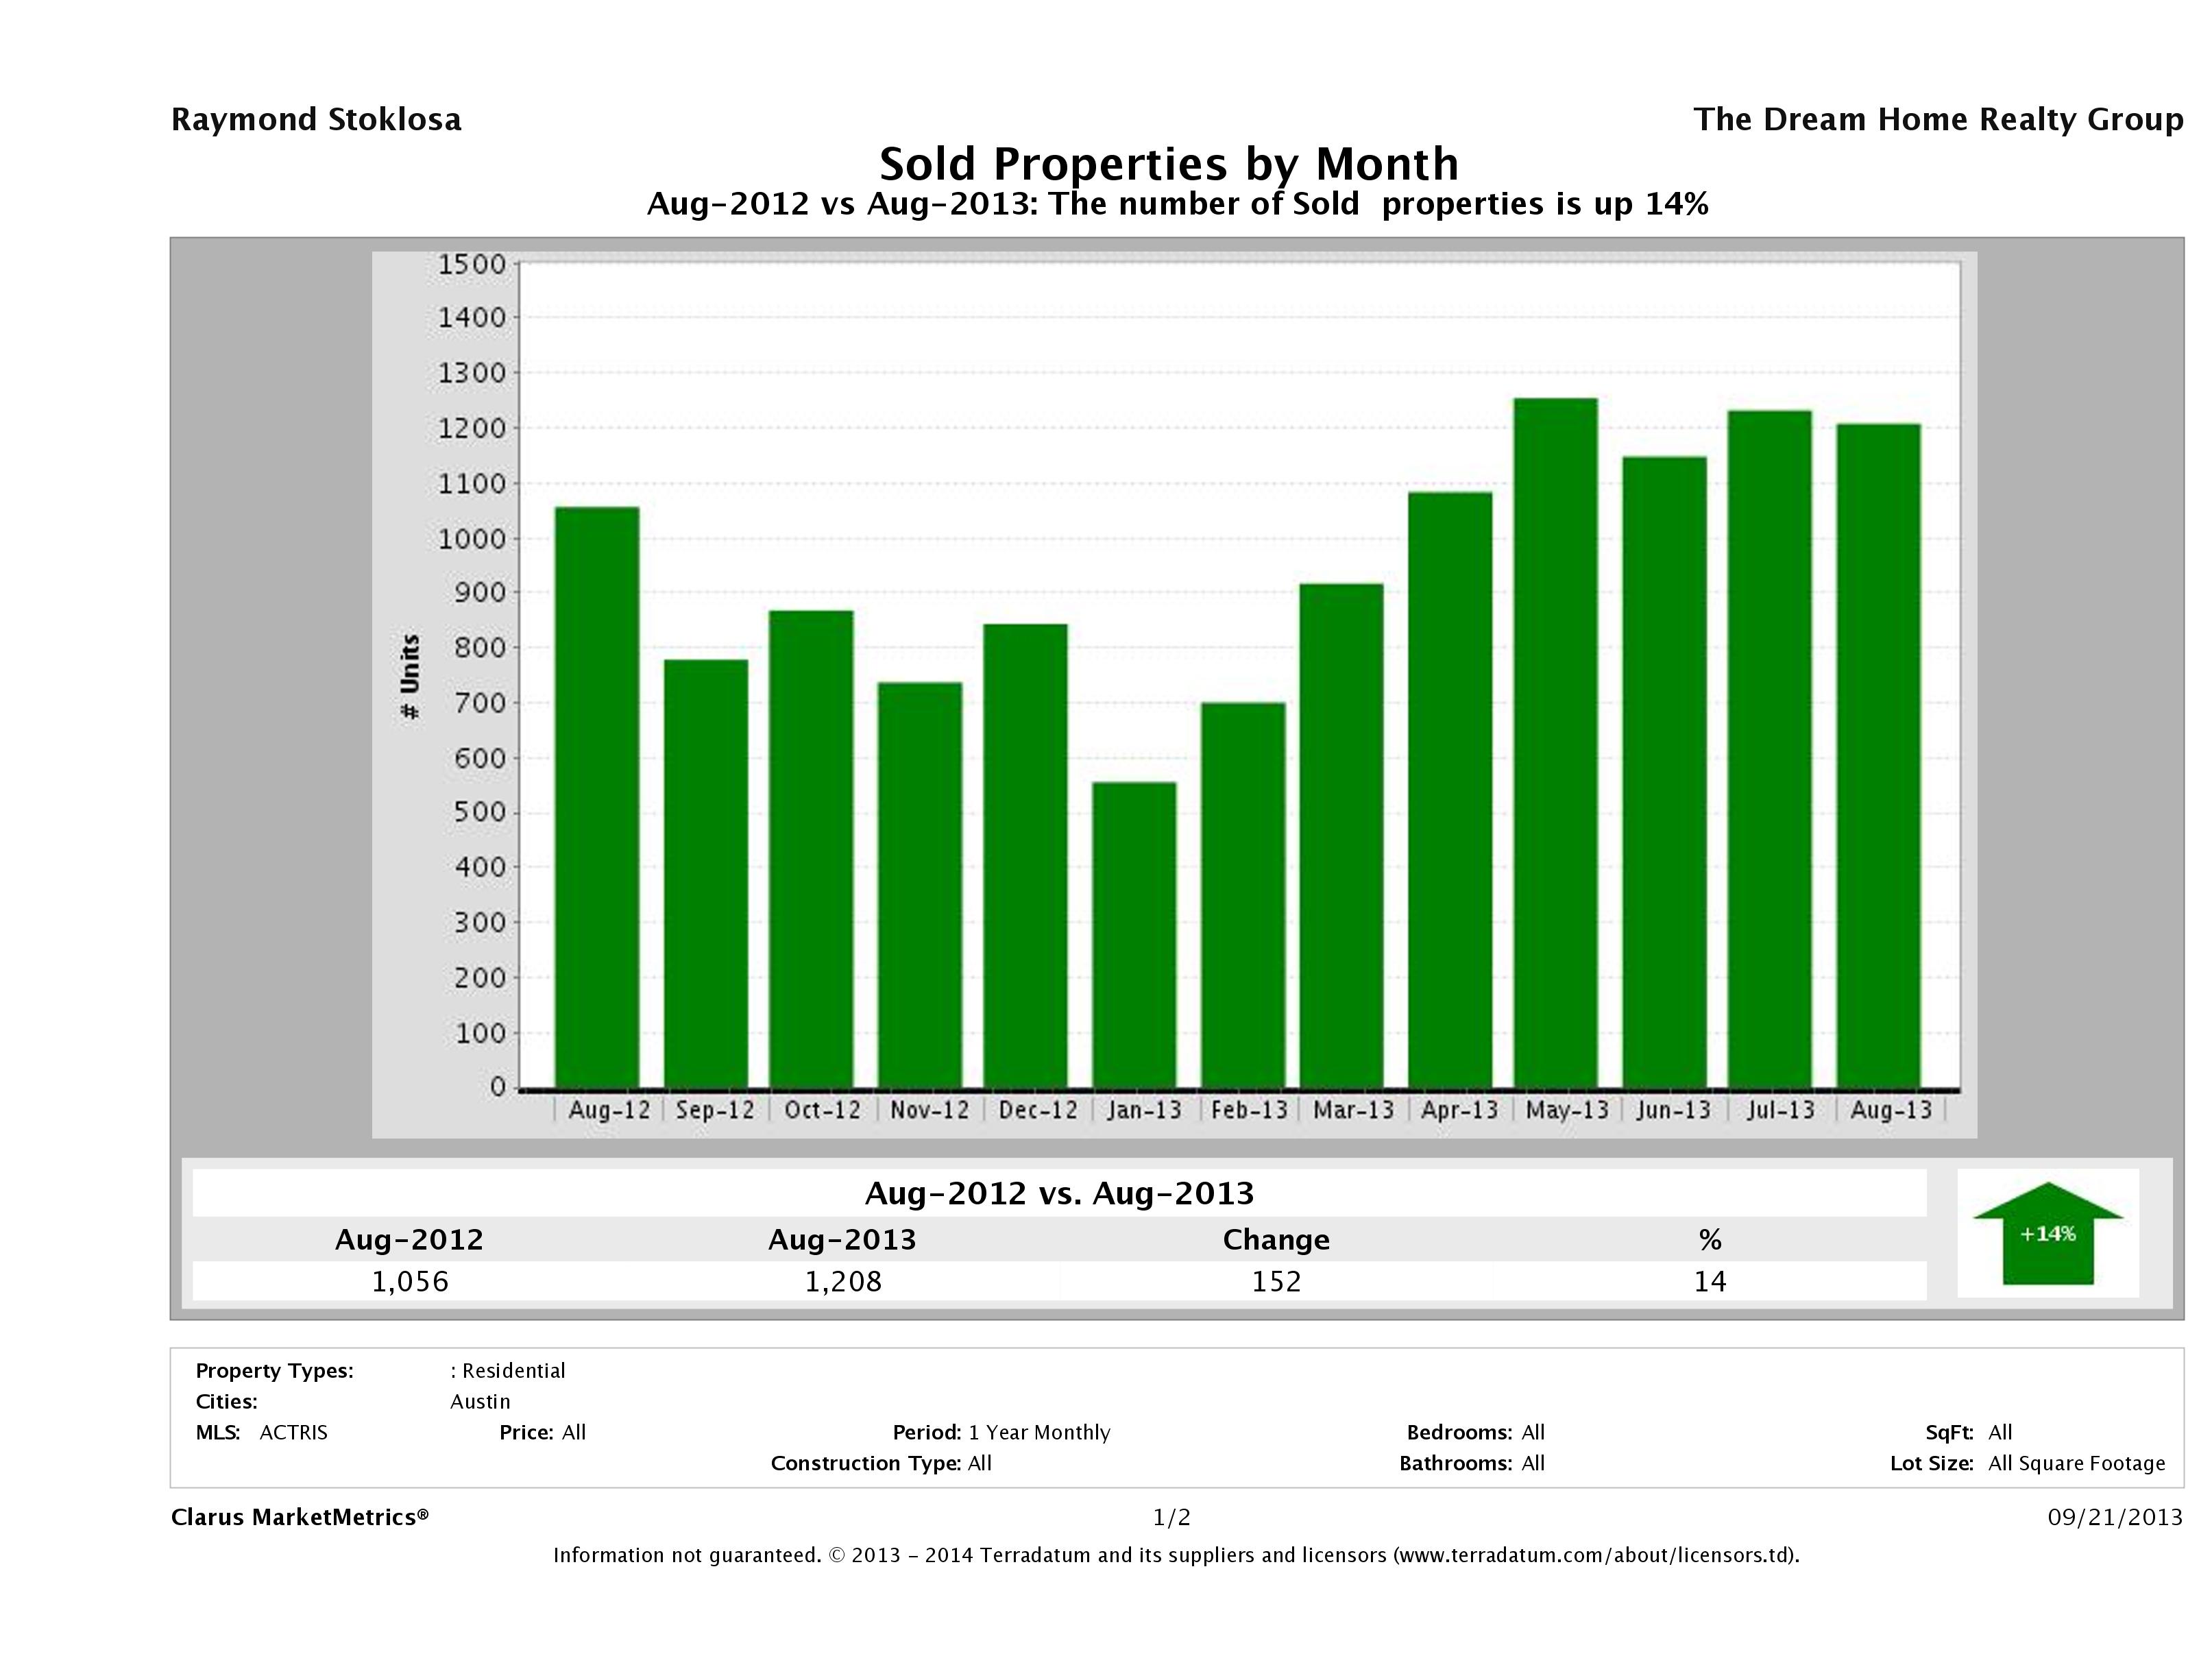
Number of Sold Homes in Austin Up 14%
In August 2013, Austin saw a 14% increase in the number of homes sold from August 2012 to August 2013 numbers. In August 2013, we saw 1,208 homes sell in Austin compared to 1,056 in August 2012. These numbers are essentially the same numbers we saw in year over year numbers when comparing July 2013 and July 2012 numbers. It seems the usual slowdown we see in August hasn’t hit us yet. It will be interesting to see what types of numbers September brings.
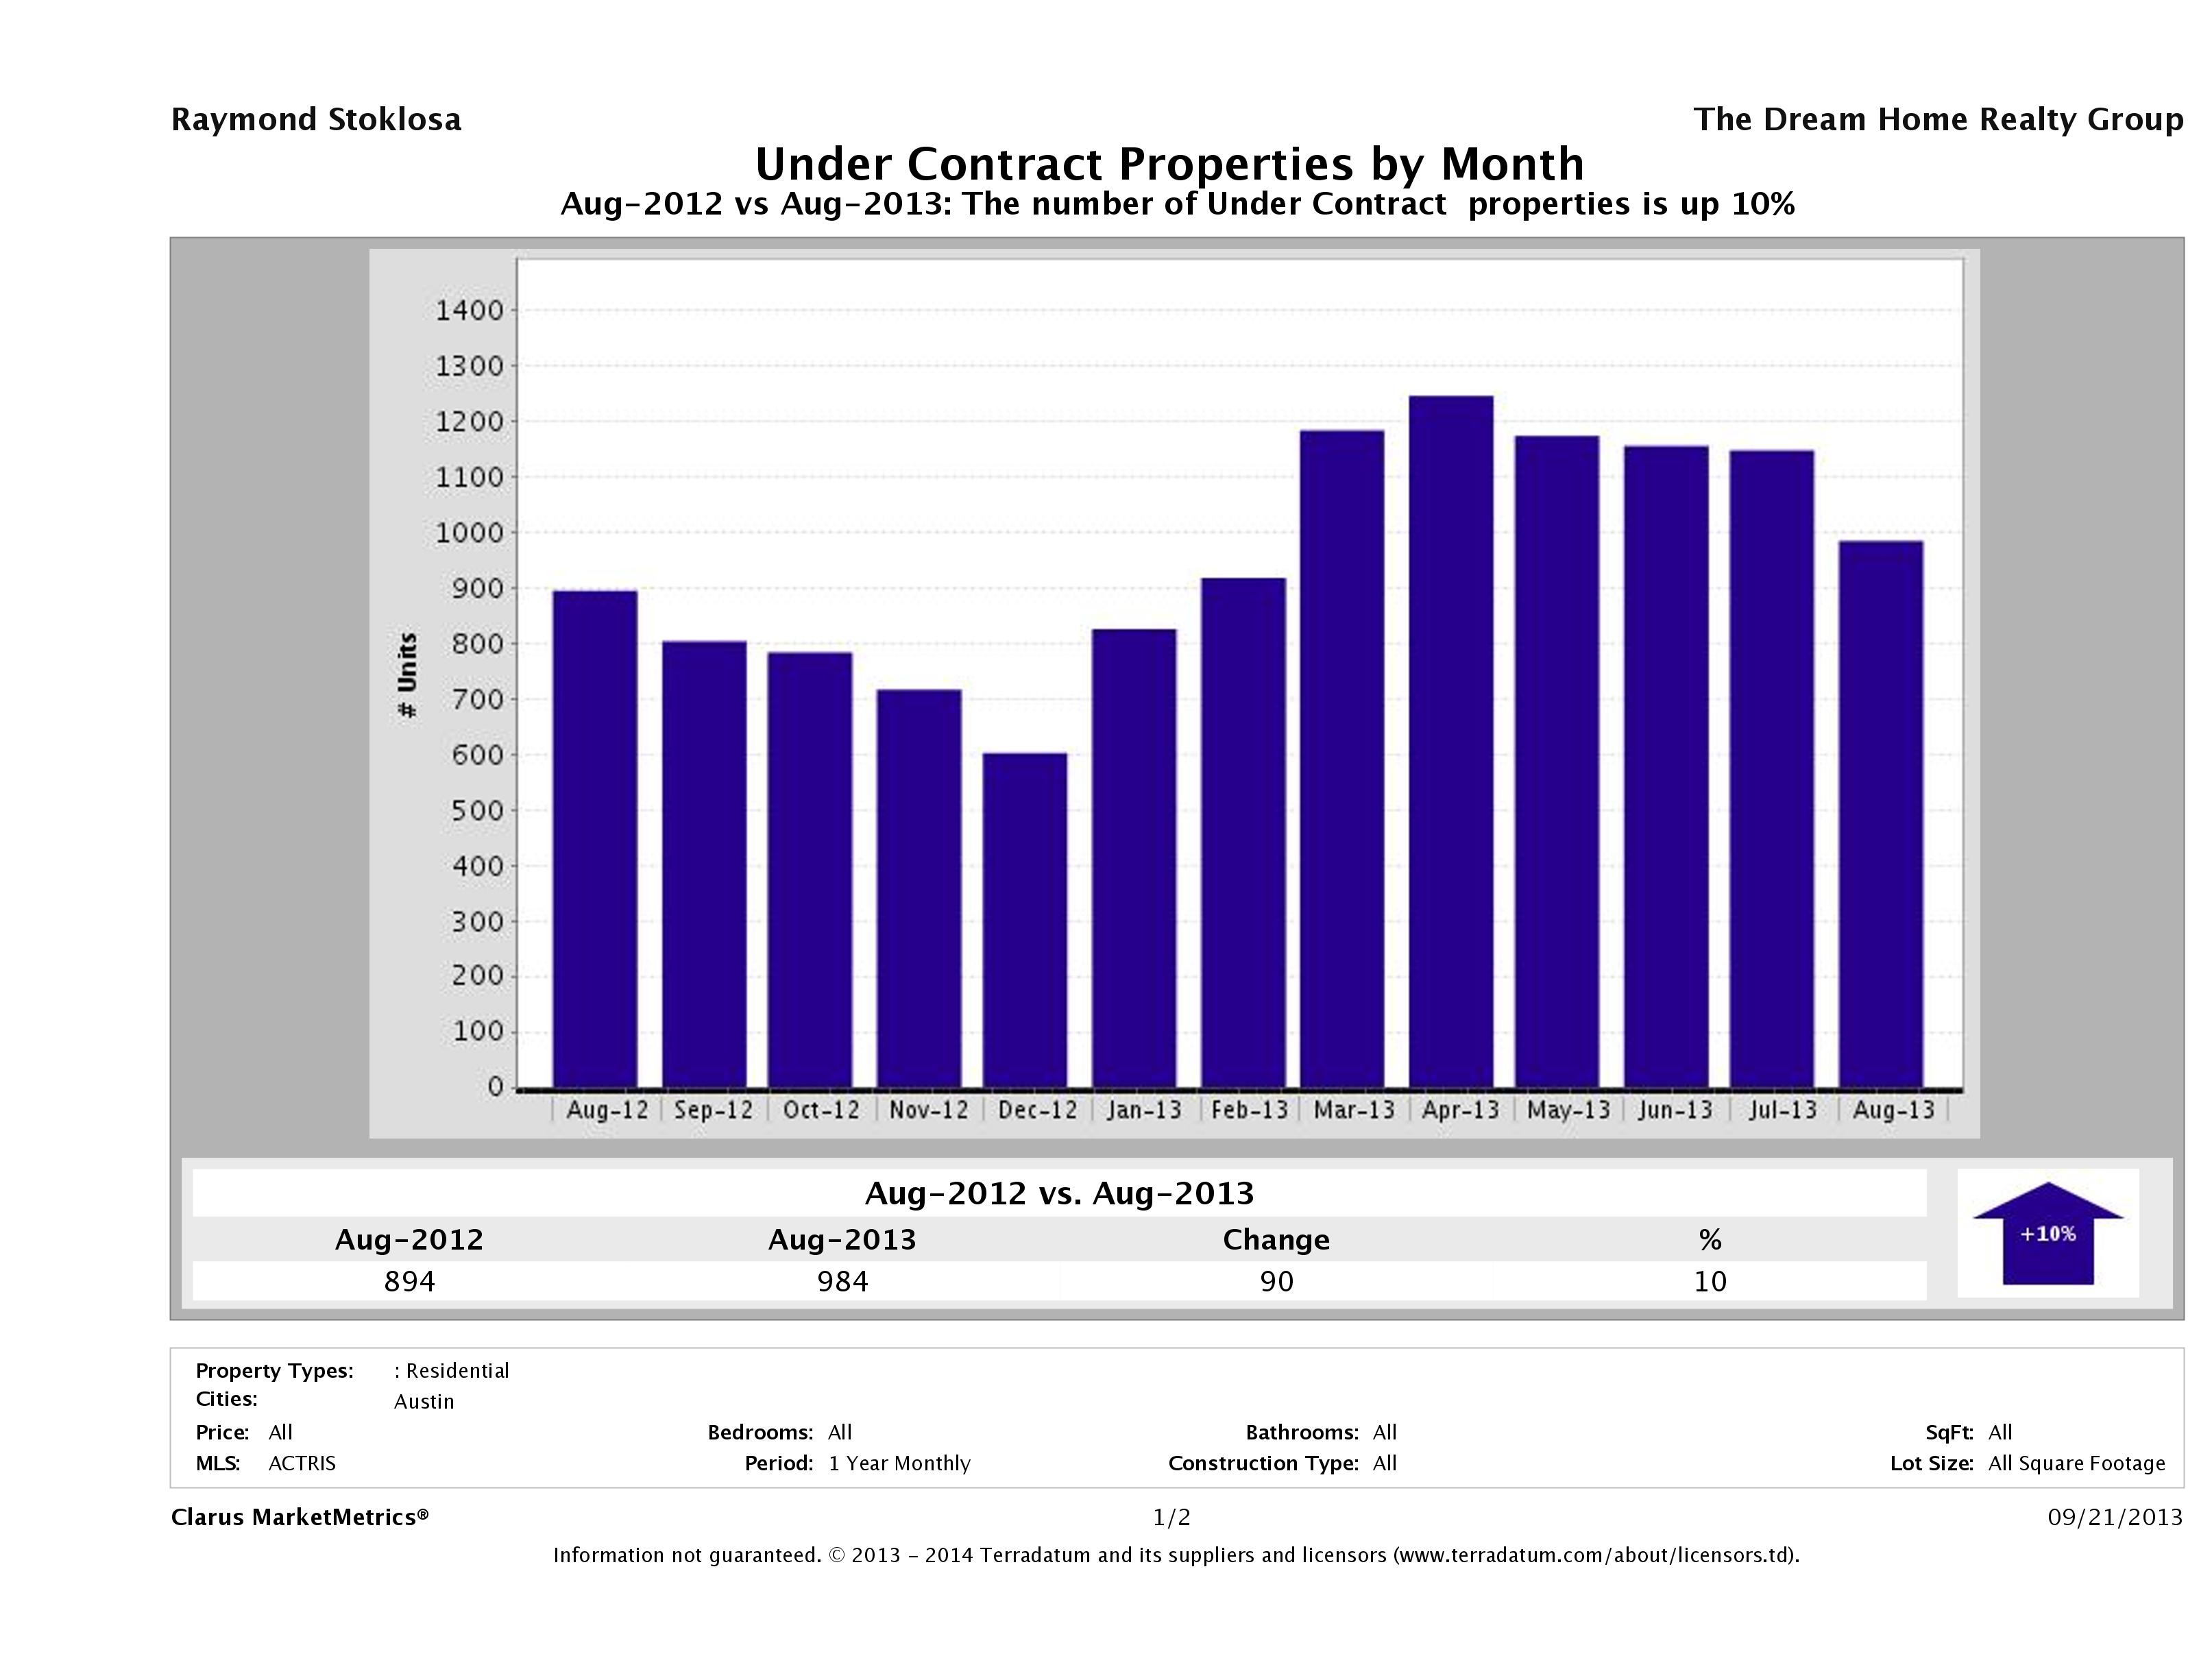
10% More Austin Homes Under Contract
In August 2013, there were 984 homes that went pending compared to 894 in August 2012 marking a 10% increase in year over year numbers. 2013 has started out strong and continues to bring offers to the most desirable properties. It will be interesting to see if we see any sort of slow down in Fall/Winter or if it continues to stay strong.
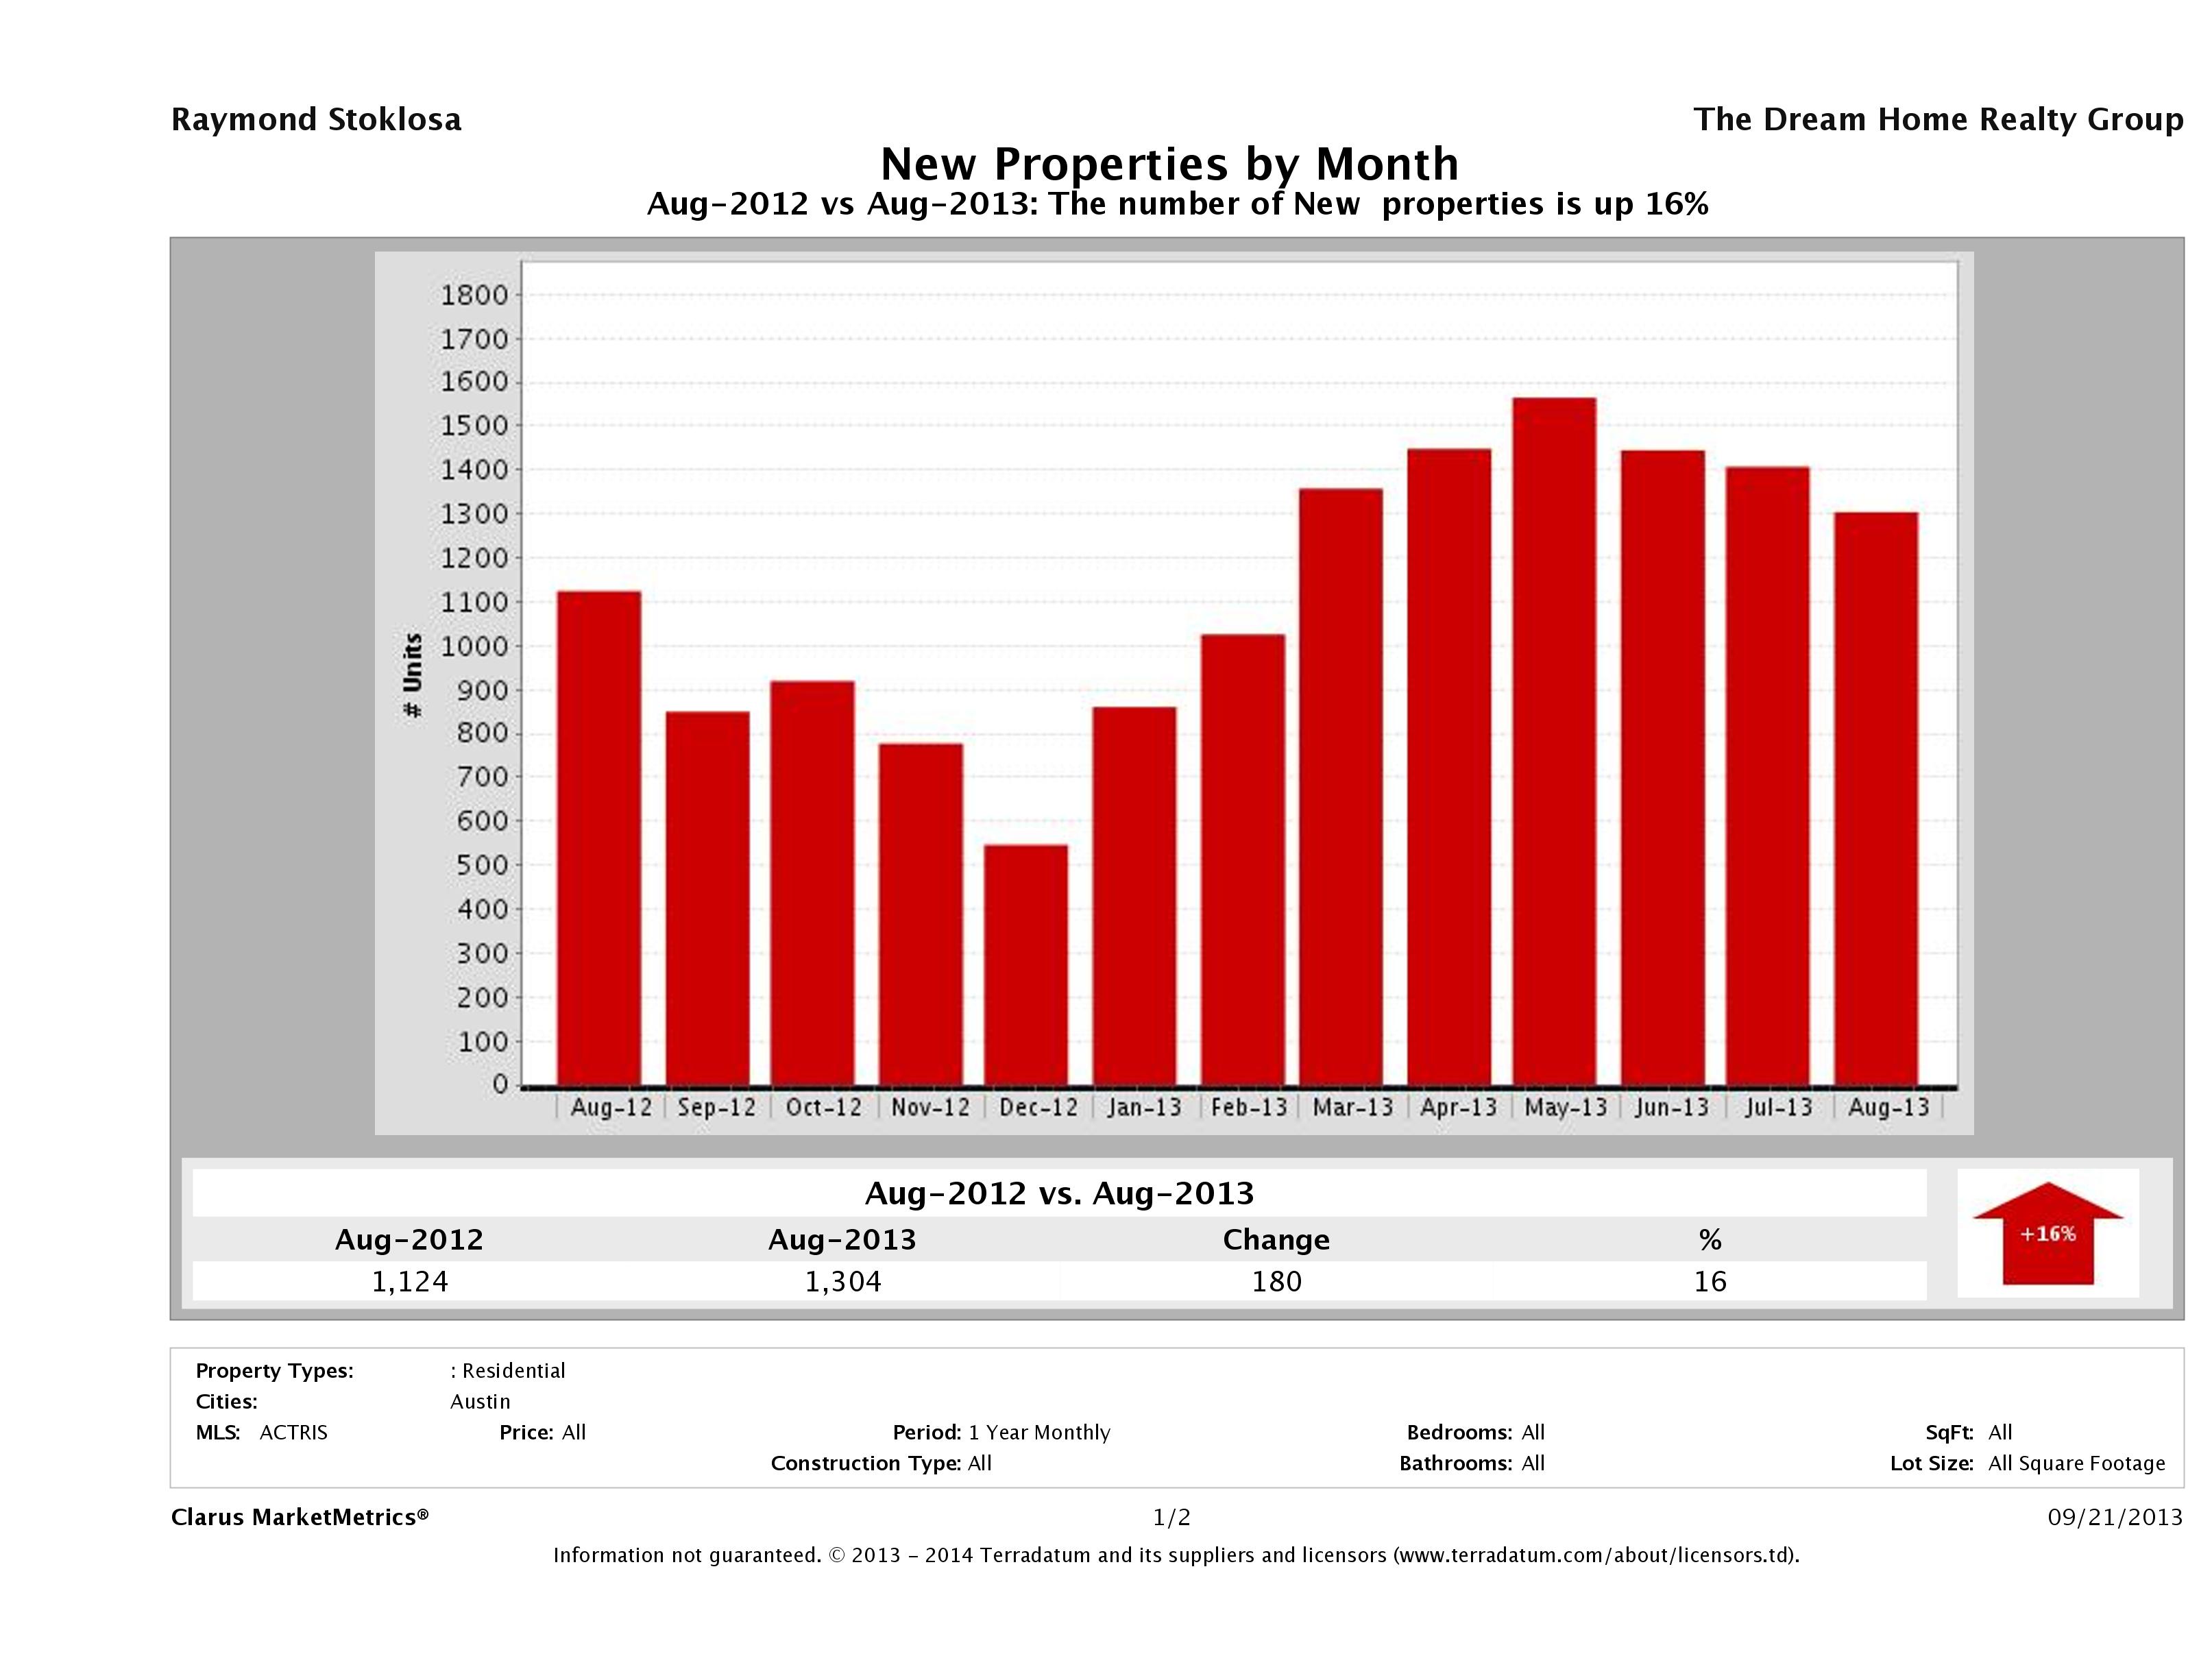
Number of Homes Listed for Sale Up 16%
In August 2013, we saw 1,304 homes introduced to the market compared to 1,124 in August 2012. It seems sellers who might not have sold in other years are taking advantage of the increased buyer demand to move to another neighborhood. With increased number of sales and pending contracts, it seems sellers are staying local and buyers who were once renters are also entering the market.
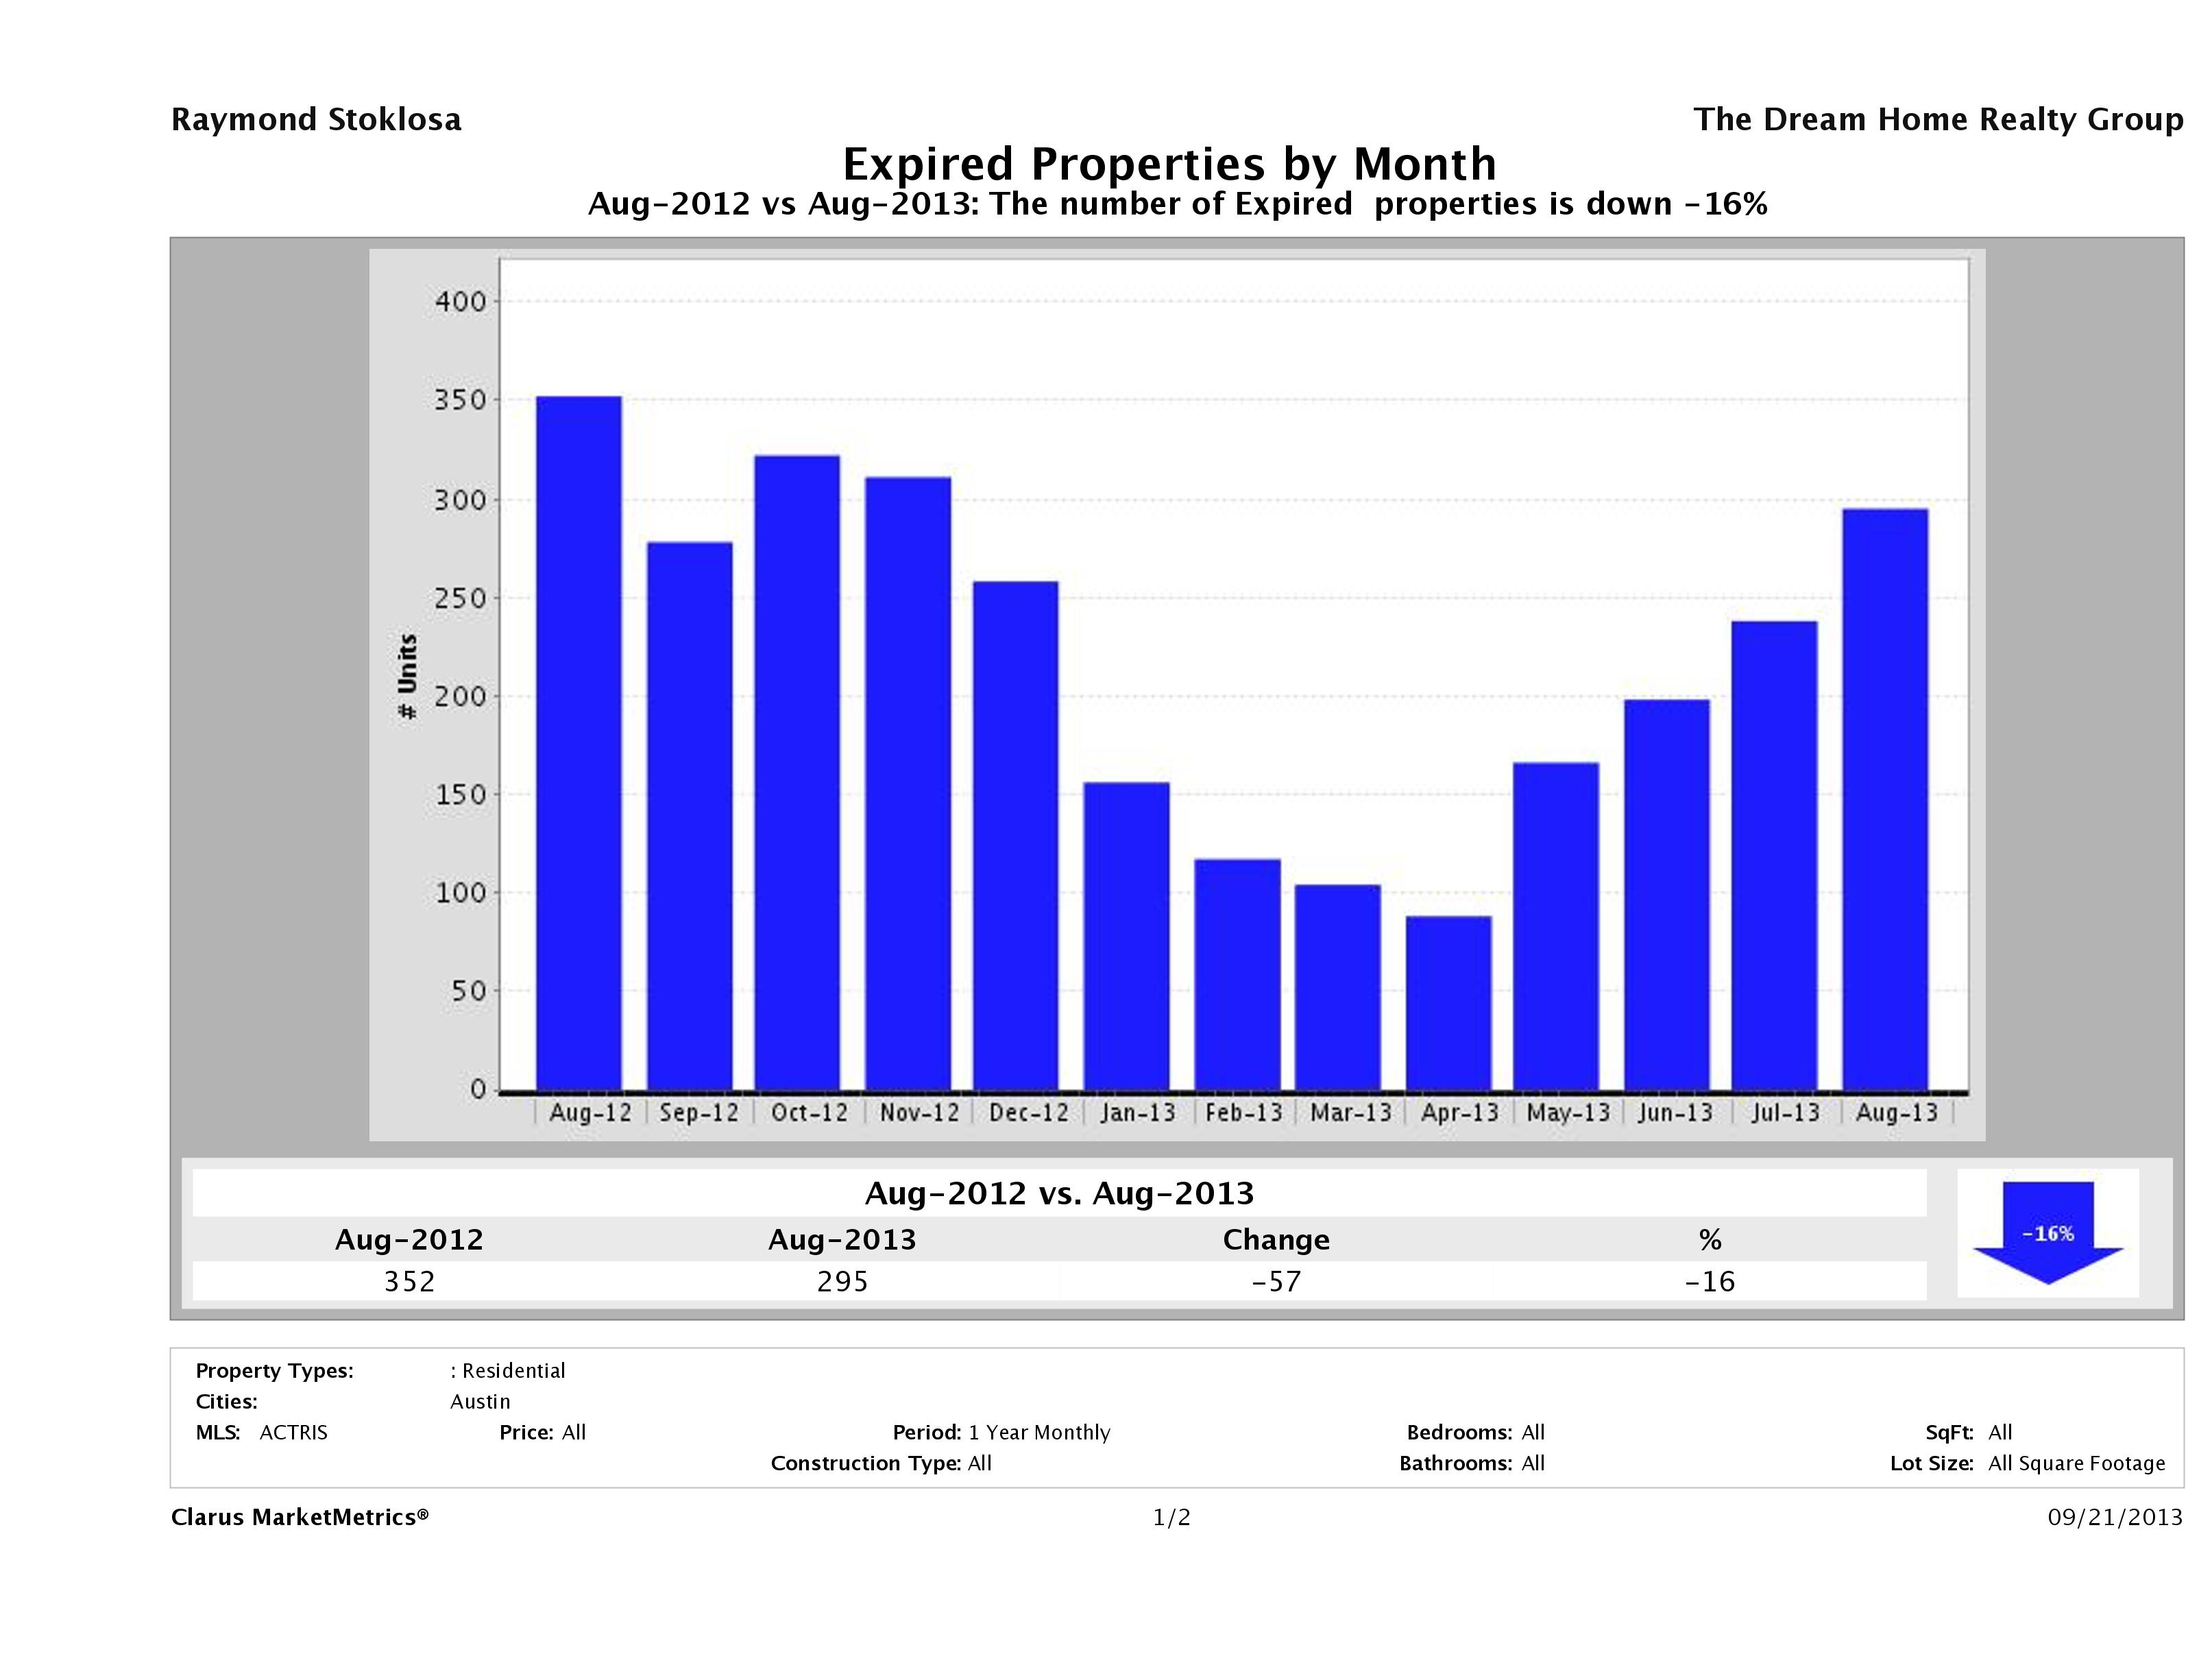
Number of Homes Taken Off the Market Down 16%
In August 2013, we saw 295 homes taken off the market compared to 352 homes in August 2012, marking a 16% decrease in year over year numbers. It seems more sellers were unable to sell last Summer compared to this Summer, another indicator of the increased strength in the market.
Did your home expire? Check out our Austin Home Not Selling resources page to find out why.
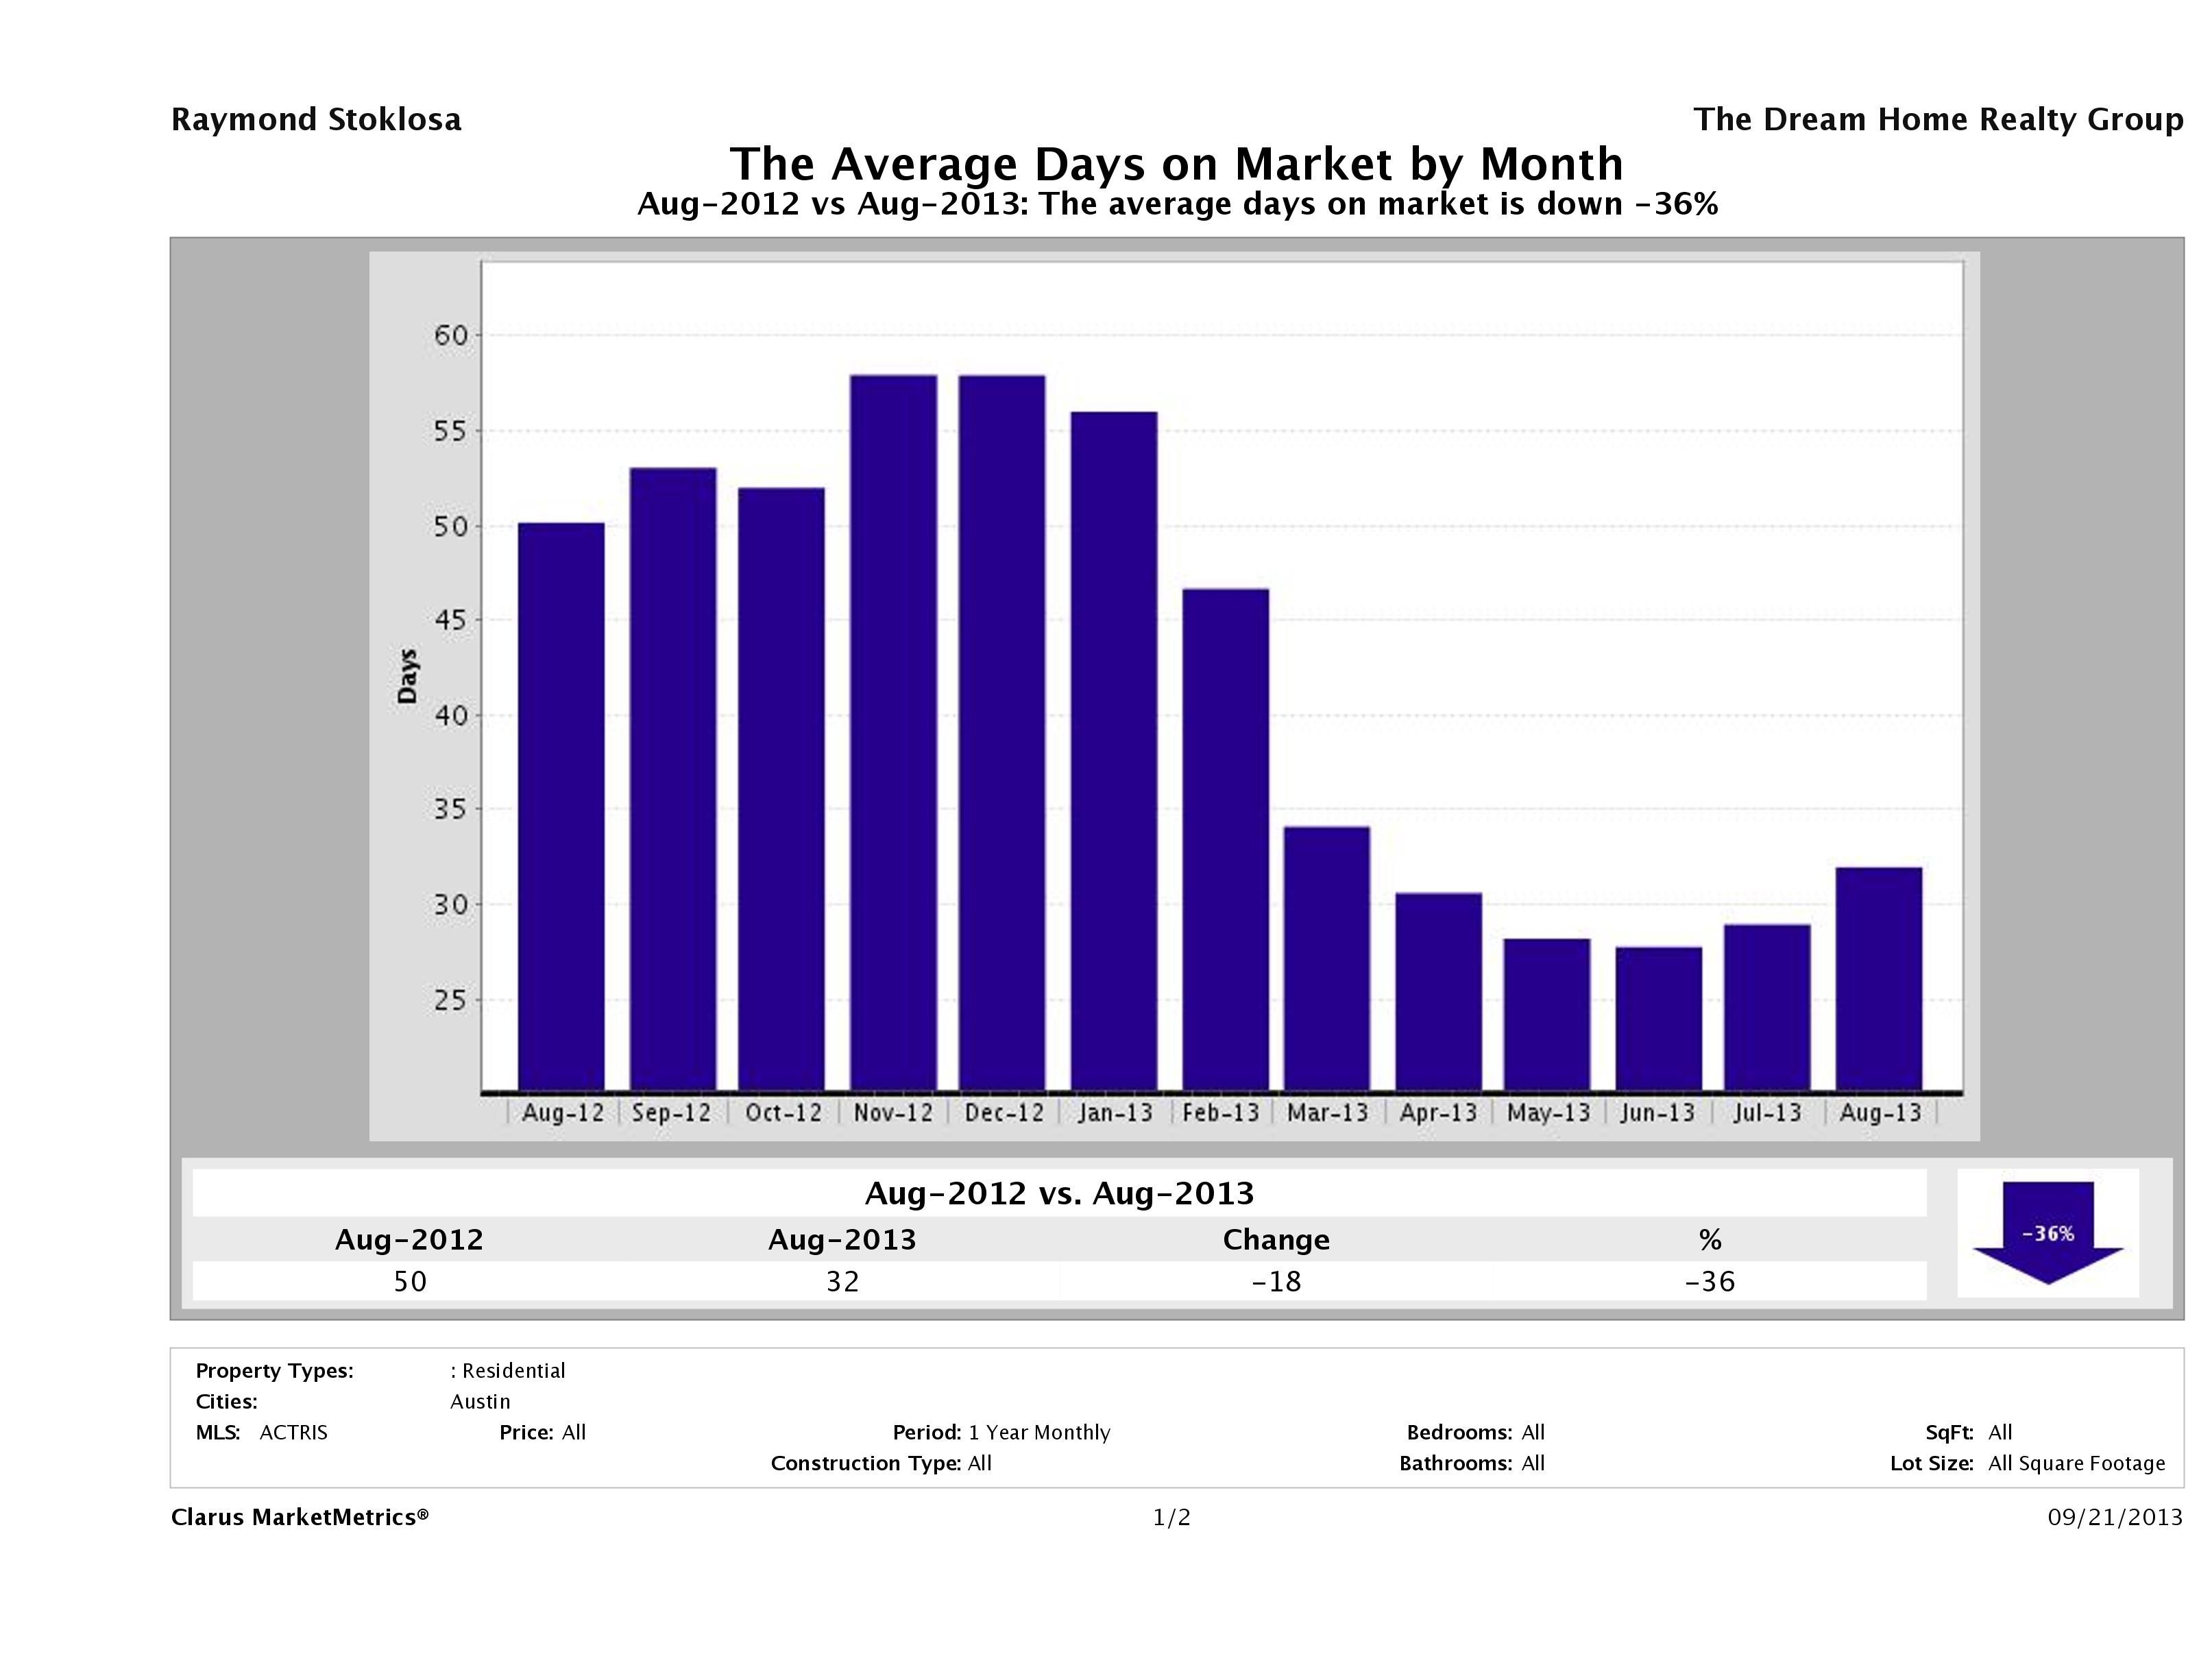
Time to Sell Home in Austin Down 36%
In August 2012, it took, on average, 50 days to sell a home in Austin while in August 2013, it took around 32 days. A normal market is considered 90 days, so 32 days is incredibly fast, especially considering these are city wide figures. In the more desirable neighborhoods, we’re seeing this number go way down – some averaging just a few days.
Supply is Down 14% and Demand is Up 14%
This month we’ve seen a 14% decrease in supply (number of properties for sale) and a 14% increase in demand (number of sold properties). Demand still outpaces inventory, so if you’re looking to sell, strike will the tables are still tipped in your favor.
Median for Sale Up 13% vs Median Sold Price Up 3%
This chart compares the Median for Sale Price vs the Median Sold Price to show their relationship. In Austin, we saw an 13% increase in the median for sale price and only a 3% increase in the median sold price of a single family home in year over year numbers. As we saw working in the market in August 2013, it seems buyers are negotiating offers compared to throwing as much money as possible at sellers like we saw earlier in the year.
Source: Clarus Market Metrics, ACTRIS Sold Data
August 2013 Real Estate Price Report – Strictly Numbers
For those of you who prefer to see the actual hard numbers, we’ve included the figures for August 2013 Austin home sales below. The most expensive home that sold in August 2013 was $3,650,000 and the least expensive home sold for $57,000. Homes range in size from 629 sqft-10,010 sqft with an average size of 2,290 sqft. The average price per square foot was $158.11 with the lowest being $49.37/sqft and the highest being $669.25/sqft. It took, on average, 28 days to sell a home in Austin and sellers received, on average, 98.93% of their list prices.
| Beds | Baths | SqFt | Listing Price | LP/SqFt | Selling Price | SP/SqFt | SP/LP | SP/OLP | DOM | |
|---|---|---|---|---|---|---|---|---|---|---|
| Min | 1 | 1 | 629 | 57000 | 41.7 | 52000 | 49.37 | 0.75 | 0.6044 | 0 |
| Max | 6 | 8 | 10,010 | 3995000 | 774.98 | 3650000 | 669.25 | 1.3471 | 1109.0909 | 558 |
| Average | 3 | 3 | 2,290 | 379004 | 160.39 | 370933 | 158.11 | 0.9893 | 4.3473 | 28 |
| Median | 3 | 2 | 2,040 | $299,900 | $142.38 | $300,500 | $140.94 | 100% | 0% | 8 |
| Search Criteria | |||
|---|---|---|---|
| Status | Sold | Sold Date | August 2013 |
| Property Type | Single Family Homes | Number Sold | 1213 |
| Source: | ABoR Sales Data | Area | Austin |
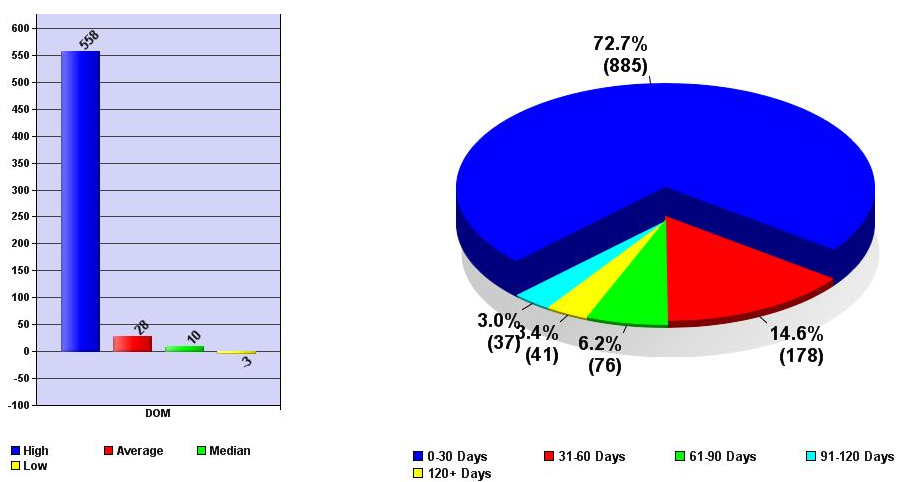
August 2013 Days on Market Report
The overwhelming majority (72.66%) of the 1,218 homes that sold in Austin in August 2013 (885) sold in less than 30 days and received, on average, 99.77% of their list prices. As homes stayed on the market longer, sellers received less than their list prices with homes that have been for sale for 120 days or more receiving, on average, 95.22% of their list prices. The lesson here? Homes that are priced right from the beginning sell quickly and for list price, or even a little bit more.
| 0-30 Days | 31-60 Days | 61-90 Days | 91-120 Days | 120+ Days | |
|---|---|---|---|---|---|
| No. of Listings | 885 | 178 | 76 | 37 | 41 |
| Breakdown % | 0.7266 | 0.1461 | 0.0624 | 0.0304 | 0.0337 |
| Avg % SP/LP | 0.9977 | 0.9698 | 0.9685 | 0.9639 | 0.9522 |
August 2013 Price Analysis Report
The majority of the homes that sold in Austin in August 2013 were priced below $500,000, which is to be expected. You’ll also see that the lower priced homes sold faster than the higher priced homes, which is due largely in part to the increased market for homes below $500k.
| Price Range | Quantity | Average DOM |
|---|---|---|
| $149,999 or under | 117 | 18 |
| $150,000 – $199,999 | 196 | 22 |
| $200,000 – $249,999 | 182 | 18 |
| $250,000 – $299,999 | 156 | 21 |
| $300,000 – $349,999 | 115 | 20 |
| $350,000 – $399,999 | 101 | 32 |
| $400,000 – $449,999 | 68 | 23 |
| $450,000 – $499,999 | 51 | 28 |
| $500,000 – $549,999 | 49 | 27 |
| $550,000 – $599,999 | 33 | 44 |
| $600,000 – $699,999 | 48 | 51 |
| $700,000 – $799,999 | 28 | 56 |
| $800,000 – $899,999 | 19 | 51 |
| $900,000 – $999,999 | 9 | 66 |
| $1,000,000 or over | 44 | 97 |
| Total | 1218 | 28 |
August 2013 Summary Price Report
Below you’ll find a breakdown of the sales prices of homes in Austin. The average price of a home that sold in August 2013 was $370,465 and the median price was $278,750.
| Summary | List Price | Sale Price |
|---|---|---|
| High | 3995000 | 3650000 |
| Low | 57000 | 52000 |
| Average | 378514 | 370465 |
| Median | 280000 | 278750 |
Time to Buy? Sell?
As we always say, the best time to buy or sell a home is when you need to buy or sell. If you have a house to sell, selling when its a buyers market may hurt you on the selling end, but you’ll make it up on the buying end. If you’re trying to get into the market for the first time, the only way you’ll know that we’ve “hit bottom” is when its in the rear view mirror. Work with professionals who can help you analyze your financial and lifestyle to determine if now is the right time to buy or sell.
Looking strictly at the numbers, it appears the recommendation for this month is (again)…it’s time to sell. With inventory at record lows, a home that’s priced right will have no problem finding a buyer. Buyers again came out in record numbers yet again in August 2013 with a 10% increase in the number of contracts received by sellers in year over year numbers. We didn’t see the usual slow down as we entered August as we’ve seen in prior years. There is still an obvious slow down from the frenzied Spring and Summer months and buyers seem to be negotiating harder. But, sellers are still receiving high offers, with over 99% of list prices received city wide in August. Historically, homes that sell in Winter get less money than homes that sell during the rest of the year, so get your home on the market now and get it sold before we head into the Holidays. If you’re looking to sell, we can help you get top dollar for your home in the shortest time. For more info about the best home selling program in Austin, visit Sell My Austin Home.
If you’re a buyer, that doesn’t mean sit on the fence and wait. Interest rates have jumped up a bit, but are still at all time lows, which could mean the difference in hundreds of dollars to your payment if you wait until the market slows down in Winter. If the market is anything like it was last year, it won’t slow down in Winter, making it a double whammy with potentially increased interest rates and sales prices. If you’re looking to get into the market, the best time to find a great deal is any time you can. For more info about our Home Buyer Representation Program, check out Austin Buyer Brokers.
Questions About the Austin Real Estate Price Report?
Do you have questions about this Austin Real Estate Price Report? Call us at (512) 827-8323 or email us at info@11OaksRealty.com and we’ll help you in any way we can. If you’re looking to buy or sell Austin real estate, don’t forget to check out our Buyer Resources and our Seller Resources for more tips.
Leave a Reply