
Eleven Oaks Realty is proud to present their September 2012 Austin Real Estate Price Report measuring activity in the Austin single family home market.
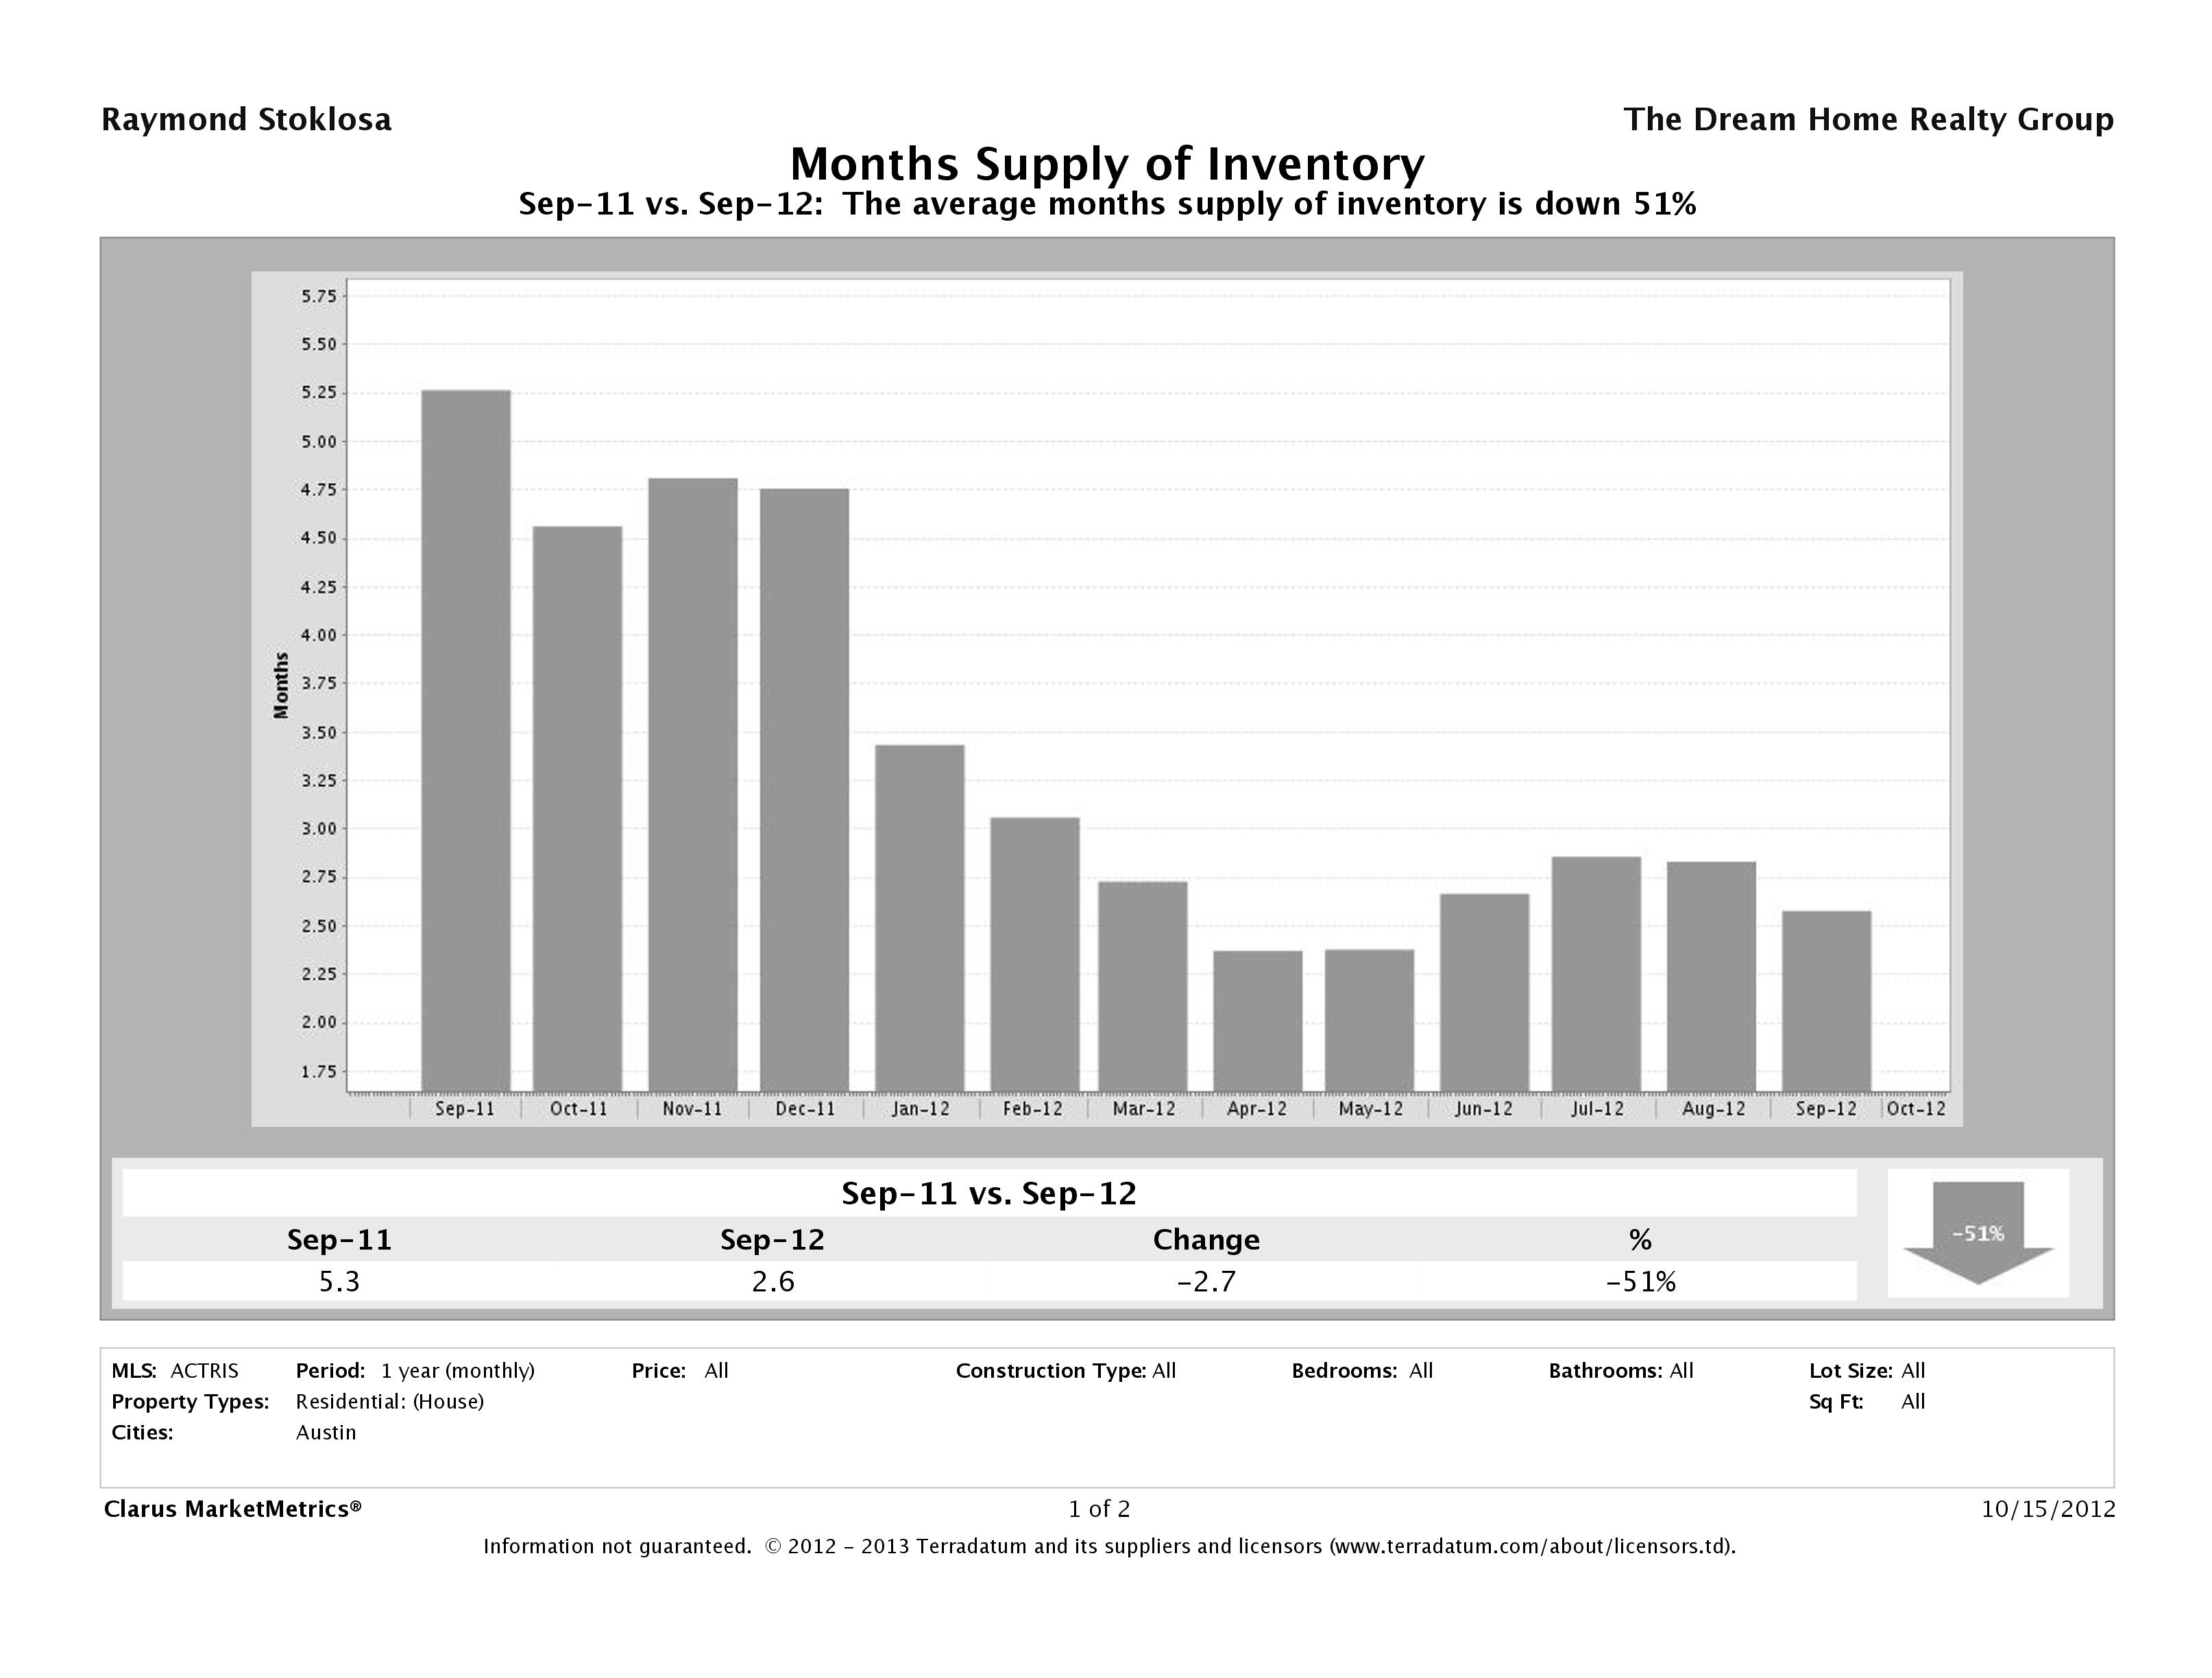
Austin Housing Inventory Down 51%
The biggest story in this month’s numbers is the same as its been for the past several months – we’re low in inventory. In September 2012, we saw a 51% decrease in months supply of inventory from already very low August 2012 numbers to 2.6 months of inventory. September 2012 numbers are just above historically low April 2012 and May 2012 numbers and also below June, July and August numbers indicating the busy season did a number on the availability of housing in the Austin area. As you’ll see in the numbers below, we don’t have much by way of new listings, so it appears as though this fight for the most desirable properties will continue a bit longer this year than in previous years.
What does this mean to buyers? If you’re in the middle of your home search, you’ll need to be proactive. Buyers are still getting good deals on homes, but they need to be ready to jump on an opportunity when they first see it. We still haven’t seen the Fall slow down, which means buyers are still out in full force. Make your house hunt a priority and you’ll increase your chances of finding the right house and getting it at the right price before anyone else snatches it up.
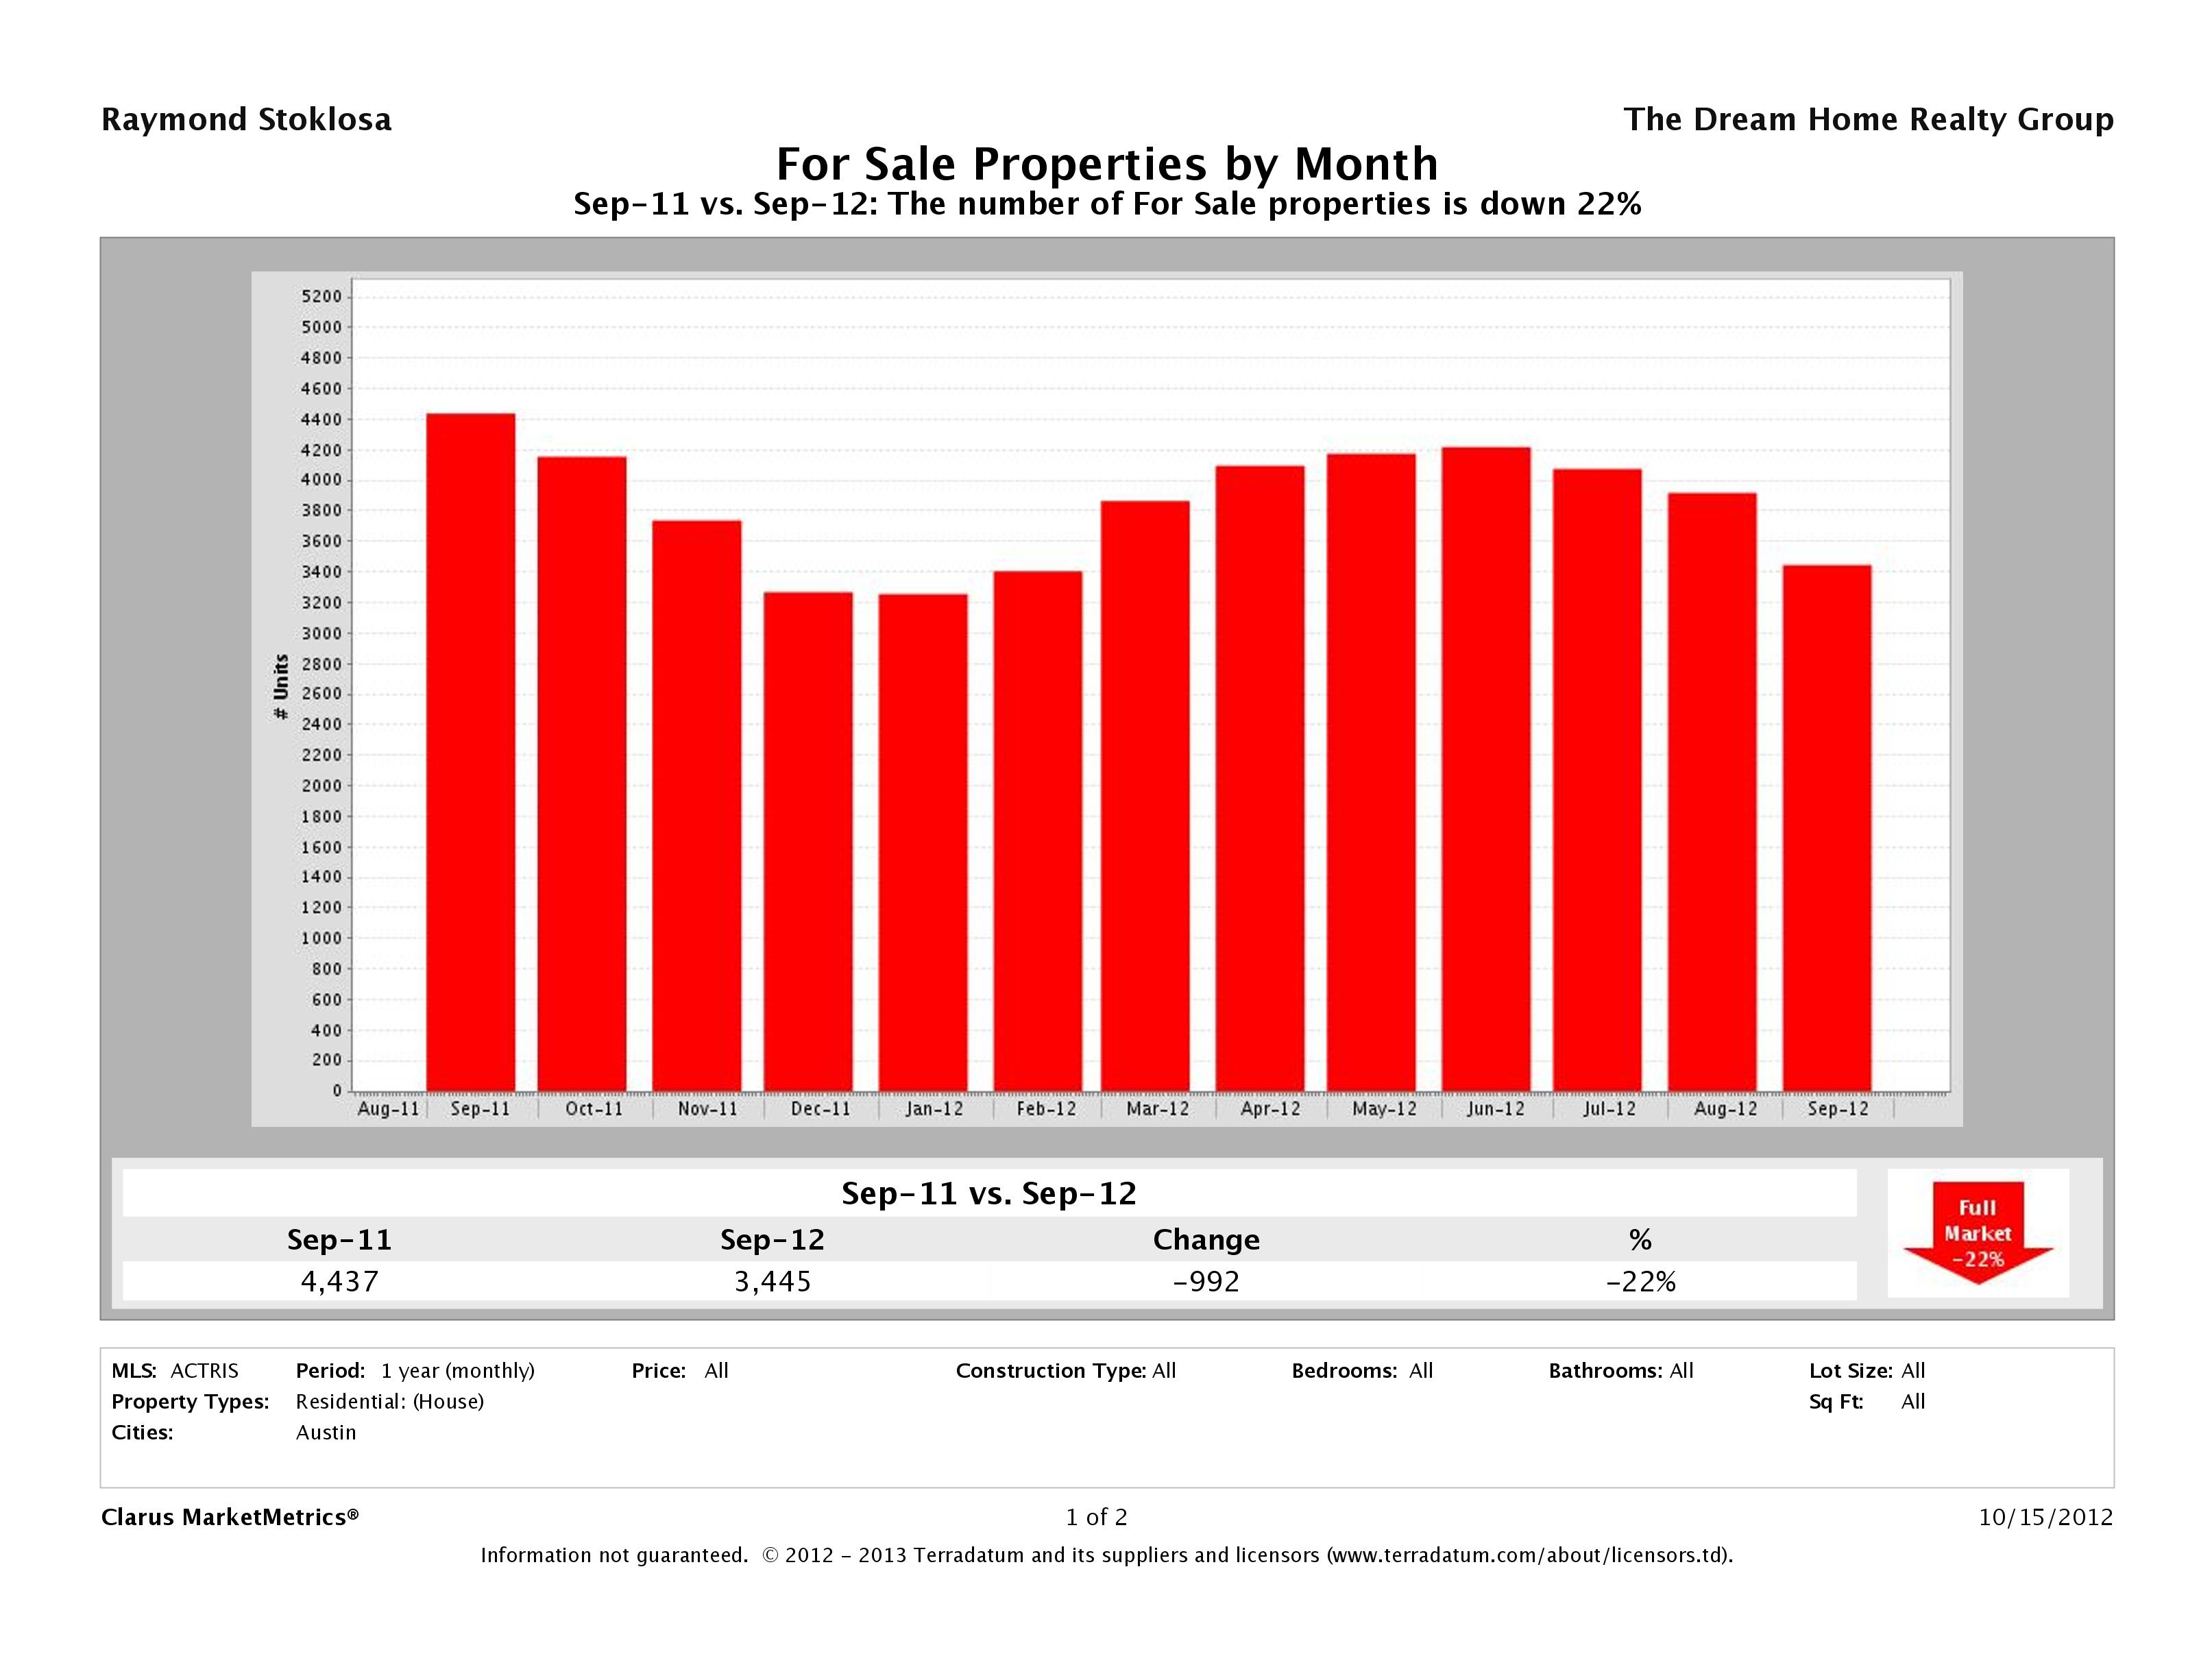
22% Fewer Homes on the Market than September 2011
In September 2012, we had 3,445 homes listed for sale in Austin, compared to 4,437 this time last year. The story is not much different from last month. Buyers continue to snatch up inventory quickly and with record numbers of people moving to Central Texas, there aren’t enough homes to meet the demand. If you’re thinking of selling, think about doing so sooner rather than later to take advantage.
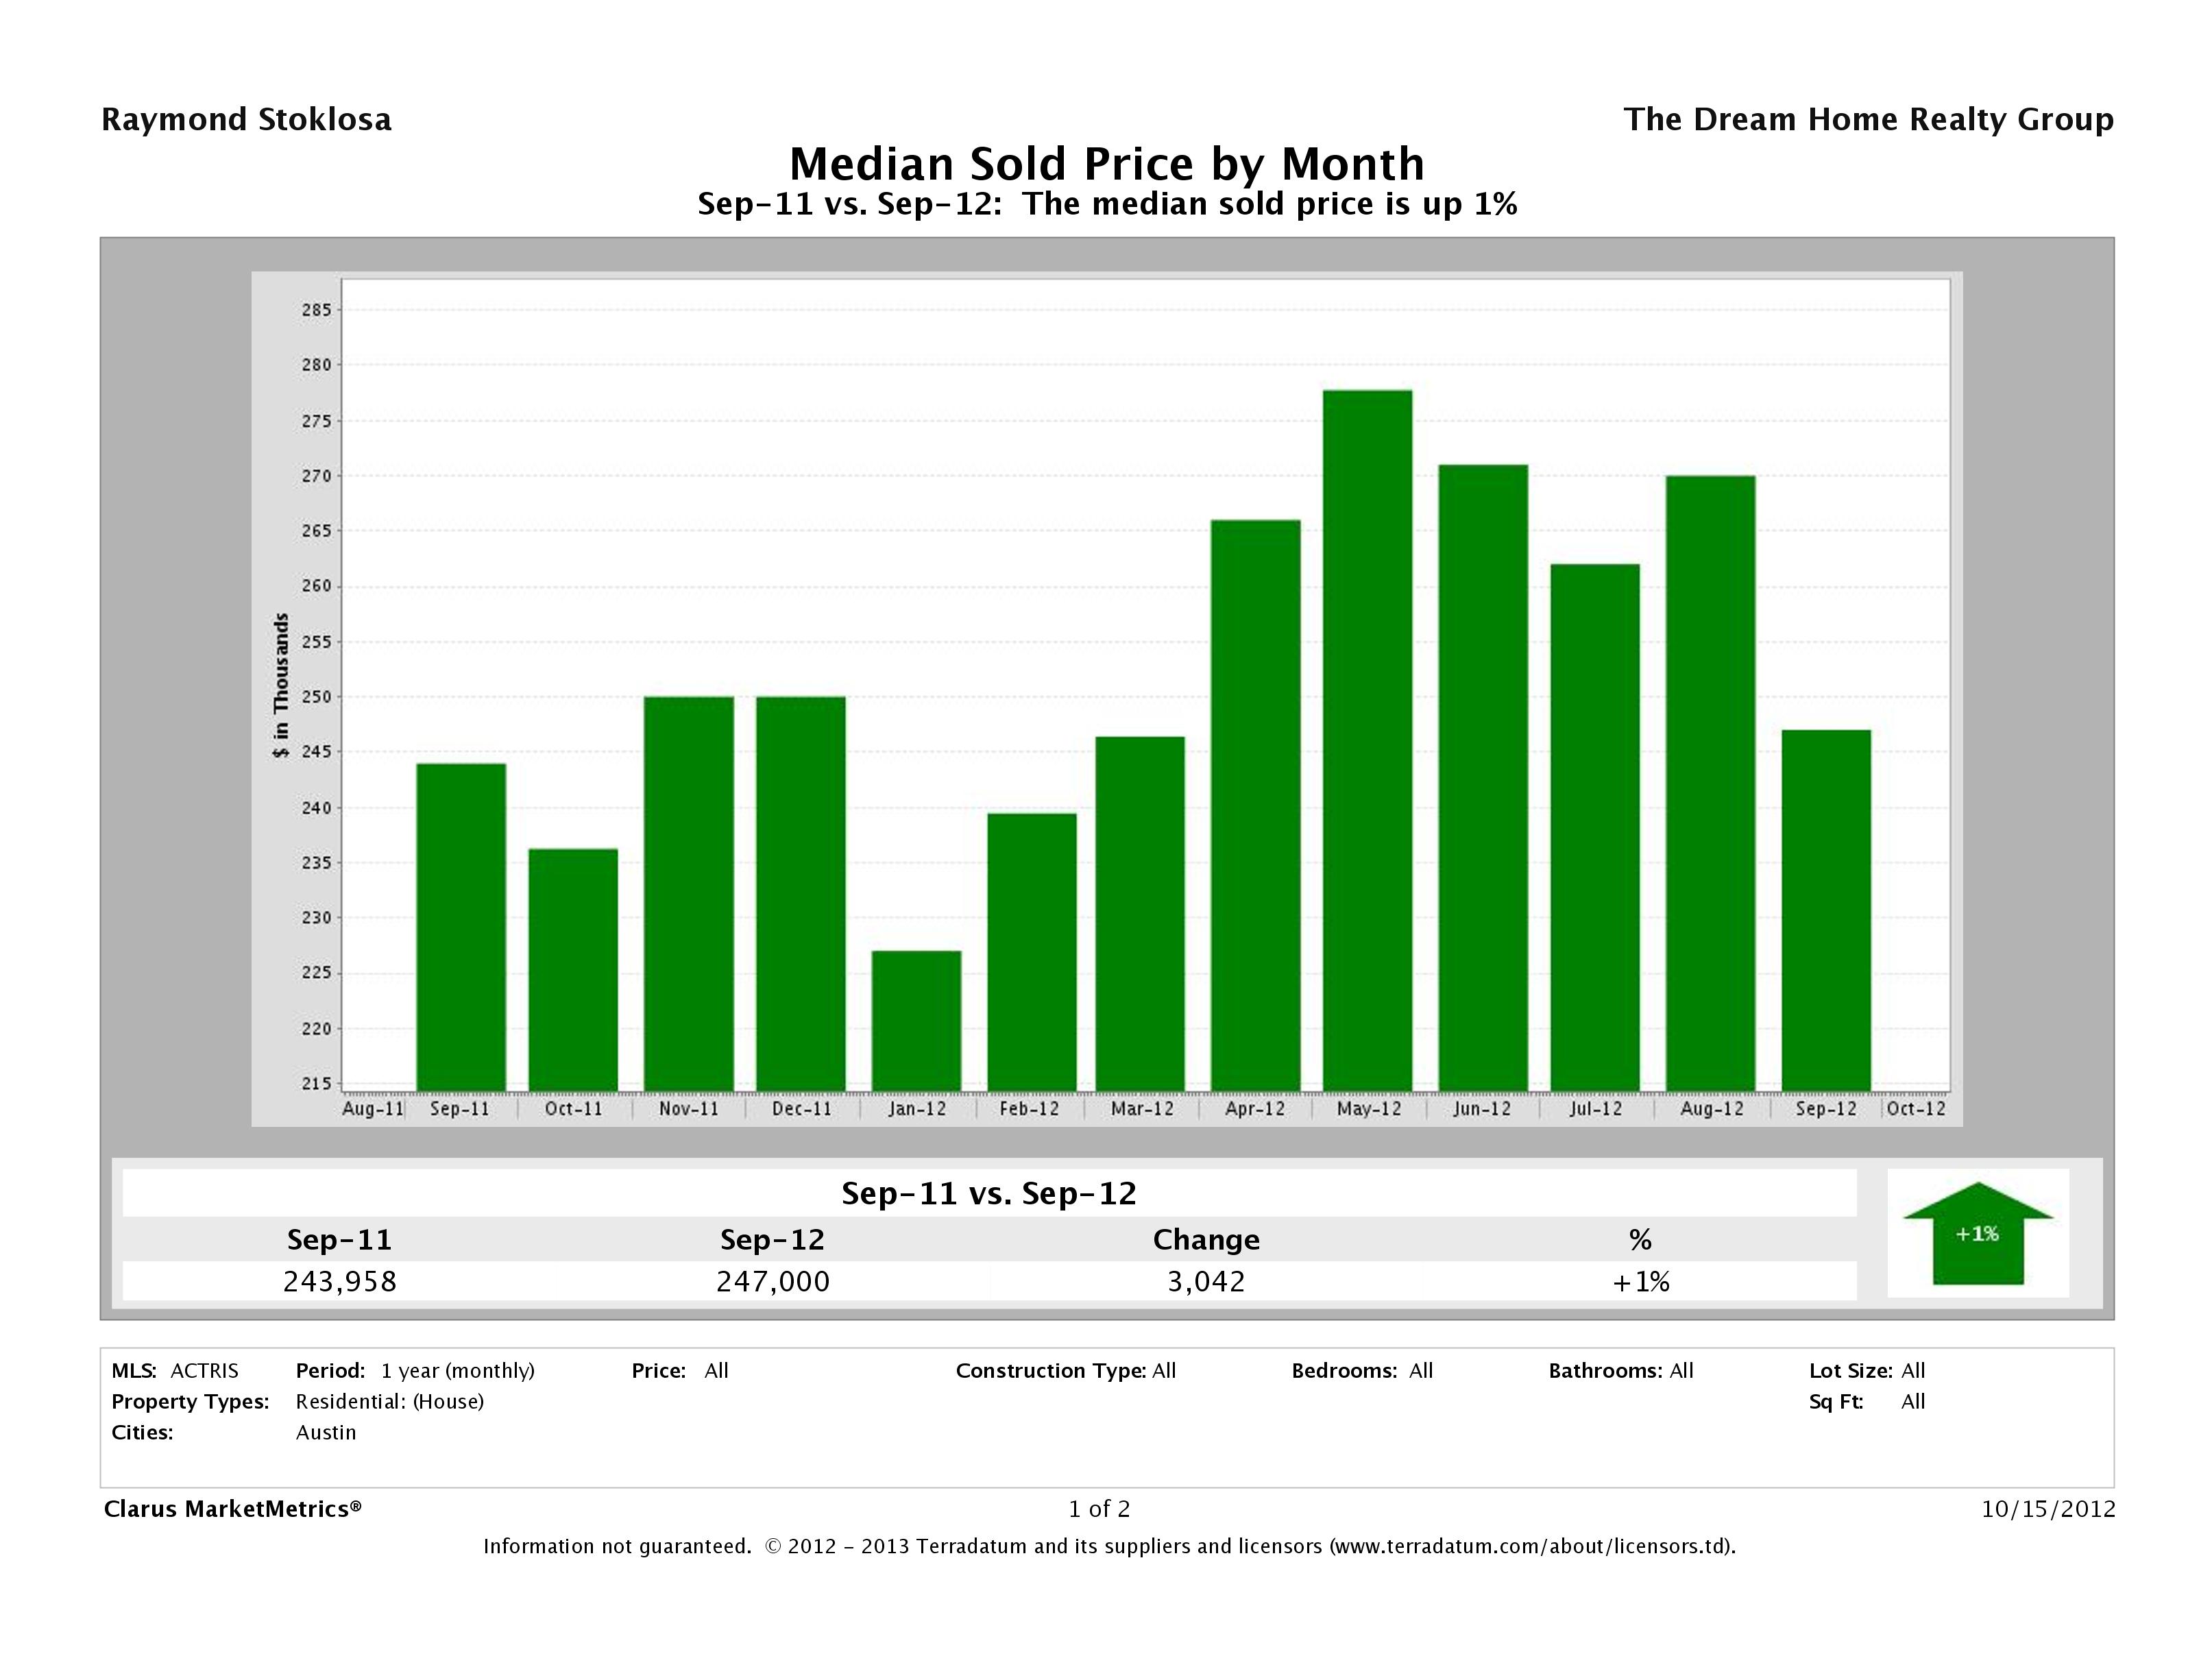
Austin Median Home Price Up 1%
This month, we saw a 1% increase in the median home price in Austin with an $3,042.50 increase in year over year numbers. The median home price in September 2011 was $243,957.5 vs $247,000 in September 2012. With only a 1% difference, we’d consider this to be even with last year’s figures. Though there is less inventory, it seems to be hovering around the same price point as last year. This doesn’t necessarily mean prices are down. It simply means what is selling is at nearly the same point as last year.
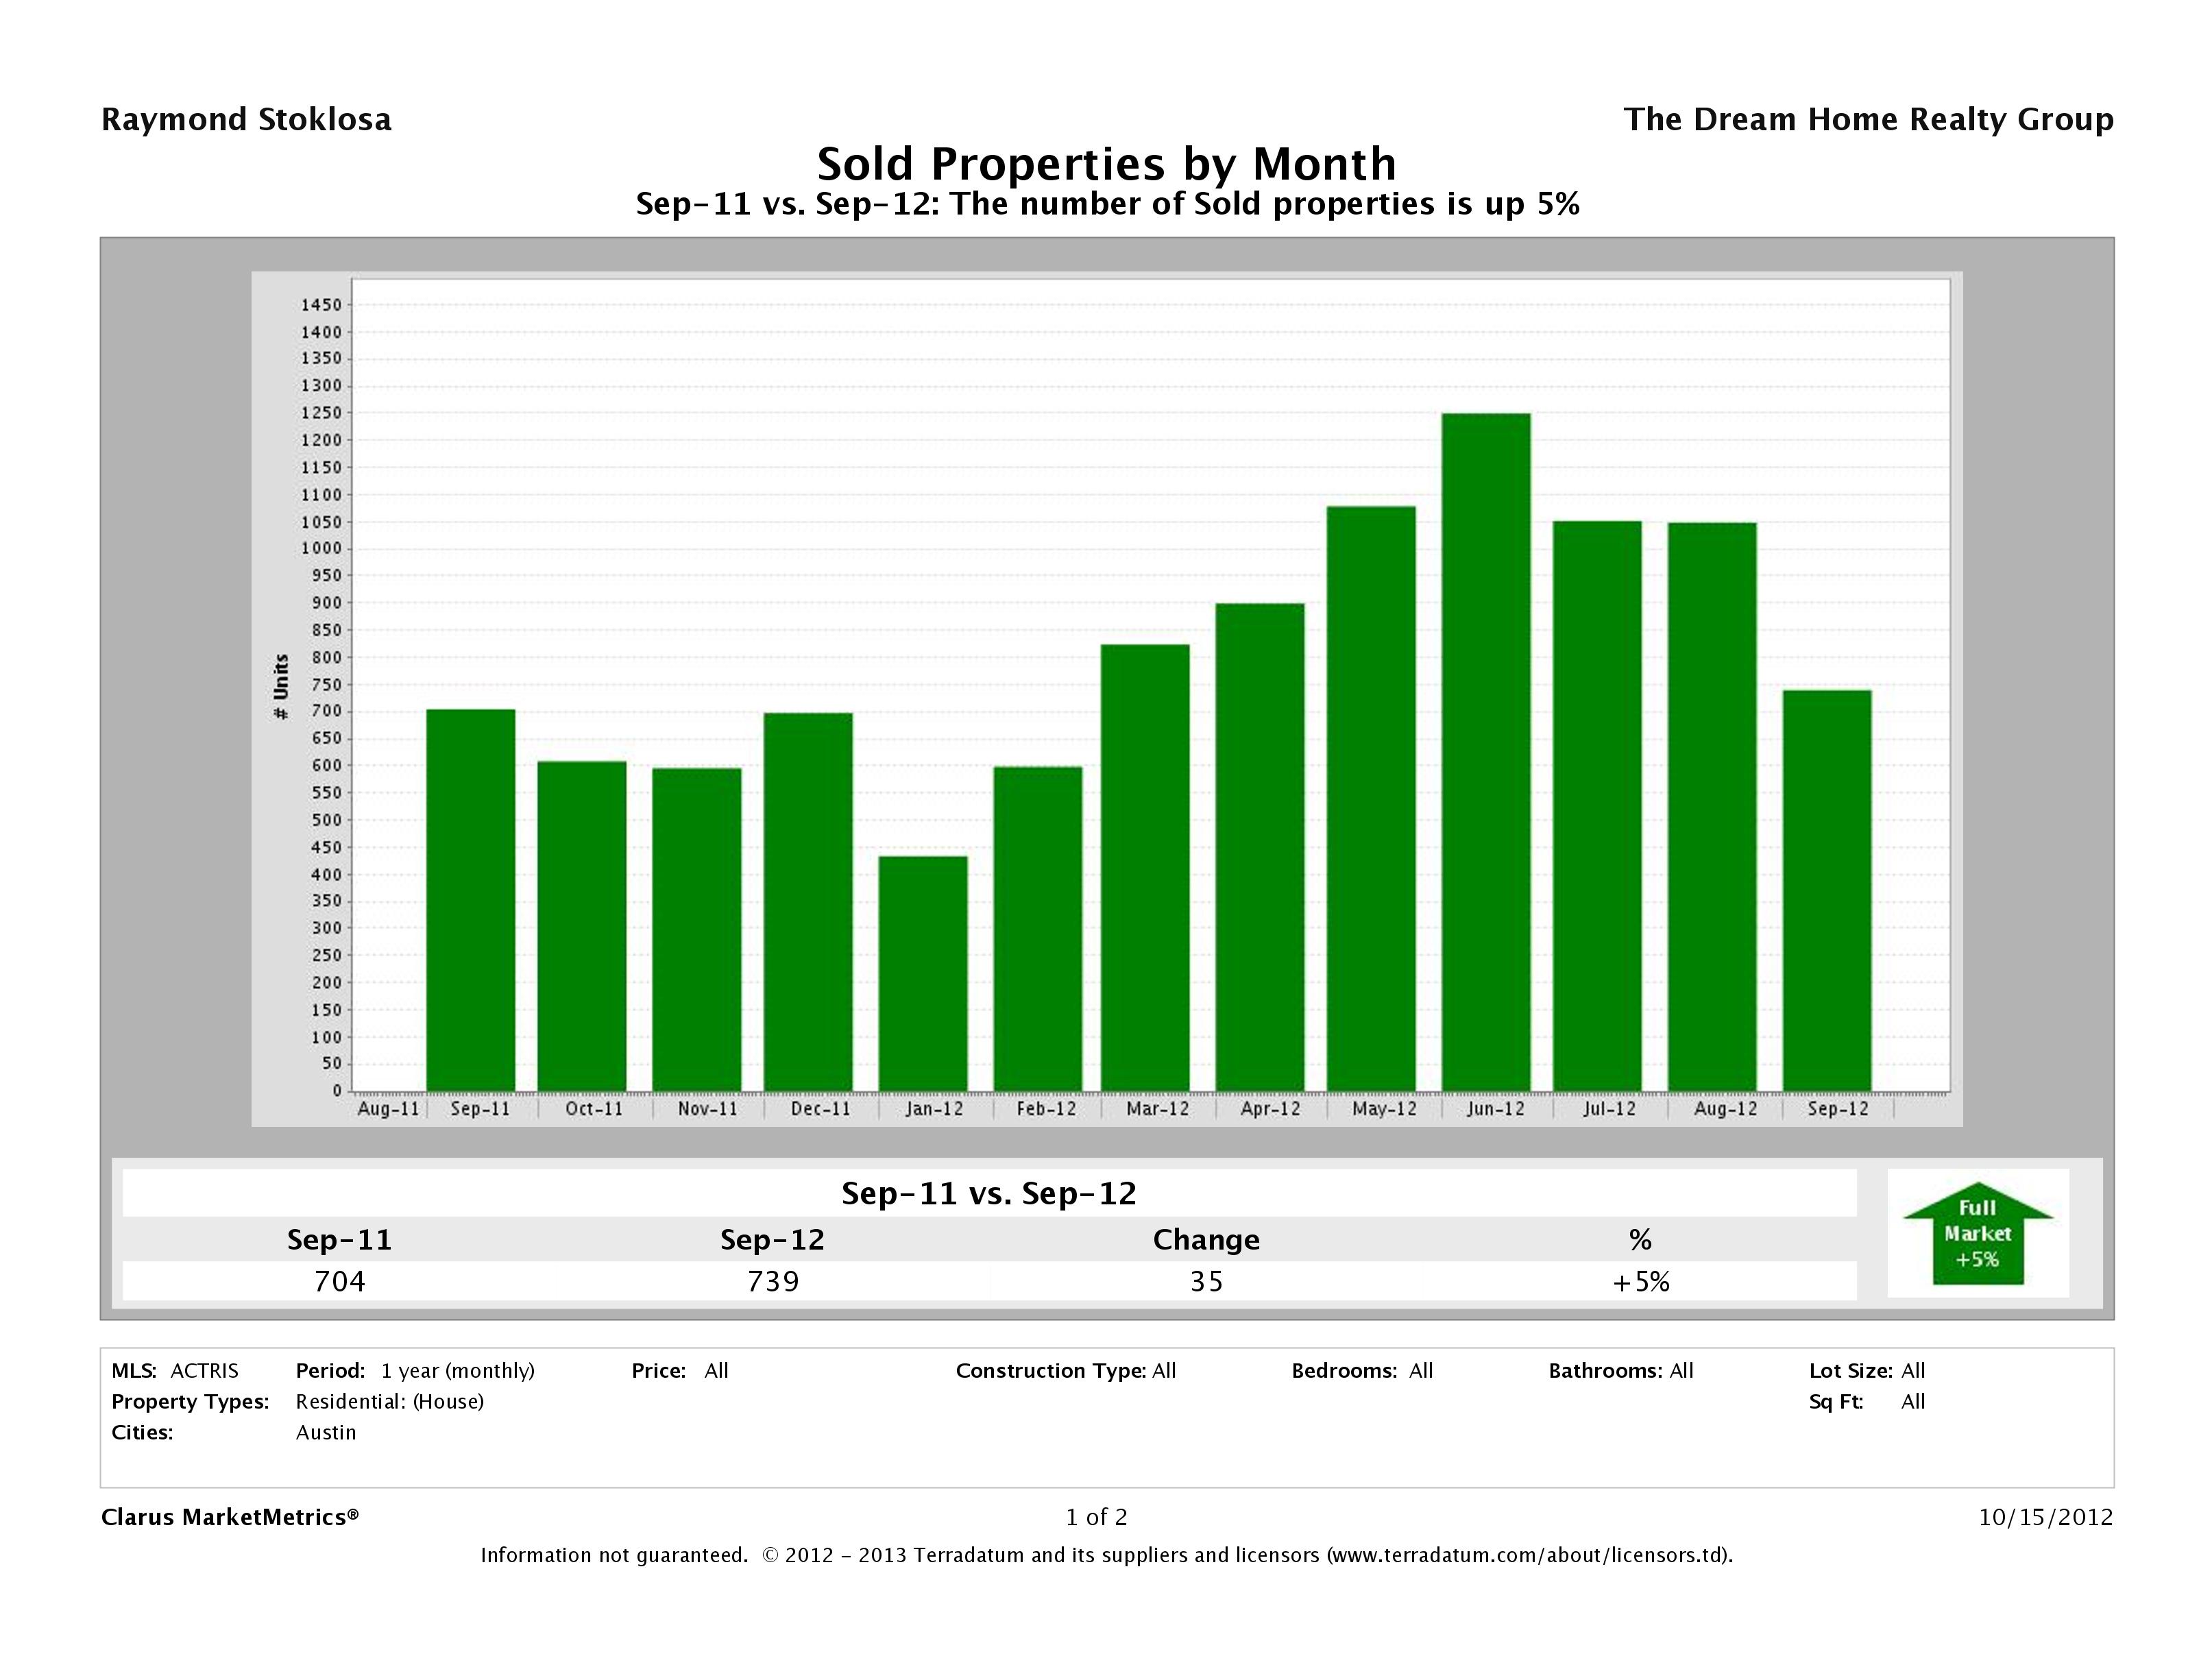
Number of Sold Homes in Austin Up 5%
In September 2012, we saw a 5% increase in the number of homes sold from September 2011 numbers. In September 2012, we saw 739 homes sell in Austin compared to 704 in September 2011. This drop from August numbers is quite normal as kids start to go back to school. We usually see this type of decrease in August, but this year it came one month later, another indication of the strength of this market.
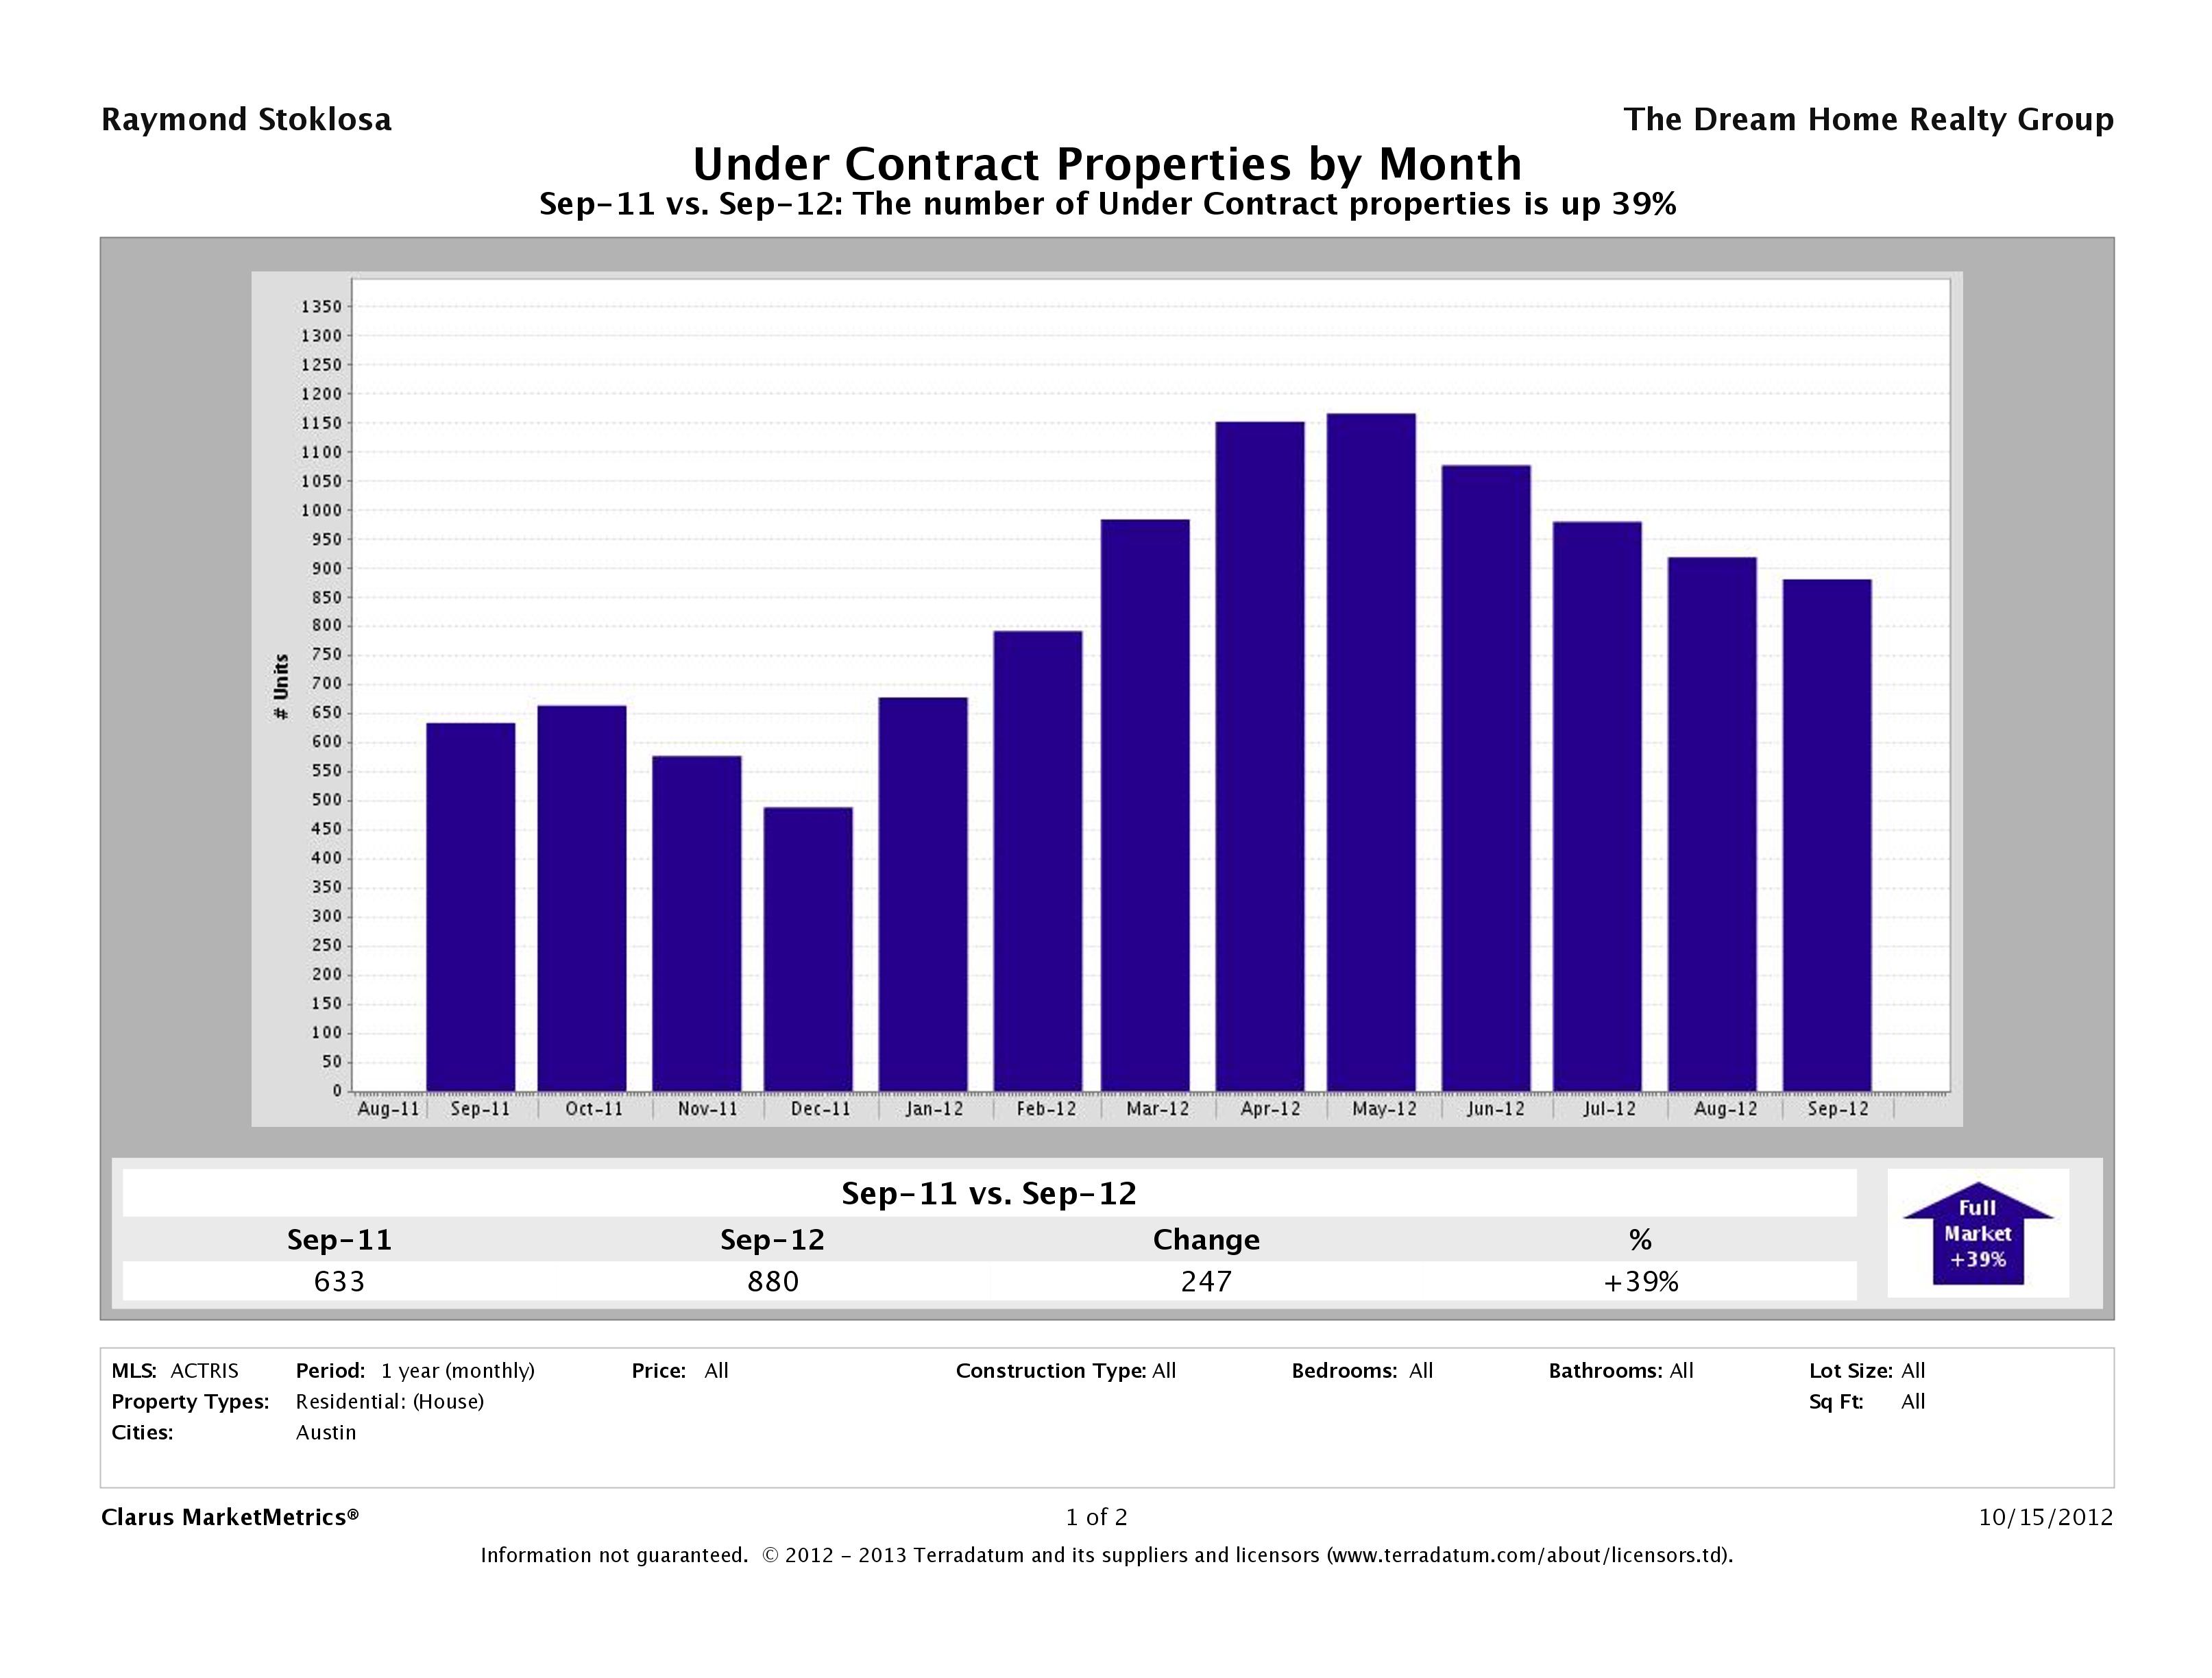
39% More Austin Homes Under Contract
In September 2012, there were 880 homes that went pending compared to just 633 in September 2011 marking a 39% increase. This sharp increase from last year’s figures is another indicator that this market remains strong, even through the usual, slower times.
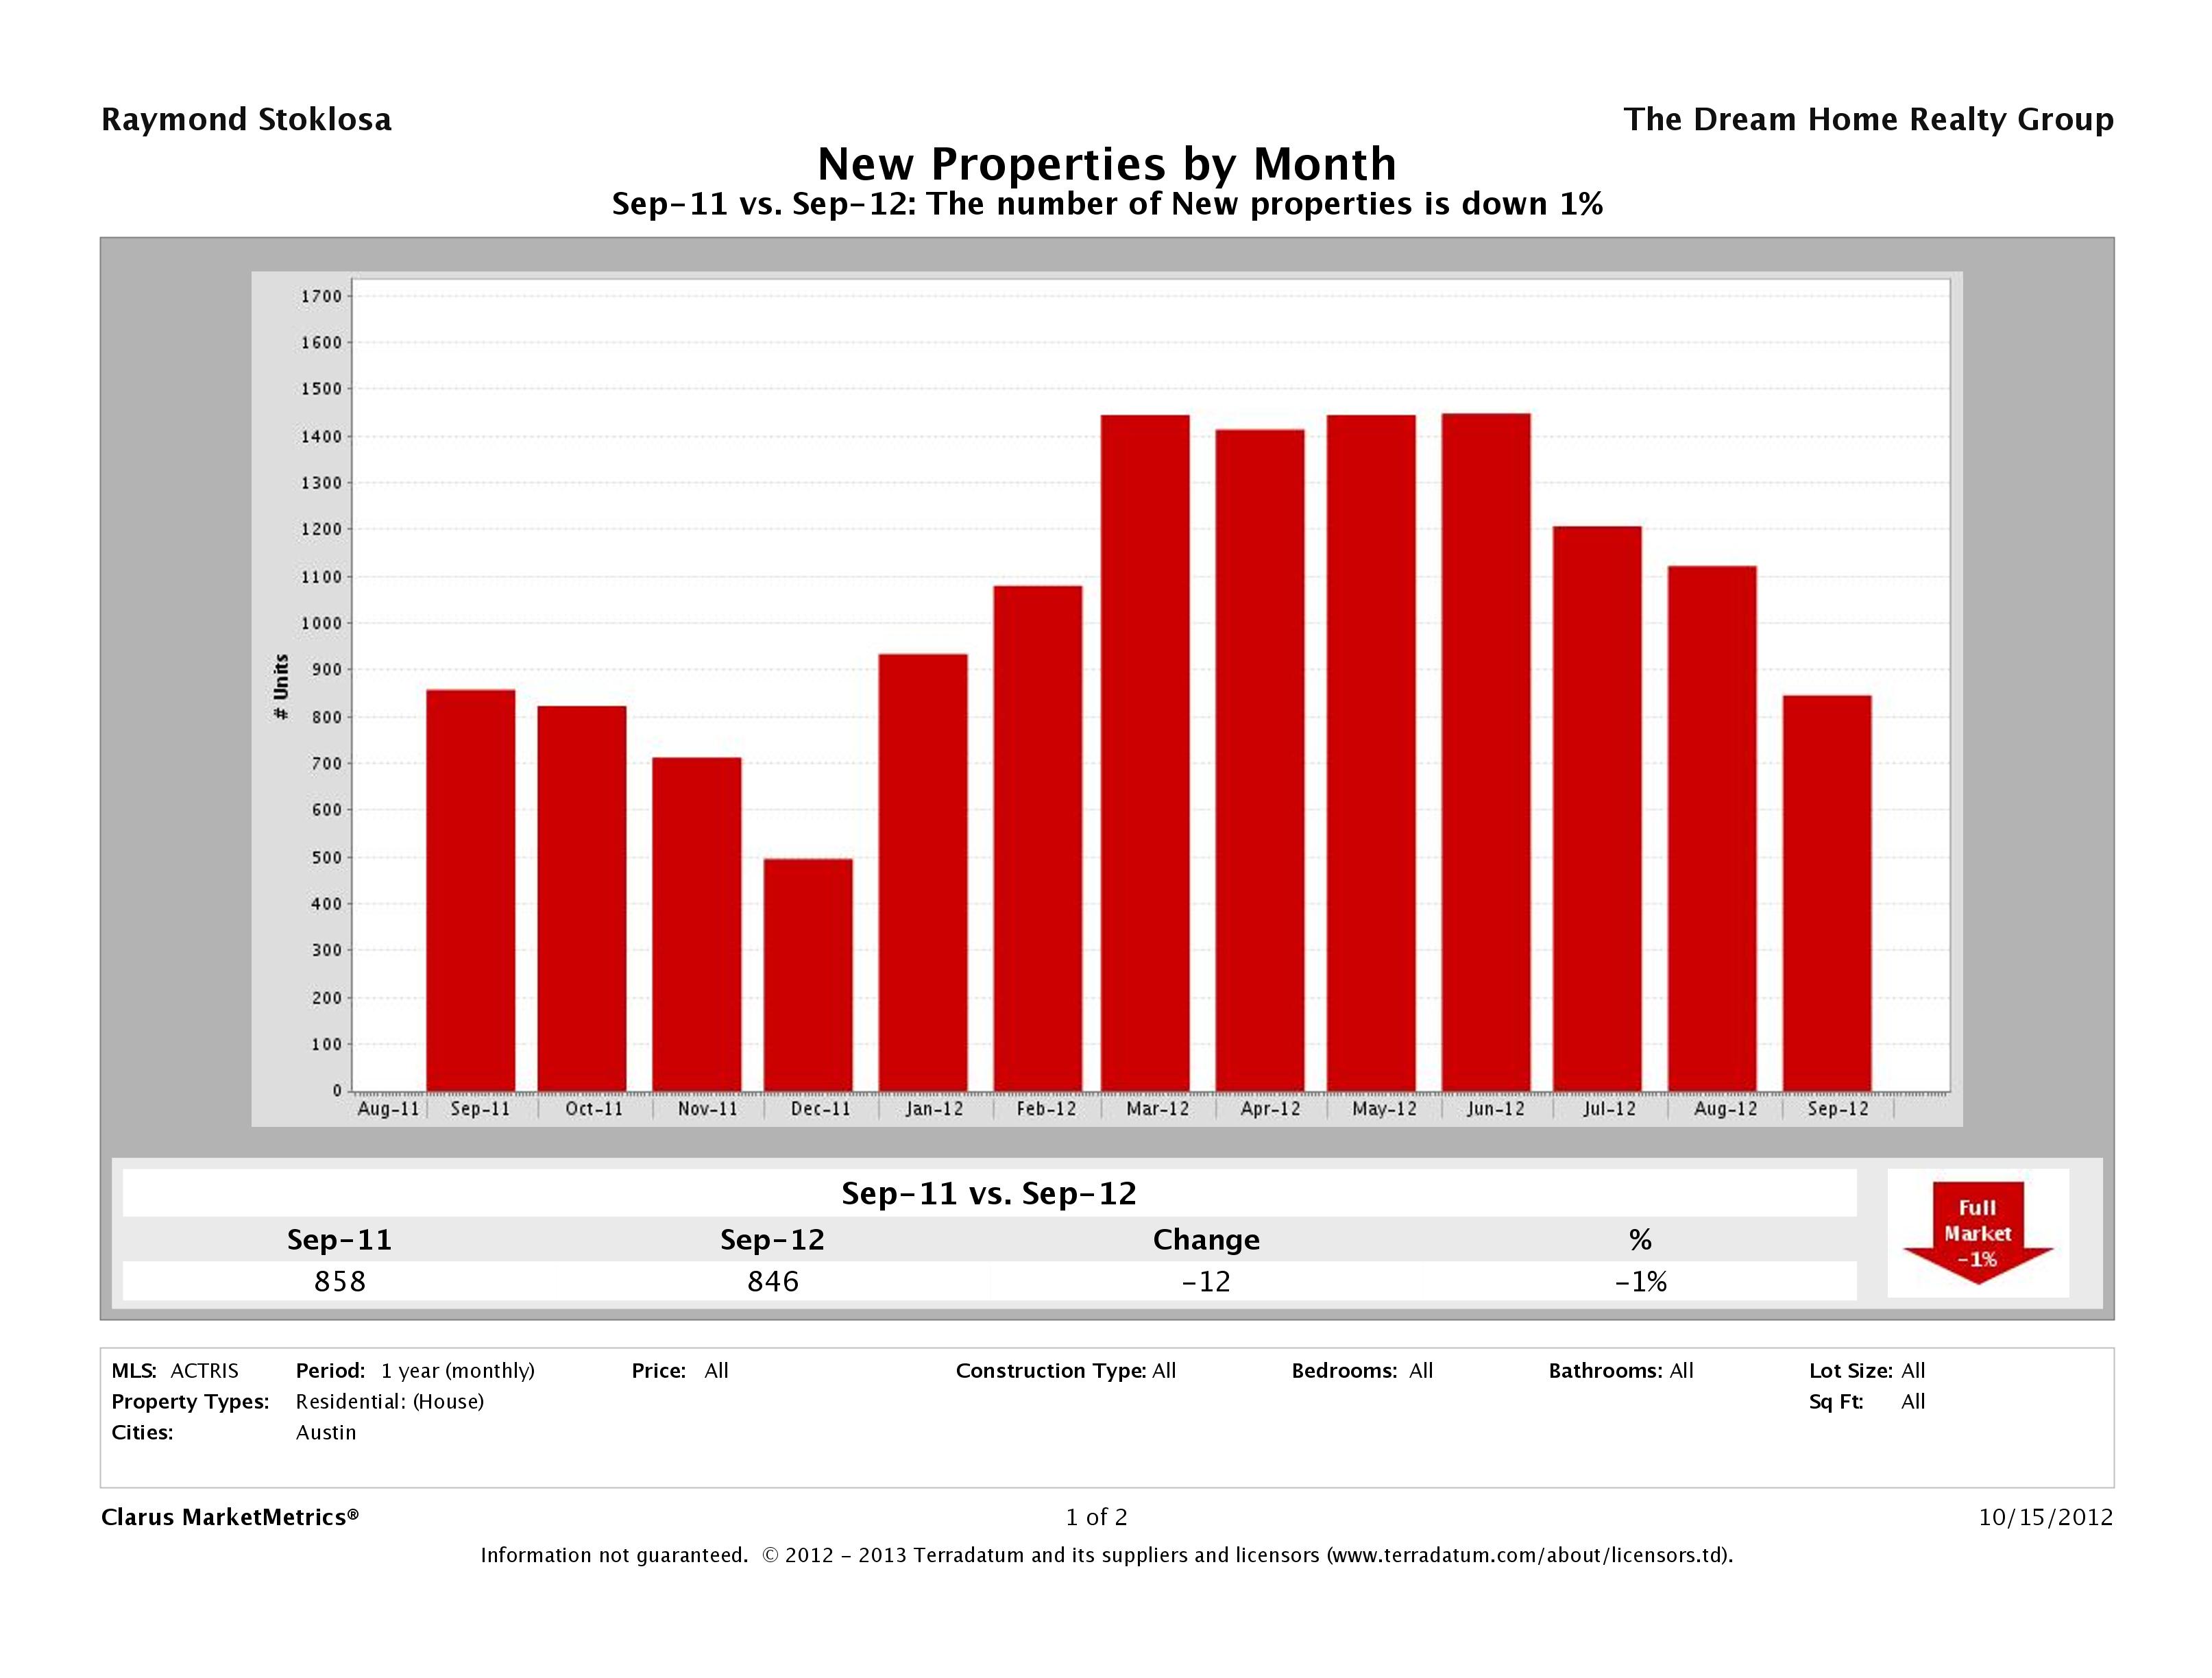
Number of Homes Listed for Sale Down 1%
In September 2012, we saw a 1% decrease in the number of homes being introduced to the market than in September 2011. In September 2012, there were 846 homes listed for sale in Austin compared to 858 in September 2011. In most cases I would say sellers seem hesitant to sell, but given the numbers of people relocating to the Austin metro area from other areas, I think this is more of an indication that once people establish roots here, they are staying longer.
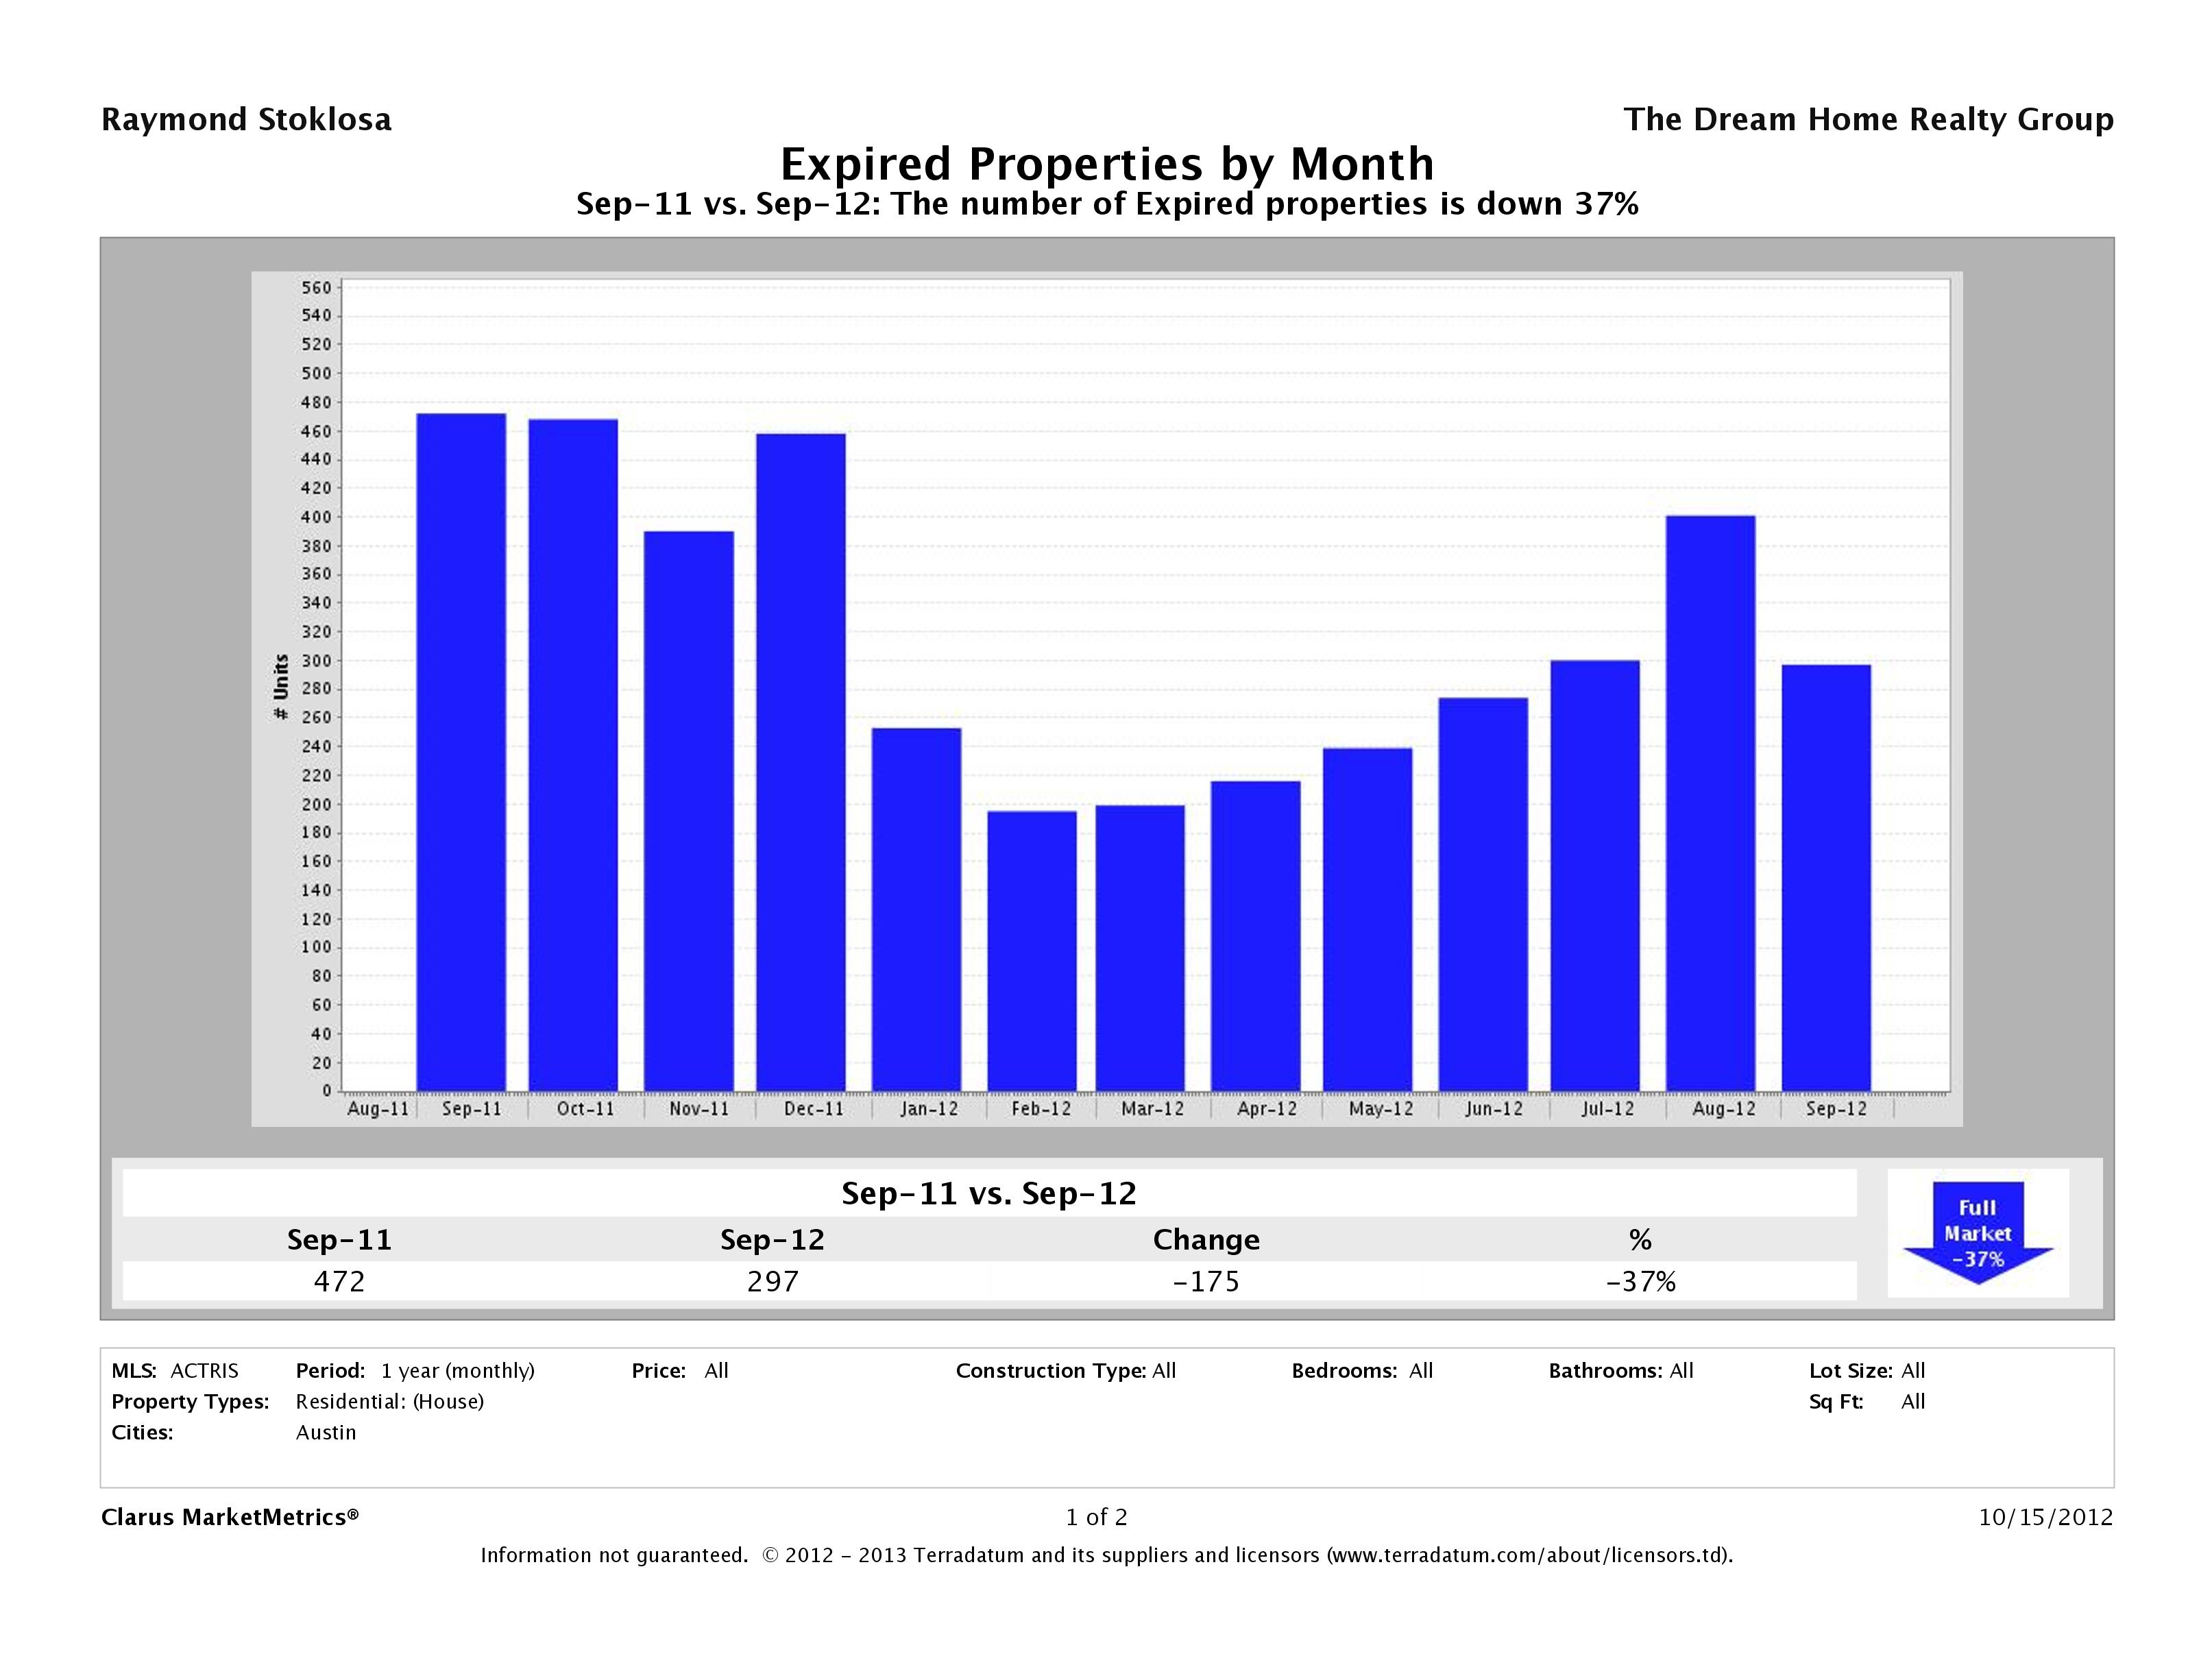
Number of Homes Taken Off the Market Down 37%
With such low inventory levels, homes that might not necessarily have been sold in a normal market are selling causing a remarkable 37% decrease in the number of homes that were taken off the market in year over year numbers. In September 2011, 472 homes were taken off the market and in September 2012, only 297 were taken off the market. Sellers seem more realistic in their pricing and buyers seem more willing to shell out the cash needed to get into the homes they want.
Did your home expire? Check out our Austin Home Not Selling resources page to find out why.
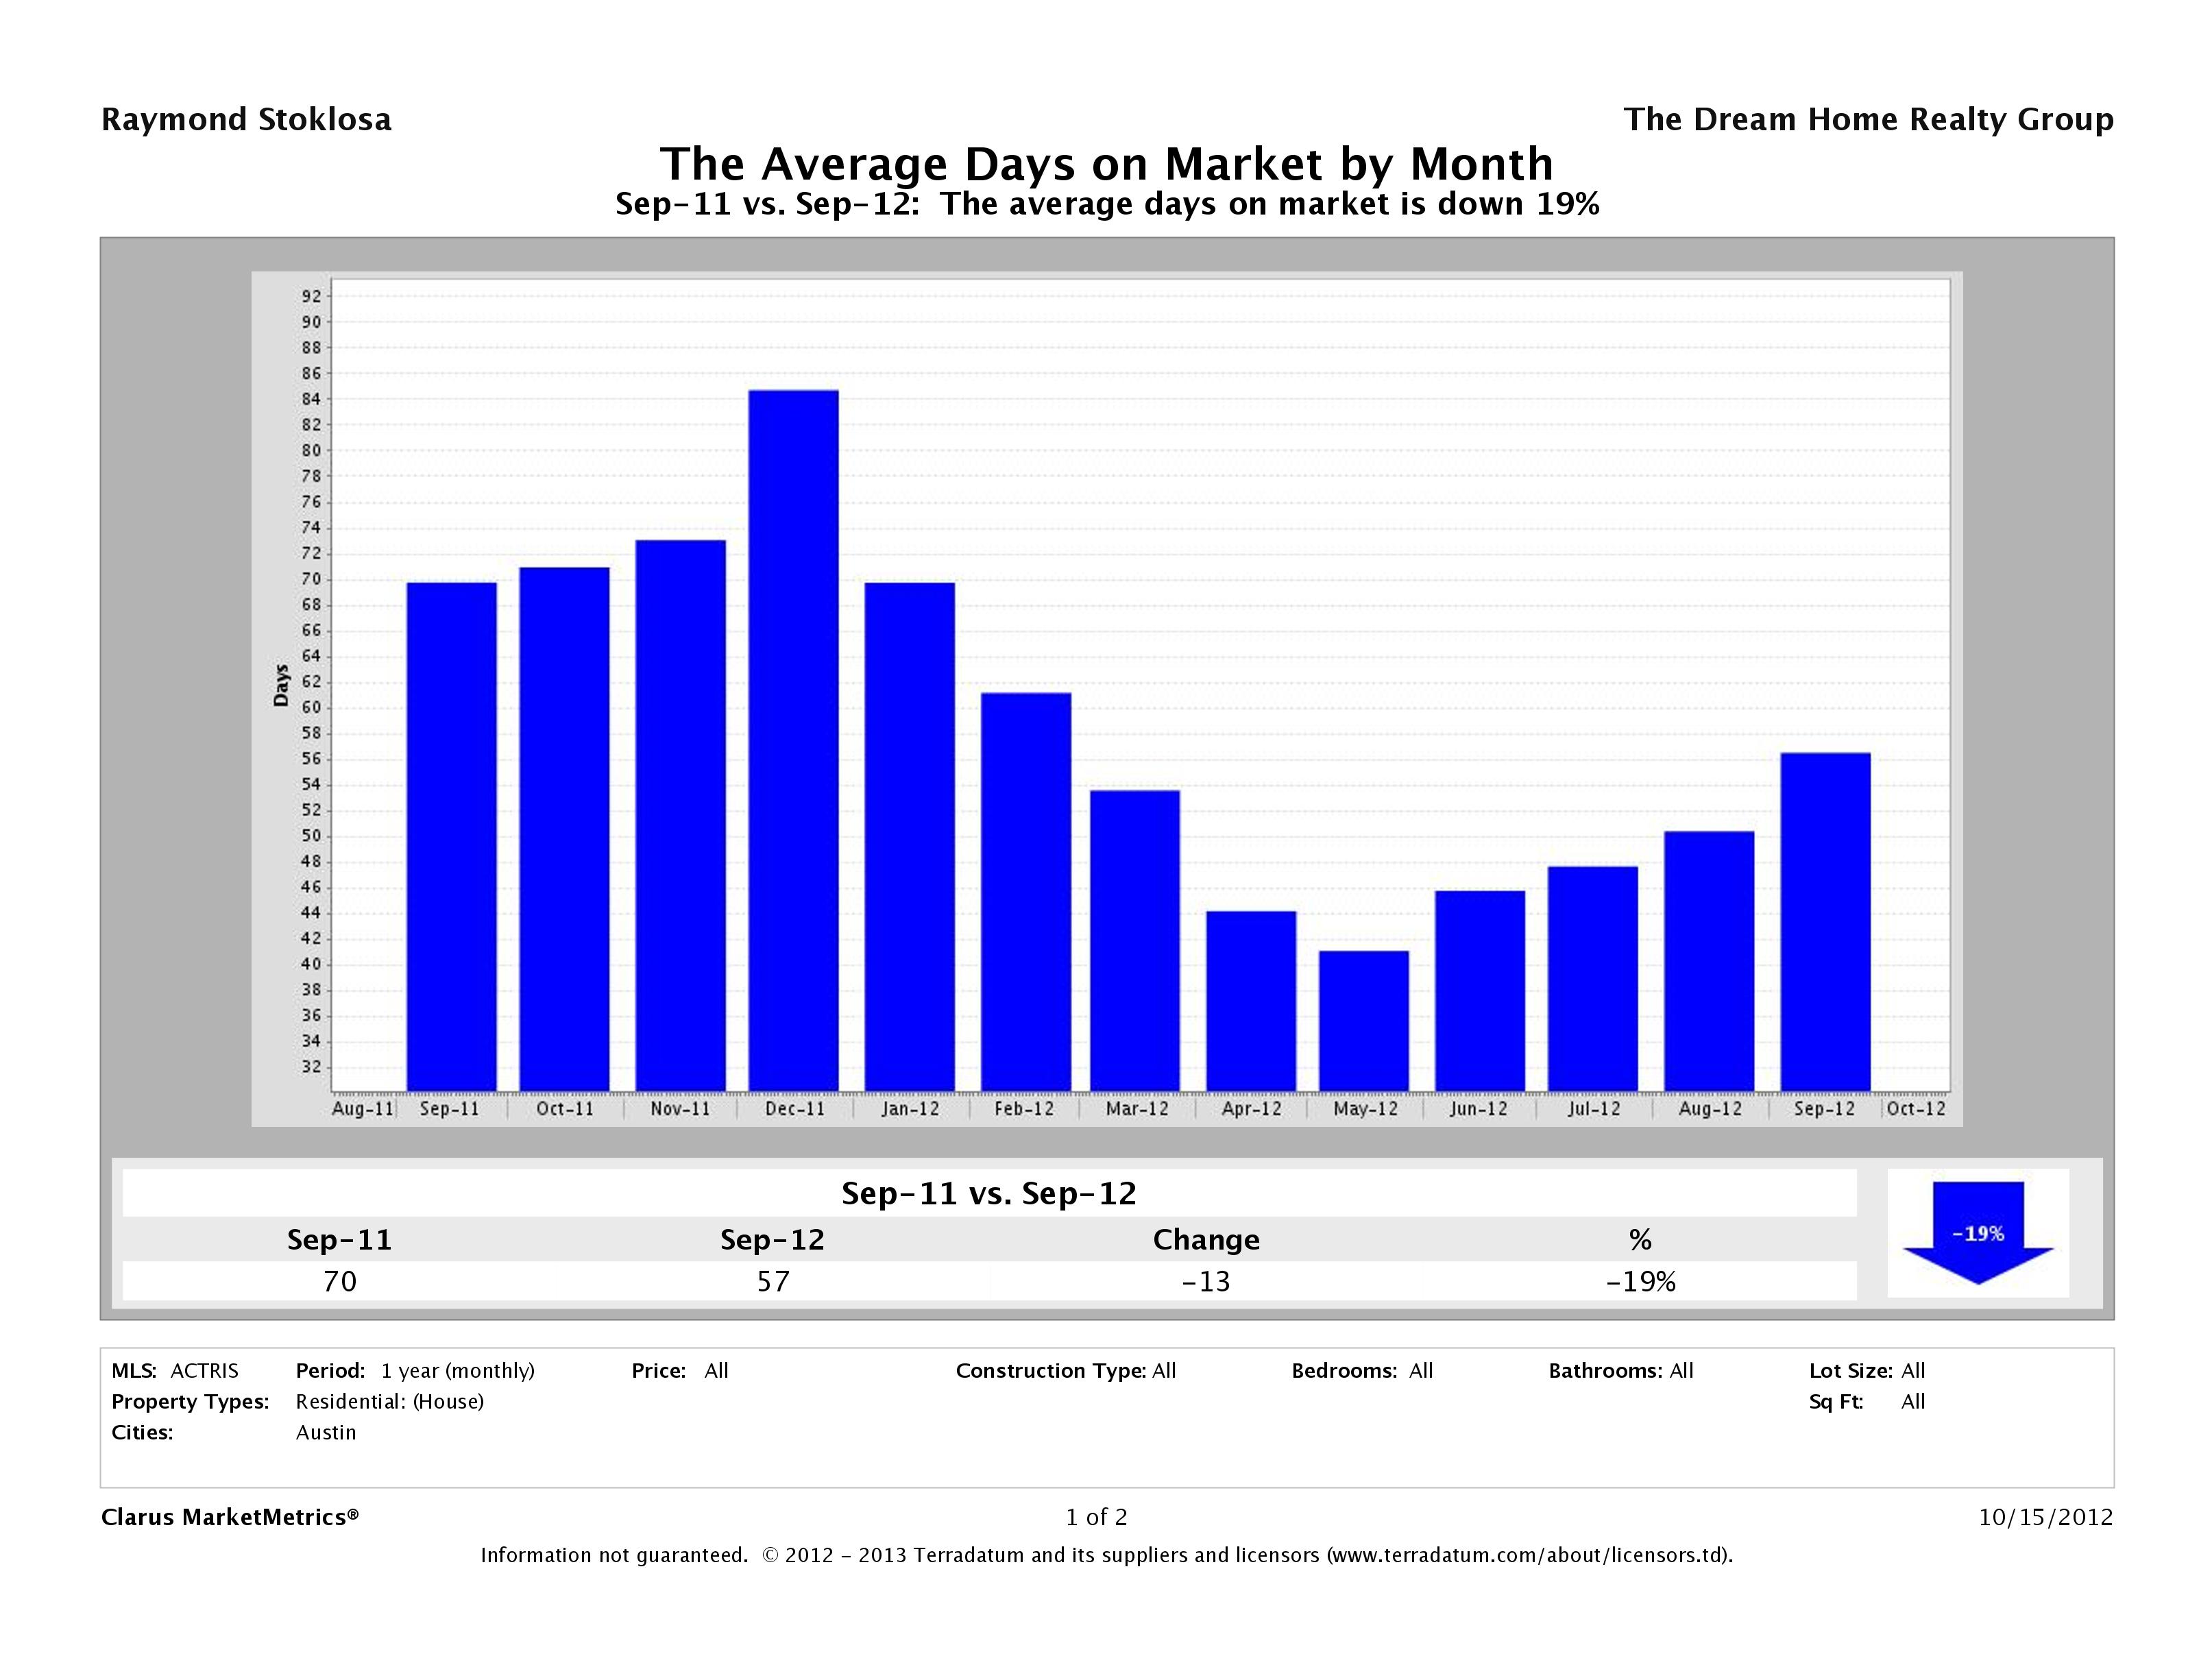
Time to Sell Home in Austin Down 19%
In September 2011, it took, on average, 70 days to sell a home in Austin while in September 2012, it is taking around 57 days. A normal market is considered 90 days, so 57 days is pretty low. Not quite as low as the low 40’s we saw in April and May 2012, but still not too bad all things considered.
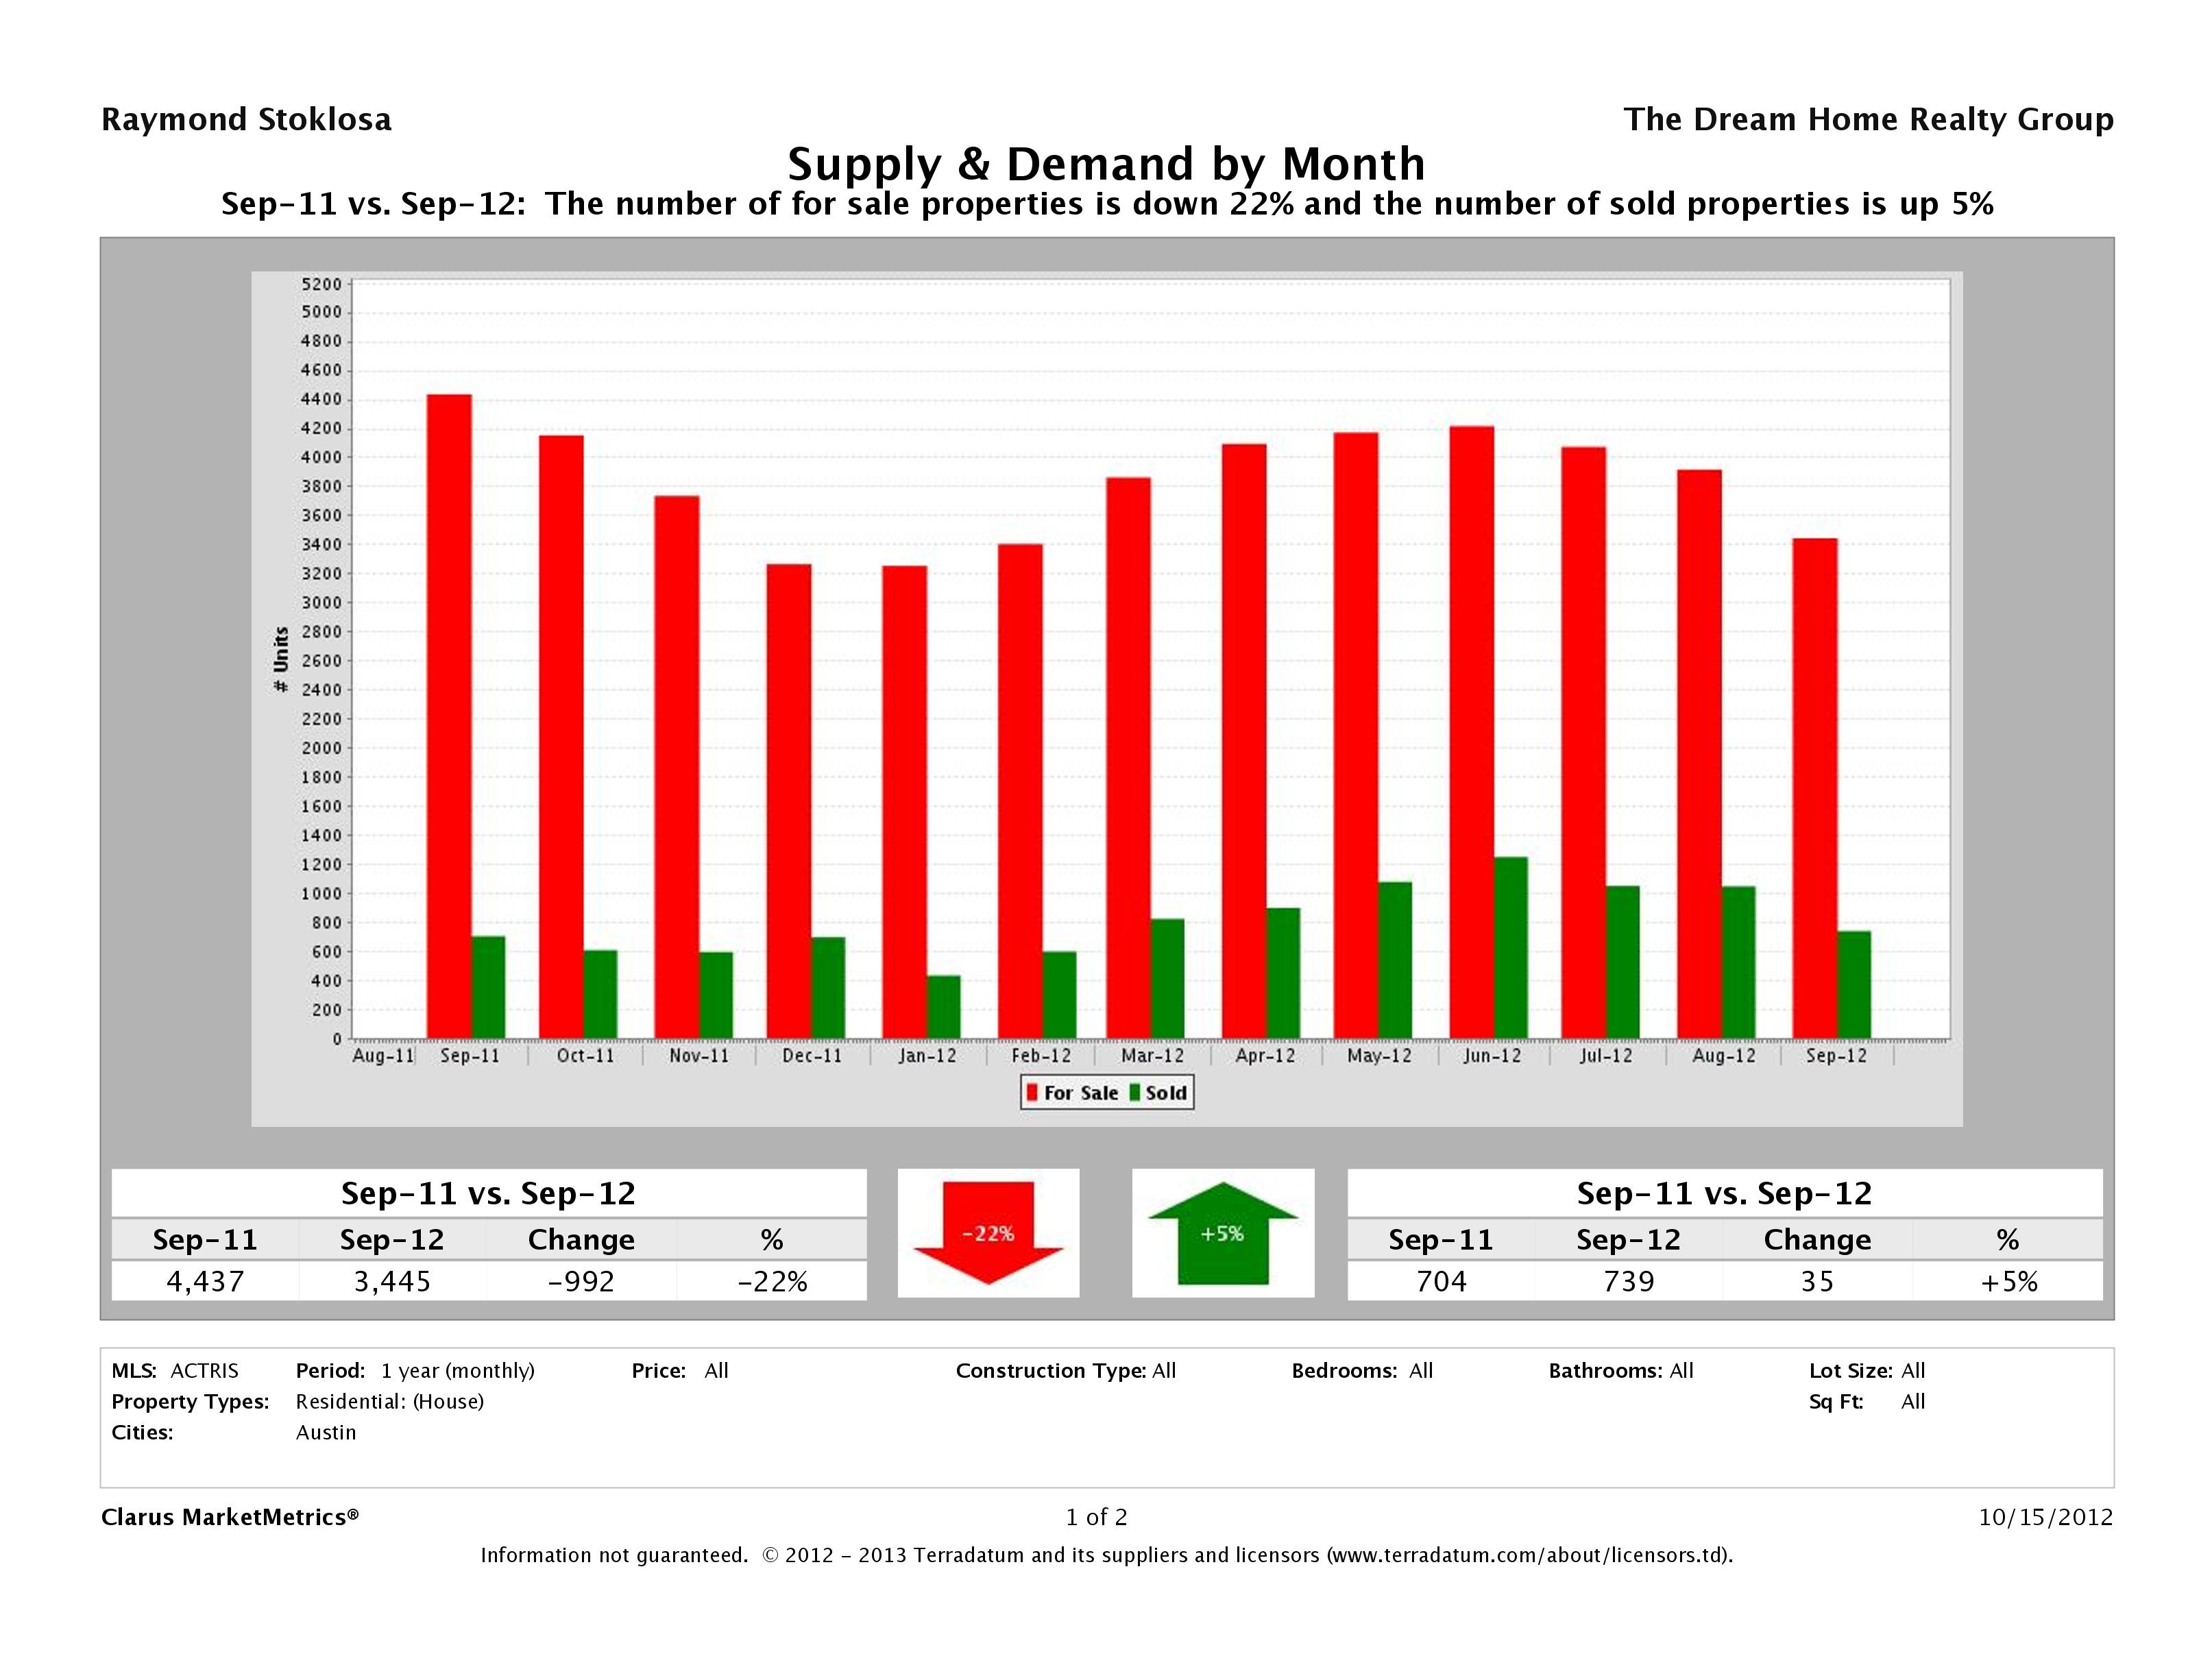
Supply is Down 22% and Demand is Up 5%
This month we’ve seen a 22% decrease in supply (number of properties for sale) and a 5% increase in demand (number of sold properties). Yet another indicator more residents are deciding to stay put while others continue to move to Austin in record numbers.
Median for Sale Up 21% vs Median Sold Price Up 1%
This chart compares the Median for Sale Price vs the Median Sold Price to show their relationship. In Austin, we saw a 21% increase in the median for sale price of a single family home in year over year numbers. The median sold price was essentially constant, up 1%, increasing by $3,042 in year over year numbers. Though this month sellers asked more for their homes, it seems buyers have still been doing a great job in getting them to come down.
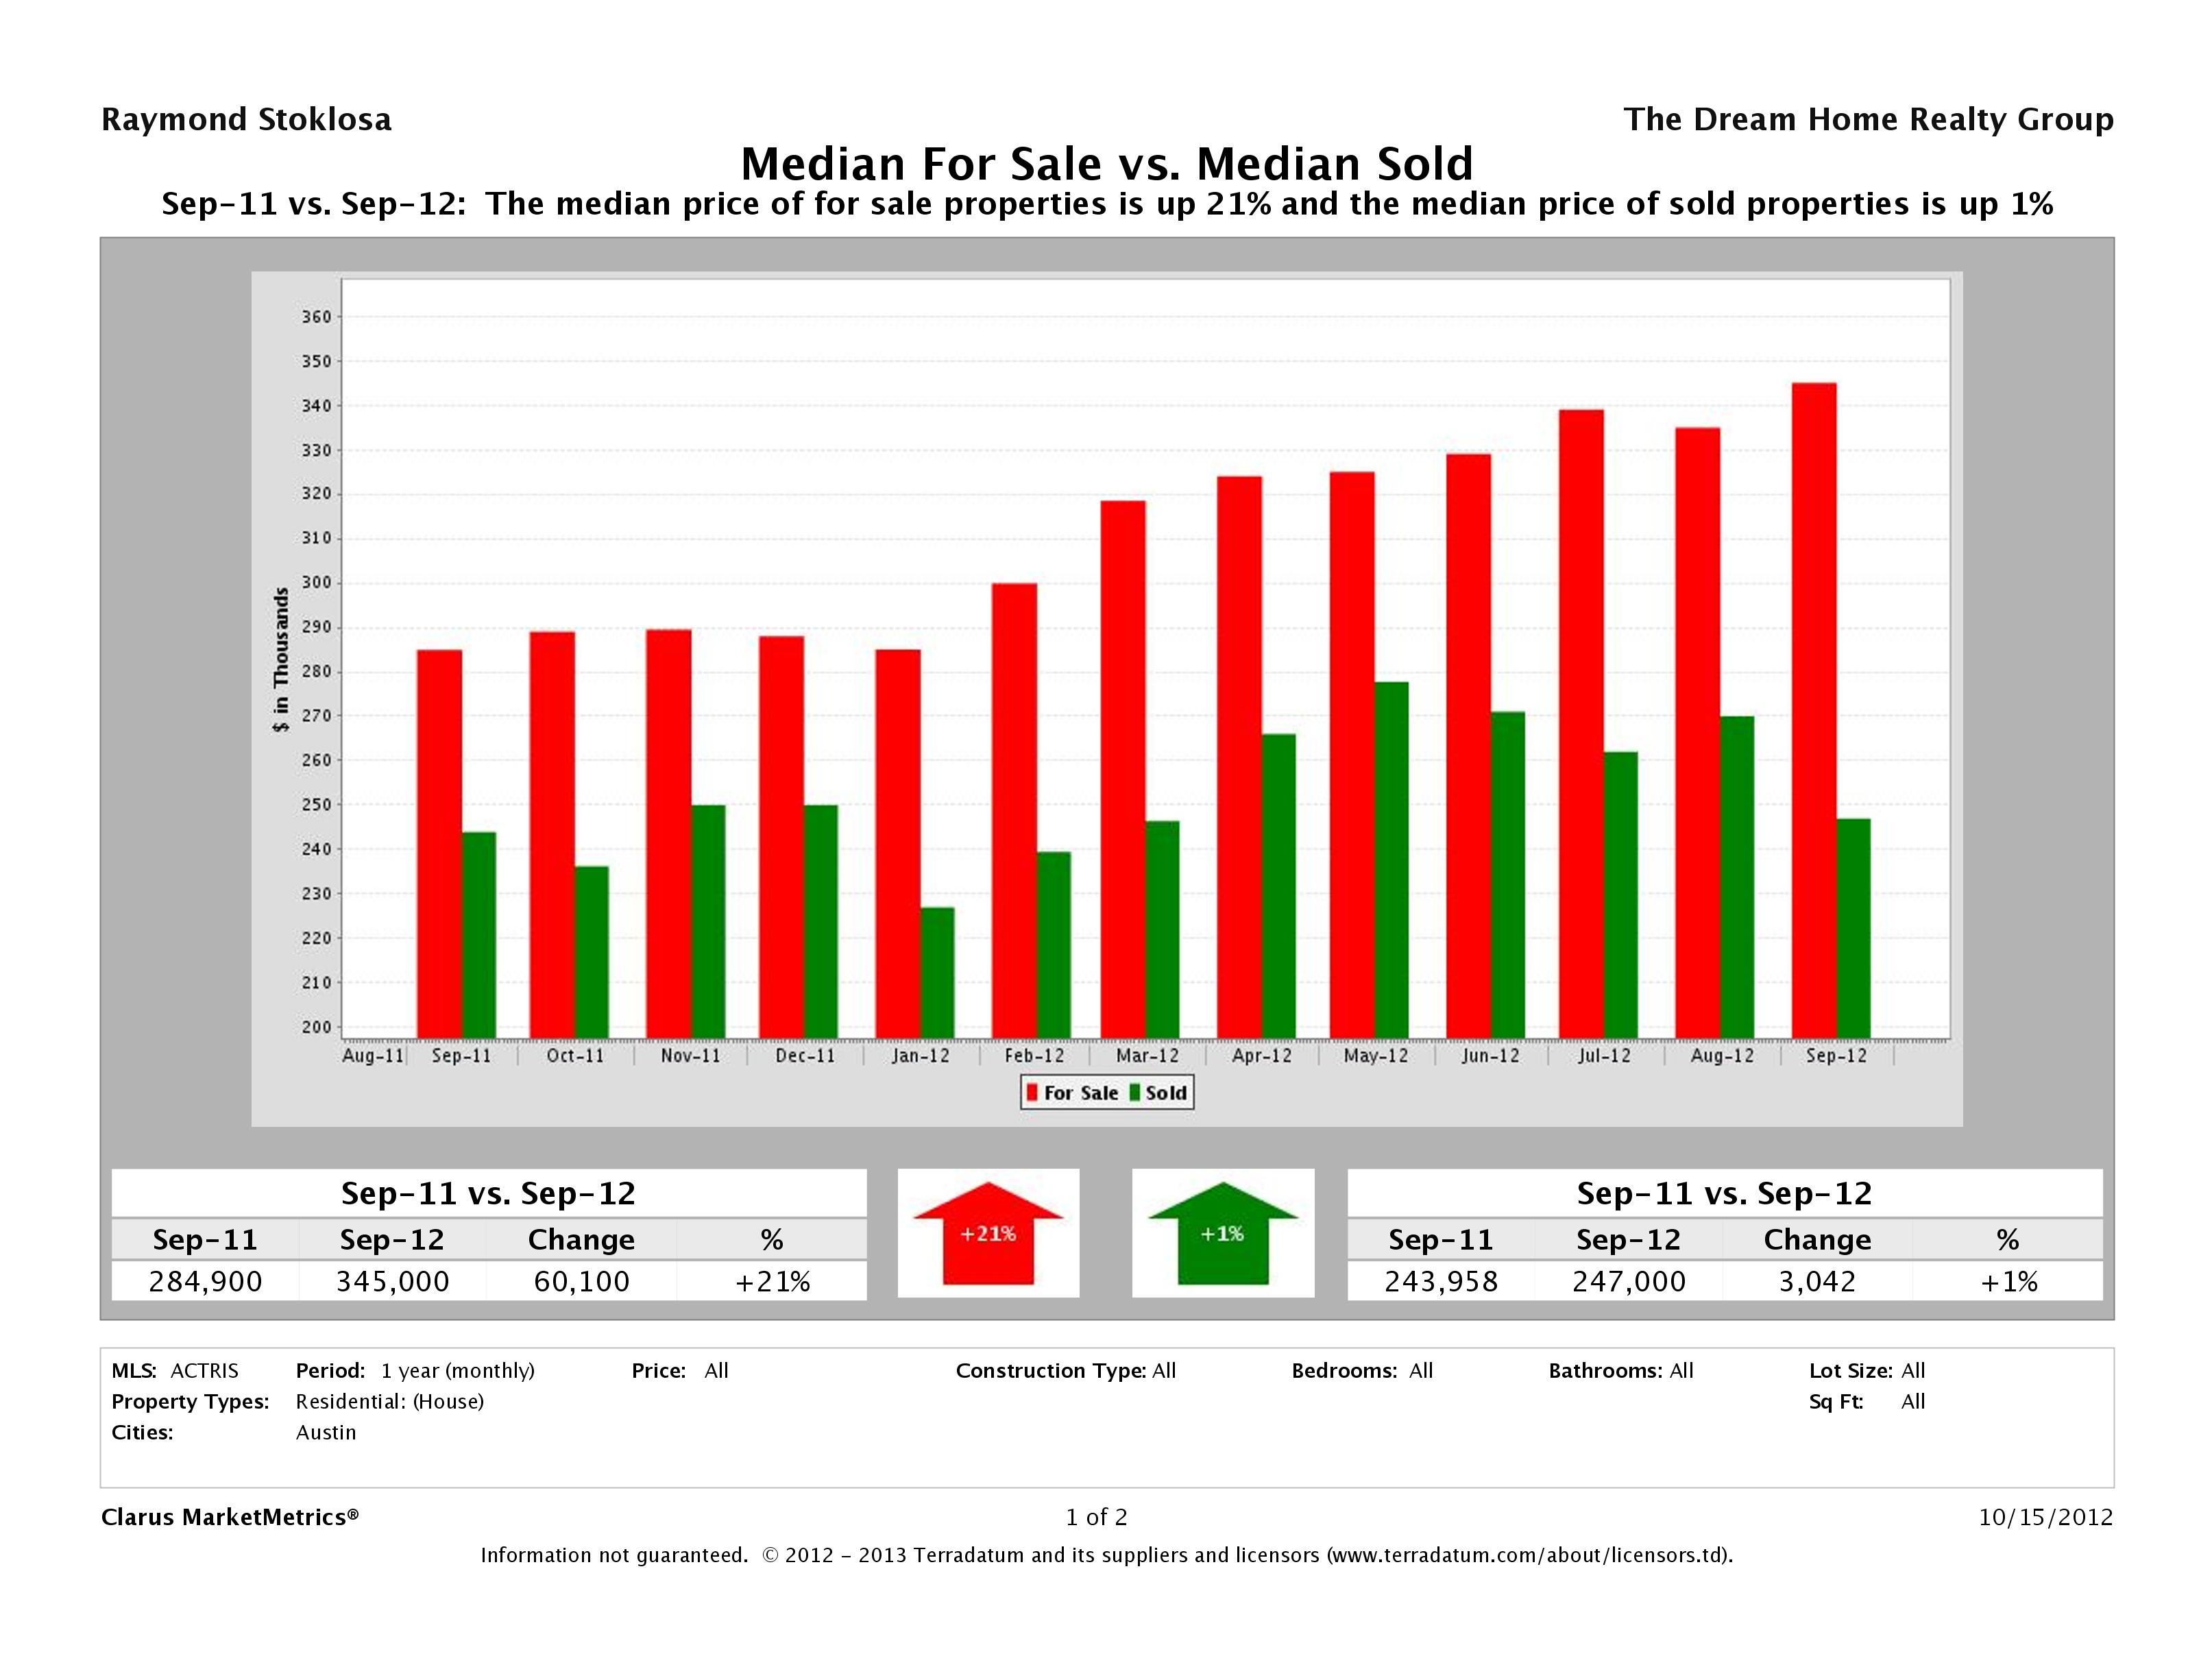
Source: Clarus Market Metrics, ACTRIS Sold Data
September 2012 Real Estate Price Report – Strictly Numbers
For those of you who prefer to see the actual hard numbers, we’ve included the figures for September 2012 Austin home sales below. The most expensive home that sold in September 2012 was $4,375,000 and the least expensive home sold for $37,000. Homes range in size from 357sqft-8,357sqft with an average size of 2,236sqft. The average price per square foot was $149.35 with the lowest being $30.19/sqft and the highest being $991.61/sqft. It took, on average, 46 days to sell a home in Austin and sellers received, on average, 97.55% of their list prices.
| Beds | Baths | SqFt | Listing Price | LP/SqFt | Selling Price | SP/SqFt | SP/LP | SP/OLP | DOM | |
|---|---|---|---|---|---|---|---|---|---|---|
| High | 6 | 6 | 8,357 | $4,495,000 | $1144.17 | $4,375,000 | $991.61 | 128.9% | 98387.1% | 1,036 |
| Low | 1 | 1 | 357 | $34,900 | $30.19 | $37,000 | $29.43 | 60.4% | 0.9% | 0 |
| Average | 3 | 2 | 2,236 | $342,998 | $149.35 | $332,492 | $145.26 | 97.55% | 229% | 46 |
| Median | 3 | 2 | 1,948 | $250,000 | $126.42 | $246,500 | $123.64 | 98% | 96.8% | 23 |
| Search Criteria | |||
|---|---|---|---|
| Status | Sold | Sold Date | September 2012 |
| Property Type | Single Family Homes | Number Sold | 742 |
| Source: | ABoR Sales Data | Area | Austin |
September 2012 Days on Market Report
The overwhelming majority (55.8%) of the 742 homes that sold in Austin in September 2012 (414) sold in less than 30 days and received, on average, 98.3% of their list prices. As homes stayed on the market for longer, sellers received less than their list prices with homes that have been for sale for 120 days or more receiving, on average, 95.68% of their list prices. The lesson here? Homes that are priced right from the beginning sell quickly and for list price.
| 0-30 Days | 31-60 Days | 61-90 Days | 91-120 Days | 120+ Days | |
|---|---|---|---|---|---|
| No. of Listings | 414 | 146 | 66 | 48 | 68 |
| Breakdown % | 55.8% | 19.68% | 8.89% | 6.47% | 9.16% |
| Avg % SP/LP | 98.3% | 97.09% | 96.56% | 96.52% | 95.68% |

September 2012 Price Analysis Report
The majority of the homes that sold in Austin in September 2012 were priced below $300,000, which is to be expected. You’ll also see that the lower priced homes sold faster than the higher priced homes, which is due largely in part to the increased market for homes below $300k.
| Price Range | Quantity | Average DOM |
|---|---|---|
| $149,999 or under | 105 | 34 |
| $150,000 – $199,999 | 148 | 35 |
| $200,000 – $249,999 | 123 | 36 |
| $250,000 – $299,999 | 77 | 43 |
| $300,000 – $349,999 | 64 | 39 |
| $350,000 – $399,999 | 50 | 48 |
| $400,000 – $449,999 | 39 | 48 |
| $450,000 – $499,999 | 27 | 48 |
| $500,000 – $549,999 | 20 | 39 |
| $550,000 – $599,999 | 17 | 42 |
| $600,000 – $699,999 | 23 | 68 |
| $700,000 – $799,999 | 13 | 74 |
| $800,000 – $899,999 | 12 | 94 |
| $900,000 – $999,999 | 7 | 195 |
| $1,000,000 or over | 17 | 174 |
| Total | 742 | 46 |
September 2012 Summary Price Report
Below you’ll find a breakdown of the sales prices of homes in Austin. The average price of a home that sold in September 2012 was $332,492 and the median price was $246,500.
| Summary | List Price | Sale Price |
|---|---|---|
| High | $4,495,000 | $4,375,000 |
| Low | $34,900 | $37,000 |
| Average | $342,998 | $332,492 |
| Median | $250,000 | $246,500 |
Time to Buy? Sell?
As we always say, the best time to buy or sell a home is when you need to buy or sell. If you have a house to sell, selling when its a buyers market may hurt you on the selling end, but you’ll make it up on the buying end. If you’re trying to get into the market for the first time, the only way you’ll know that we’ve “hit bottom” is when its in the rear view mirror. Work with professionals who can help you analyze your financial and lifestyle to determine if now is the right time to buy or sell.
Looking strictly at the numbers, it appears the recommendation for this month is (again)…it’s time to sell. With inventory hovering near the 3 year low, a home that’s priced right should have no problem finding a buyer. Buyers again came out in record numbers in September 2012 with an almost 40% increase in the number of contracts received by sellers. As we head into the Holidays, buyers will start to get distracted. If you need to sell, try to get it on the market as soon as possible. For more info about the best home selling program in Austin, visit Sell My Austin Home.
If you’re a buyer, that doesn’t mean sit on the fence. Buyers have negotiated great deals from sellers who need to sell, indicated by the nearly constant median sold price. If you’re looking to get into the market, the best time to find a great deal is any time you can. For more info about our Home Buyer Representation Program, check out Buy a Home in Austin.
Questions About the Austin Real Estate Price Report?
Do you have questions about this Austin Real Estate Price Report? Call us at (512) 827-8323 or email us at info@AustinRealEstateHomesBlog.com and we’ll help you in any way we can. If you’re looking to buy or sell Austin real estate, don’t forget to check out our Buyer Resources and our Seller Resources for more tips.


Leave a Reply