Eleven Oaks Realty is proud to present their March 2015 Round Rock Real Estate Price Report measuring activity in the Round Rock single family home market.
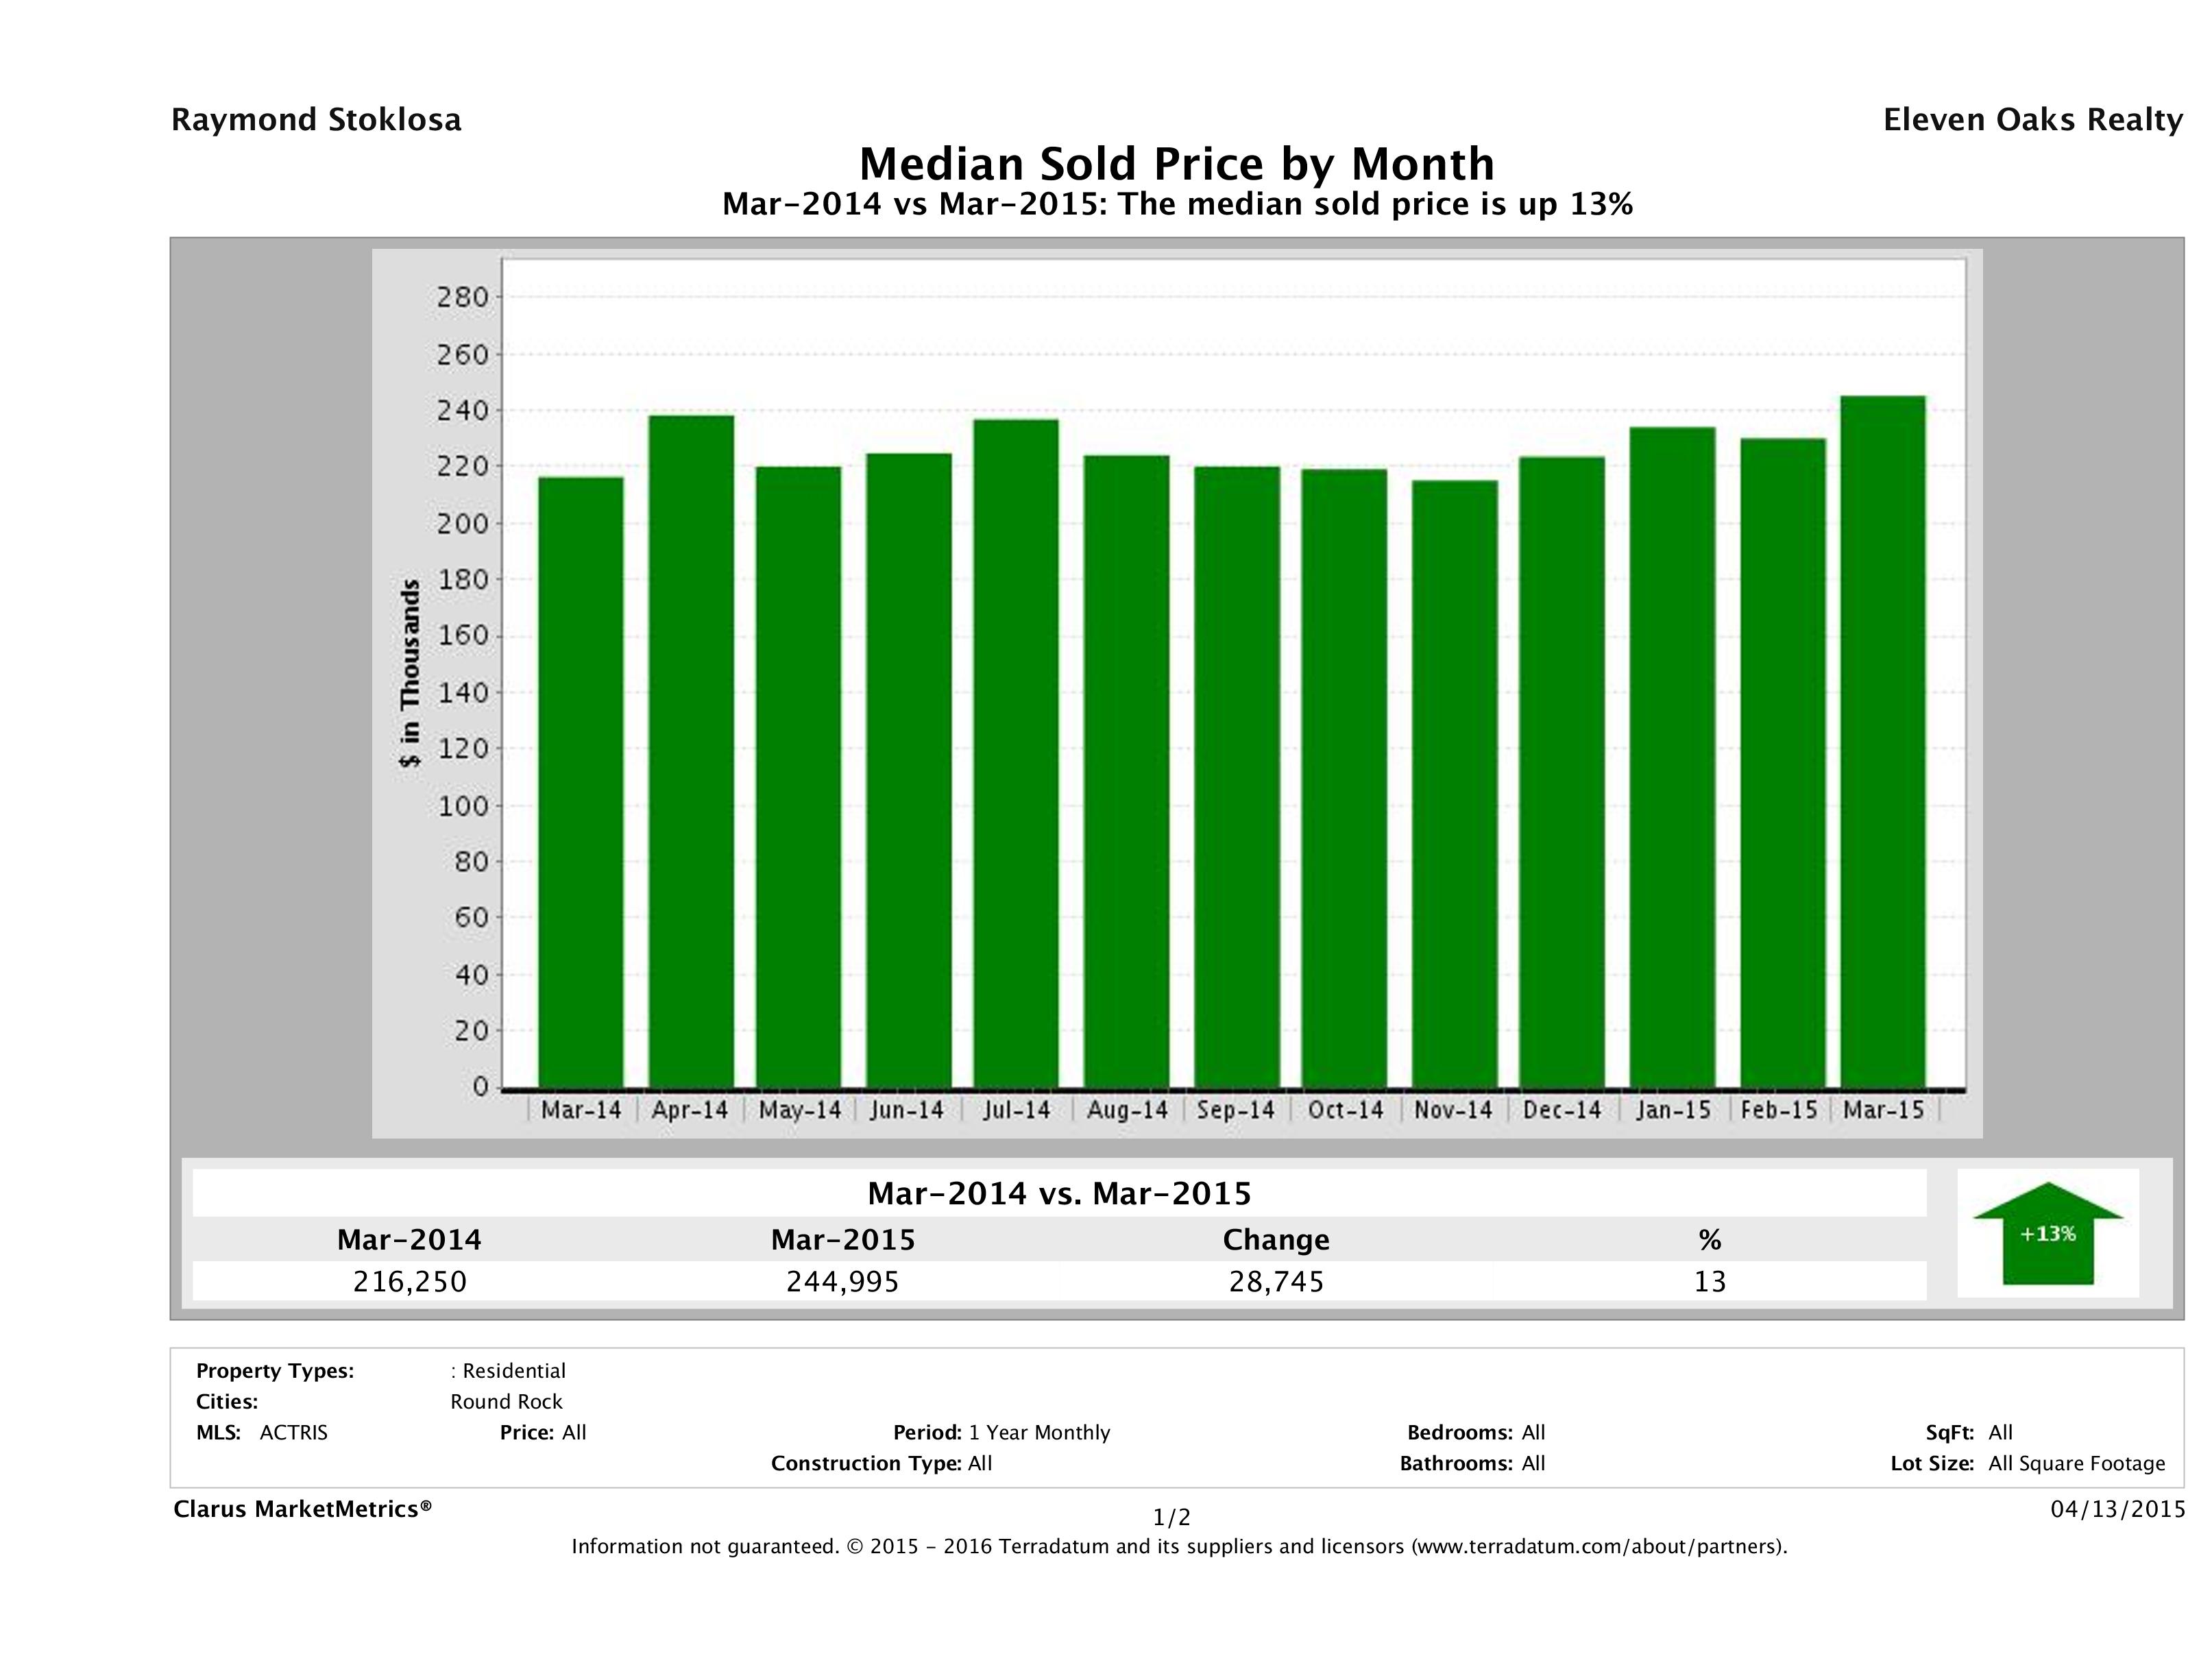
Round Rock Median Home Price Up 13%
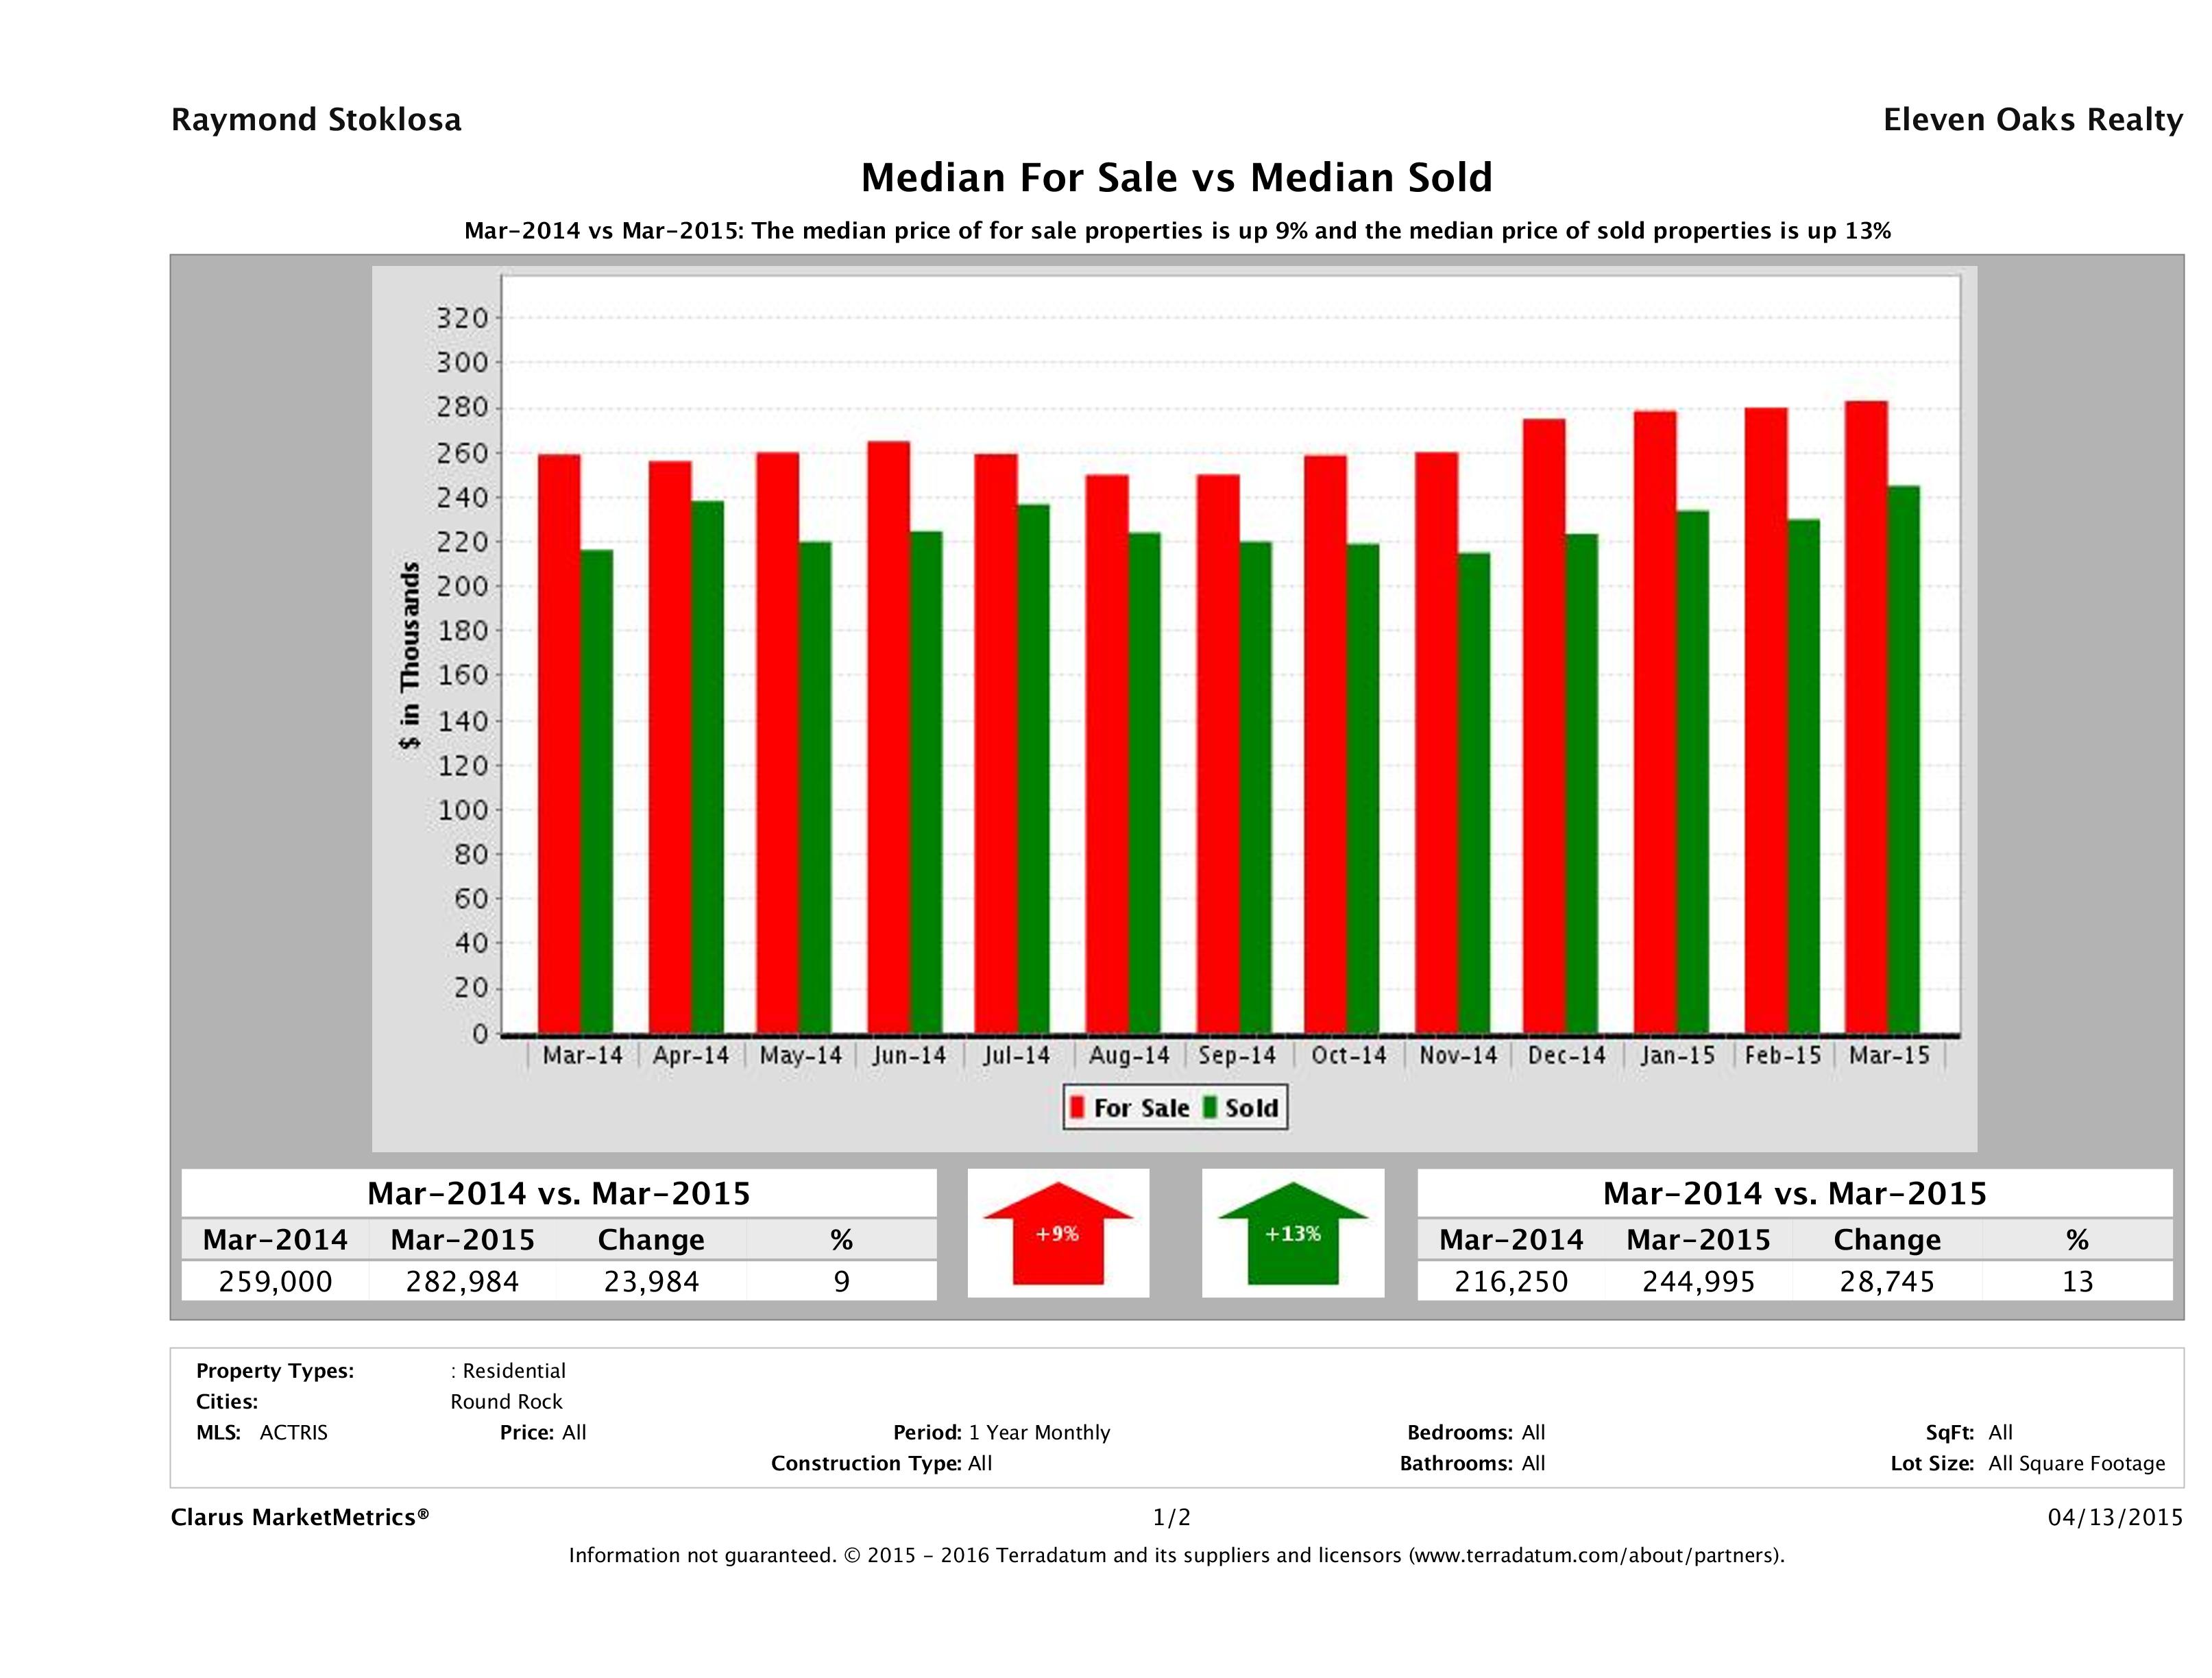
The biggest story in this month’s Round Rock Real Estate Price Report comes by way of median price, which is up 13% in year over year numbers. The median home price of a Round Rock home in March 2015 was $244,995 compared to $216,250 in March 2014, marking a 13% ($28,745) increase in year over year numbers.
Median home price helps us see the distribution of homes sold and does not really give us an indication of the increase or decrease in a particular home’s market value. To analyze market value, we’d have to take an in depth look at a neighborhood. If you’re looking for something like that, please check out our Round Rock Home Values Report.
What does this mean to buyers? The Round Rock real estate market continues to show signs of strong growth. With a highly rated school district, convenient commute to many of Austin’s biggest employers, Round Rock is really a no brainer for home buyers looking for value. If you want to buy a home in Round Rock, my advice is to get in the market as early as you can. It doesn’t appear as though this upward trend is slowing down.
What does this mean to sellers? If you’re thinking about selling, get your home on the market now, while Spring demand is at its peak. This year, Round Rock sellers are getting more for their homes than last year. Sellers who spend time getting their homes ready to sell end up selling their homes for significantly more money. Work with a professional Realtor who knows what buyers are looking for so they can help you position your home as the best one on the market.
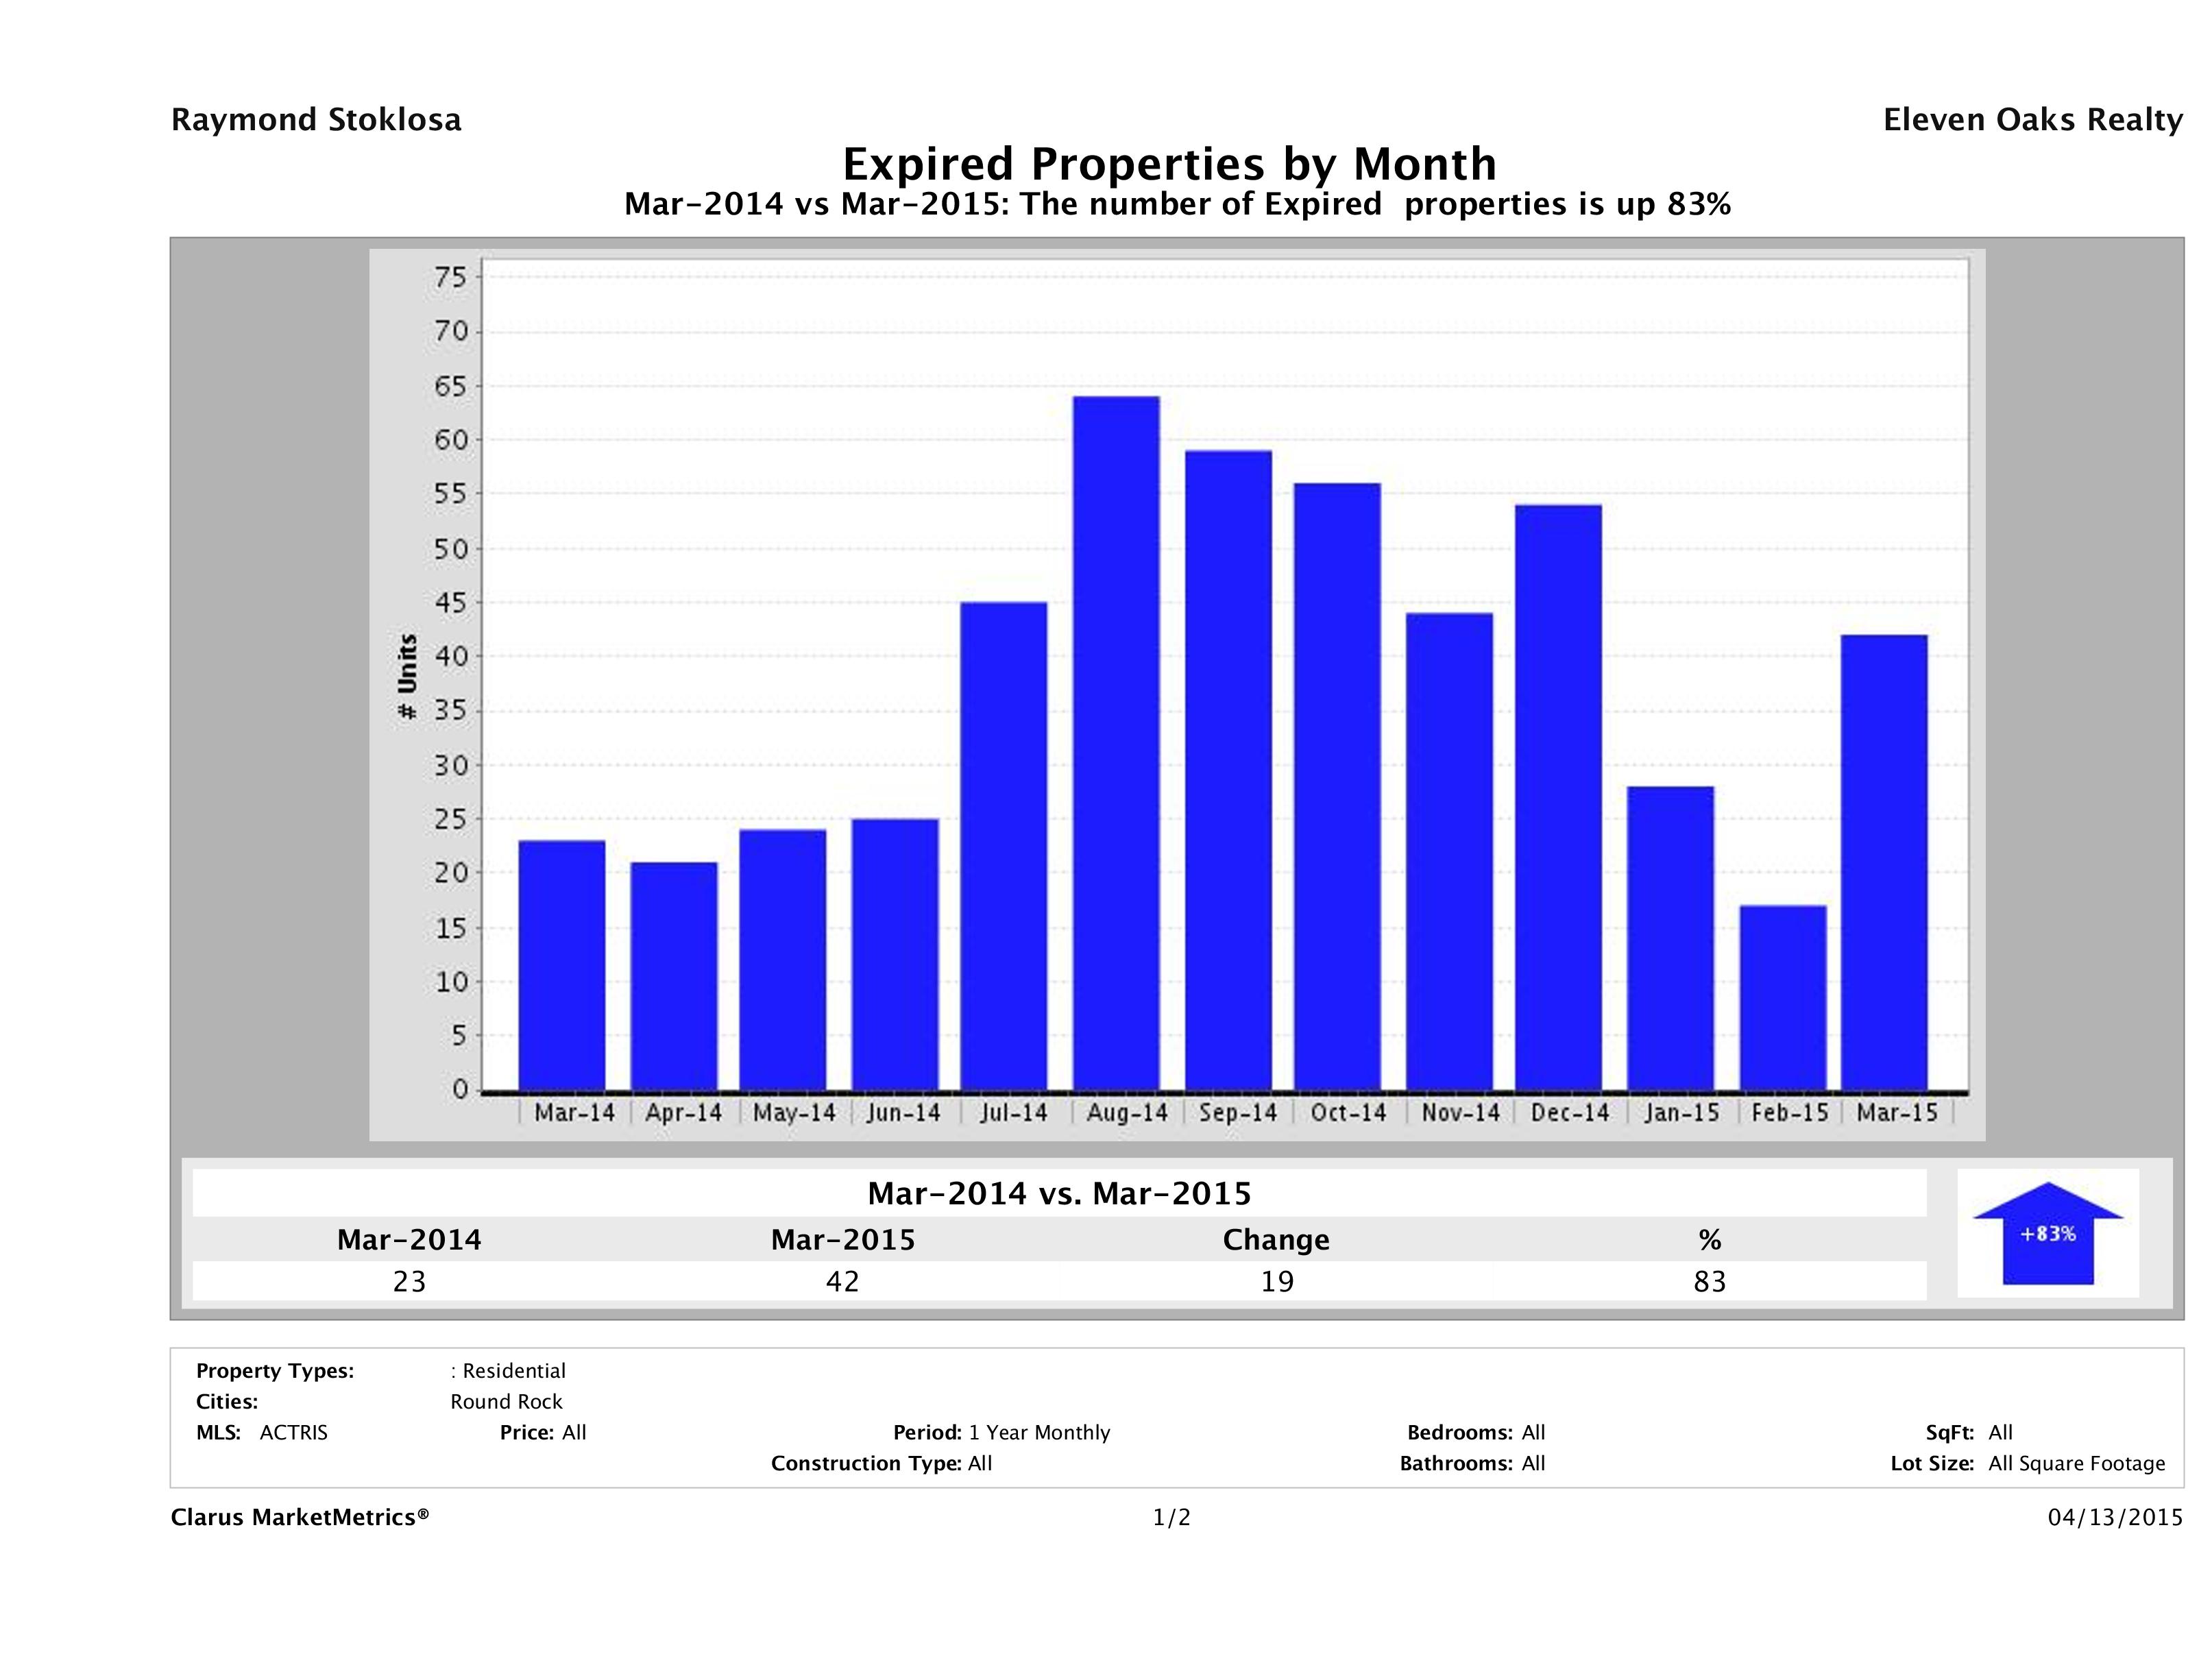
Number of Homes Taken Off the Market Up 83%
In March 2014, there were 23 single family homes taken off the market compared to 42 in March 2015, marking an 83% (19 home) increase city wide. This increase in homes taken off the market is something we’ve seen in all segments of the Austin real estate market.
If you need to sell and your home was priced right but it still didn’t find a buyer, maybe there was something else going on. The biggest culprits we see are incorrect info in the MLS and poor marketing. Check out our Round Rock Home Marketing Plan to see how your homes would be marketed if we listed them. If you’d like our opinion on why your home didn’t sell email us at info@11OaksRealty.com.
Having trouble selling your home? Check out our Round Rock Home Not Selling resources page to find out why.
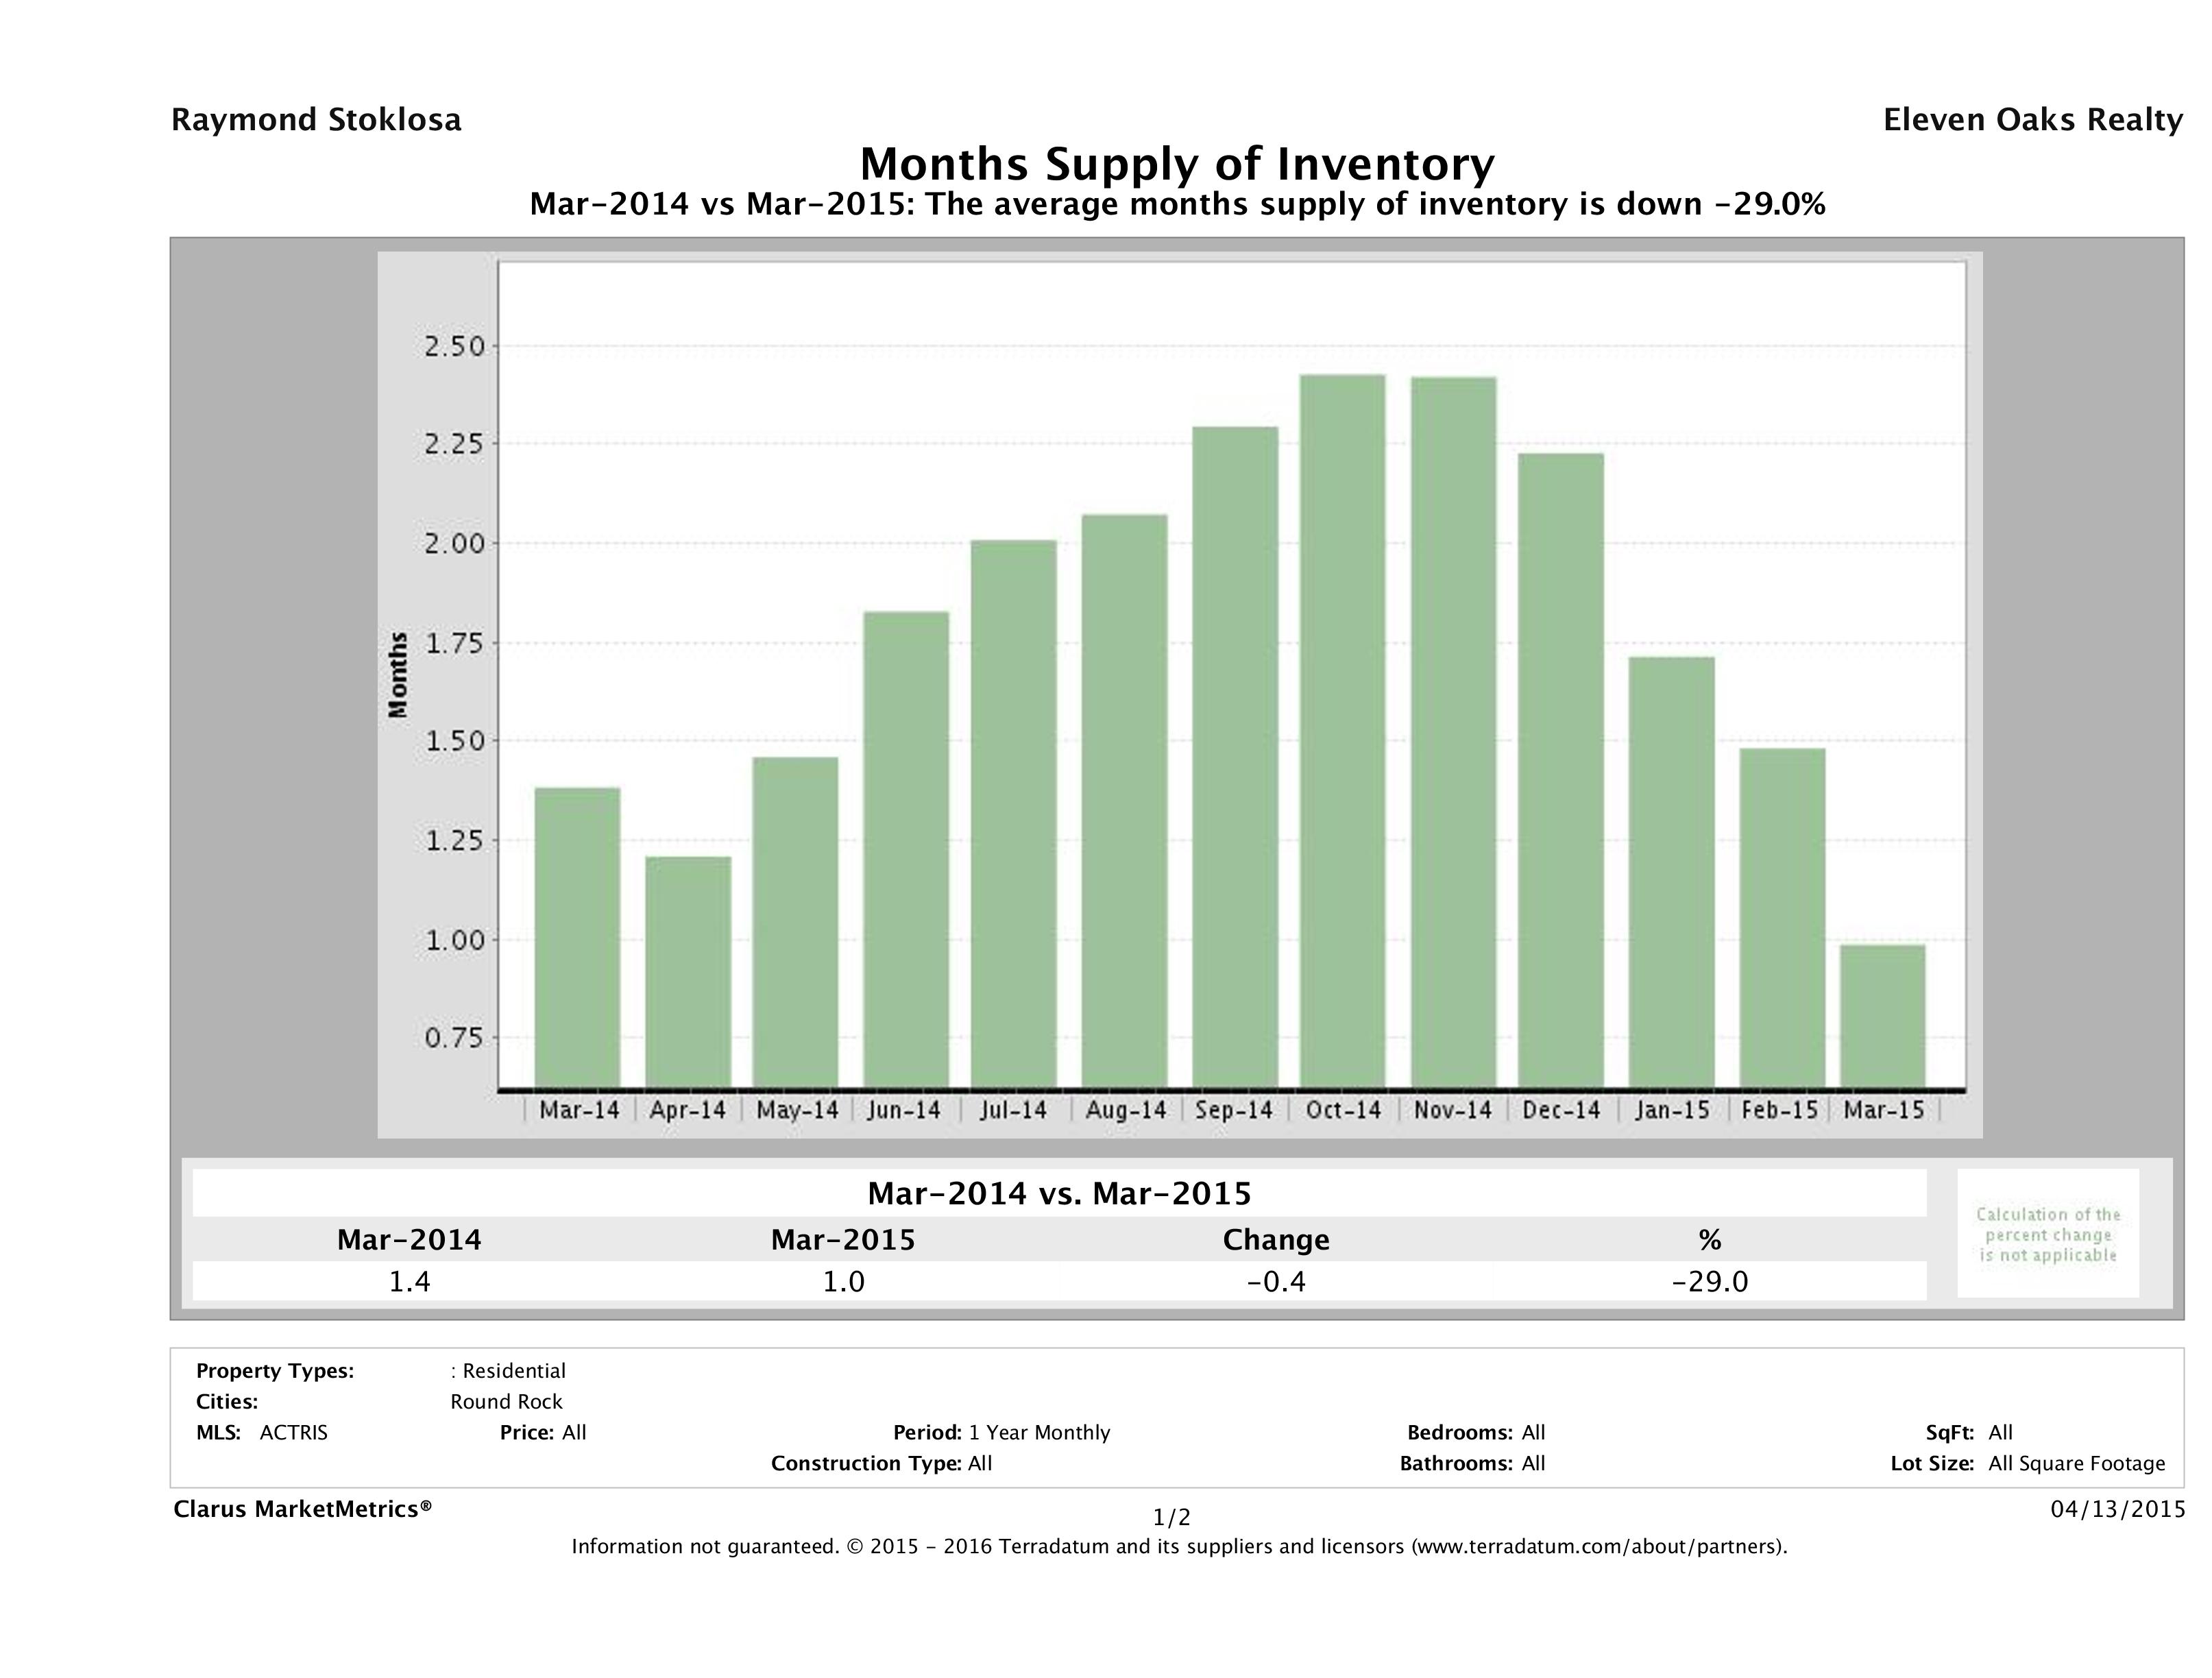
Round Rock Housing Inventory Down 29%
This year we saw at 29% decrease in the amount of inventory on the Round Rock housing market. Again this month, Round Rock’s inventory was more limited than what we are seeing in Austin. In March 2015, we saw 1.0 months of inventory on the market, compared to 1.4 months of inventory in March 2014, marking a 29% decrease in year over year numbers. Round Rock is now at its lowest point in inventory in the past year. Last month we predicted inventory in Round Rock will dip below last year’s lowest point and it already has.
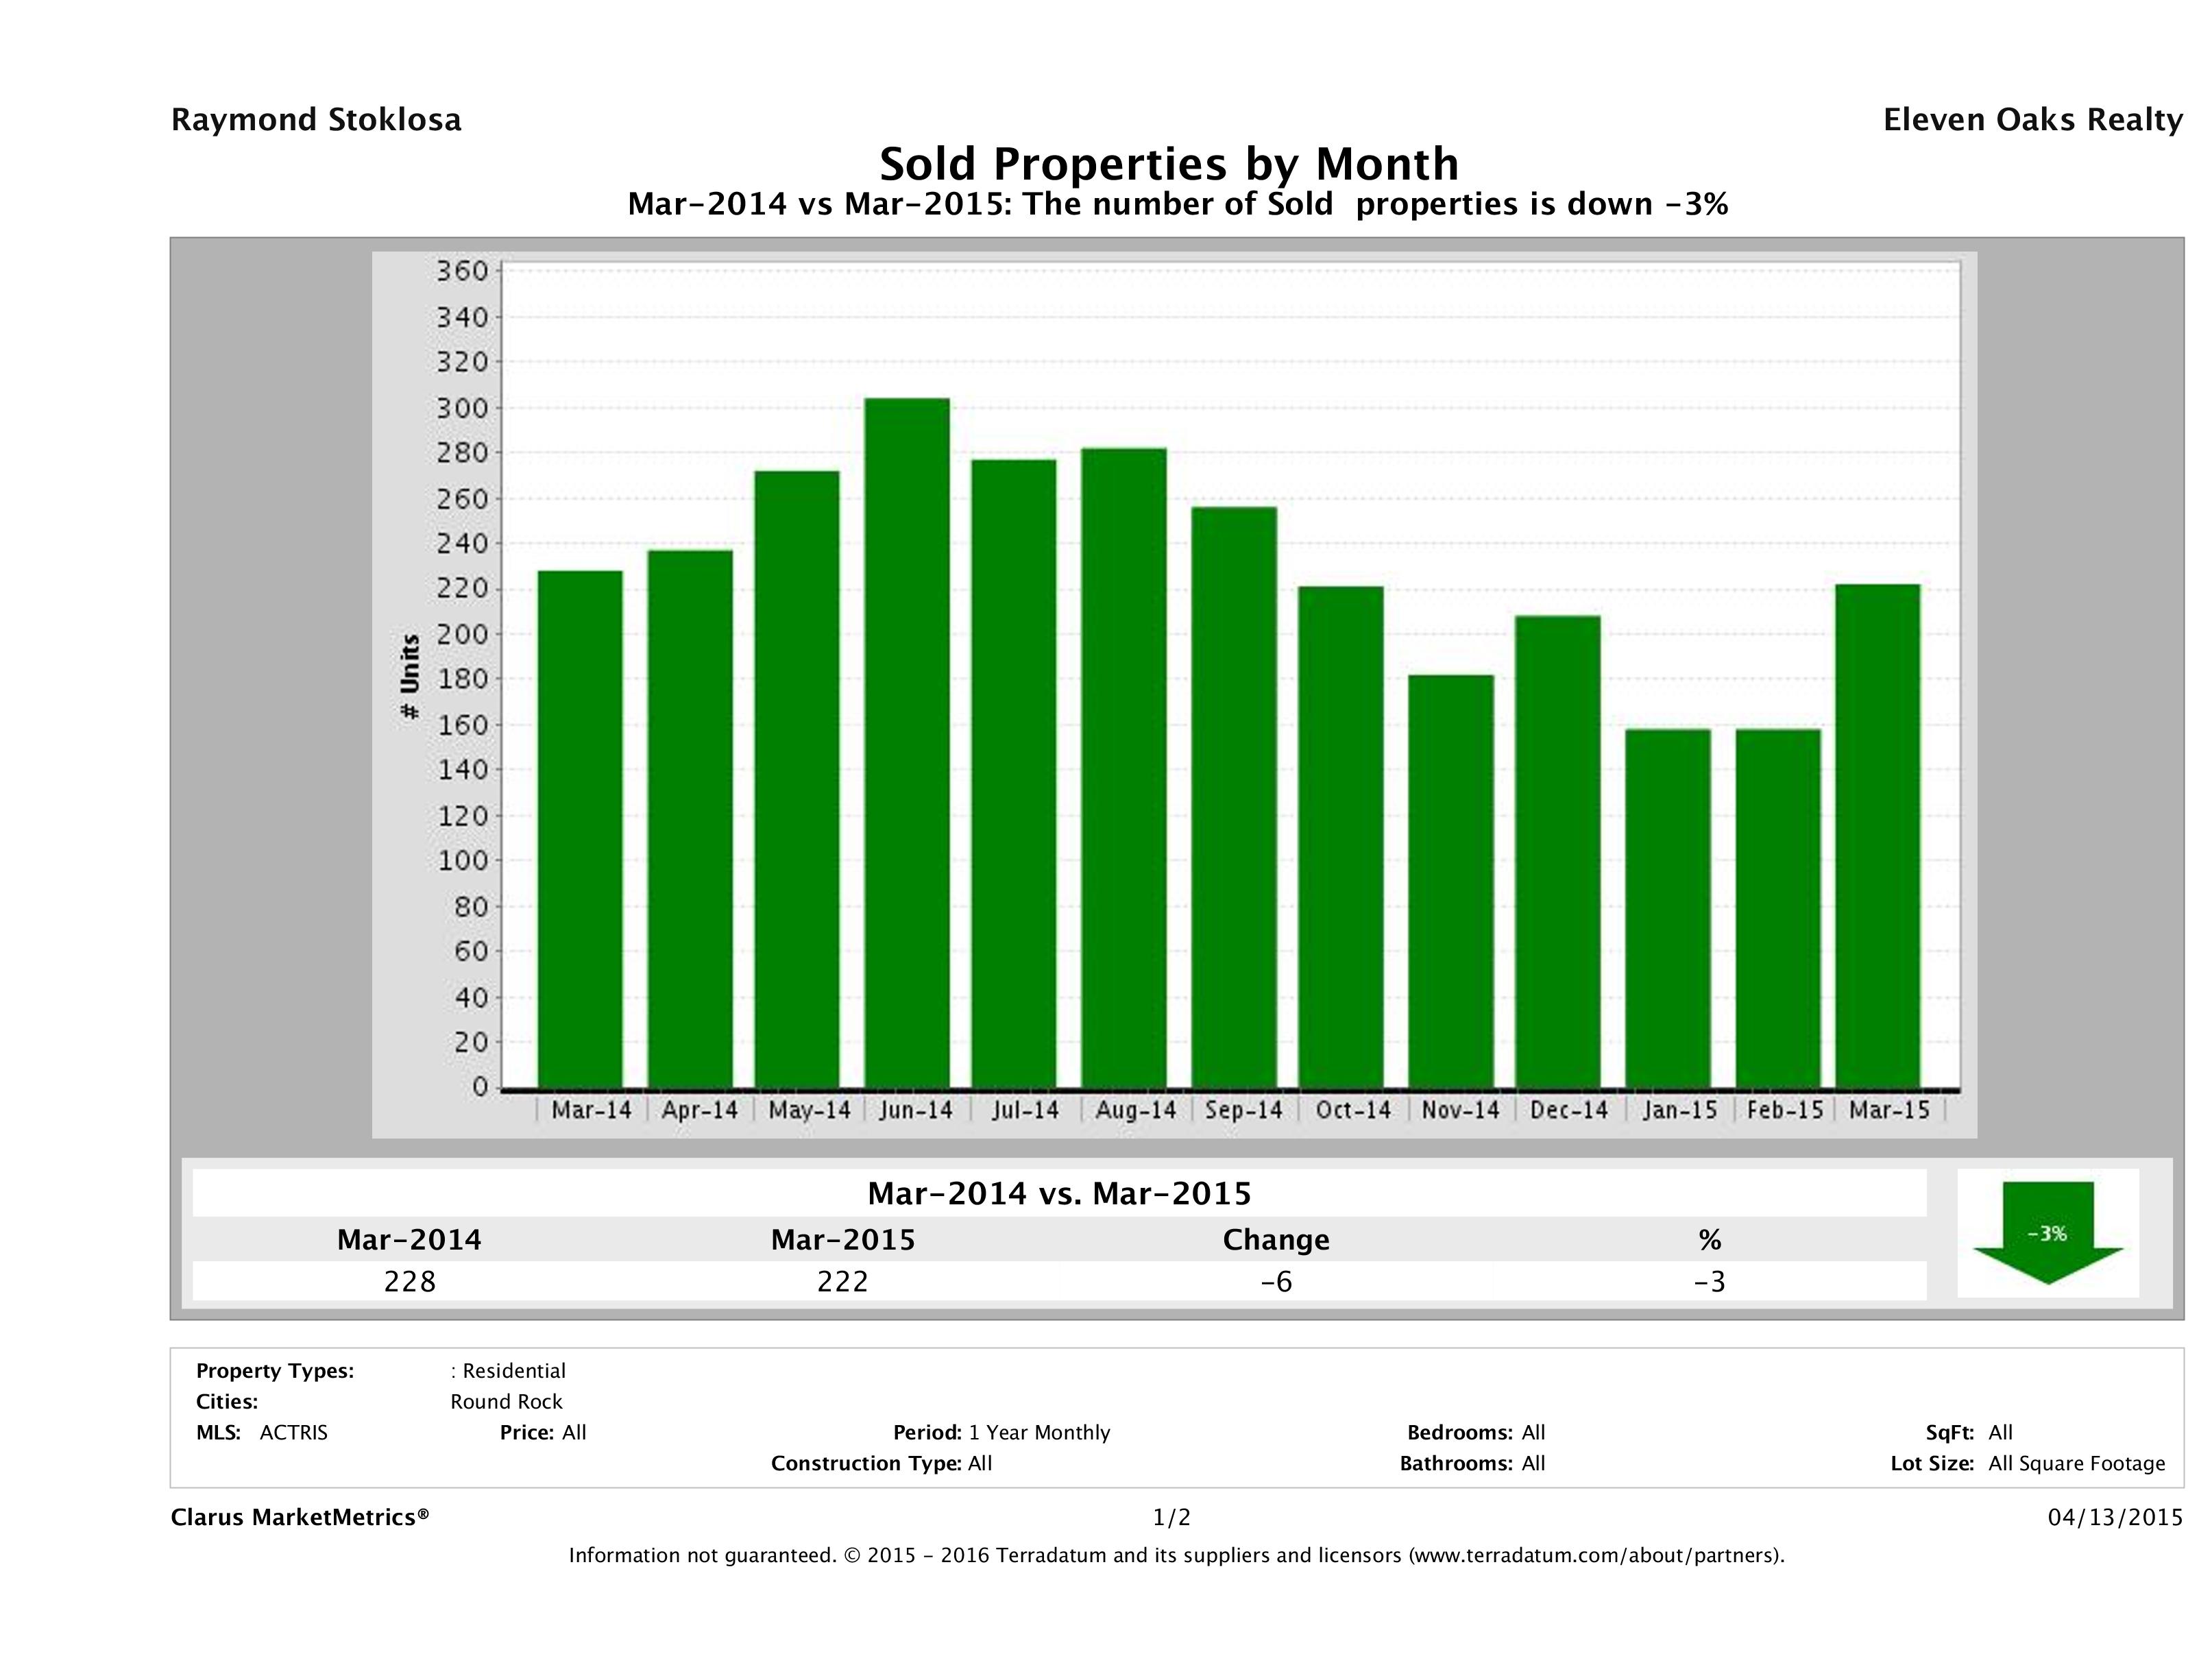
Number of Sold Homes in Round Rock Down 3%
In March 2015, Round Rock saw a 3% decrease in the number of homes sold from March 2014 to March 2015. In March 2015, we saw 222 homes sell in Round Rock compared to 228 in March 2014 marking a 3% (6 home) decrease in year over year numbers. Though we saw a decrease from last year, we saw a significant increase since last month, which is to be expected with seasonality trends.
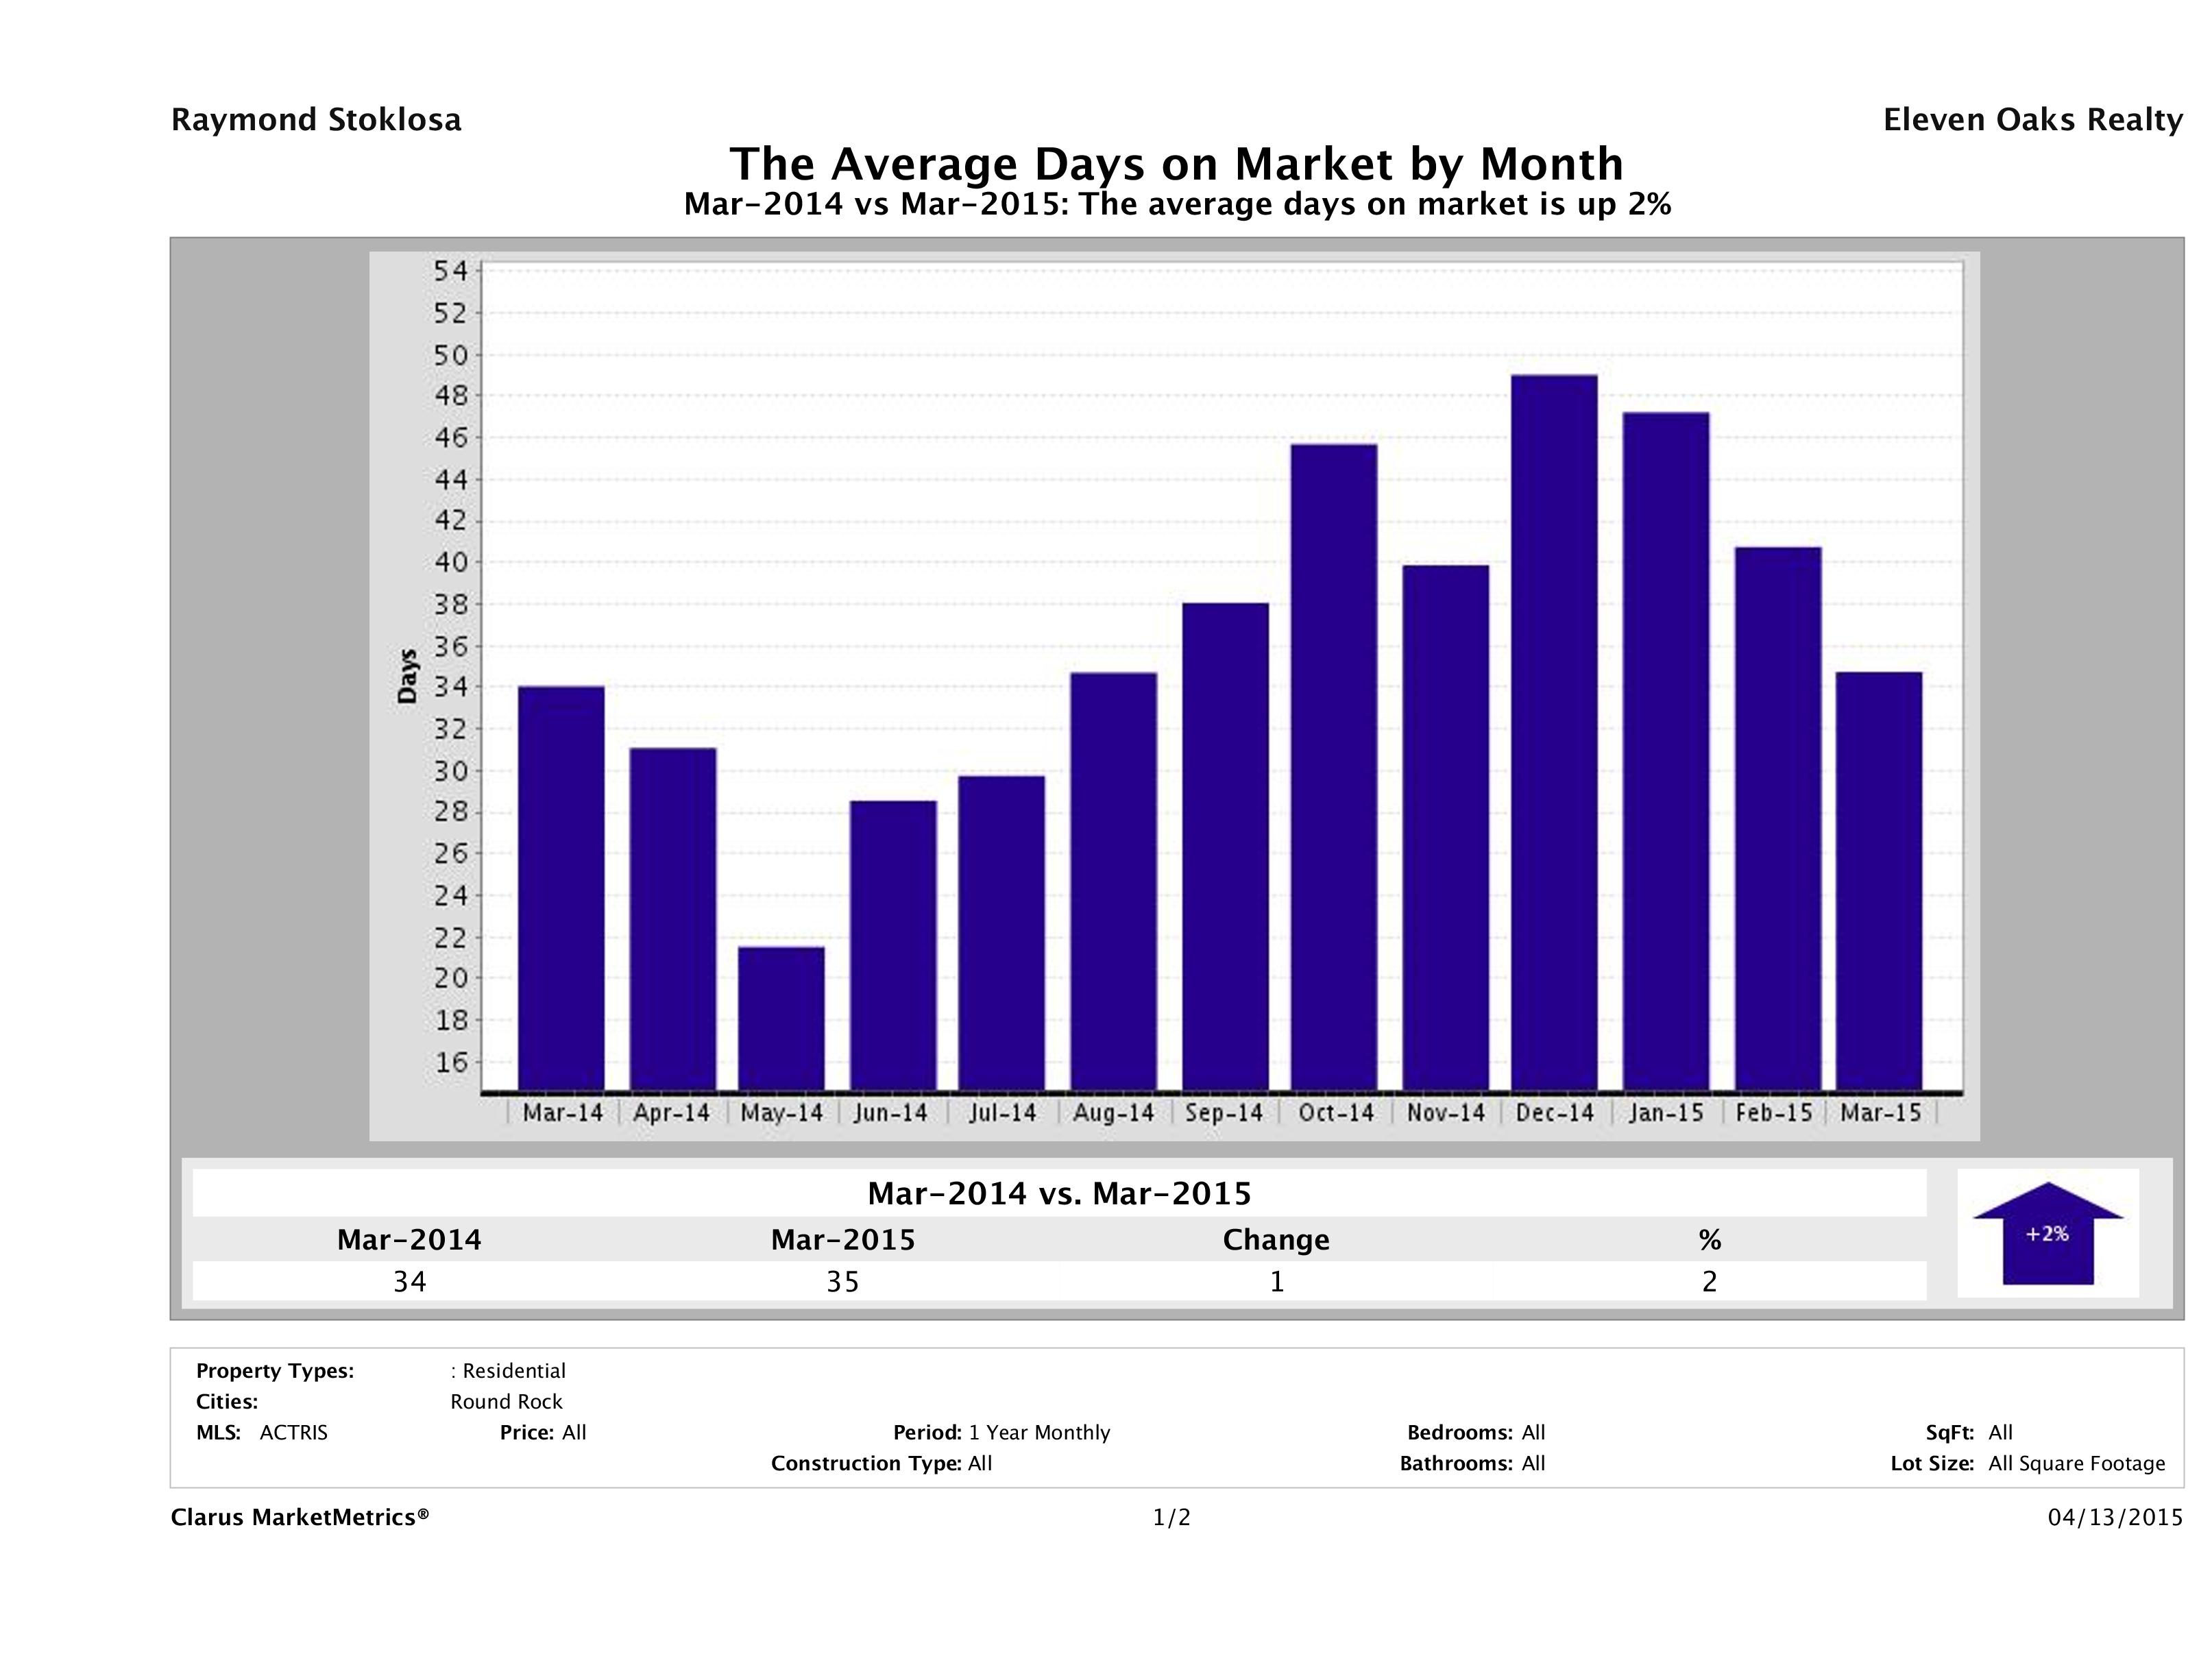
Time to Sell Home in Round Rock Up 2%
In March 2015, it took 35 days to sell a home in Round Rock, on average, compared to 34 days in March 2014, marking a 2% (1 day) increase in year over year numbers.
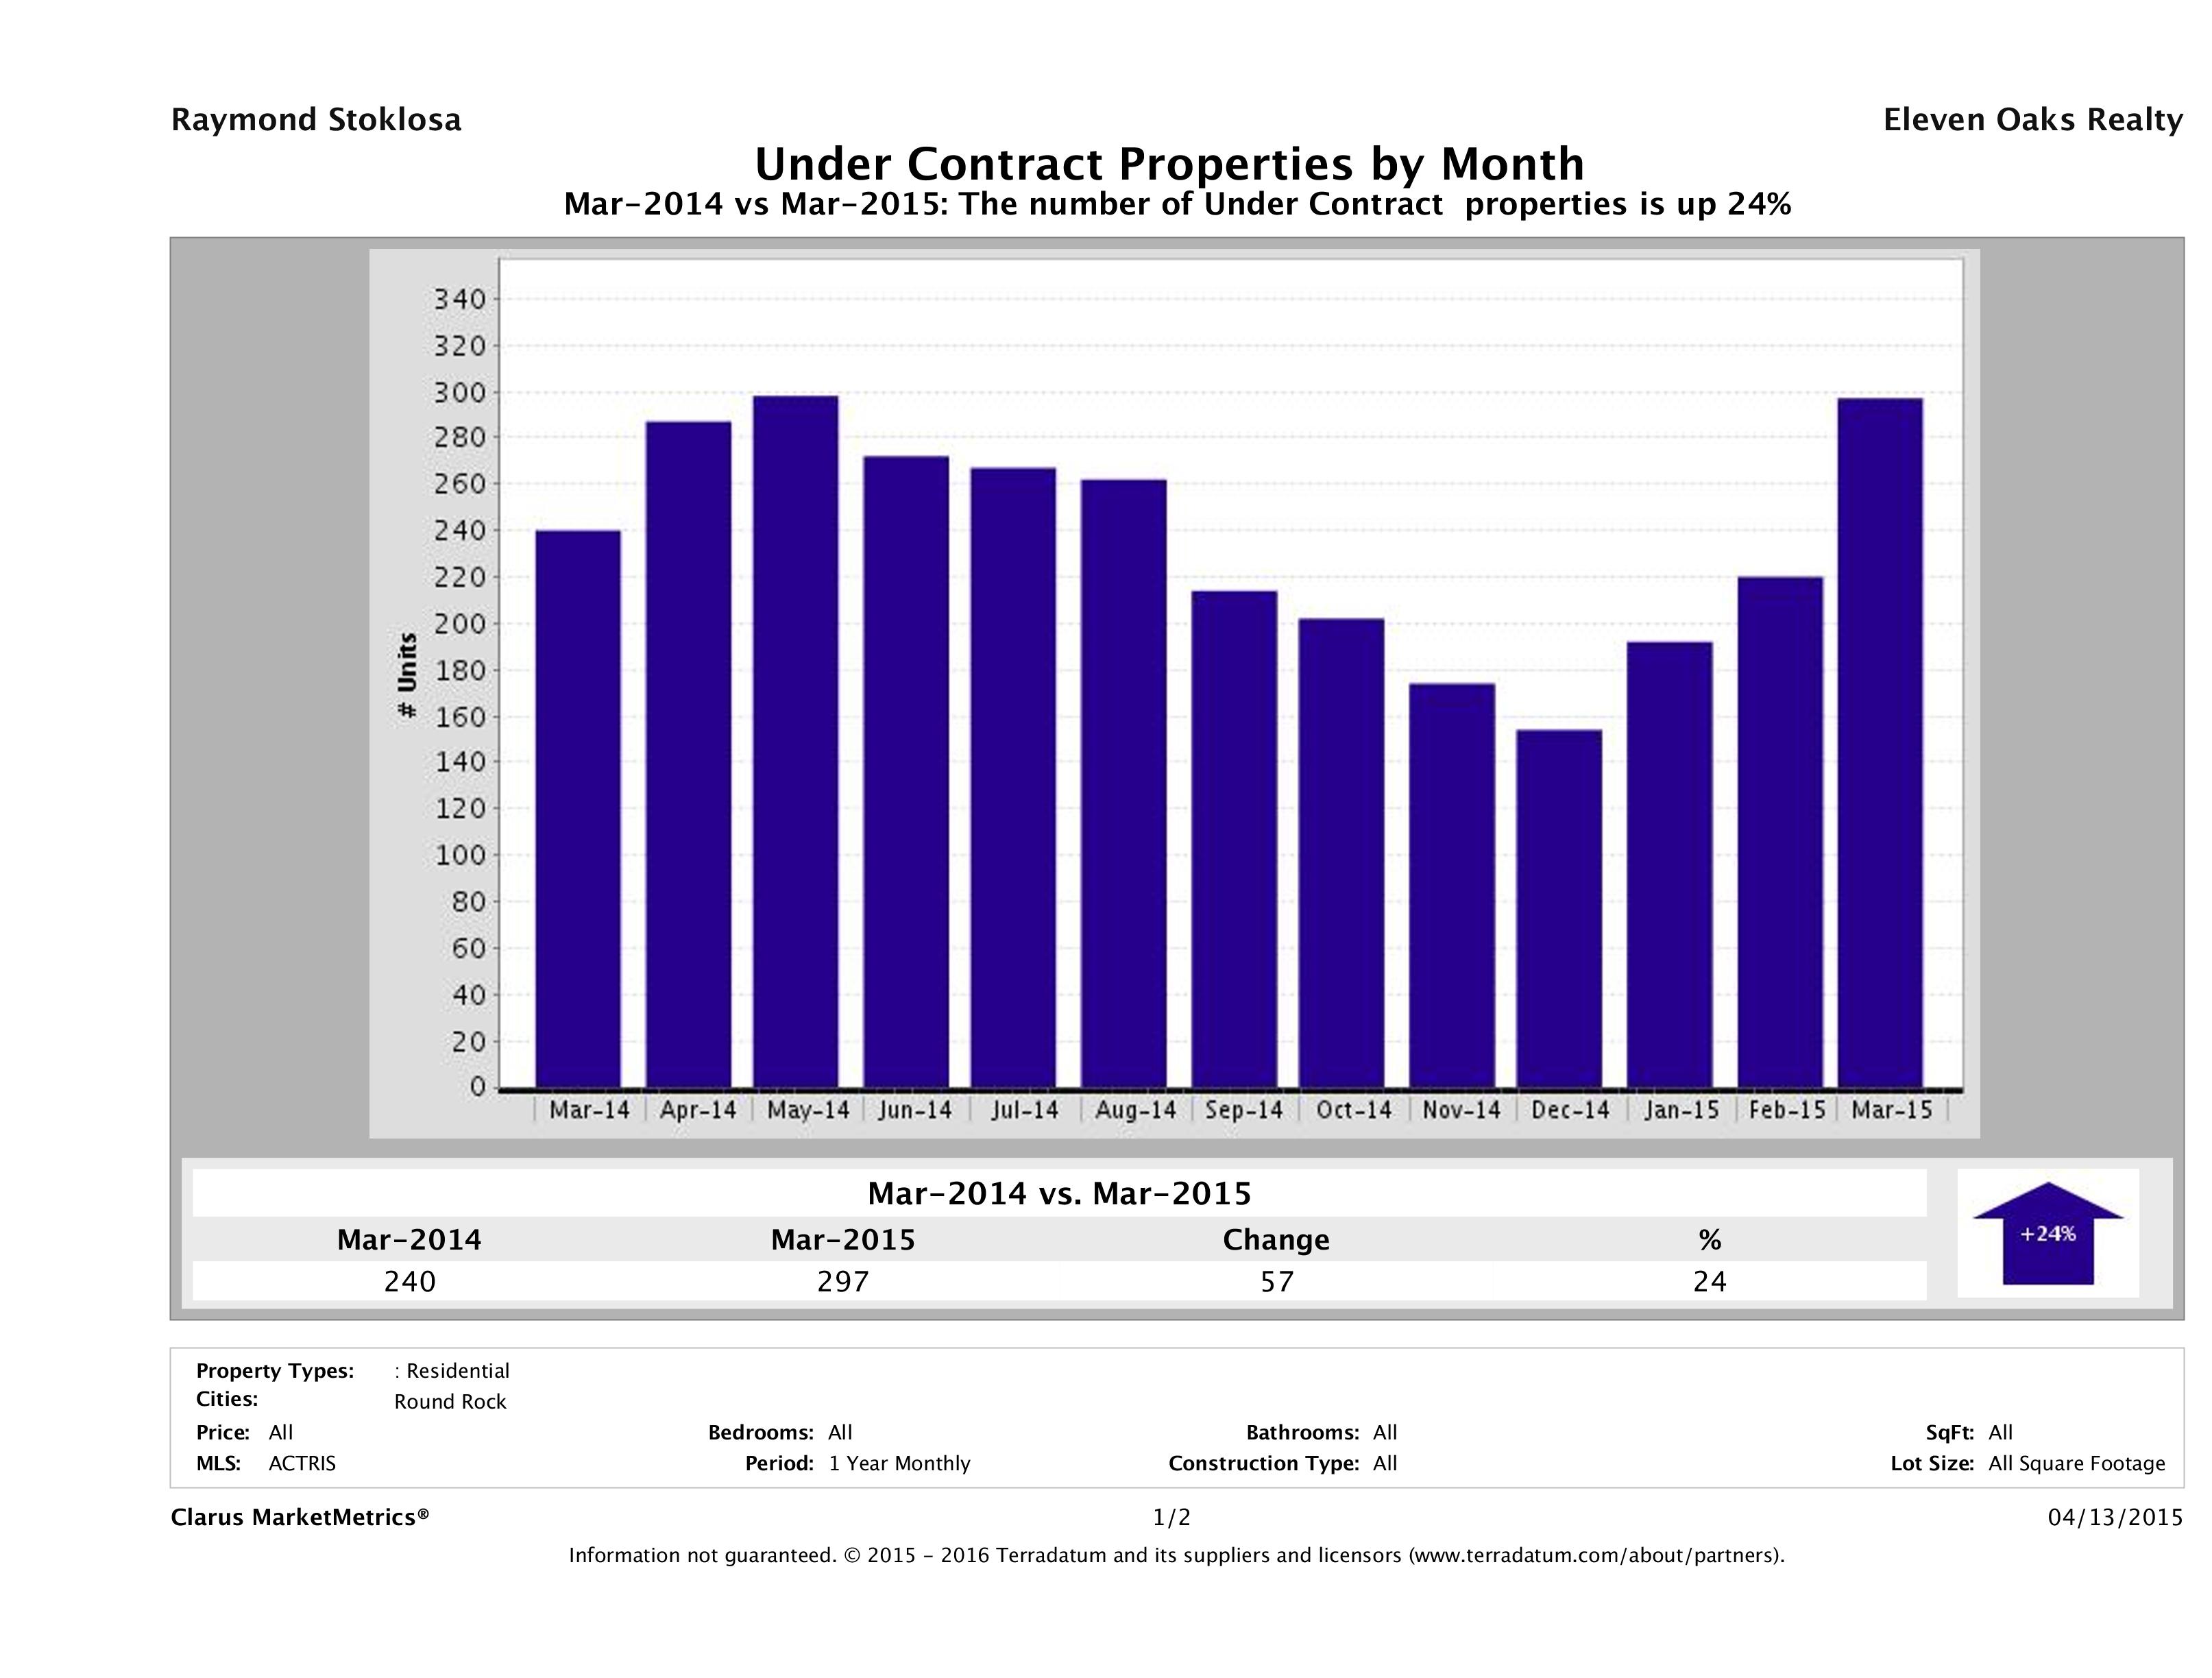
Round Rock Homes Under Contract Up 24%
In March 2015, 297 homes went pending (under contract) in Round Rock compared to 240 in March 2014, marking a 24% increase in year over year numbers. It seems more buyers are out this year than last year.
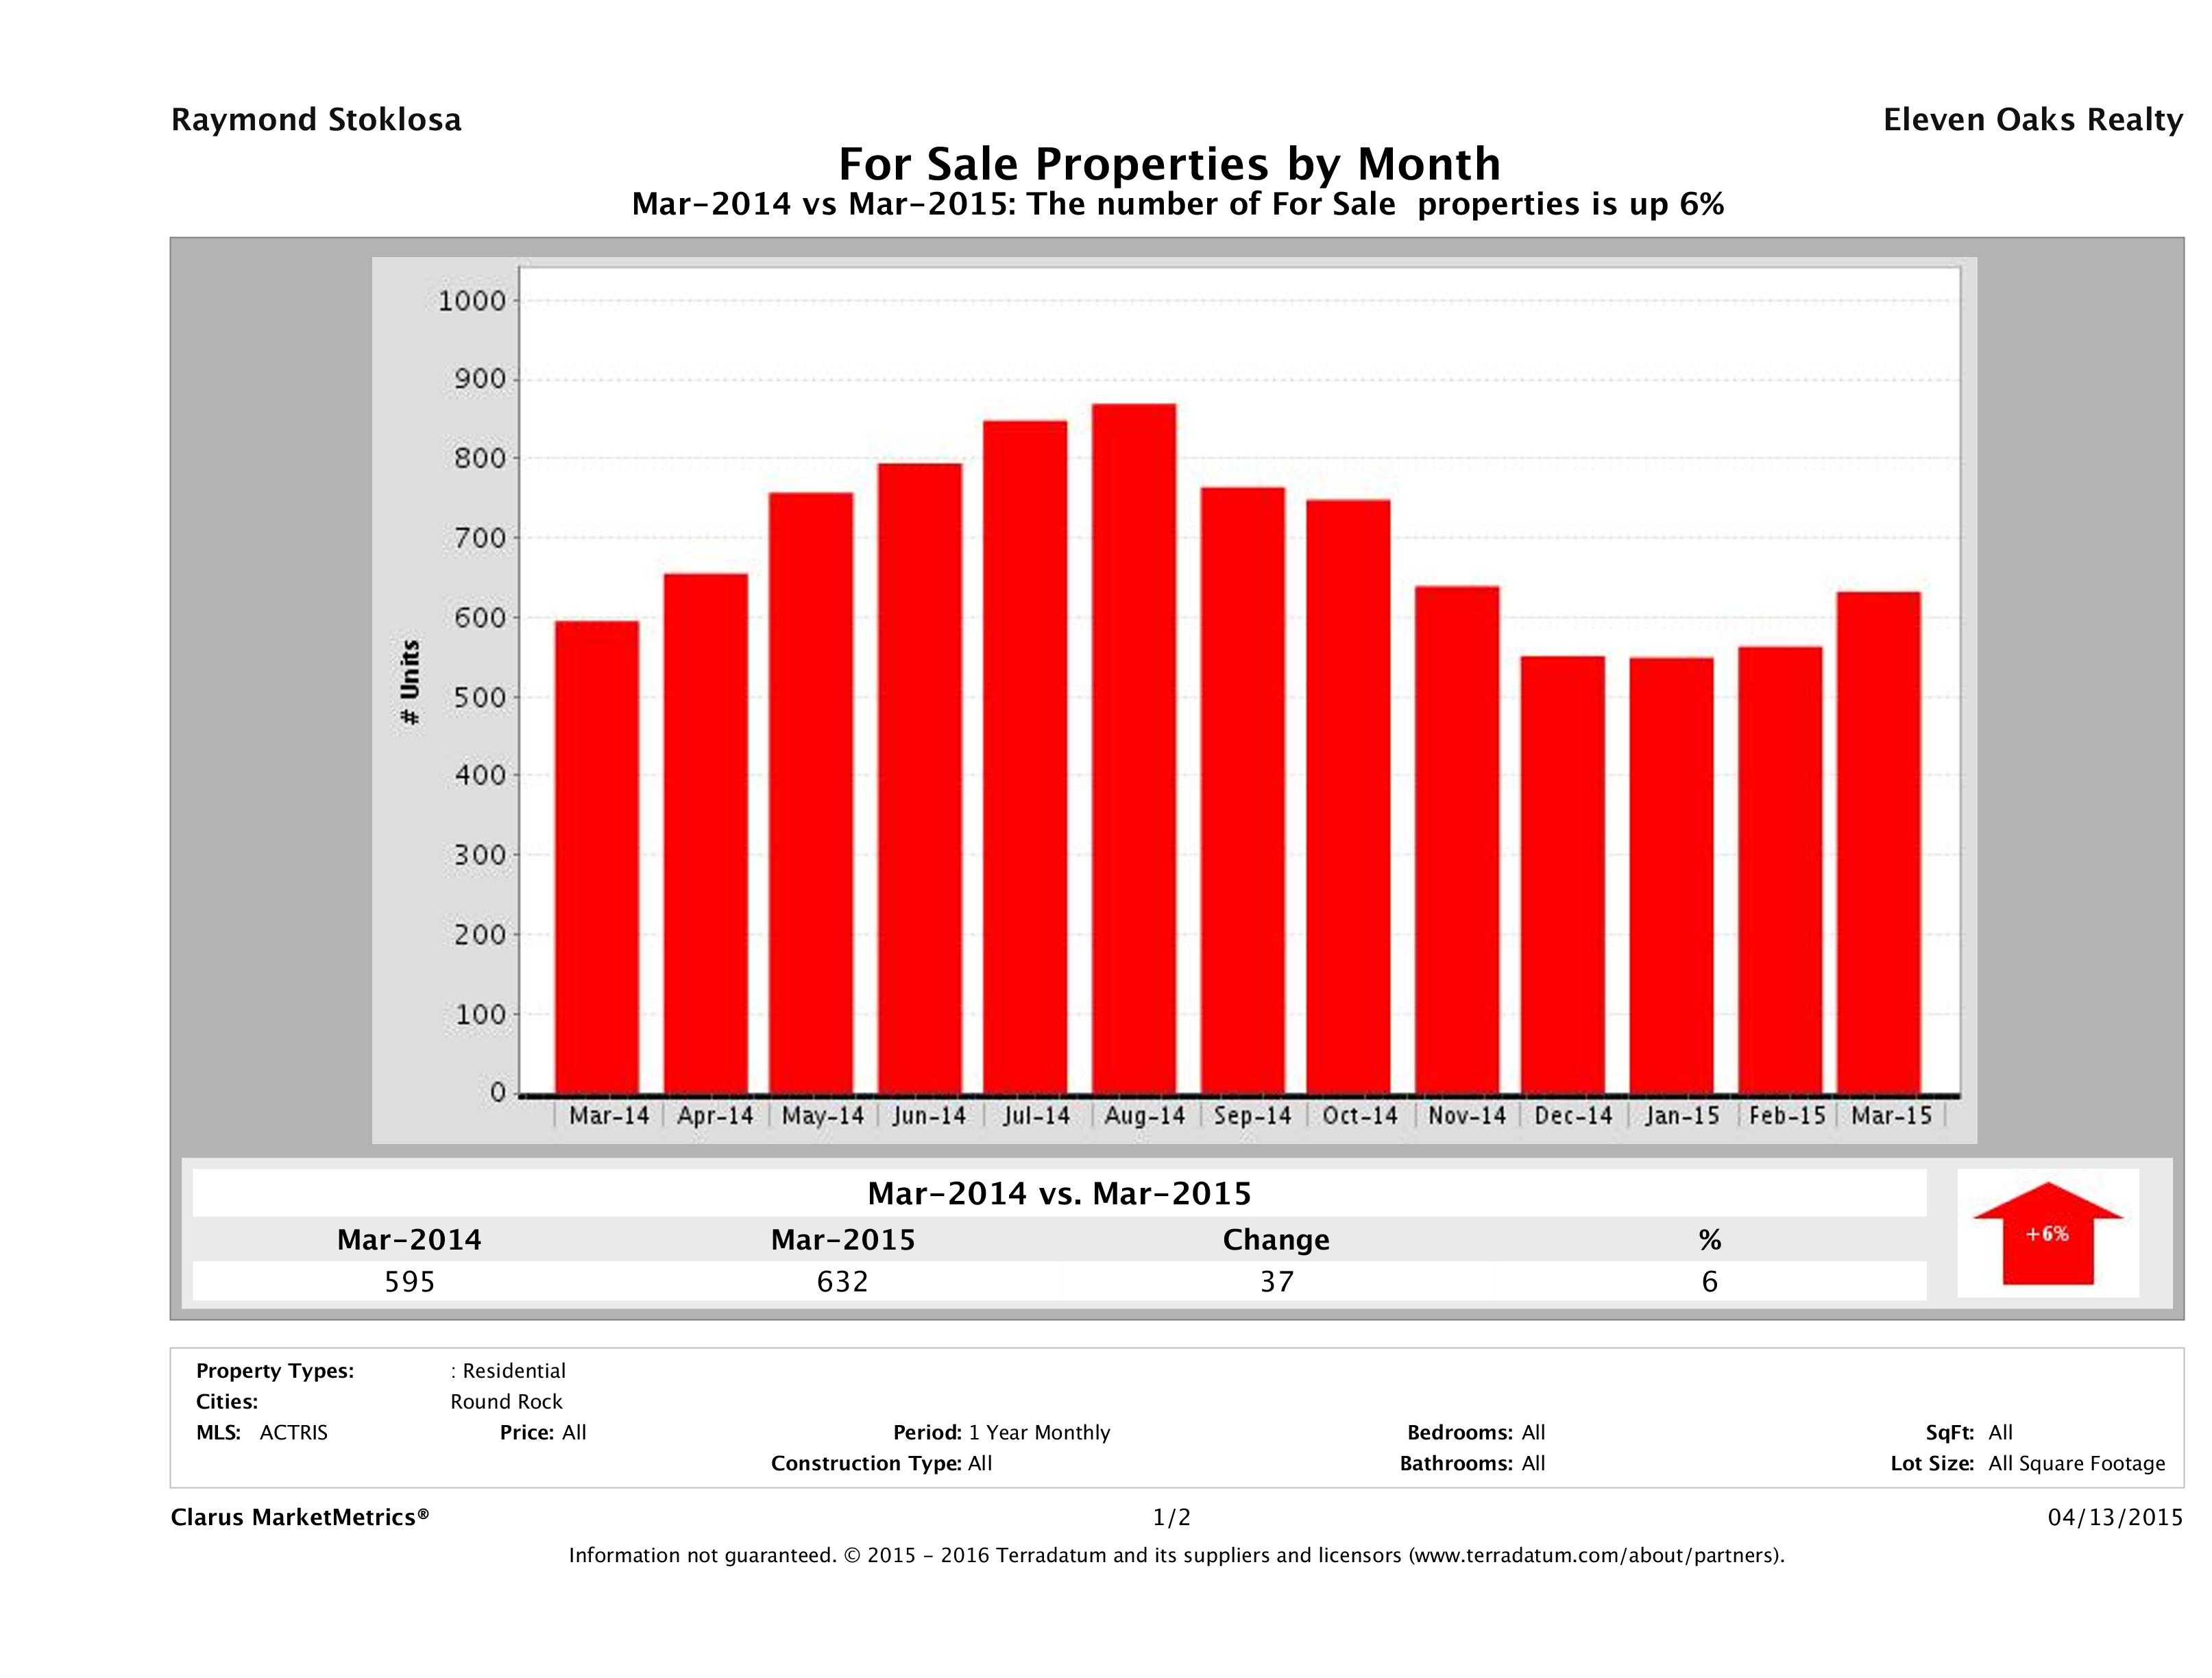
Number of Homes on the Market Up 6%
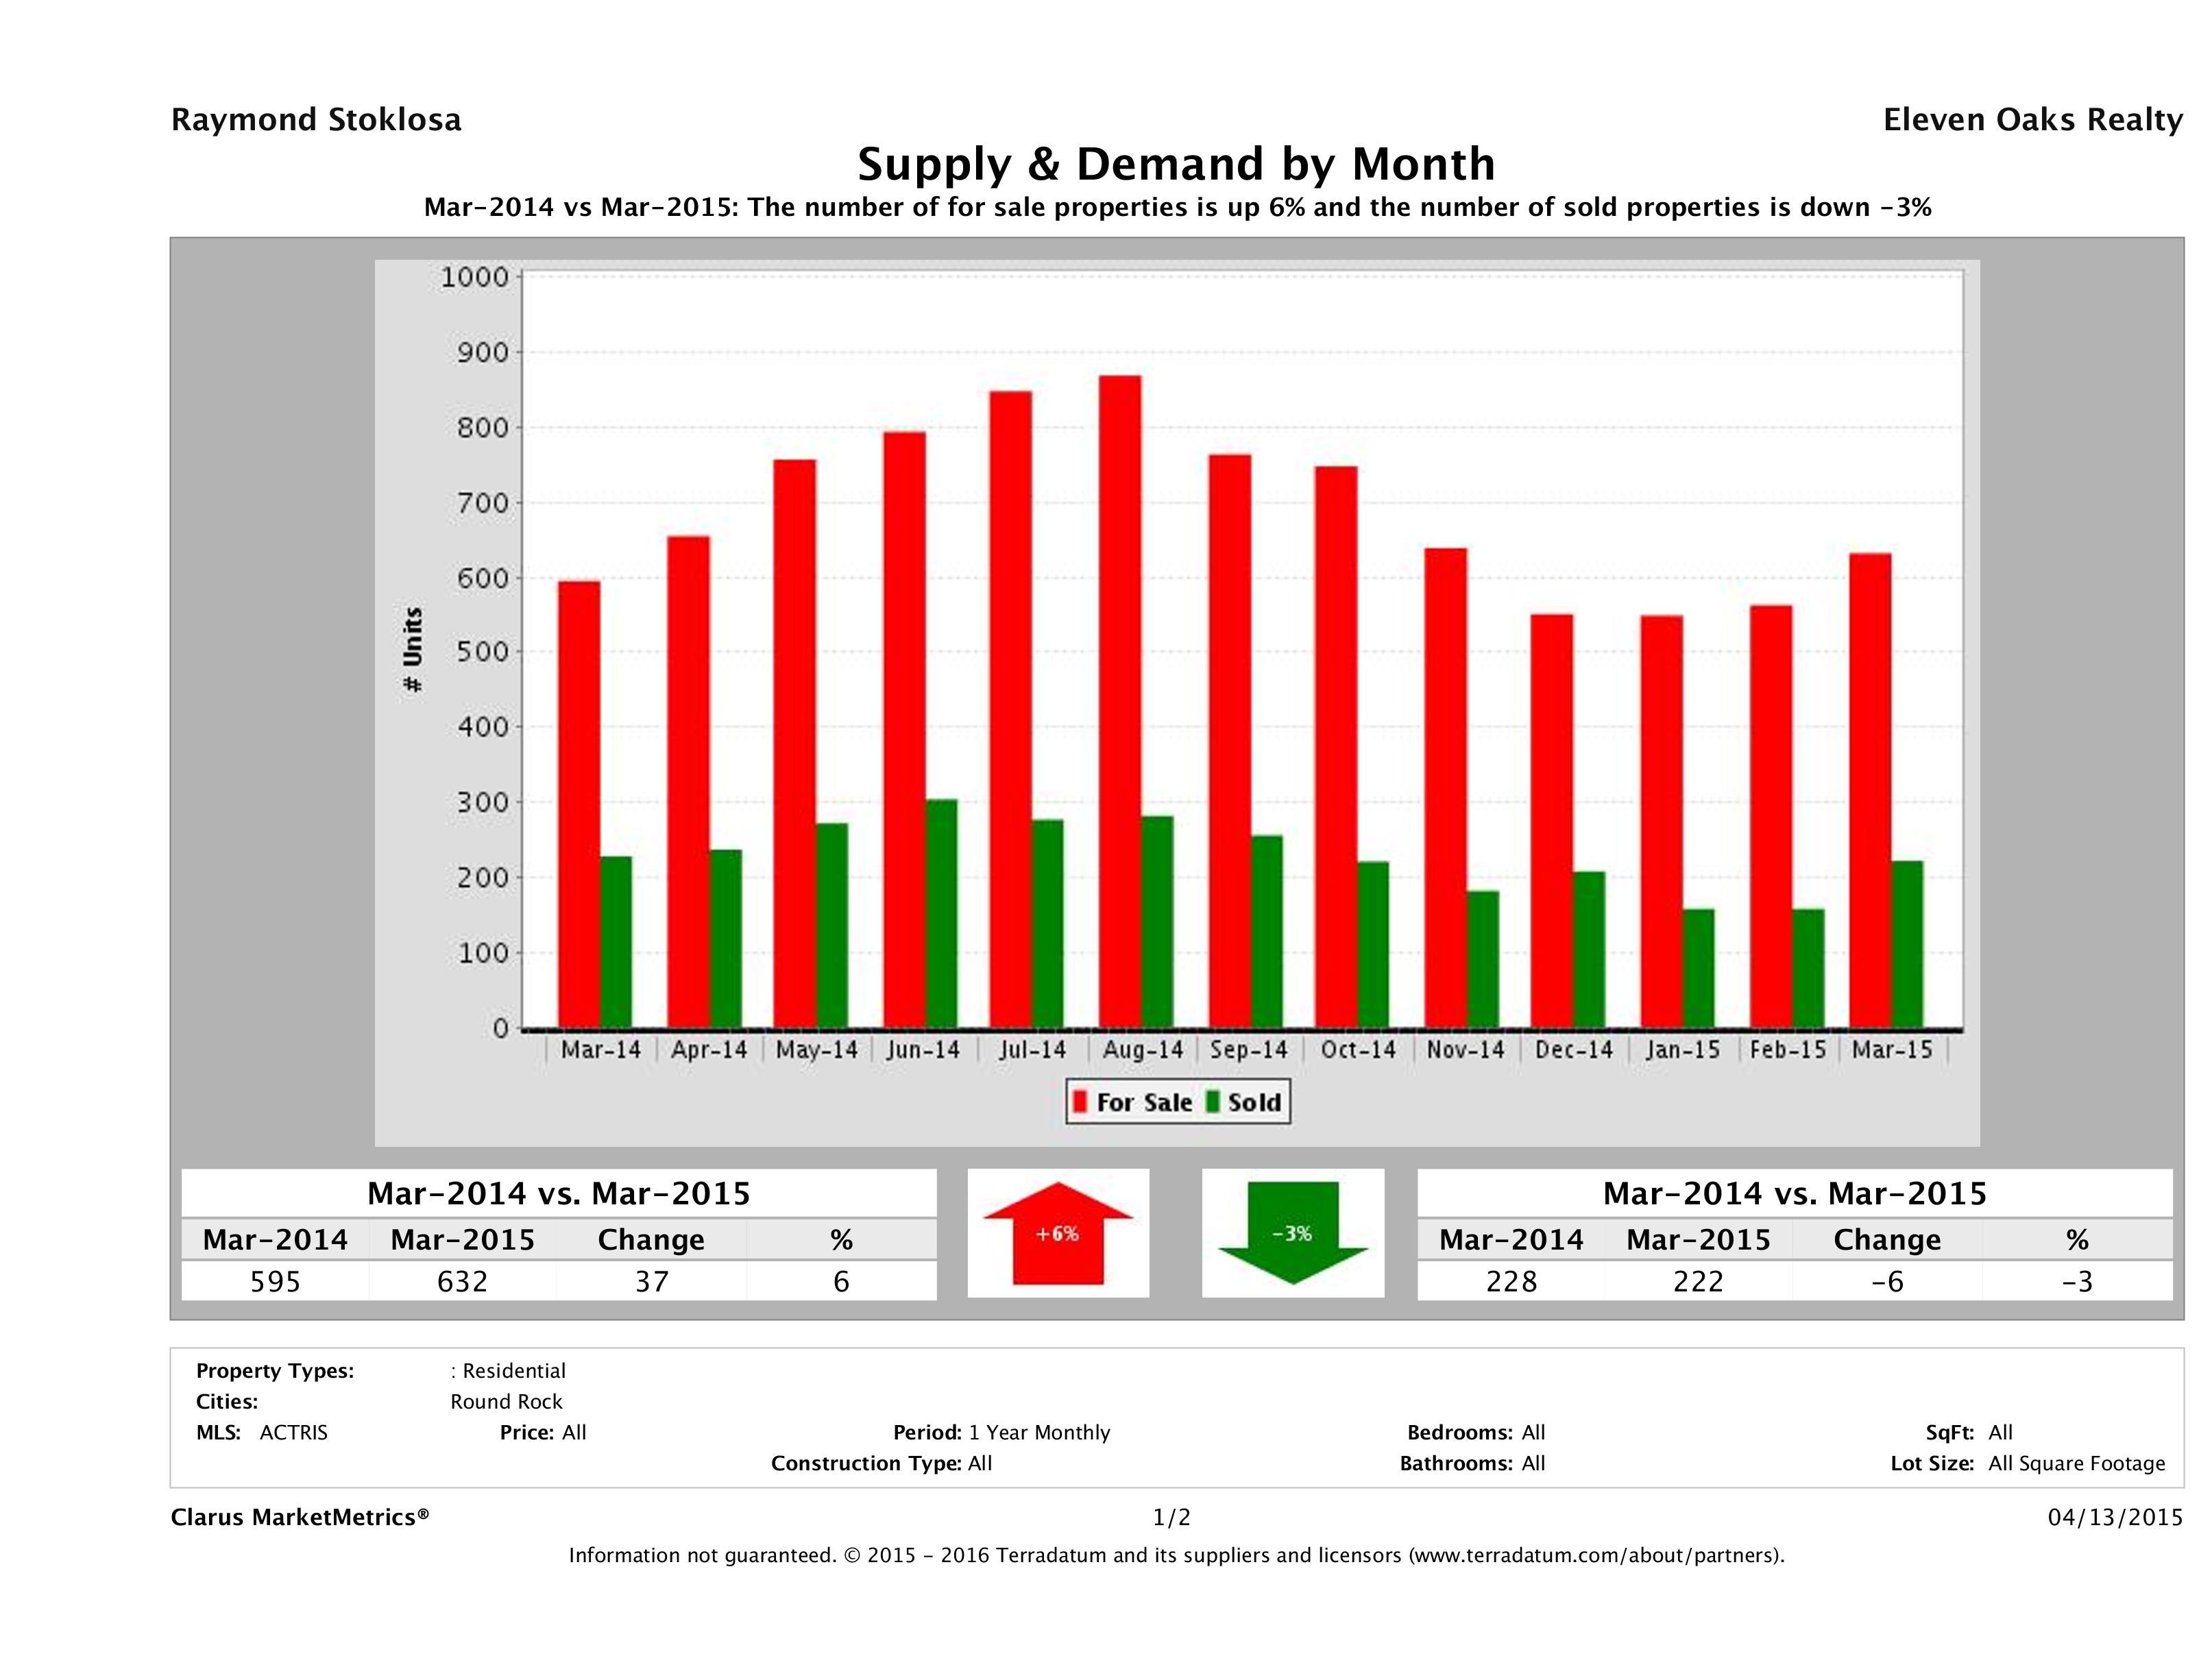
In March 2015, we had 632 homes for sale in Round Rock, compared to 595 in March 2014, showing a 6% (37 home) increase in year over year numbers.
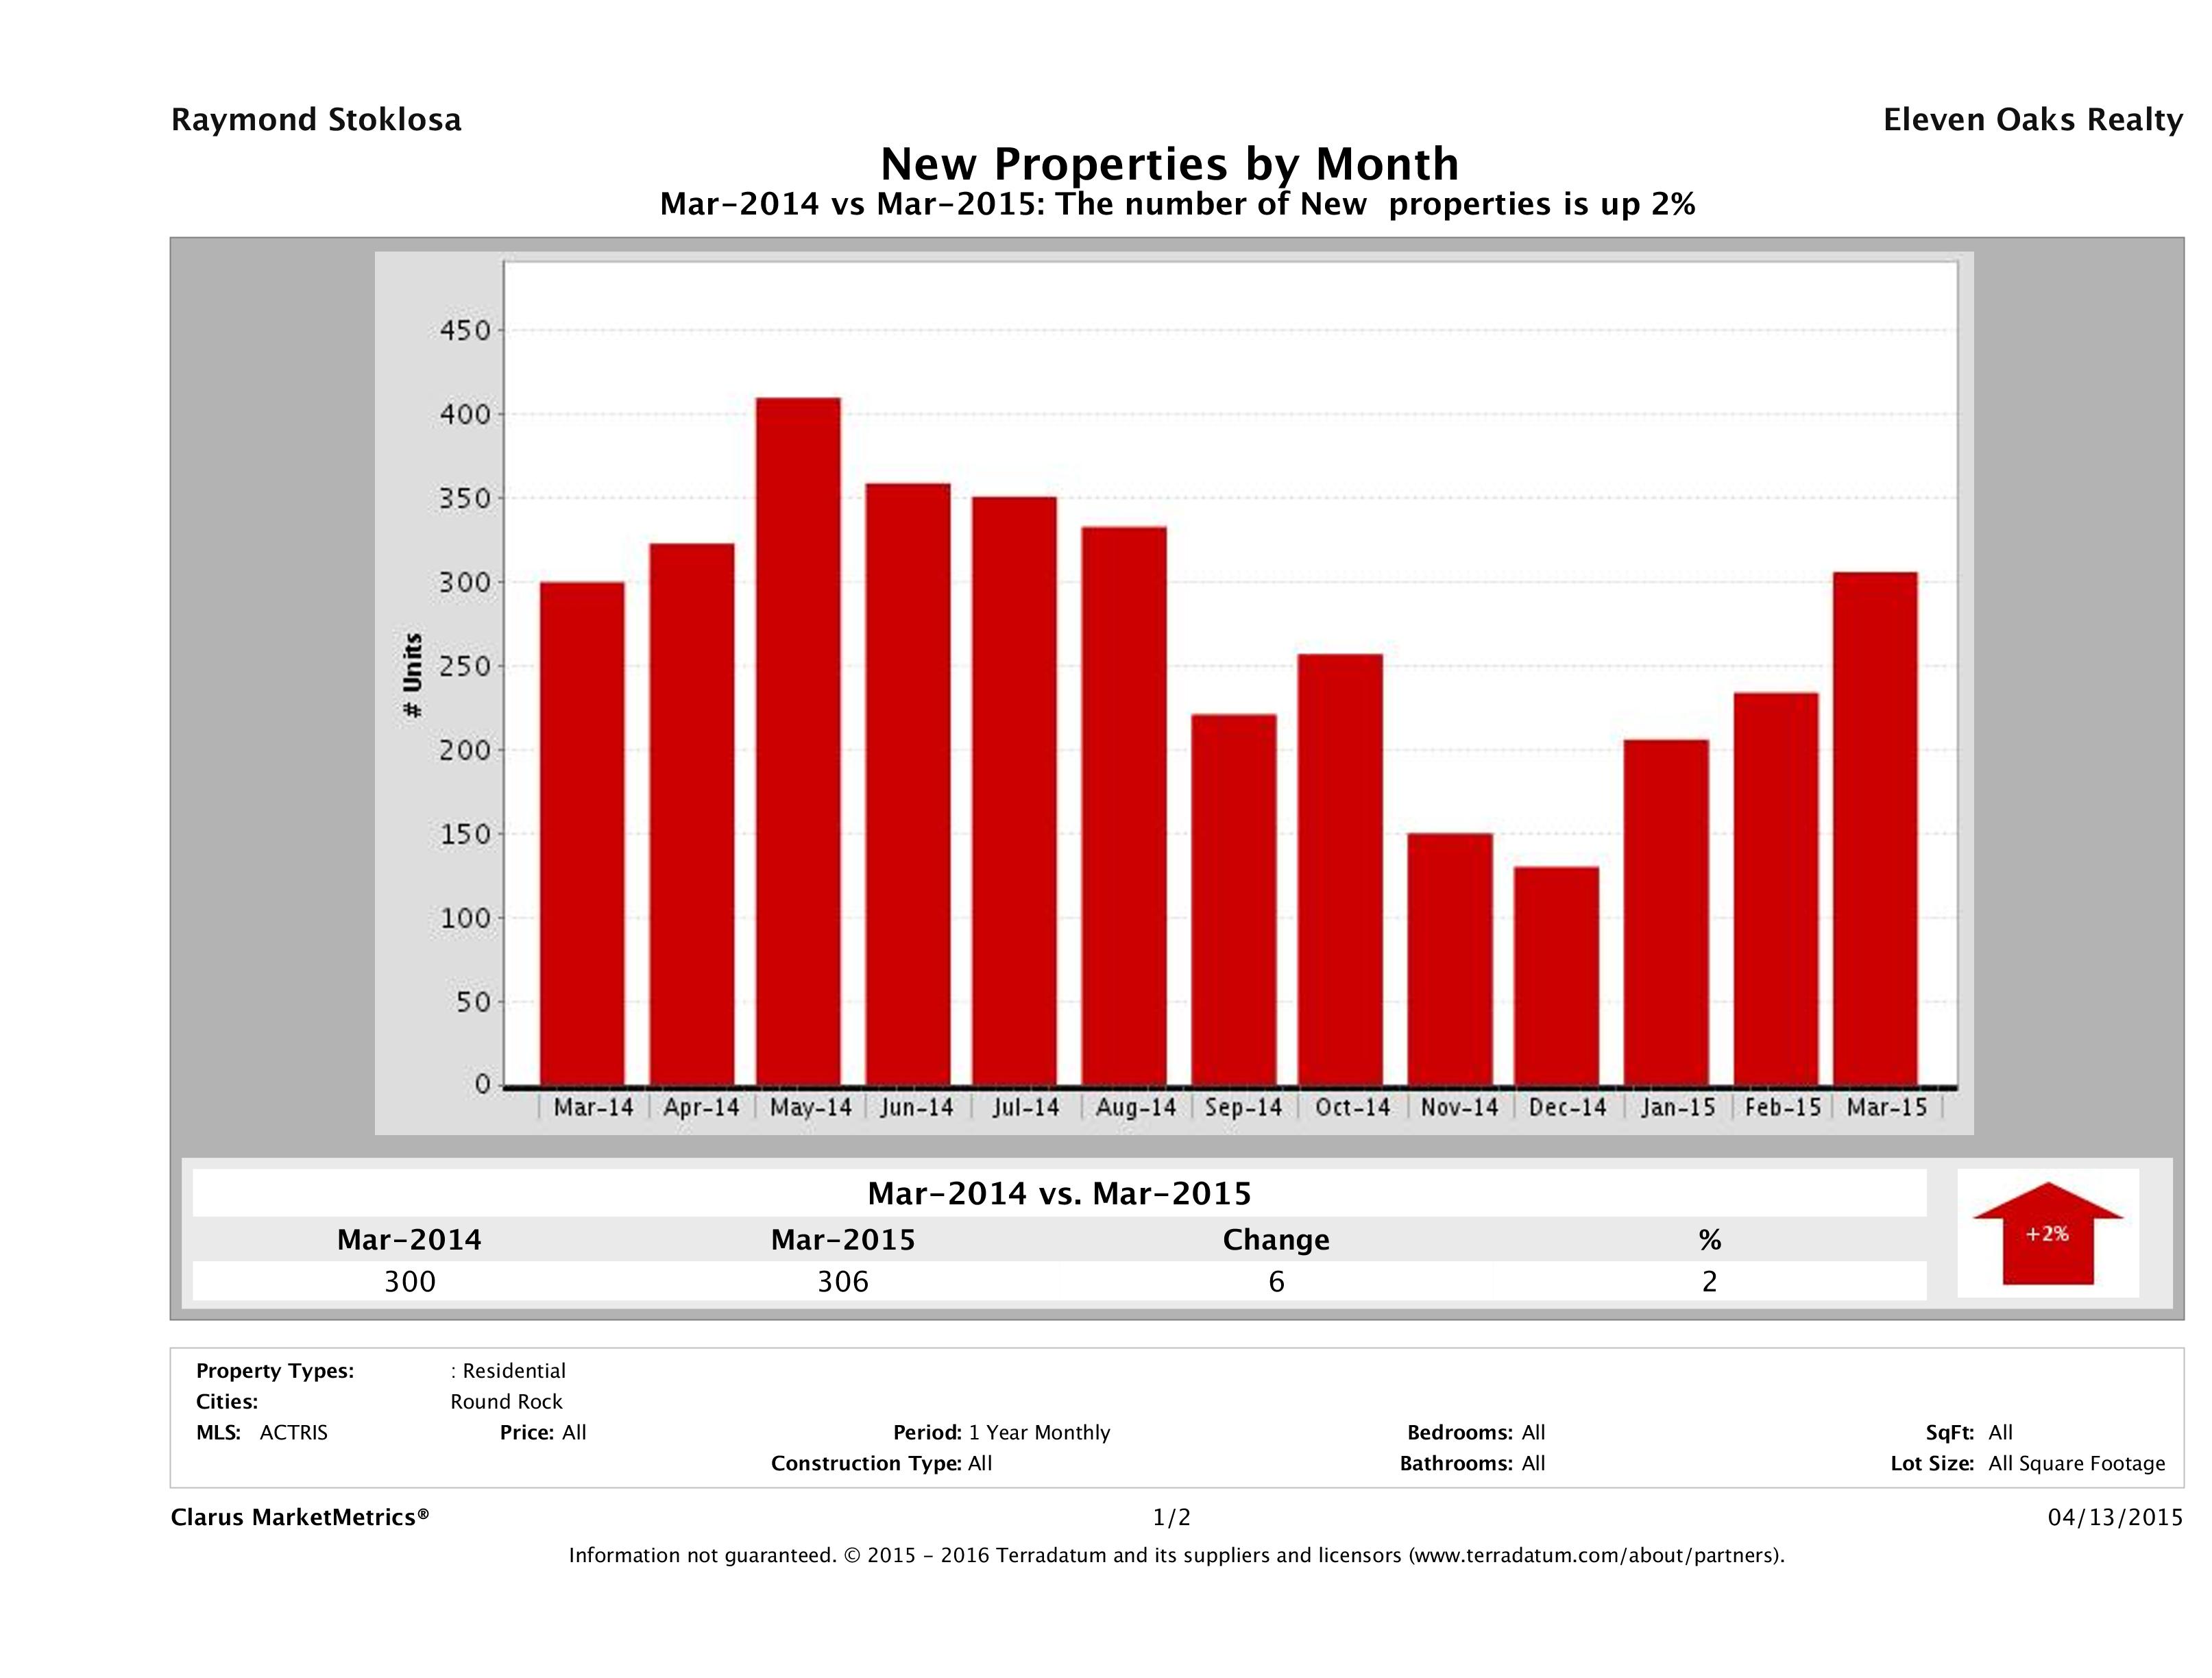
Number of Homes Listed for Sale Up 2%
In March 2015, we saw 306 homes introduced to the market compared to 300 in March 2014, marking a 2% (6 home) increase.
Supply Up 6% and Demand is Down 3%
This month we saw a 6% increase in supply (number of properties for sale) and a 3% decrease in demand (number of sold properties).
Median for Sale Up 9% vs Median Sold Price Up 13%
This chart compares the Median for Sale Price vs the Median Sold Price to show their relationship. In Round Rock, we saw a 9% increase in the median for sale price and a 13% increase in the median sold price of a single family home in year over year numbers. Sellers think their homes are worth more and buyers are willing to pay even more.
Source: Clarus Market Metrics, ACTRIS Sold Data
March 2015 Round Rock Real Estate Price Report – Strictly Numbers
For those of you who prefer to see the actual numbers, we’ve included the figures for March 2015 Round Rock home sales below. The most expensive home that sold in March 2015 sold for $830,000 and the least expensive home sold for $99,999. Homes ranged in size from 904 sqft – 5,340 sqft with an average size of 2,405 sqft. The average price per square foot for a home that sold in Round Rock in March 2015 was $111.03 with the lowest being $59.55/sqft and the highest being $187.11/sqft. It took, on average, 41 days to sell a home in Round Rock and sellers received, on average, 99.17% of their original list prices.
| Beds | Baths | SqFt | List Price | LP/SqFt | Sold Price | SP/SqFt | SP/LP | SP/OLP | ADOM | |
|---|---|---|---|---|---|---|---|---|---|---|
| Min | 2 | 1 | 904 | $103,900 | $58.99 | $99,999 | $59.55 | 85.07% | 85.07% | 0 |
| Max | 6 | 5 | 5,340 | $830,000 | $193.91 | $830,000 | $187.11 | 111.83% | 111.83% | 404 |
| Avg | 4 | 3 | 2,405 | $265,796 | $111.73 | $263,738 | $111.03 | 99.49% | 99.17% | 41 |
| Median | 3 | 3 | 2,270 | $245,000 | $111.41 | $244,990 | $111.29 | 100.00% | 100.00% | 9 |
| Search Criteria | |||
|---|---|---|---|
| Status | Sold | Sold Date | March 2015 |
| Property Type | Single Family Homes | Number Sold | 224 |
| Source: | ABoR Sales Data | Area | Round Rock |
Time to Buy? Sell?
As we always say, the best time to buy or sell a home is when you need to buy or sell. If you have a house to buy, buying when its a sellers market may hurt you on the buying end, but you’ll make it up on the selling end. If you’re trying to get into the market for the first time, the only way you’ll know that we’ve “hit bottom” is when its in the rear view mirror. Work with professionals who can help you analyze your financial and lifestyle to determine if now is the right time to buy or sell.
Looking strictly at the numbers, it appears the recommendation for this month is – it’s time to sell. With 1.0 months of inventory and 24% more homes accepting a contract, sellers who position their homes as a value will have no trouble finding a buyer. And, with the median sold price up 13% from last year, we know the buyers that are currently in the market are willing to pay significantly more for a home this year than last year. If you’re considering selling, work with a Realtor who can help you get top dollar for your home. Check out our 88 Ways to Sell Your Home Faster and For More Money for some tips on how you can prepare your home to meet the market. The busiest time of year is just around the corner. Do what you can to prepare your home now and you’ll be ready at the perfect time. For more info about our Home Selling Program, check out Sell My Round Rock Home.
If you’re a buyer who is ready to buy, work with a professional Realtor who has strategies for getting your offers accepted – and strategies that don’t necessarily mean more money. The earlier you can start the home buying process, the less you’ll pay. We expect demand and prices to increase as we head deeper into Spring. If you’re looking to buy, we can help you find the right house in the right neighborhood for you and your family. We know the market and know how to make the process as stress free as possible. For more info about buying a home, visit Buy a Home in Round Rock.
Questions About the Round Rock Real Estate Price Report?
Do you have questions about this Round Rock Real Estate Price Report? Call us at (512) 827-8323 or email us at info@11OaksRealty.com and we’ll help you in any way we can. If you’re looking to buy or sell Round Rock real estate, don’t forget to check out our Buyer Resources and our Seller Resources for more tips.
Leave a Reply