Eleven Oaks Realty is proud to present their October 2013 Austin Real Estate Price Report measuring activity in the Austin single family home market.
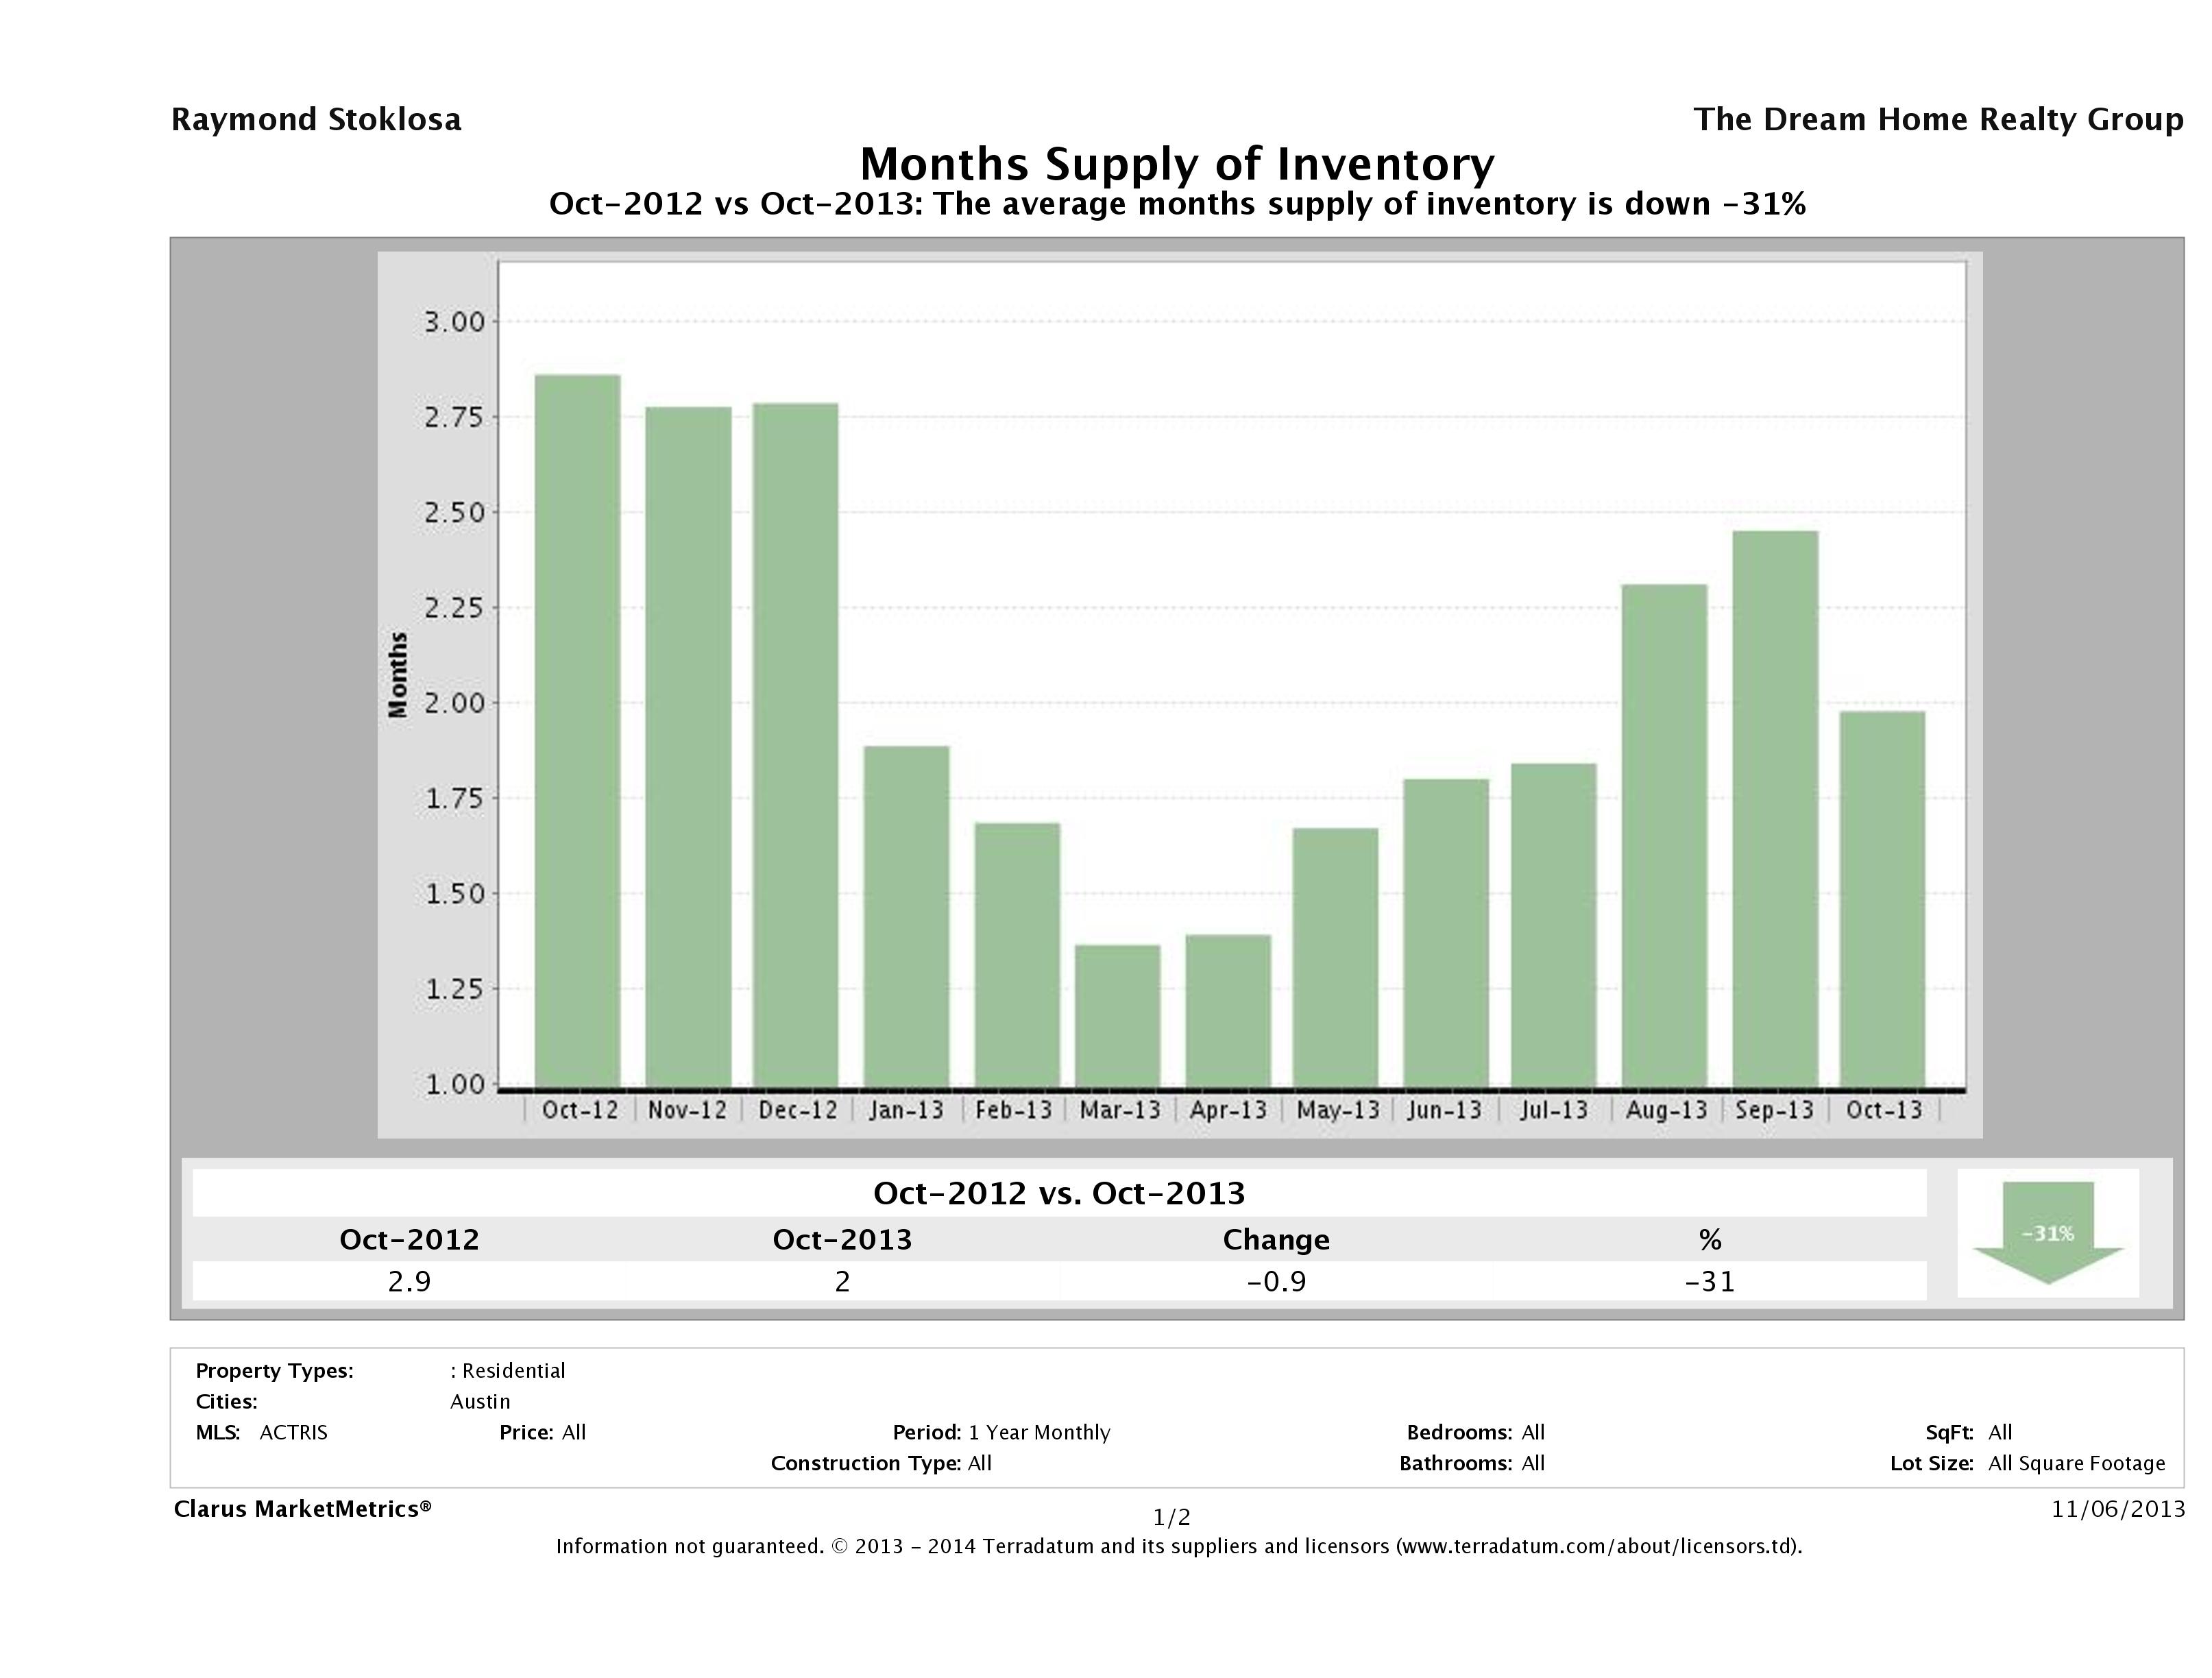
Austin Housing Inventory Down 31%
Once again we have the same lead story for this month’s Austin Real Estate Price Report, low inventory. In October 2013, we saw a 31% decrease in the months supply of inventory in year over year numbers. This has been the same story we’ve reported for months and months and it doesn’t seem like it’s slowing down. In October 2012, we had a 2.9 months supply of inventory on the market city wide compared to 2 months in October 2013. Back in October 2012, we were reporting low inventory, but it seems 2013 brought even lower figures. This month we saw a drop from September 2013 9 month highs back down to near July 2013 numbers. It seems buyers took their usual break in August to get the kids back to school, but came back full force.
What does this mean to buyers? Make home buying a priority, get out to see homes as soon as you can and don’t wait too long to make a decision. The best homes are selling fast, but they aren’t selling at thousands over list price like we saw earlier this year. Winter is the best time to get a good deal on a home in Austin. Sellers who have their homes on the market during the Holidays are motivated to sell it. Take advantage of the historically low interest rates and get into something before the busy Spring market, when prices usually go up.
What does this mean to sellers? If you need to sell, take advantage of the low inventory and get your home on the market now. Buyers are still out in strong numbers and though we usually see a slow down of market activity during November and December, serious buyers are still looking. If you don’t need to sell now, hold on for a few more months and take advantage of the seasonal Spring uptick we usually see. More buyers in the market usually translates to higher prices for sellers.
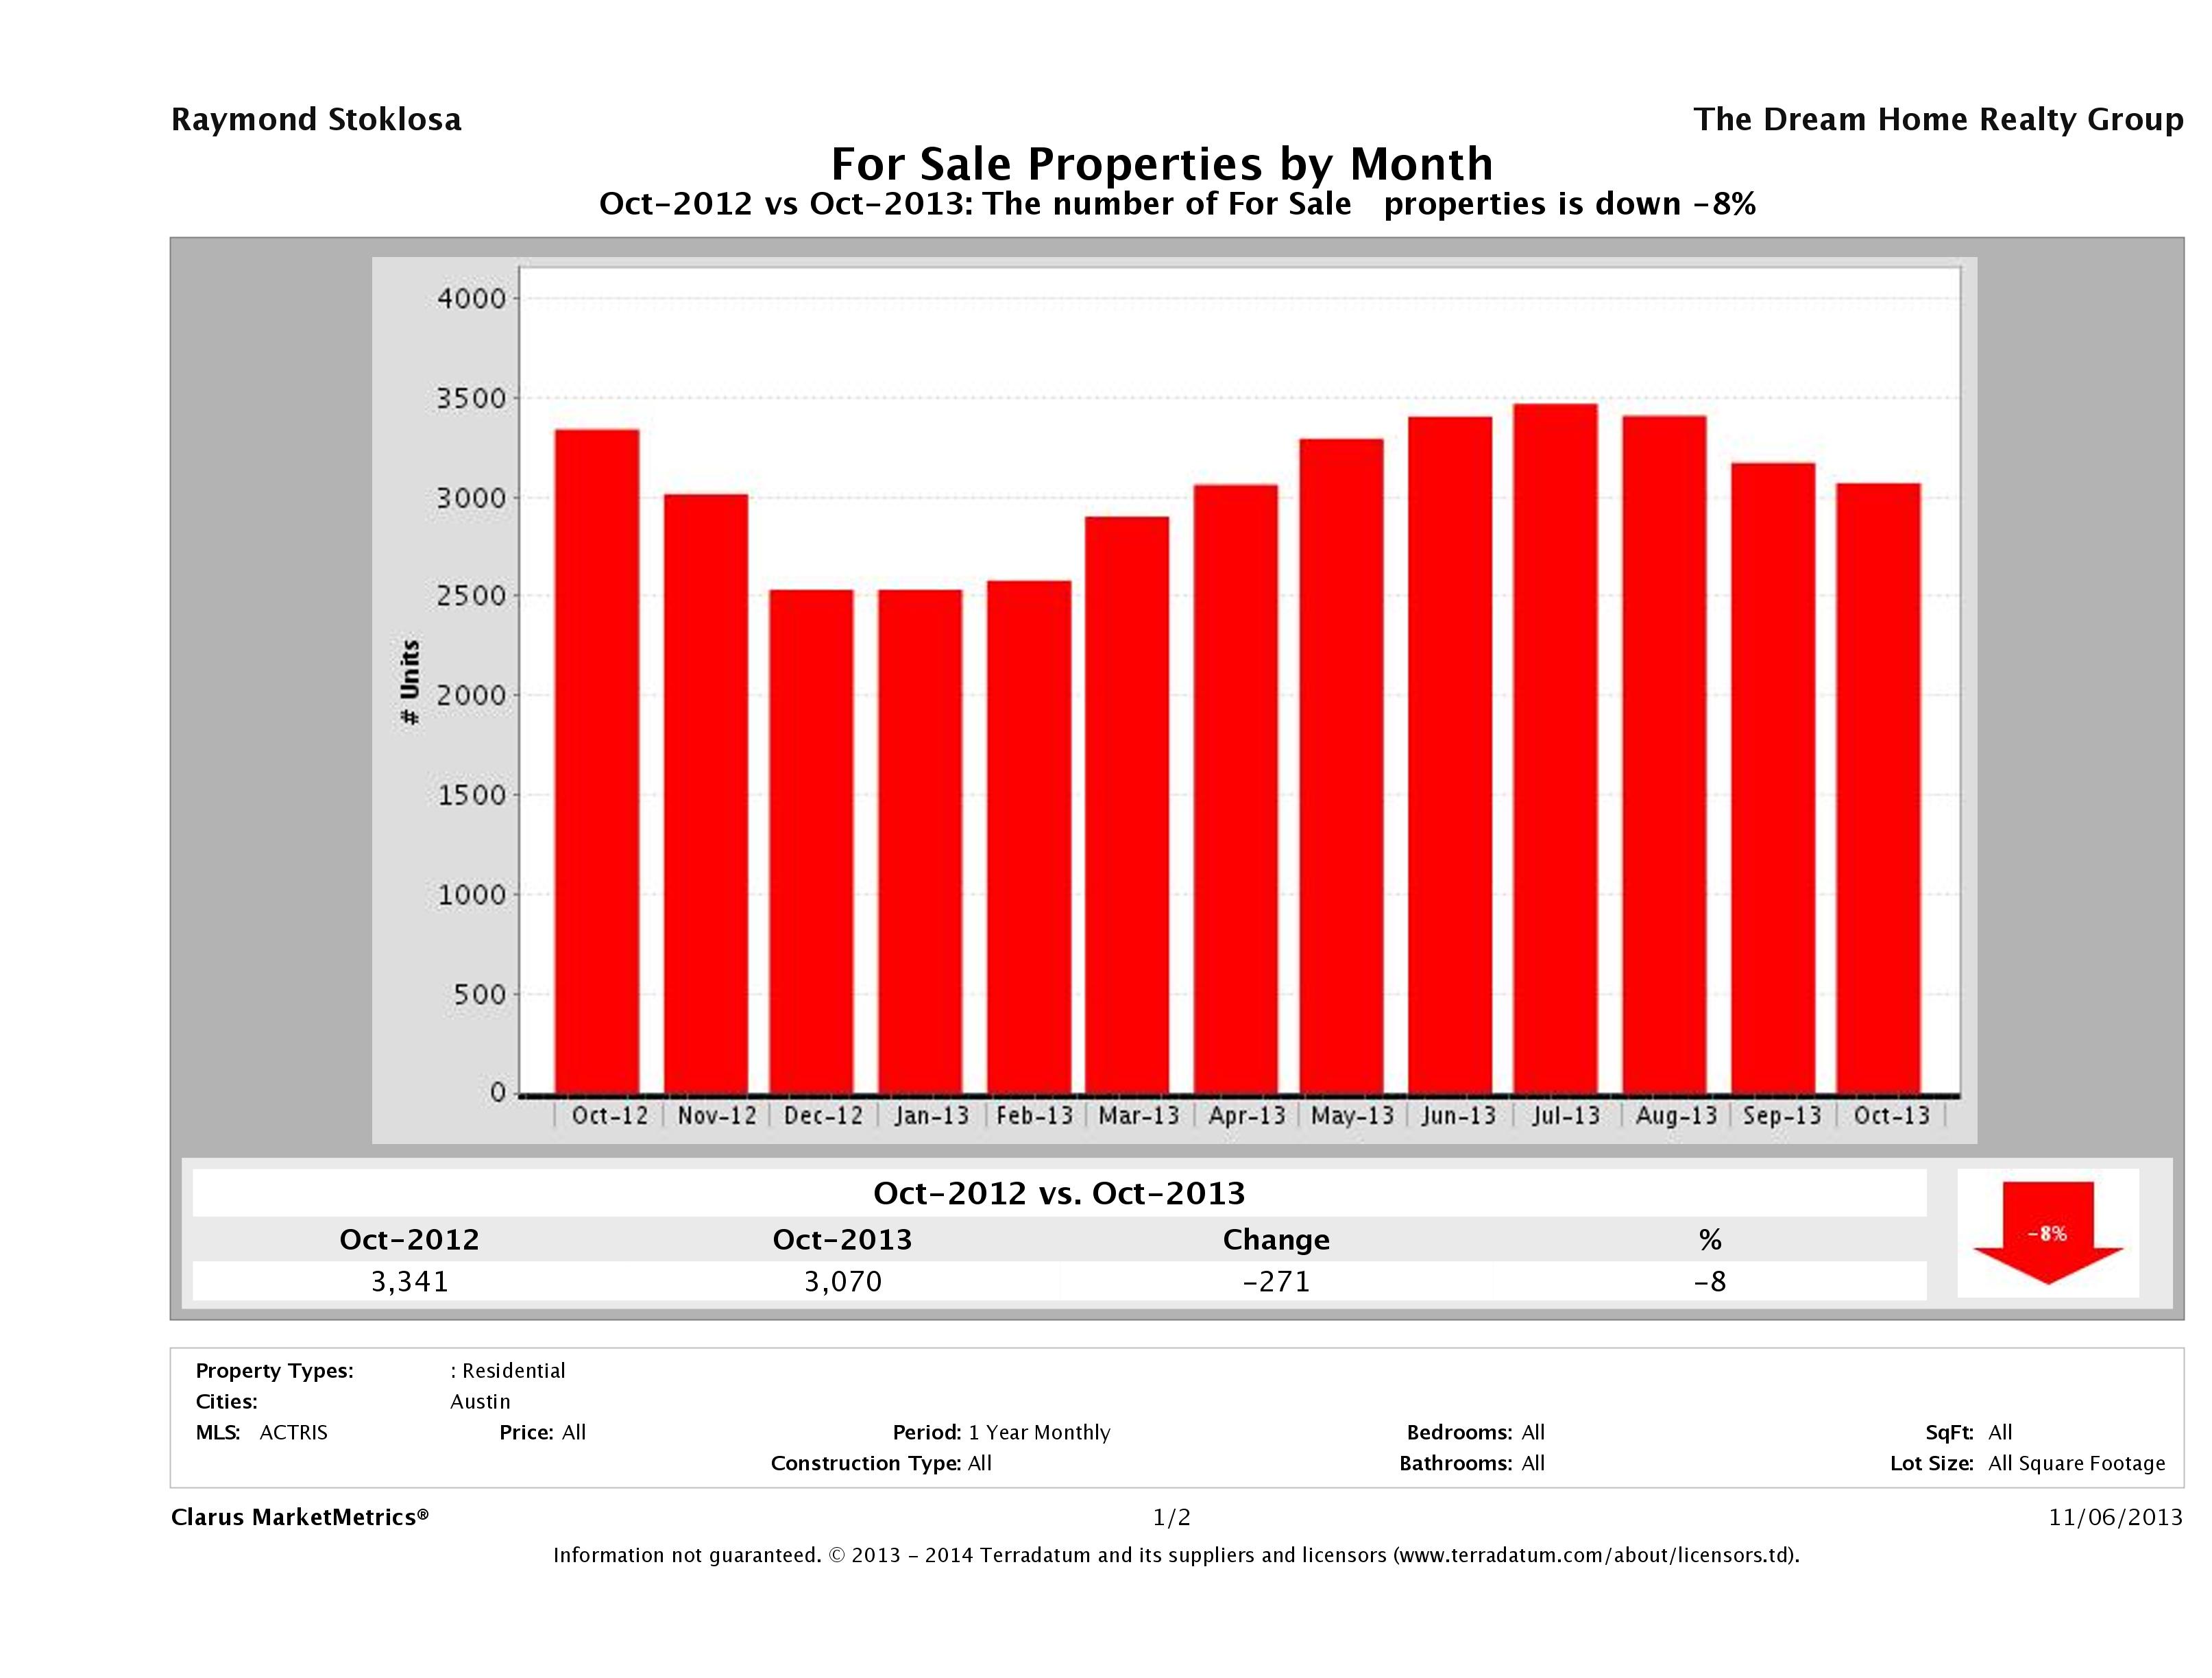
8% Fewer Homes on the Market than October 2012
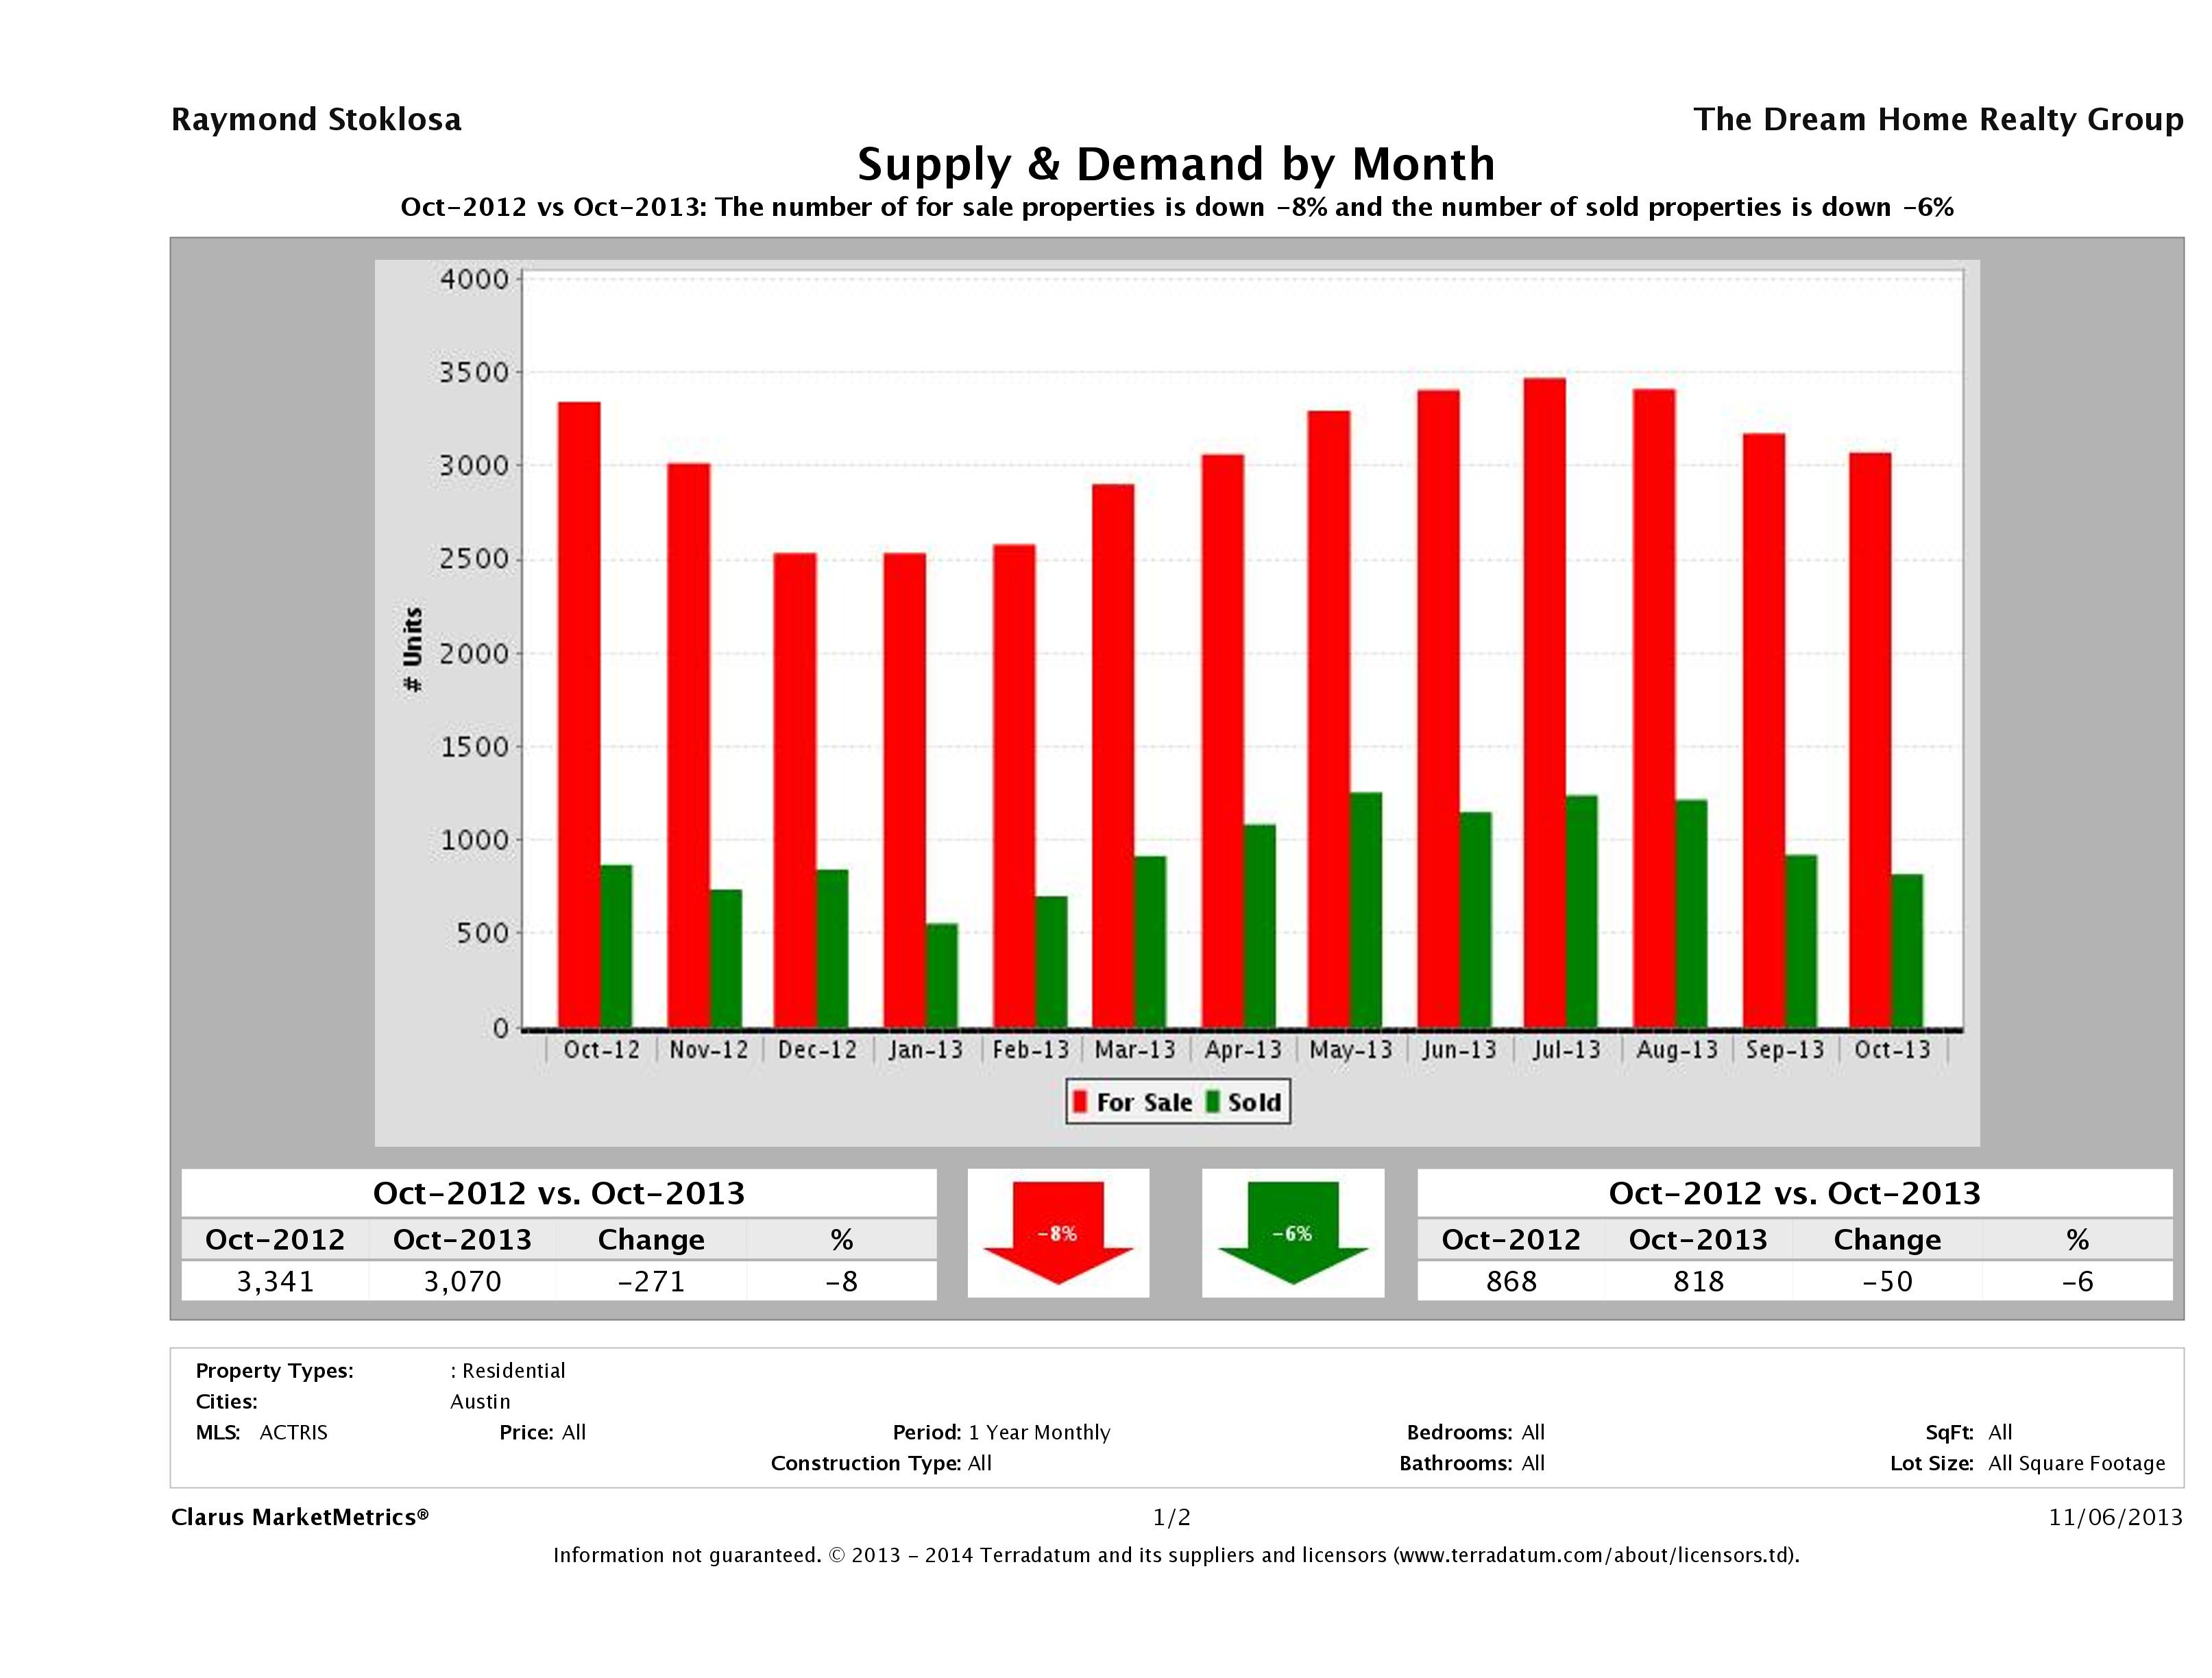
In October 2013, we had 3,072 homes for sale in Austin, compared to 3,341 in October 2012. Though 9% is no record setting figure, it still shows buyers are in the market and are buying homes.
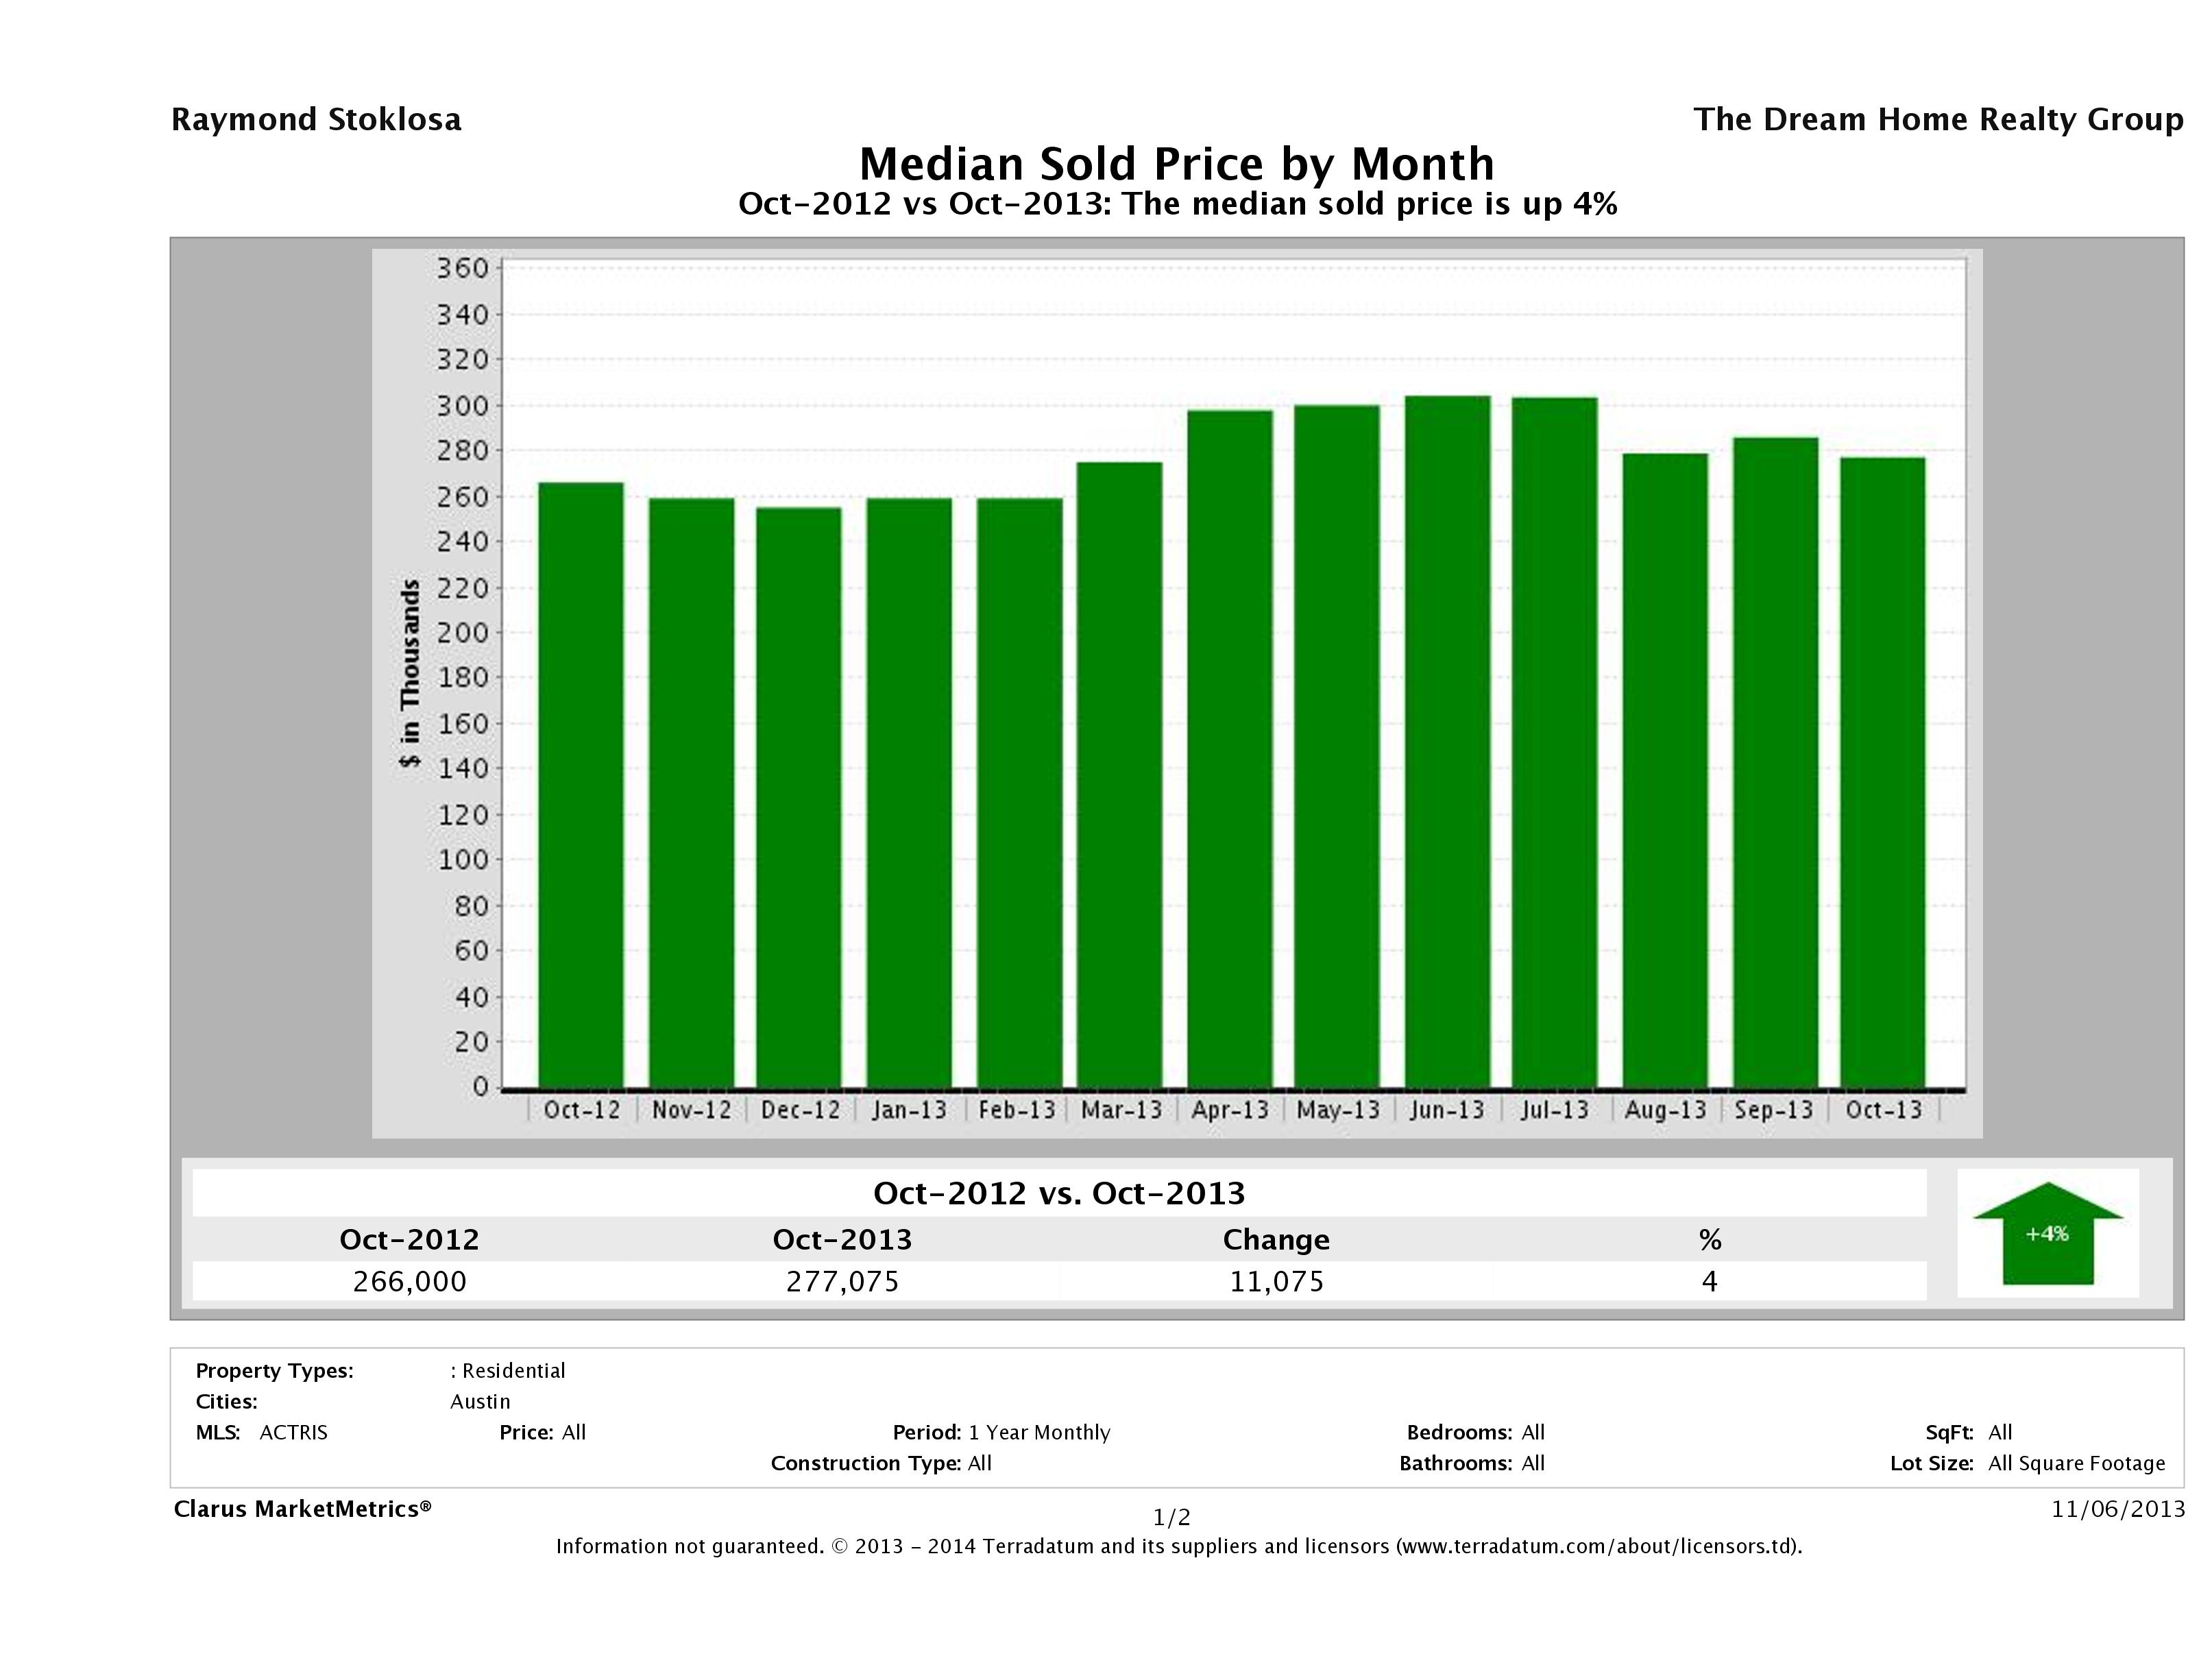
Austin Median Home Price Up 4%
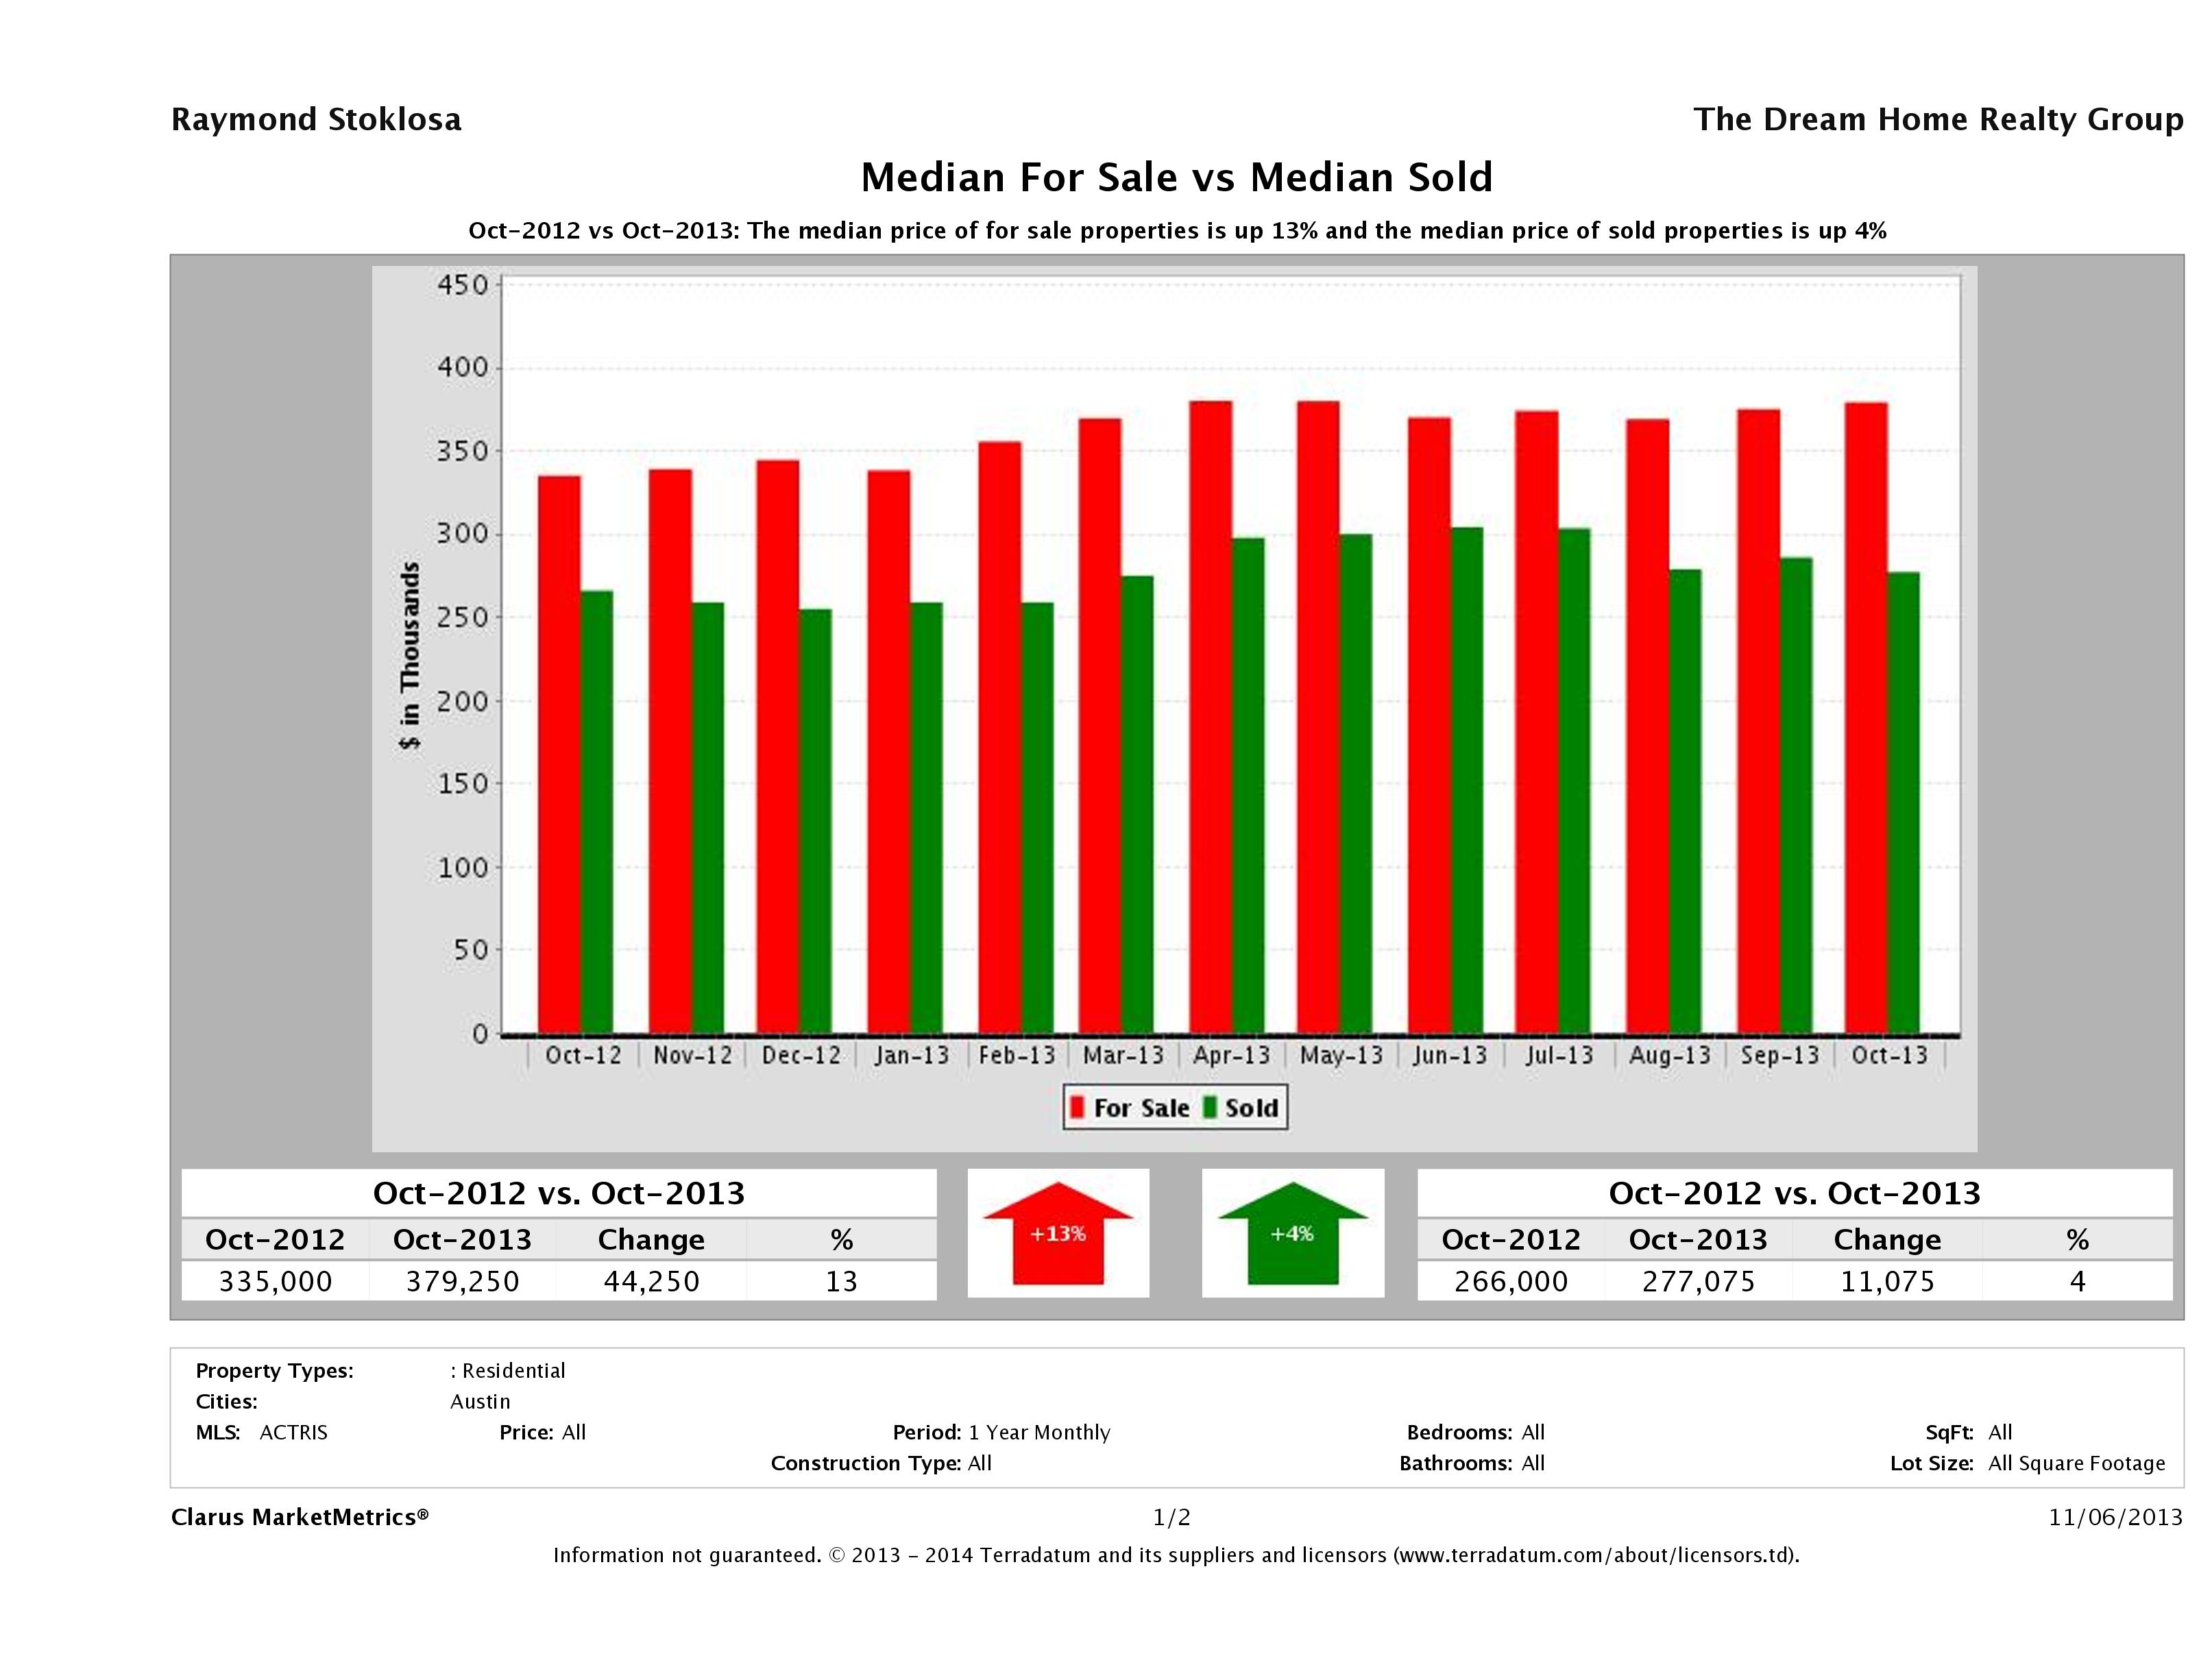
This month, we saw a 4% increase in the median home sale price of a home in Austin. In October 2013, the median home price was $277,075 compared to $266,000 in October 2012. Median home price helps us see the distribution of homes being sold and does not really give us an indication of the increase or decrease in a particular home’s market value. To analyze market value, we’d have to take an in depth look at a neighborhood. If you’re looking for something like that, please check out our Austin Home Values Report.
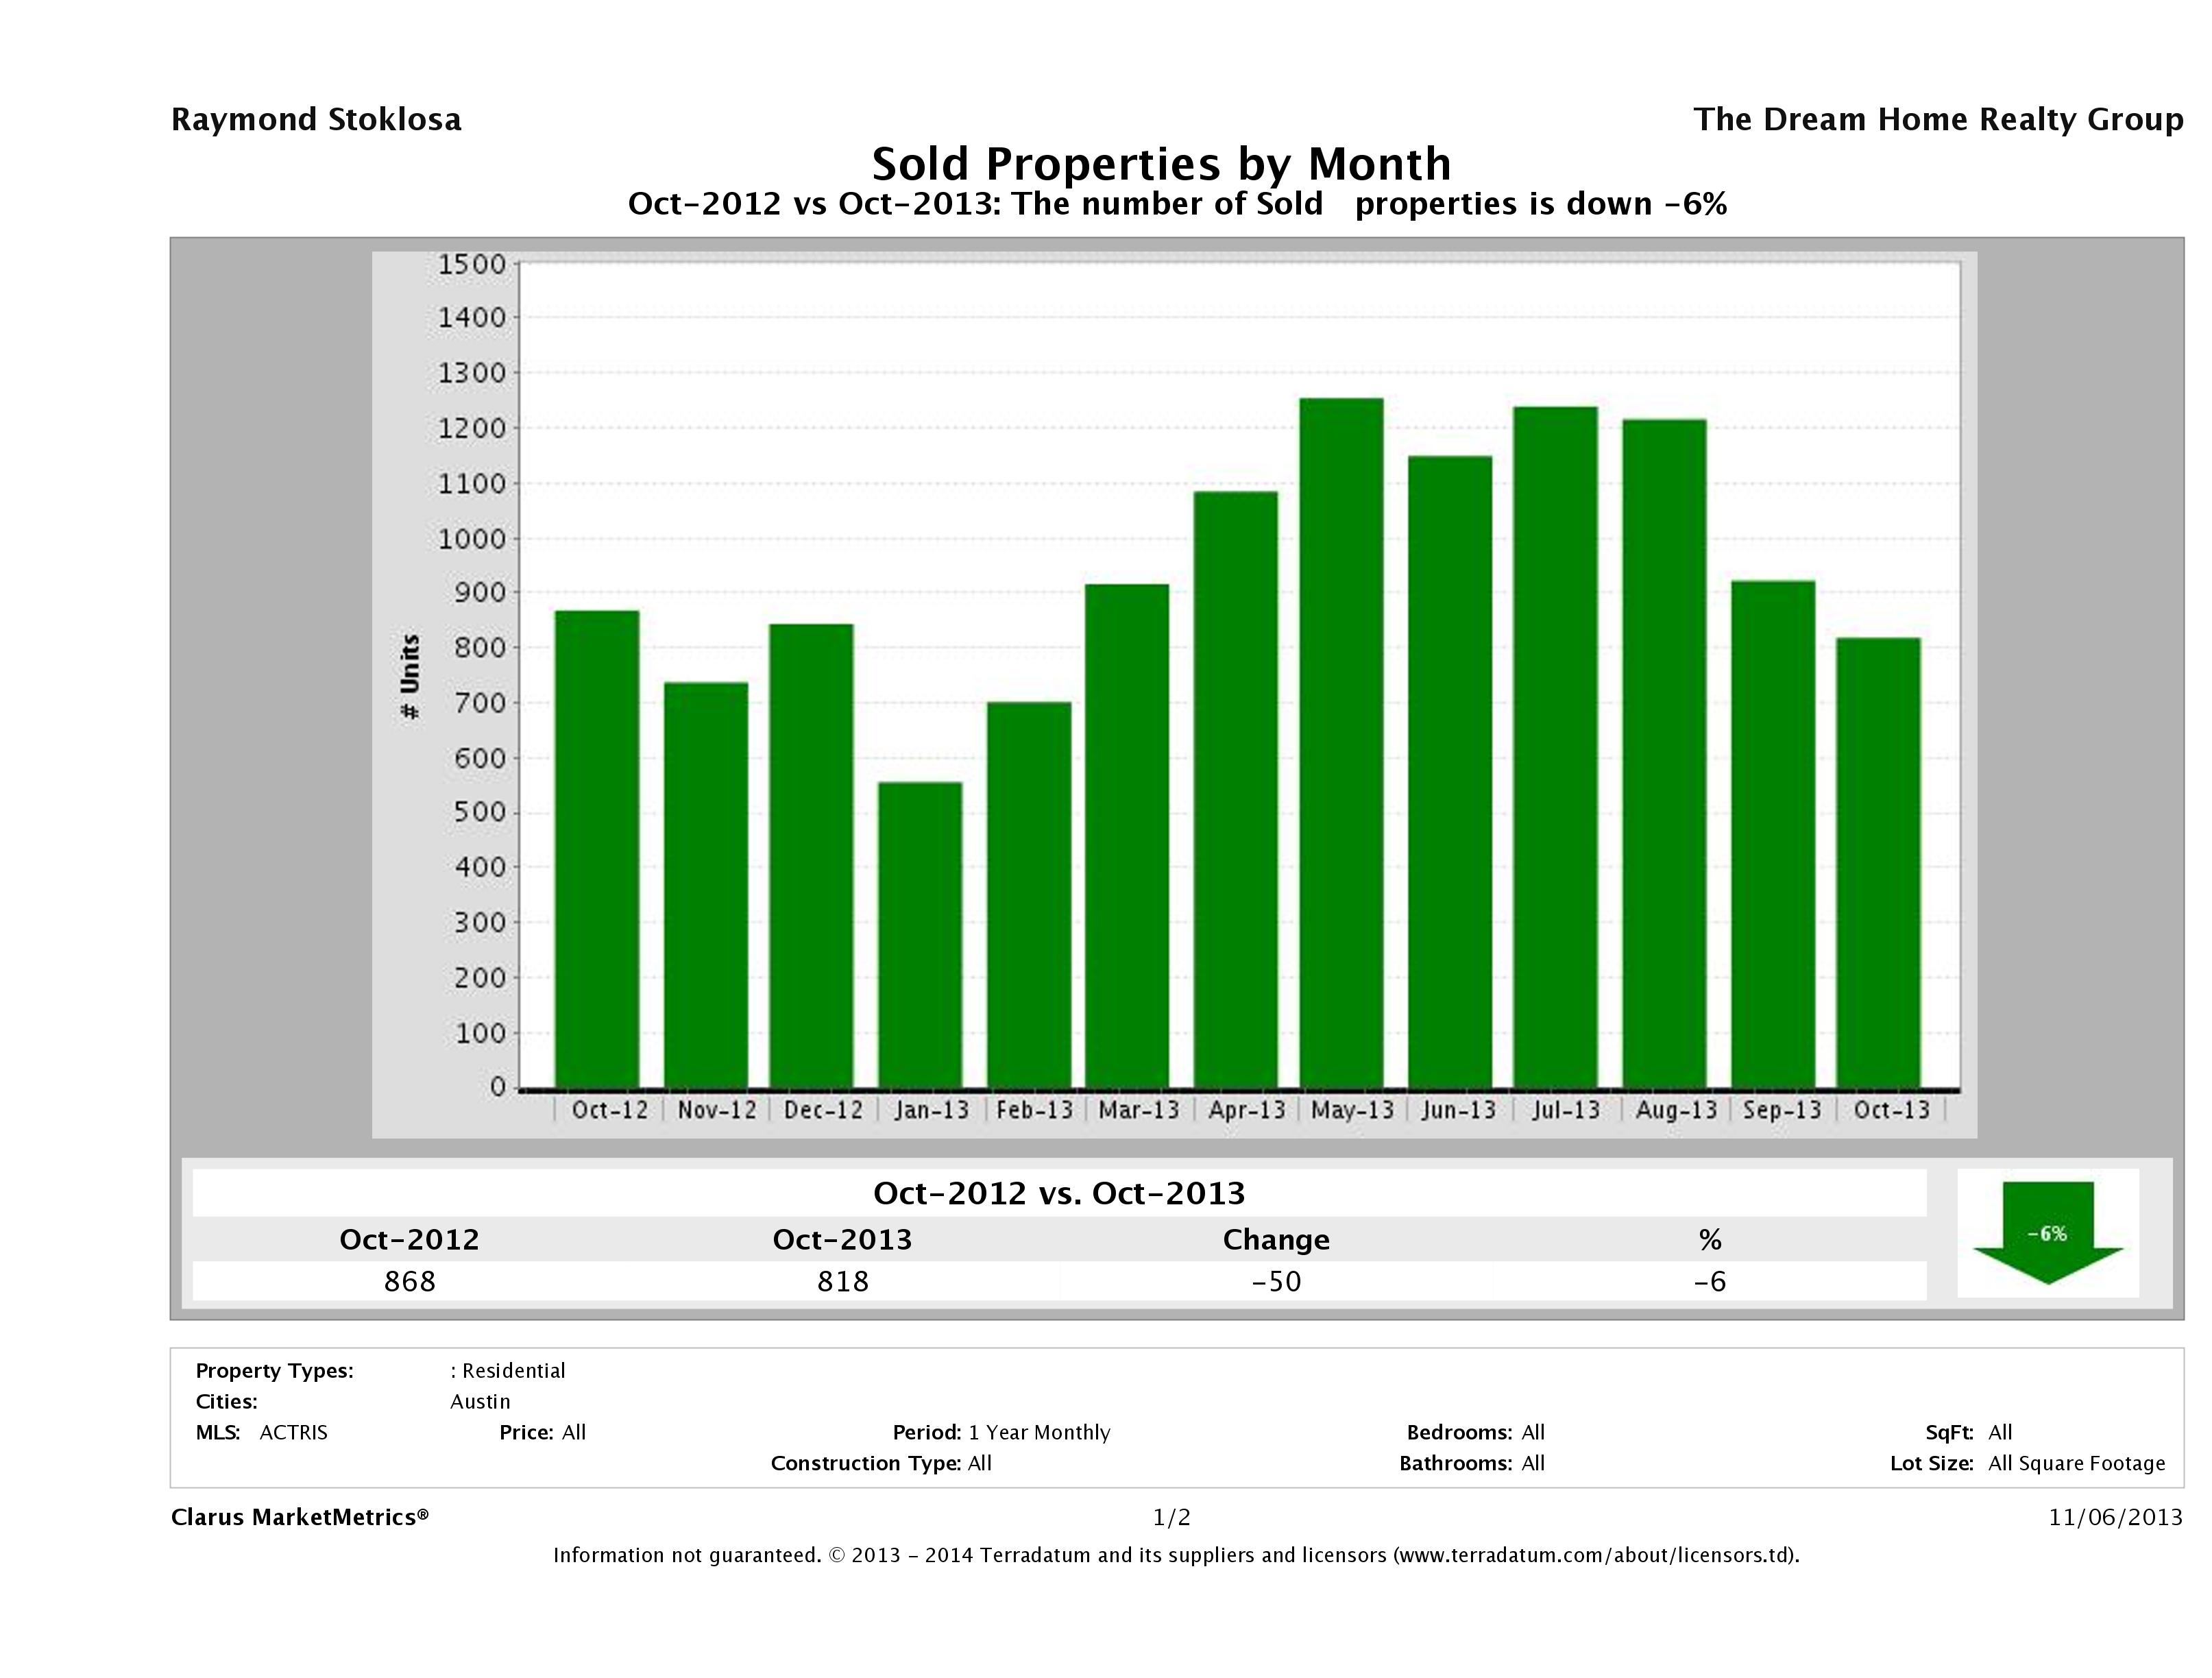
Number of Sold Homes in Austin Down 6%
In October 2013, Austin saw a 6% decrease in the number of homes sold from October 2012 to October 2013 numbers. In October 2013, we saw 818 homes sell in Austin compared to 868 in October 2012. Numbers wise, we did see a small down turn of the number of homes that sold in October. I attribute this to the government shutdown which did spook some home buyers. Now that the government is back up and working, I would expect November’s numbers to be a lot stronger.
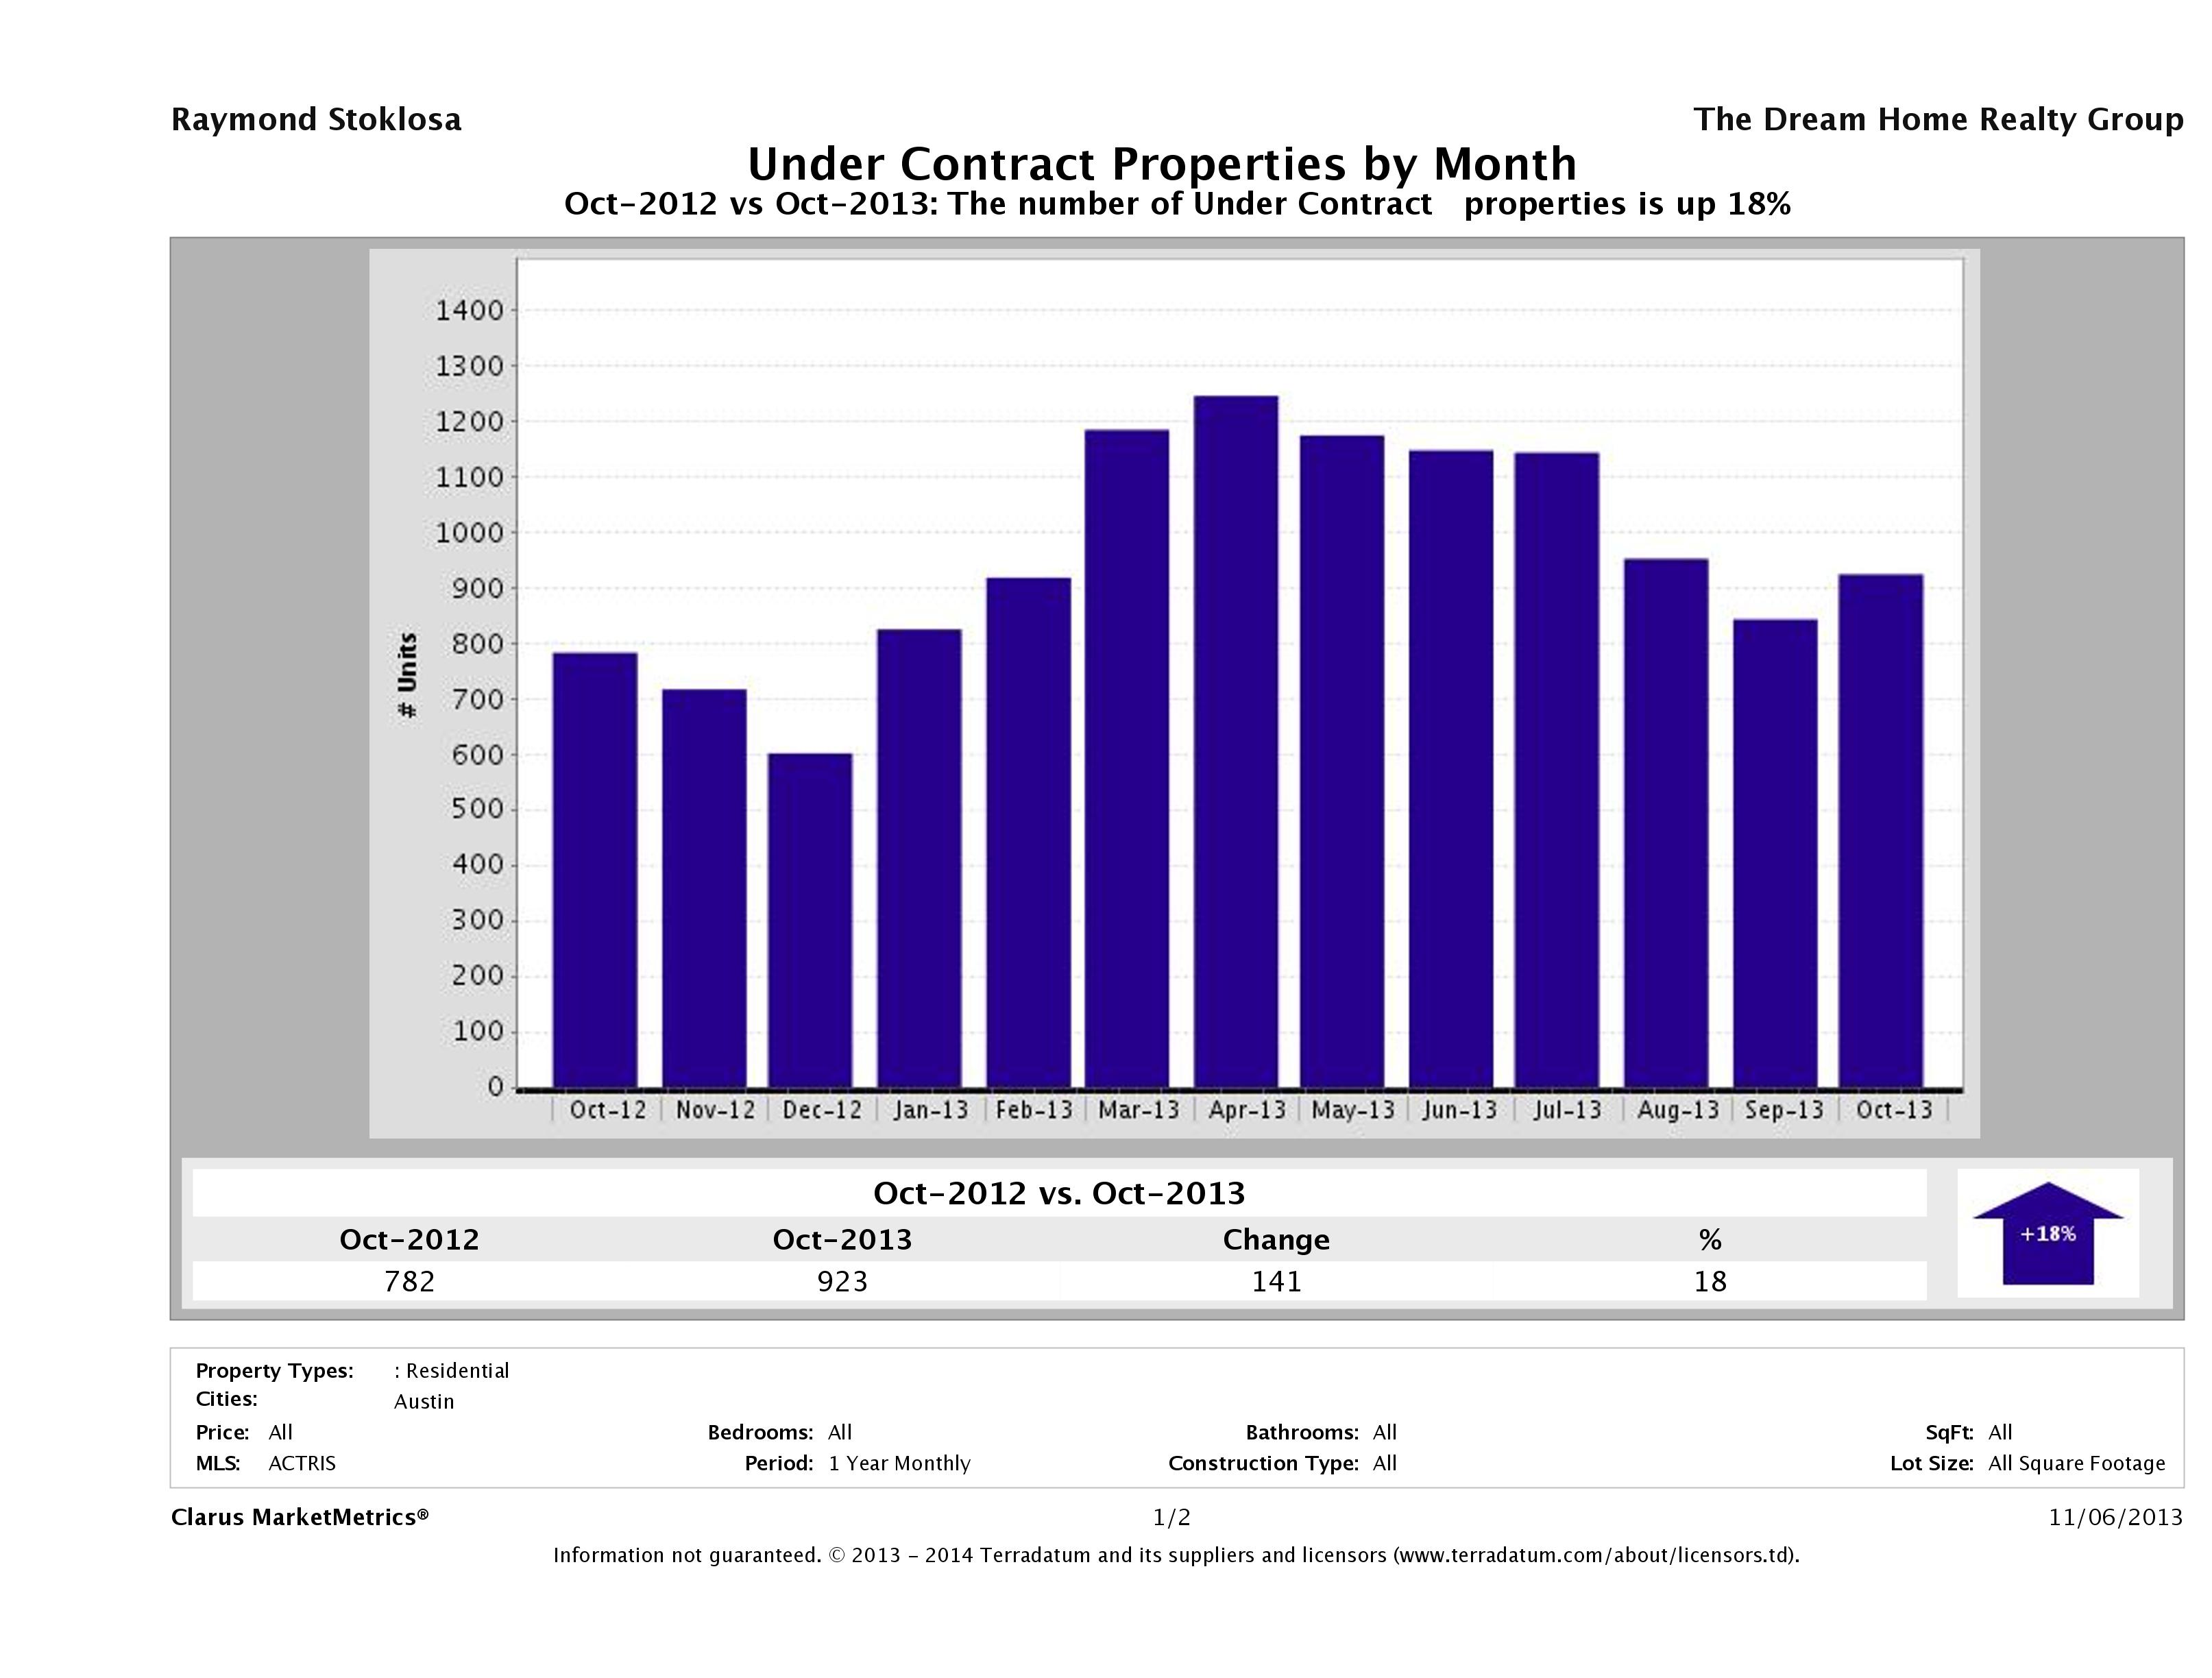
18% More Austin Homes Under Contract
In October 2013, there were 923 homes that went pending compared to 782 in October 2012 marking an 18% increase in year over year numbers. Next month’s numbers will be very telling as it will show what type of activity we’ll have going into the usual winter slowdown. If these numbers are any indicator, there won’t be much of a slowdown.
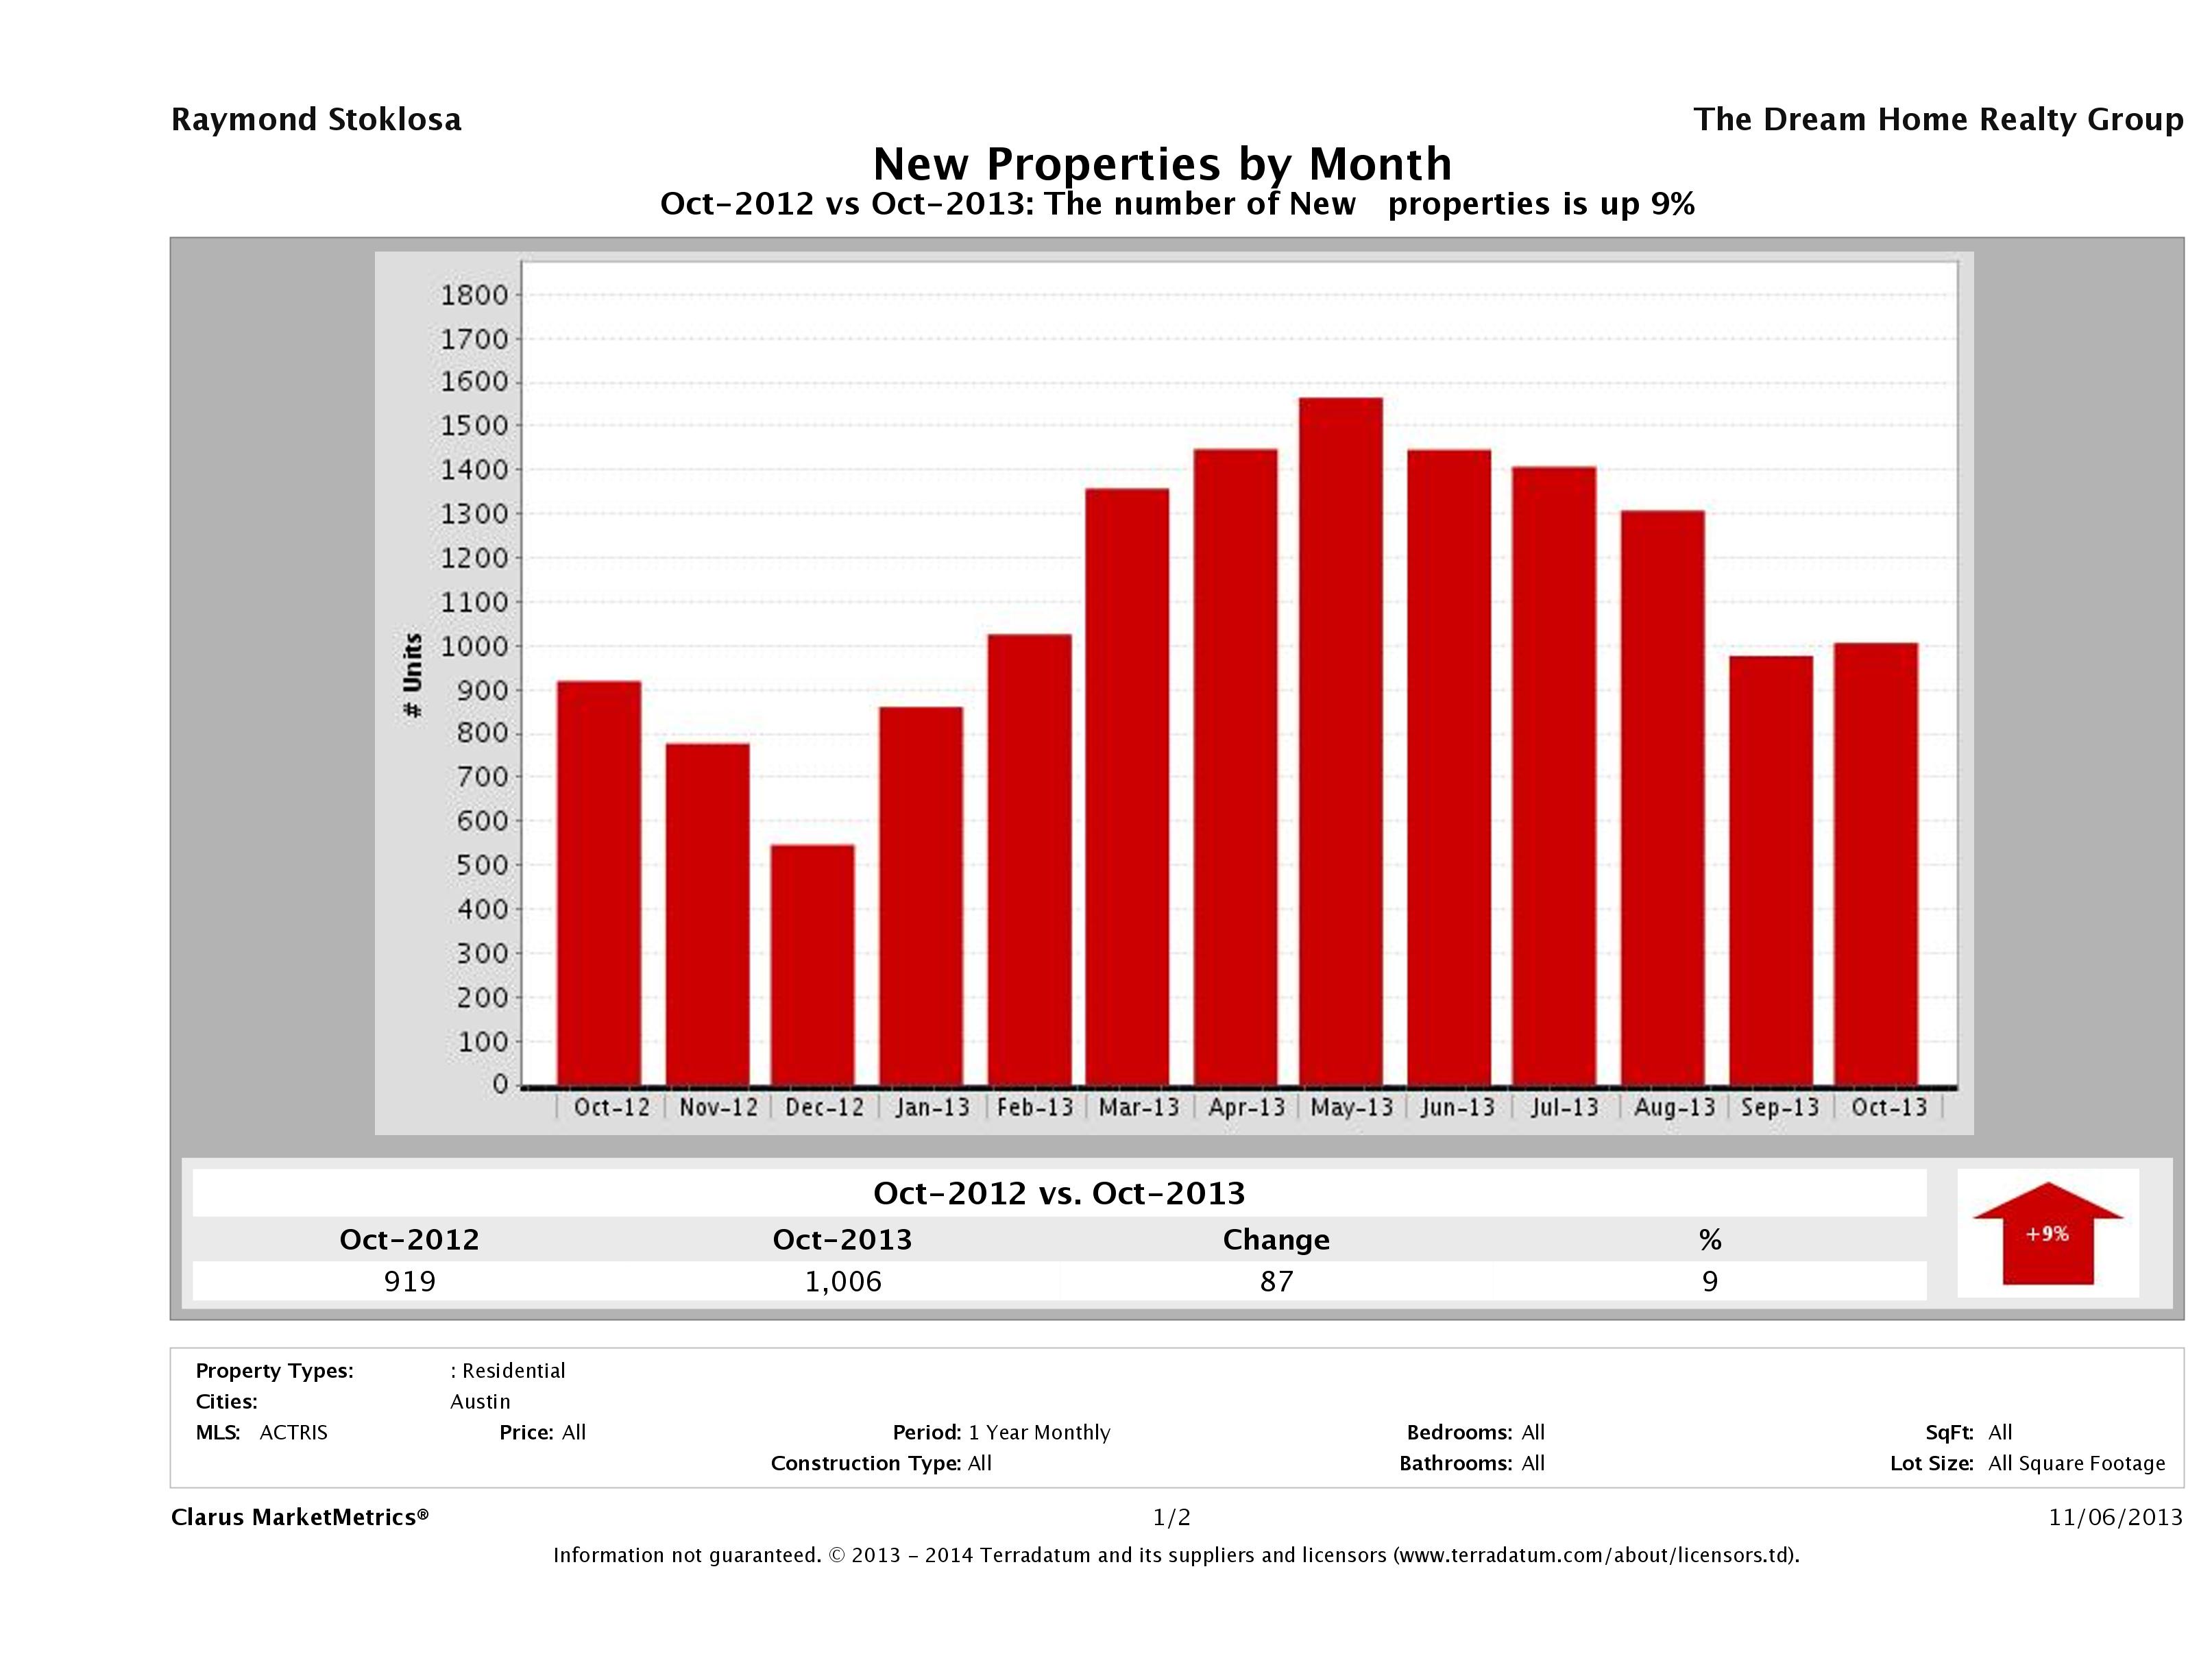
Number of Homes Listed for Sale Up 9%
In October 2013, we saw 1,006 homes introduced to the market compared to 919 in October 2012. Looks like sellers are trying to take advantage of the move up opportunities with low interest rates and high prices. Smart home owners understand interest rates are the single most important factor in determining how much they can afford. Though sellers won’t save money on their purchase, they will be able to finance it at an incredibly low rate, lowering their monthly payment. Waiting for home prices to go down could risk interest rates going up, which could increase the monthly mortgage payment.
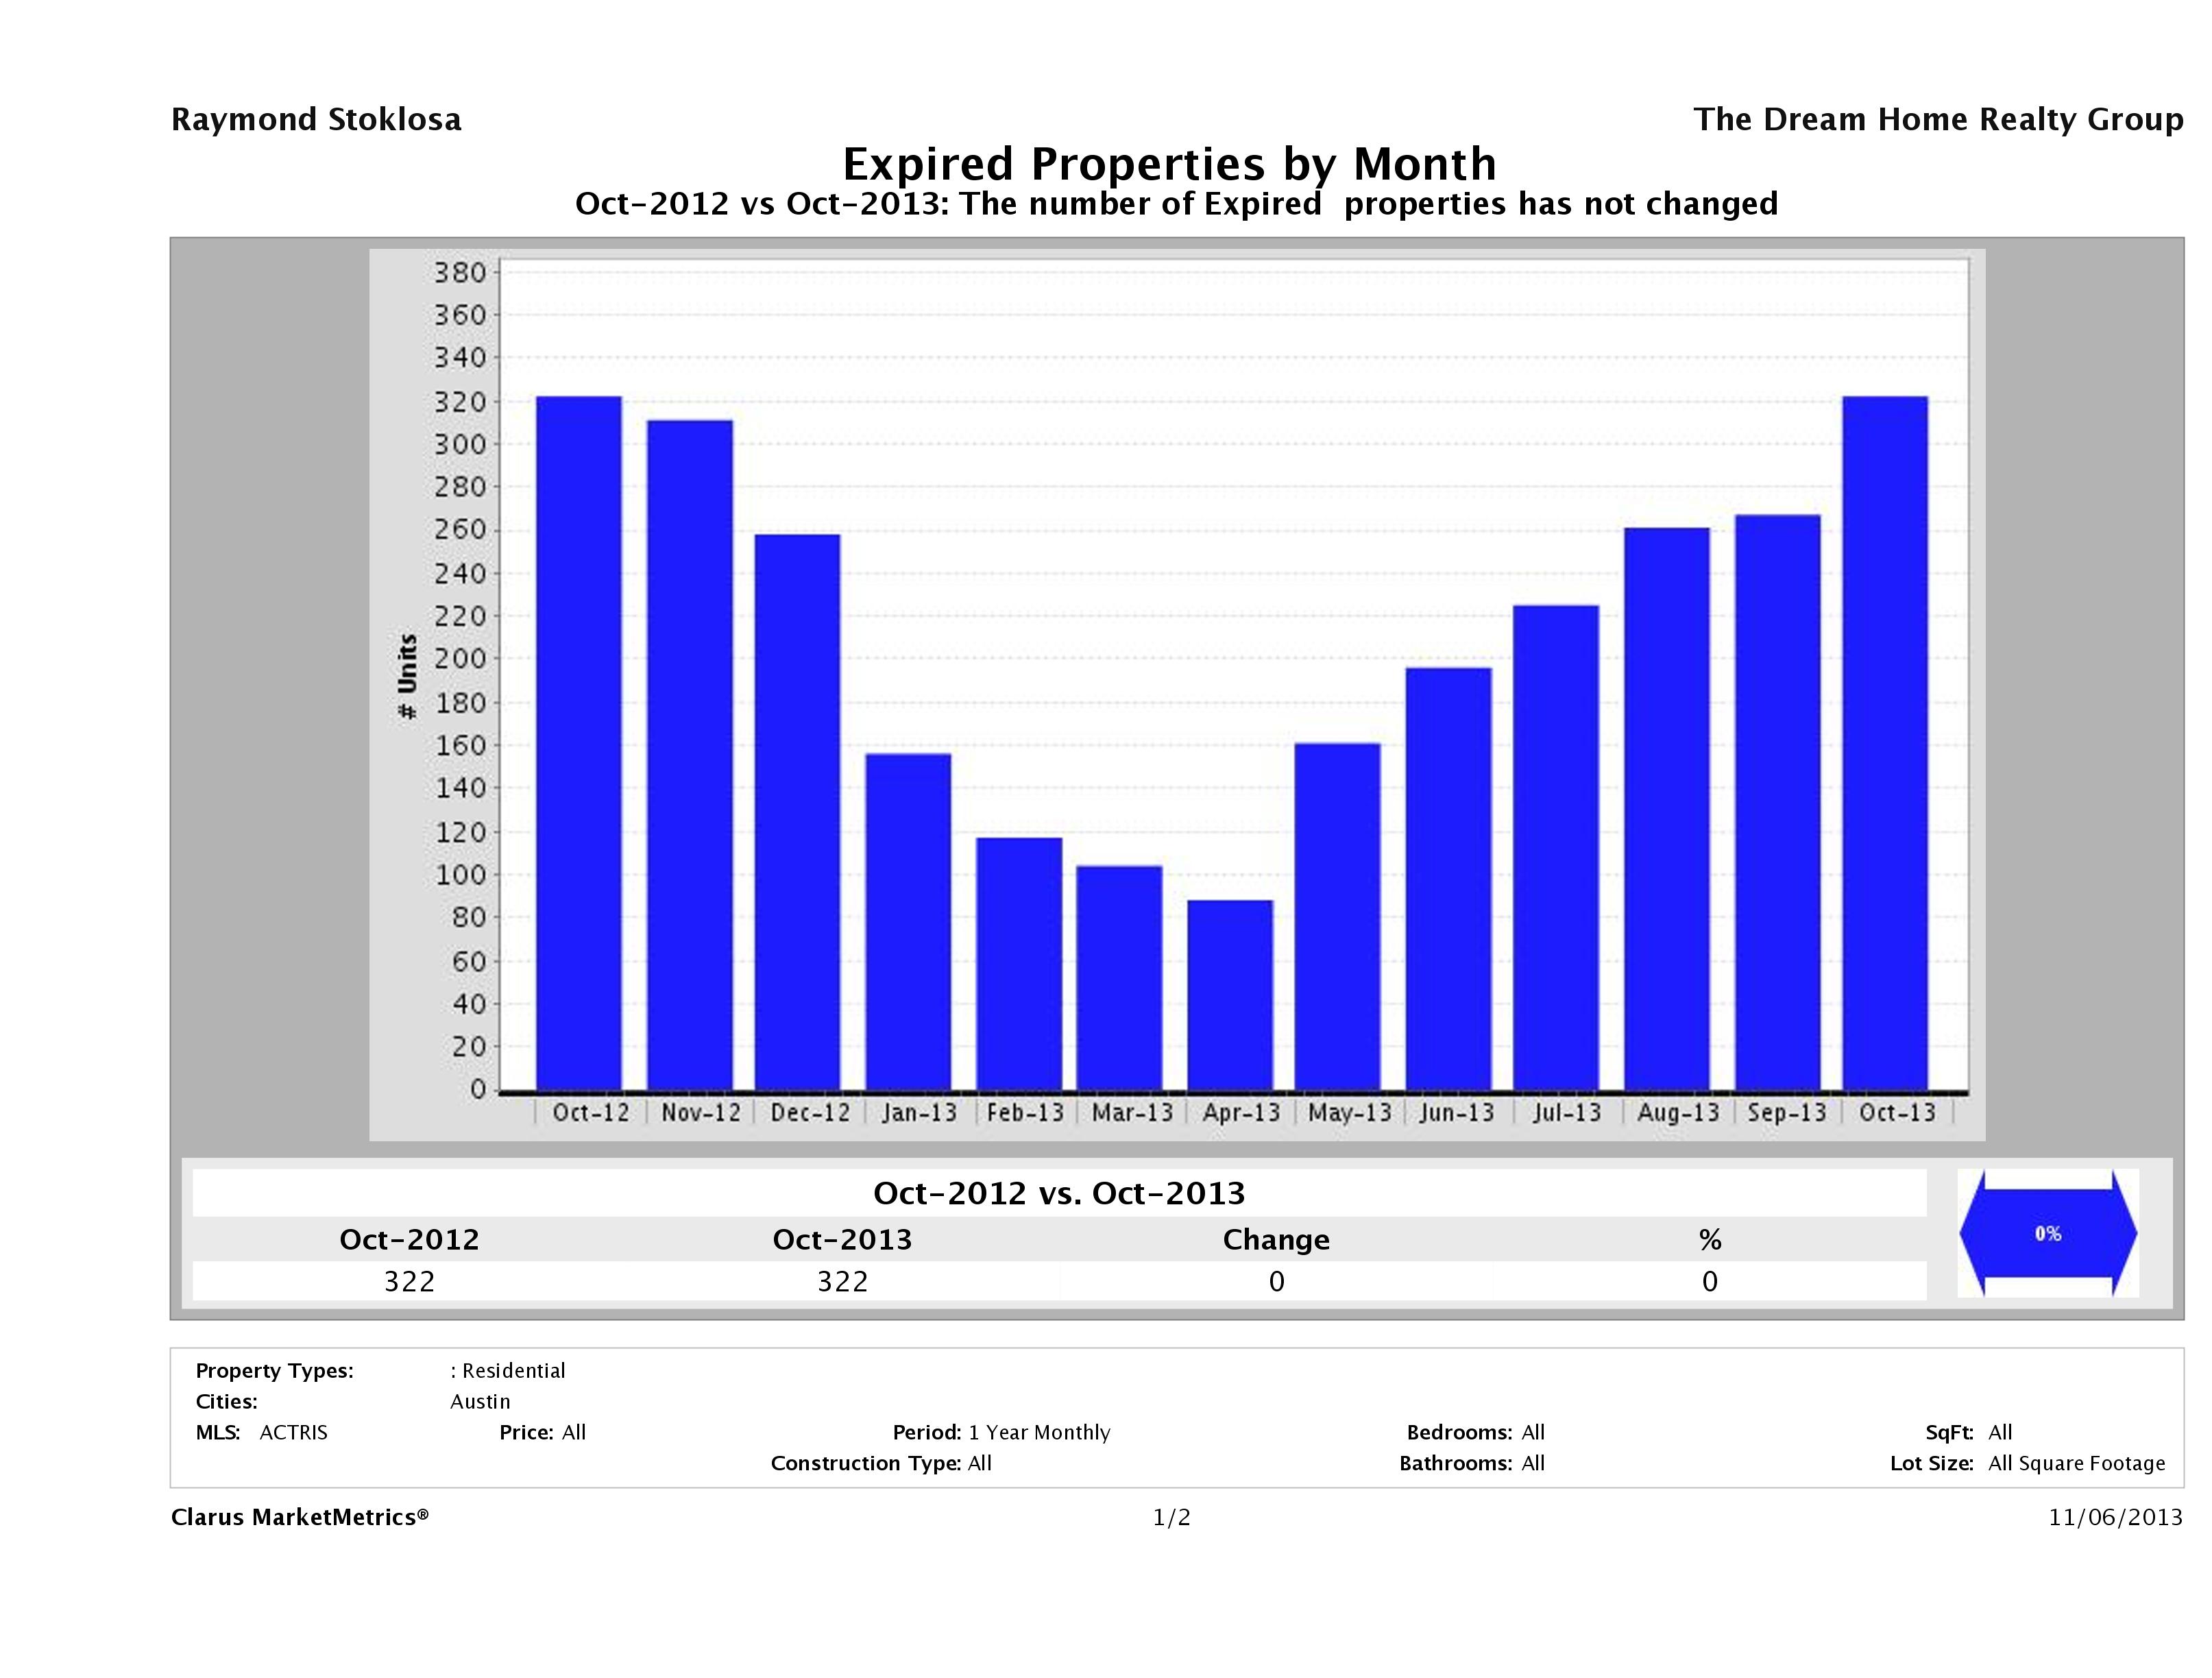
Number of Homes Taken Off the Market Stays the Same
In October 2013, we saw 322 homes taken off the market compared to 322 homes in October 2012, dead even in year over year numbers. Though there was no change, it does show homes that are priced too high for the market do not sell, even with increased buyer demand.
Did your home expire? Check out our Austin Home Not Selling resources page to find out why.
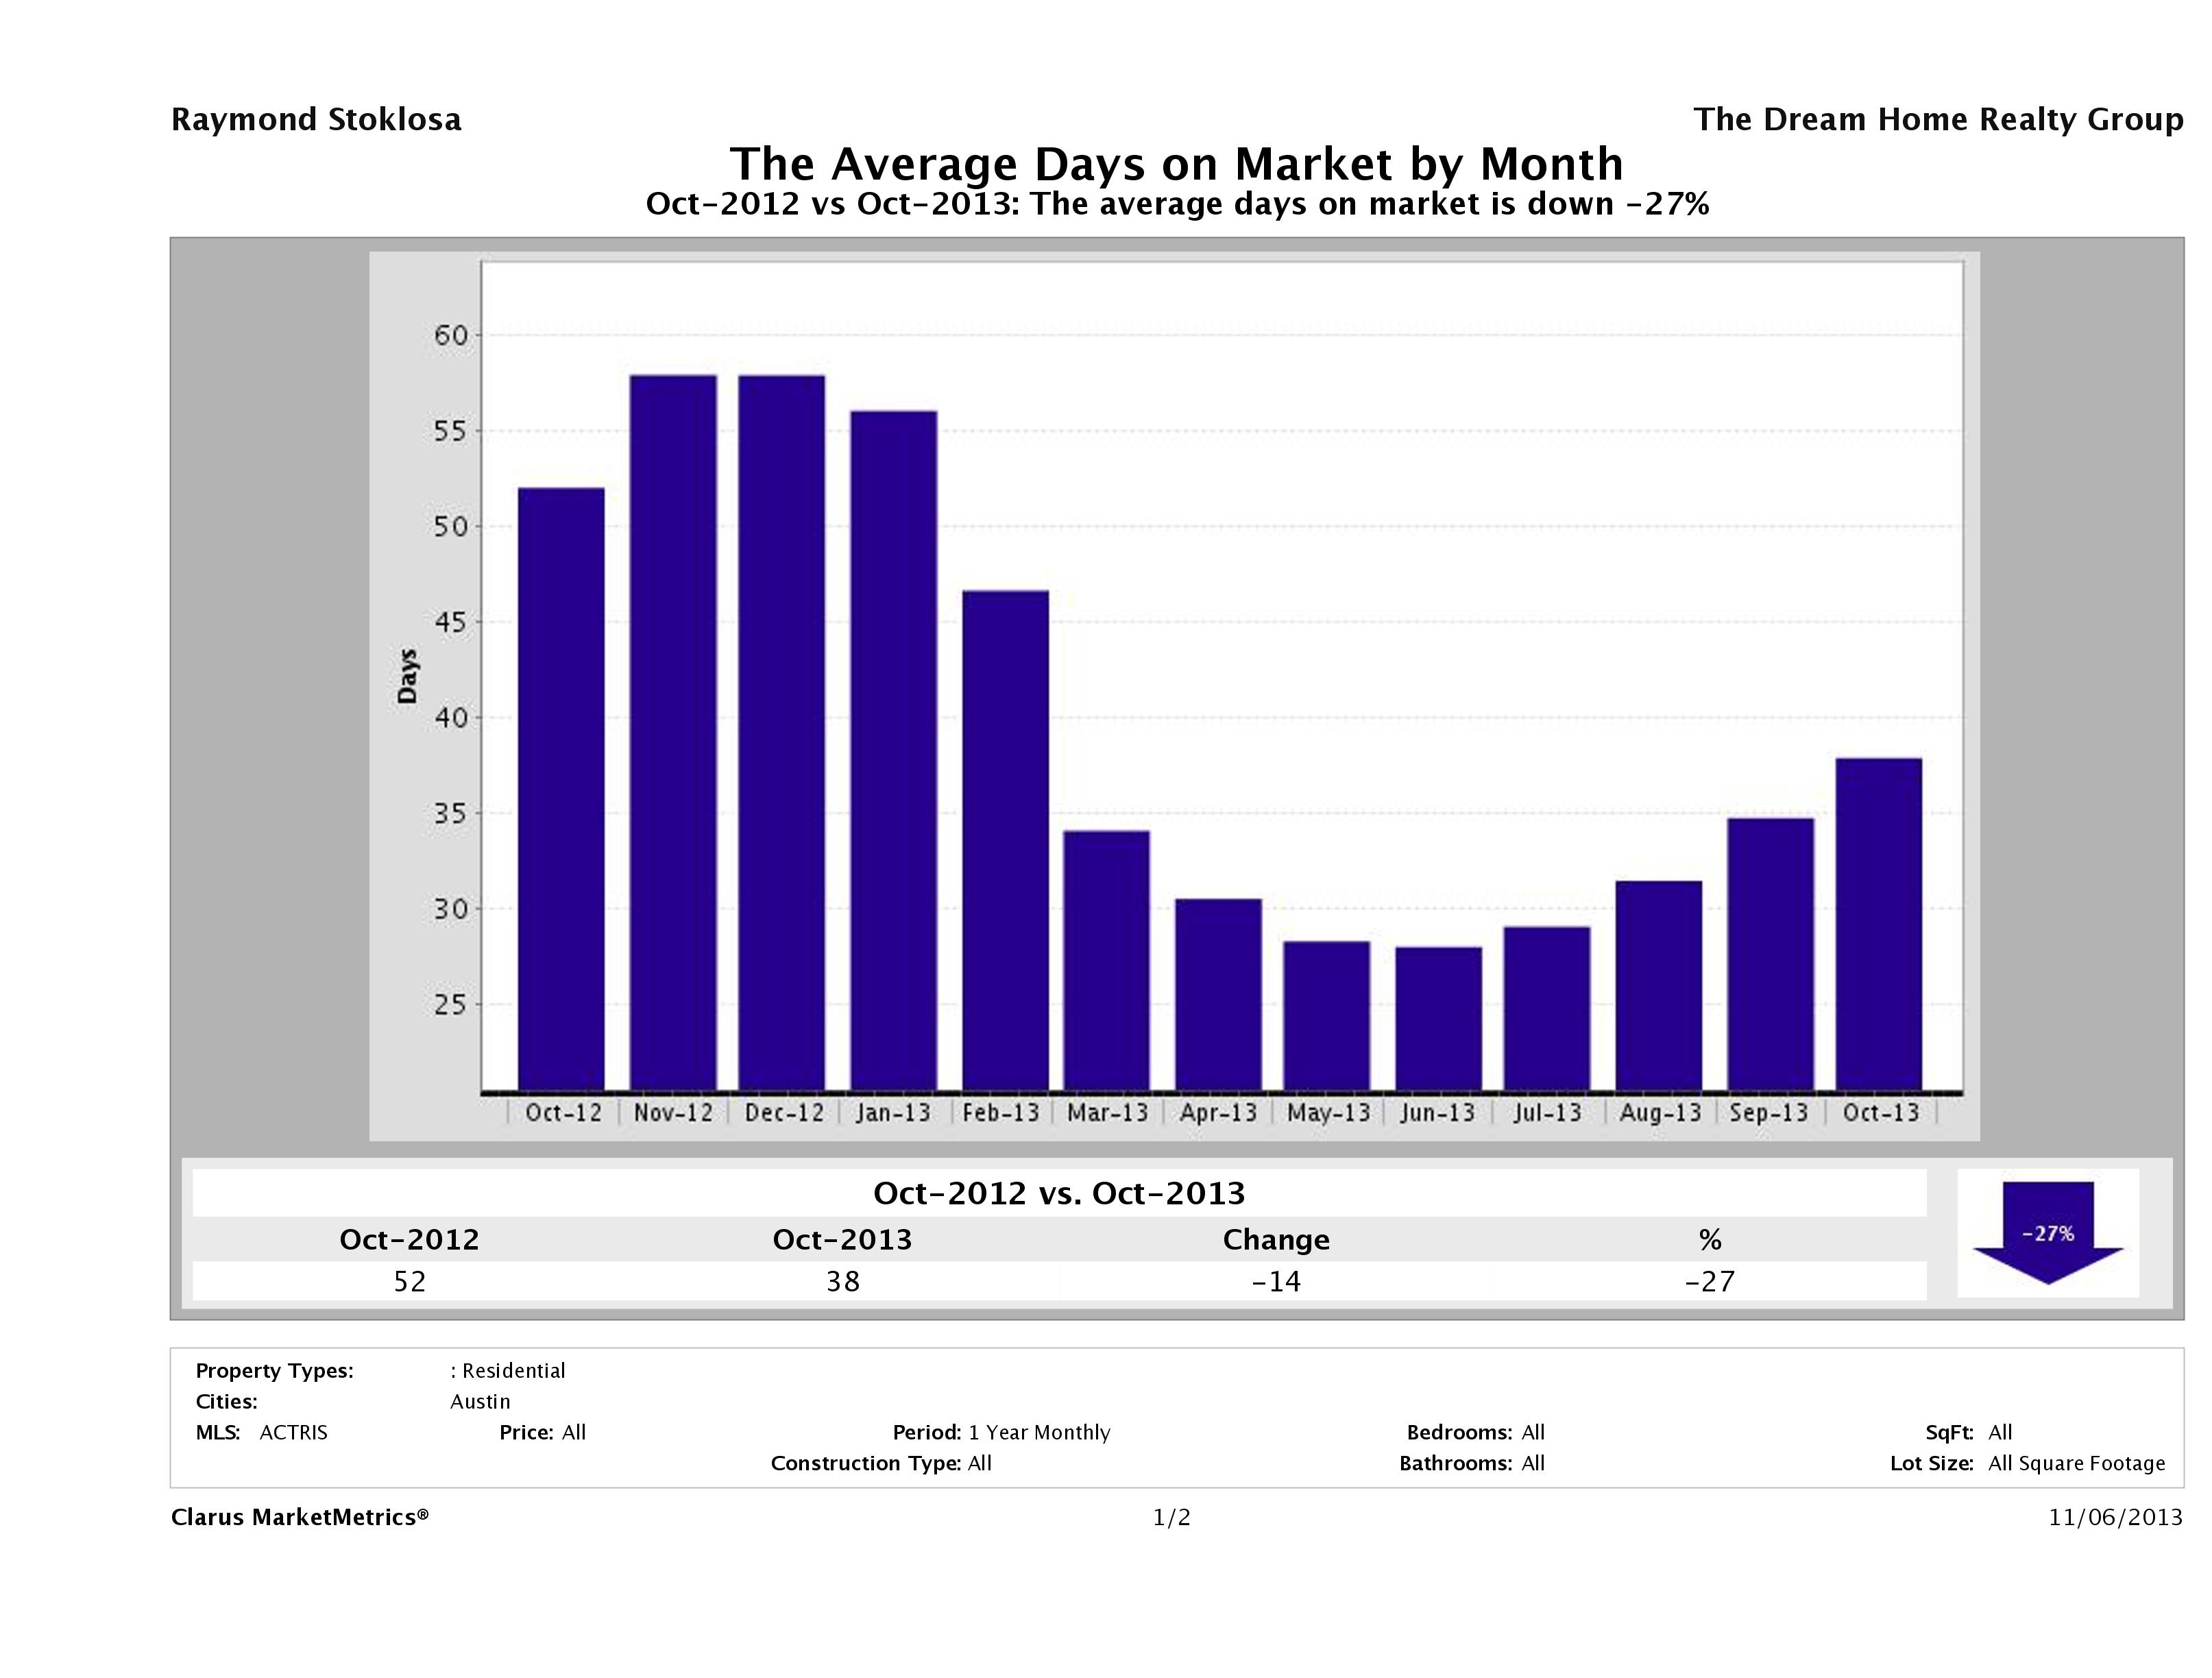
Time to Sell Home in Austin Down 27%
In October 2012, it took, on average, 52 days to sell a home in Austin while in October 2013, it took around 38 days. A normal market is considered 90 days, so 38 days is incredibly fast, especially considering these are city wide figures. Homes that are very competitively priced and in the most desirable neighborhoods are selling faster than 38 days.
Supply is Down 8% and Demand is Down 6%
This month we’ve seen an 8% decrease in supply (number of properties for sale) and a 6% decrease in demand (number of sold properties). Though demand is down this month, it still outpaces inventory, so if you’re looking to sell, strike will the tables are still tipped in your favor and before the Winter slowdown.
Median for Sale Up 13% vs Median Sold Price Up 4%
This chart compares the Median for Sale Price vs the Median Sold Price to show their relationship. In Austin, we saw a 13% increase in the median for sale price and only a 4% increase in the median sold price of a single family home in year over year numbers. Sellers seem to be pricing their homes higher than they did last year and buyers are appealing to sellers higher prices to a point, but are still negotiating.
Source: Clarus Market Metrics, ACTRIS Sold Data
October 2013 Real Estate Price Report – Strictly Numbers
For those of you who prefer to see the actual hard numbers, we’ve included the figures for October 2013 Austin home sales below. The most expensive home that sold in October 2013 was $4,450,000 and the least expensive home sold for $55,000. Homes range in size from 700 sqft – 7,731 sqft with an average size of 2,151 sqft. The average price per square foot was $160.51 with the lowest being $21.15/sqft and the highest being $1,311.57/sqft. It took, on average, 31 days to sell a home in Austin and sellers received, on average, 96.83% of their original list prices.
| Beds | Baths | SqFt | Listing Price | LP/SqFt | Selling Price | SP/SqFt | SP/LP | SP/OLP | DOM | |
|---|---|---|---|---|---|---|---|---|---|---|
| Min | 1 | 1 | 700 | 47900 | 25 | 55000 | 21.15 | 0.7865 | 0.517 | 0 |
| Max | 7 | 9 | 7,731 | 5200000 | 1515.59 | 4500000 | 1311.57 | 1.2449 | 1.325 | 844 |
| Average | 3 | 3 | 2,151 | 358202 | 164.2 | 348557 | 160.51 | 0.9822 | 0.9683 | 31 |
| Median | 3 | 2 | 2,040 | $299,900 | $142.38 | $300,500 | $140.94 | 100% | 0% | 8 |
| Search Criteria | |||
|---|---|---|---|
| Status | Sold | Sold Date | October 2013 |
| Property Type | Single Family Homes | Number Sold | 840 |
| Source: | ABoR Sales Data | Area | Austin |
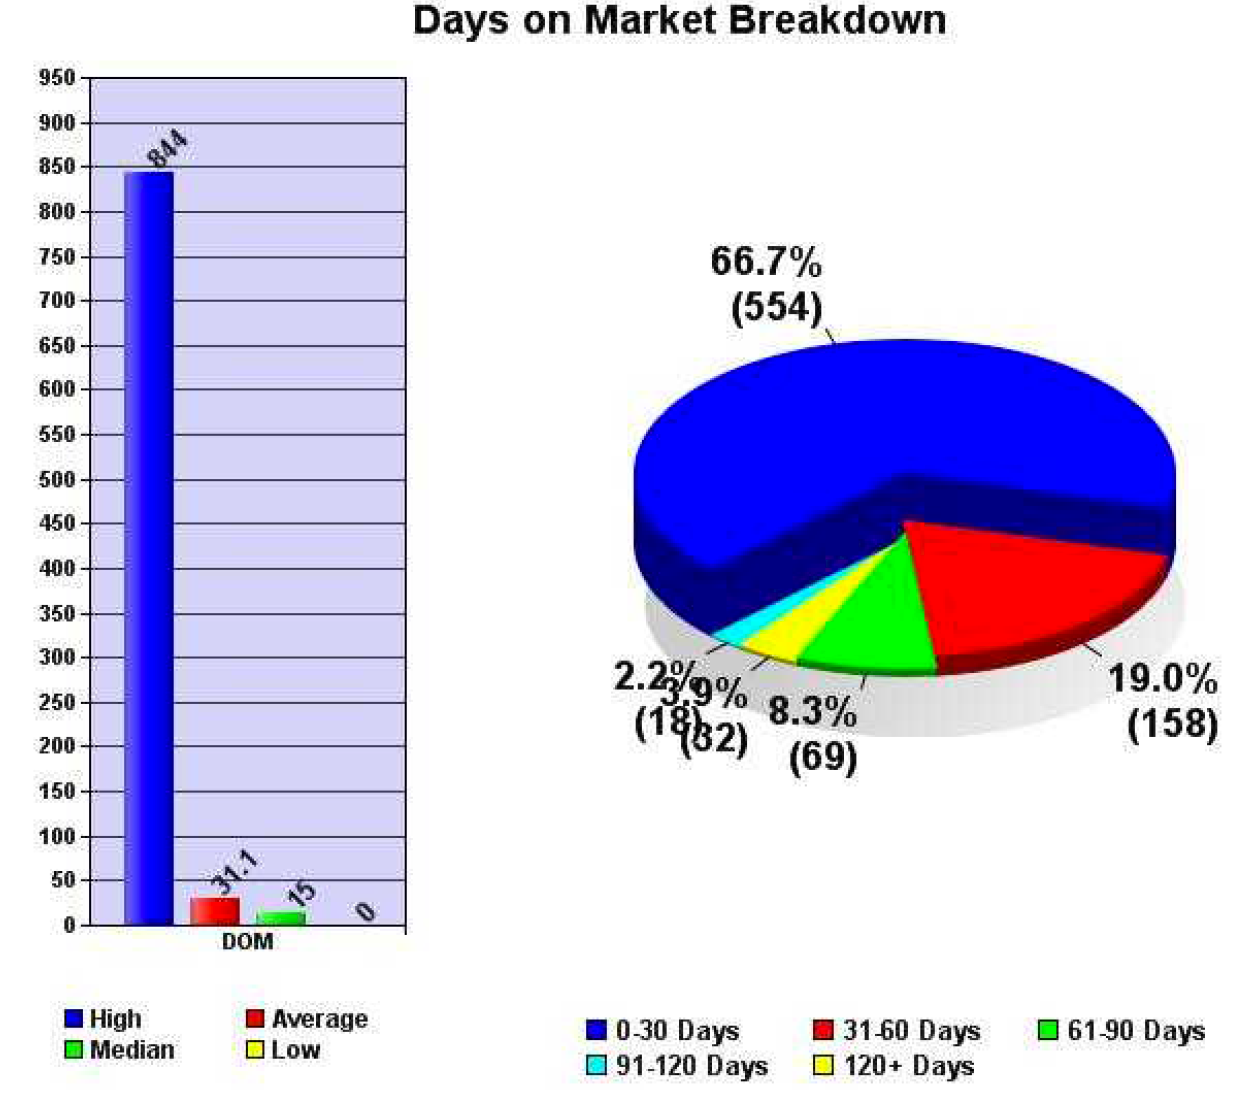
October 2013 Days on Market Report
The majority (66.67%) of the 831 homes that sold in Austin in October 2013 (554) sold in less than 30 days and received, on average, 98.95% of their list prices. As homes stayed on the market longer, sellers received less than their list prices with homes that have been for sale for 120 days or more receiving, on average, 95.16% of their list prices. The lesson here? Homes that are priced right from the beginning sell quickly and for nearly list price.
| 0-30 Days | 31-60 Days | 61-90 Days | 91-120 Days | 120+ Days | |
|---|---|---|---|---|---|
| No. of Listings | 554 | 158 | 69 | 18 | 32 |
| Breakdown % | 0.6667 | 0.1901 | 0.083 | 0.0217 | 0.0385 |
| Avg % SP/LP | 0.9895 | 0.9748 | 0.9608 | 0.9564 | 0.9516 |
October 2013 Price Analysis Report
The majority of the homes that sold in Austin in October 2013 were priced below $500,000, which is to be expected. You’ll also see that the lower priced homes sold faster than the higher priced homes, which is due largely in part to the increased market for homes below $500k. Homes priced between $500k-$550k sold in the same amount of time as homes priced between $300k-$350k, which might have something to do with the conforming loan limit of $417k.
| Price Range | Quantity | Average DOM |
|---|---|---|
| $149,999 or under | 92 | 23 |
| $150,000 – $199,999 | 153 | 25 |
| $200,000 – $249,999 | 123 | 25 |
| $250,000 – $299,999 | 90 | 30 |
| $300,000 – $349,999 | 82 | 26 |
| $350,000 – $399,999 | 55 | 31 |
| $400,000 – $449,999 | 51 | 51 |
| $450,000 – $499,999 | 47 | 35 |
| $500,000 – $549,999 | 33 | 31 |
| $550,000 – $599,999 | 26 | 42 |
| $600,000 – $699,999 | 24 | 38 |
| $700,000 – $799,999 | 20 | 23 |
| $800,000 – $899,999 | 5 | 87 |
| $900,000 – $999,999 | 11 | 57 |
| $1,000,000 or over | 17 | 94 |
| Total | 831 | 31 |
October 2013 Summary Price Report
Below you’ll find a breakdown of the sales prices of homes in Austin. The average price of a home that sold in October 2013 was $347,993 and the median price was $275,000.
| Summary | List Price | Sale Price |
|---|---|---|
| High | 5200000 | 4500000 |
| Low | 47900 | 55000 |
| Average | 357628 | 347993 |
| Median | 279500 | 275000 |
Time to Buy? Sell?
As we always say, the best time to buy or sell a home is when you need to buy or sell. If you have a house to sell, selling when its a buyers market may hurt you on the selling end, but you’ll make it up on the buying end. If you’re trying to get into the market for the first time, the only way you’ll know that we’ve “hit bottom” is when its in the rear view mirror. Work with professionals who can help you analyze your financial and lifestyle to determine if now is the right time to buy or sell.
Looking strictly at the numbers, it appears the recommendation for this month is (again)…it’s time to sell. With inventory hovering at near record lows, a home that’s priced right will have no problem finding a buyer. Buyers again came out in record numbers yet again in October 2013 with an 18% increase in the number of contracts received by sellers in year over year numbers. We saw a small slow down coinciding with school starting in August, but not like we’ve seen in past years. But, sellers are still receiving high offers, with over 98% of list prices received city wide in October. If you’re looking to sell, we can help you get top dollar for your home in the shortest time. For more info about the best home selling program in Austin, visit Sell My Austin Home.
If you’re a buyer, that doesn’t mean sit on the fence and wait. Interest rates are still incredibly low and seem to have stabilized even given the aftermath of the government shut down. Interest rates have the biggest effect on your monthly payment. Waiting until the market slows down in Winter could mean an increased payment, even if prices go down. If you’re looking to get into the market, the best time to find a great deal is any time you can. For more info about our Home Buyer Representation Program, check out Austin Buyer Representation.
Questions About the Austin Real Estate Price Report?
Do you have questions about this Austin Real Estate Price Report? Call us at (512) 827-8323 or email us at info@11OaksRealty.com and we’ll help you in any way we can. If you’re looking to buy or sell Austin real estate, don’t forget to check out our Buyer Resources and our Seller Resources for more tips.
Leave a Reply