Eleven Oaks Realty is proud to present their March 2017 Austin Real Estate Price Report measuring activity in the Austin single family home market.
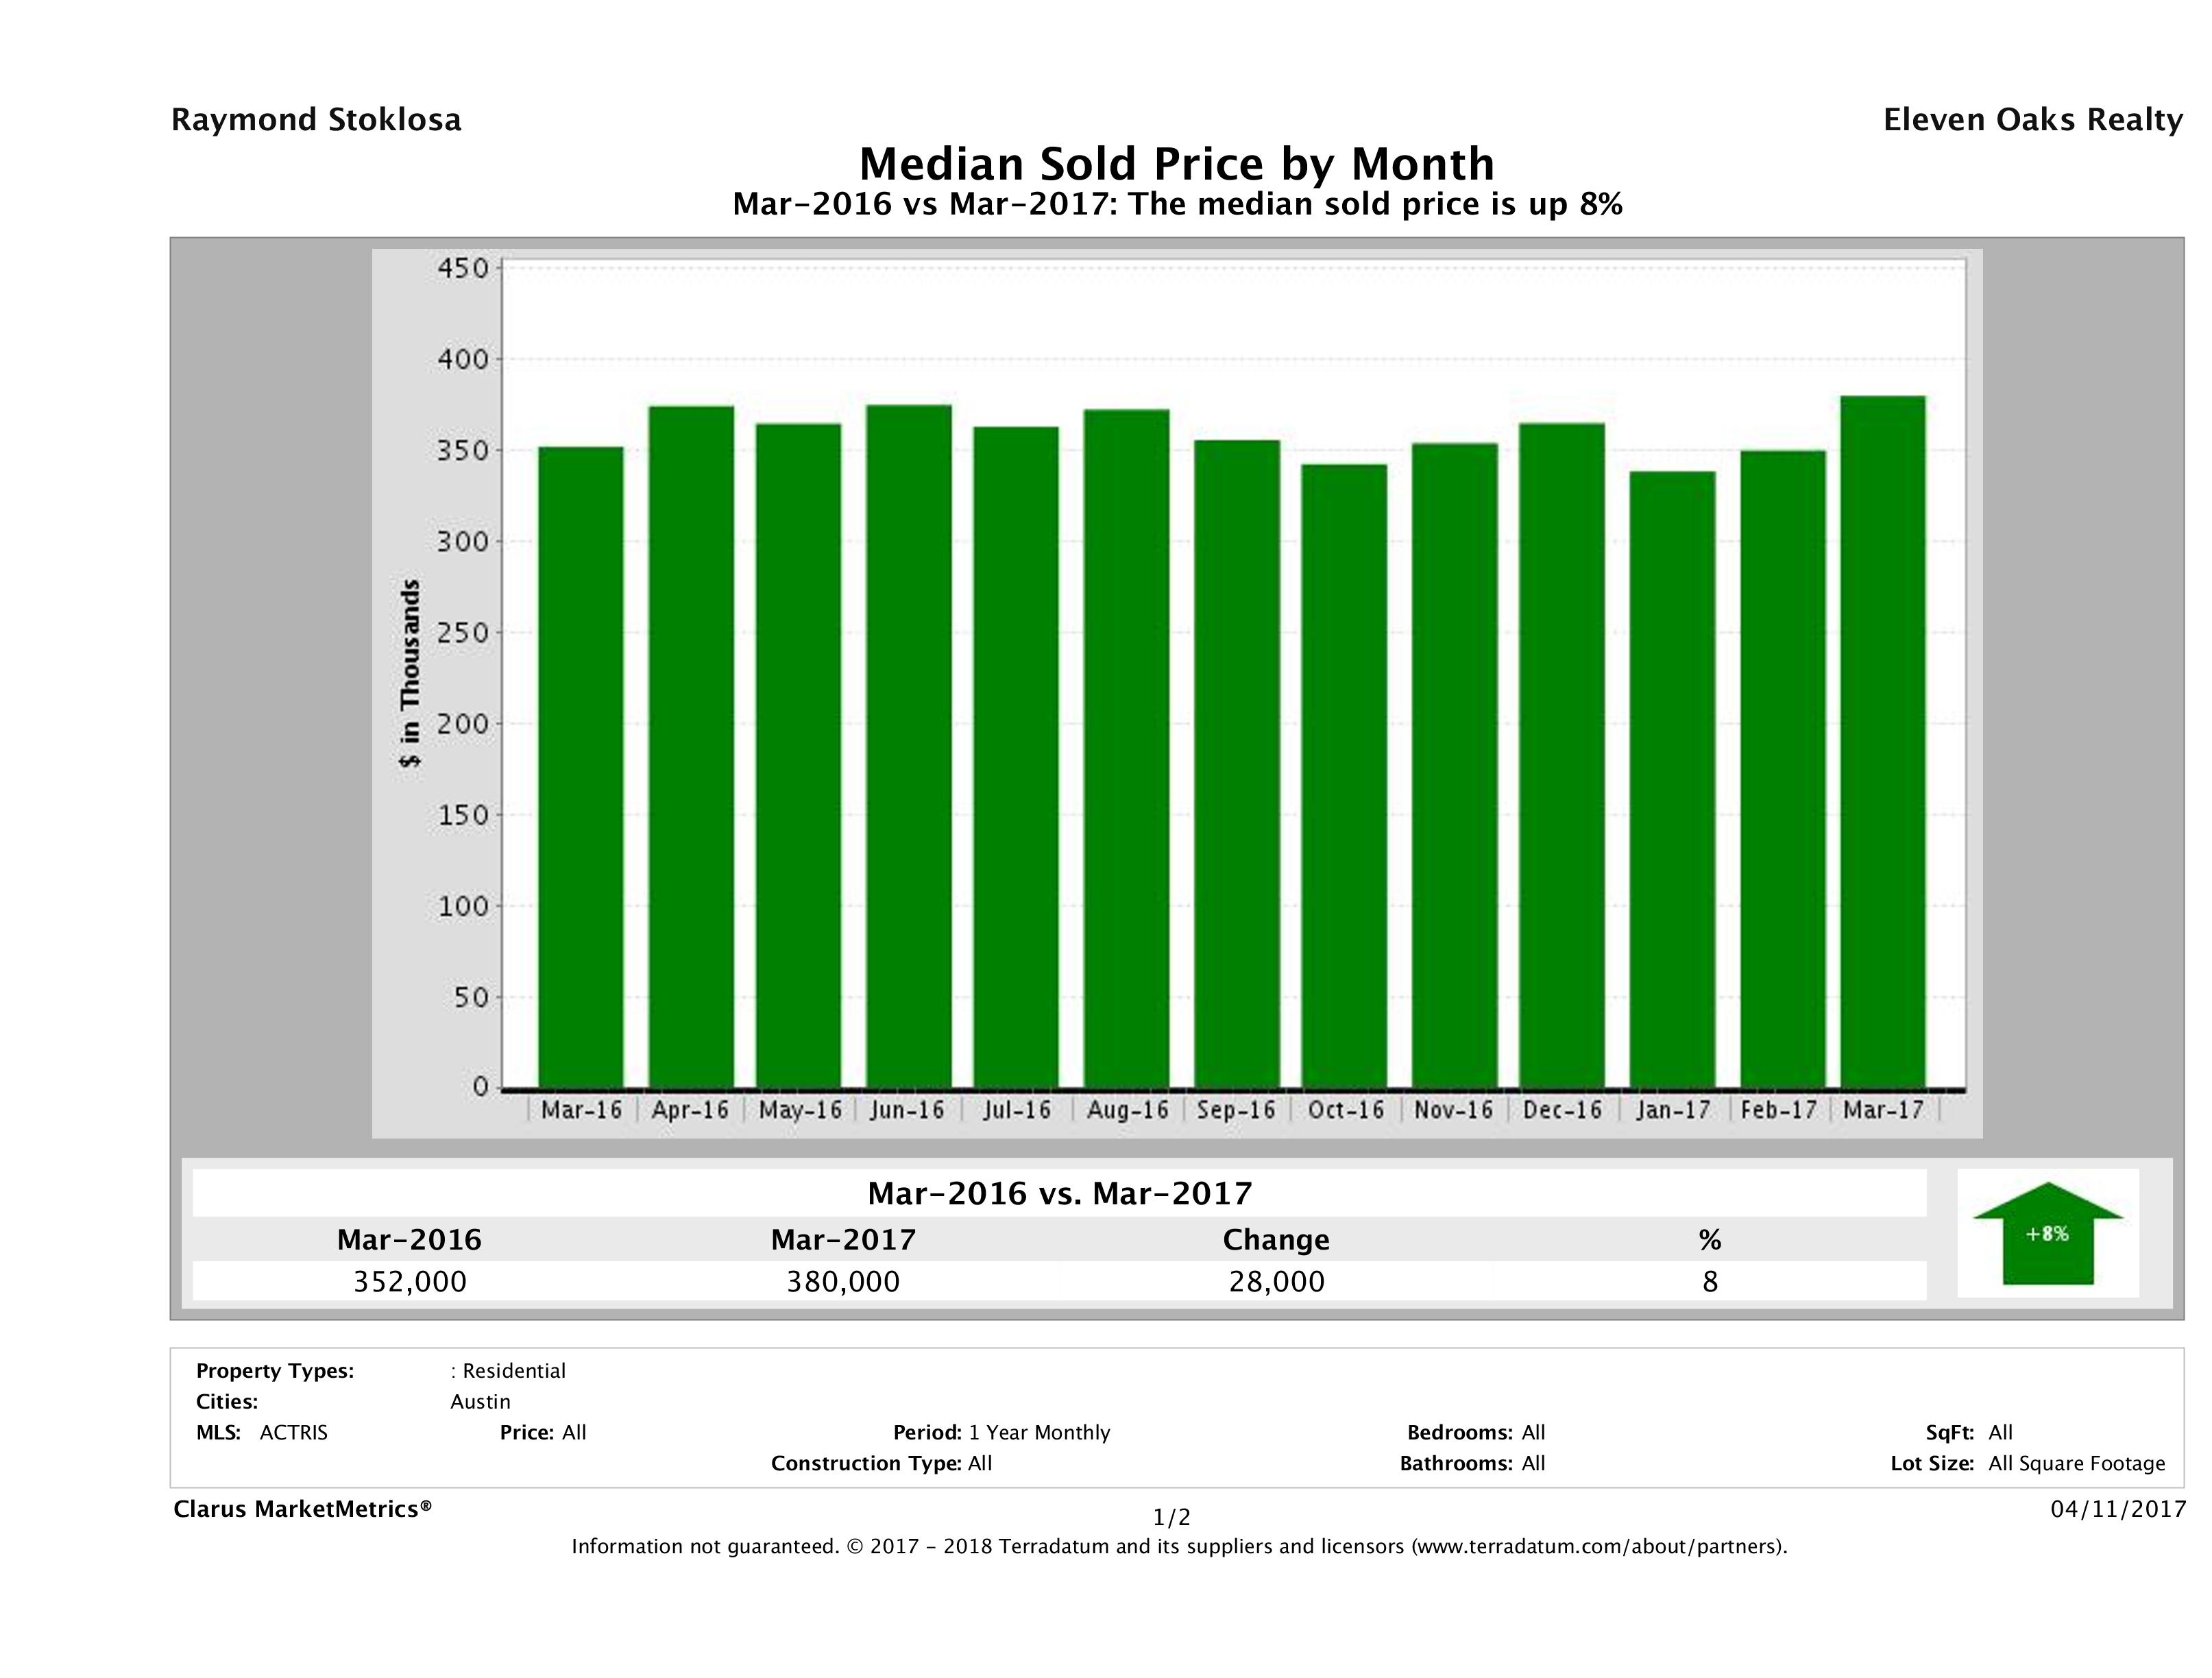
Austin Median Home Price Up 8%
The biggest story in this month’s Austin Real Estate Price Report comes by way of median home prices. For the 31st month in a row, the median price of a home in Austin outpaced the previous year. The median price of an Austin home in March 2016 was $352,000 compared to $380,000 in March 2017, marking a 8% ($28,000) increase in year over year numbers.
Median home price helps us see the distribution of homes sold and does not really give us an indication of the increase or decrease in a particular home’s market value. To analyze market value, we’d have to take an in depth look at a neighborhood. If you’re looking for something like that, please check out our Austin Home Values Report.
What does this mean to buyers? With 31 straight months of price increases and no breaks, it doesn’t seem like this market is slowing down. This year is already off to a strong start. Buyers were eager to start their search and beat the Spring rush and we’re expecting the summer months to be even more competitive. If you’re looking to buy this year, the sooner you start your search the better.
What does this mean to sellers? If you’re thinking of selling, you’ll want to get your home listed soon. We are quickly approaching the busiest time of year, where we would expect demand to go up, with market forces shifting more toward sellers. We never really saw a slow down over Winter and buyers are already getting themselves ready to buy a home. The most successful sellers prepare their home to meet the market. Work with a Realtor to help you make smart improvements and maximize the return on the dollars you spend preparing your home to sell.
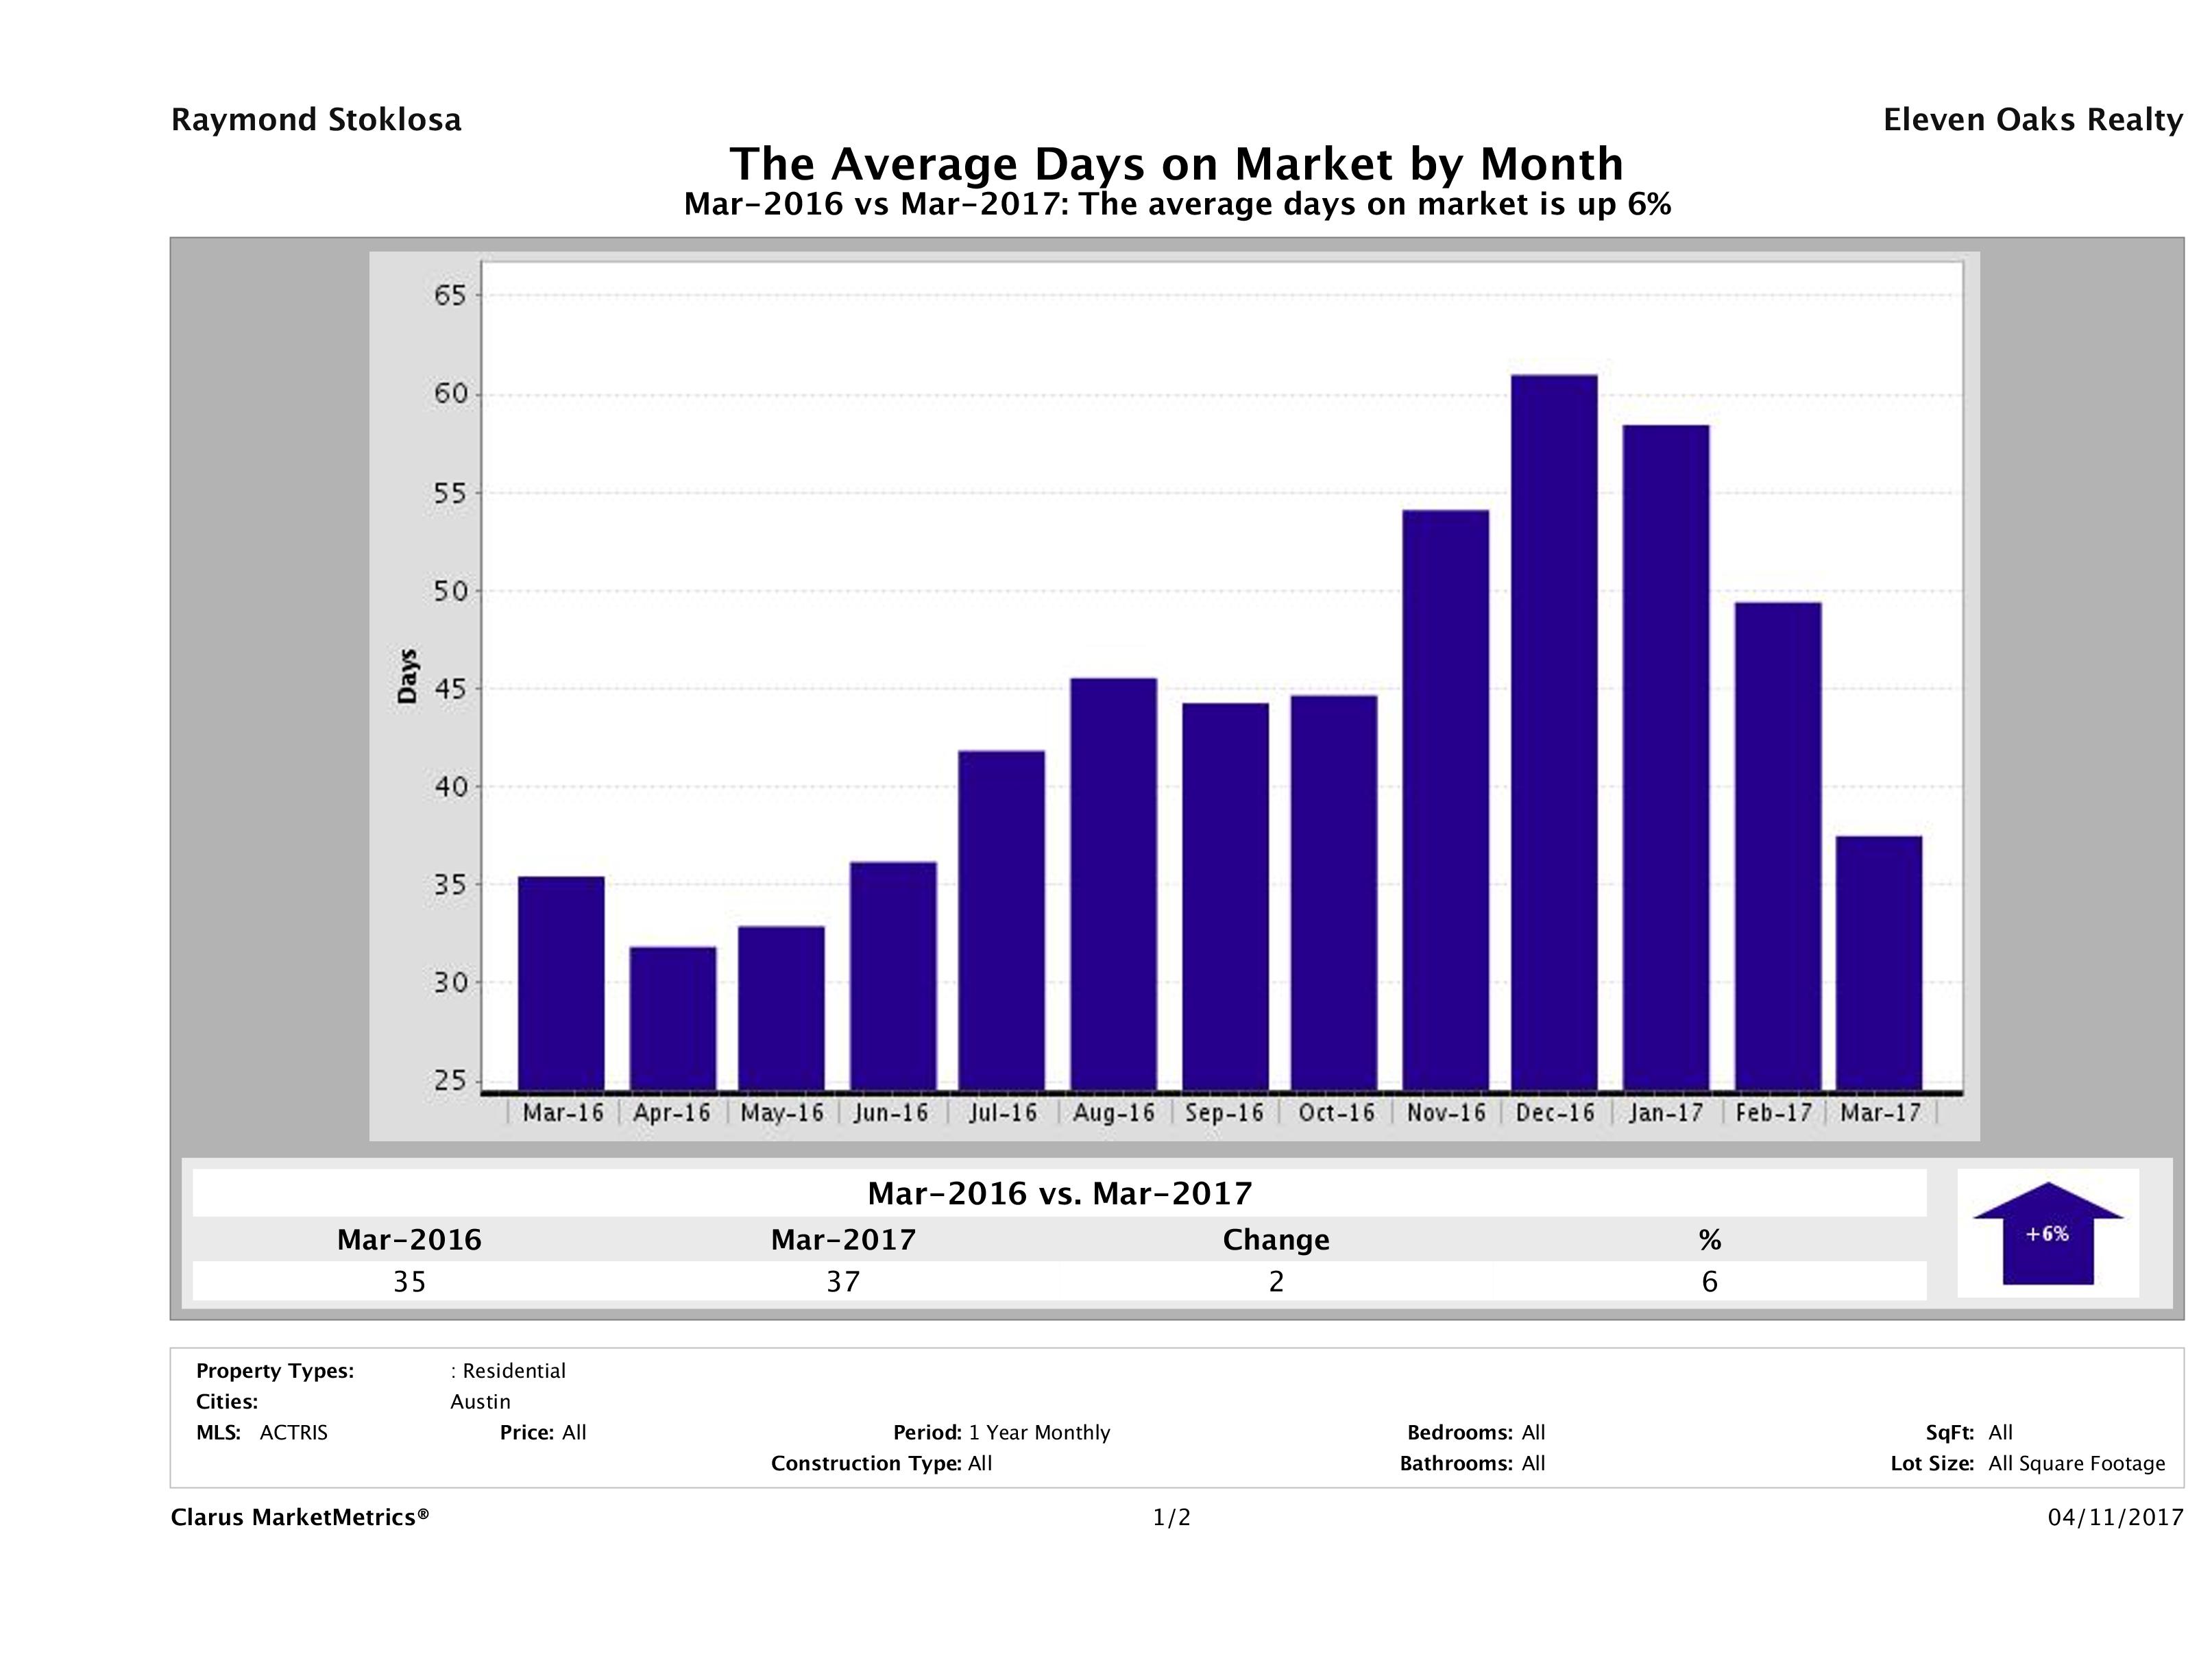
6% Increase in Time to Sell Home in Austin
In March 2017, it took 37 days to sell a home in Austin, on average, compared to 35 days in March 2016, marking an 6% (2 day) increase in year over year numbers.
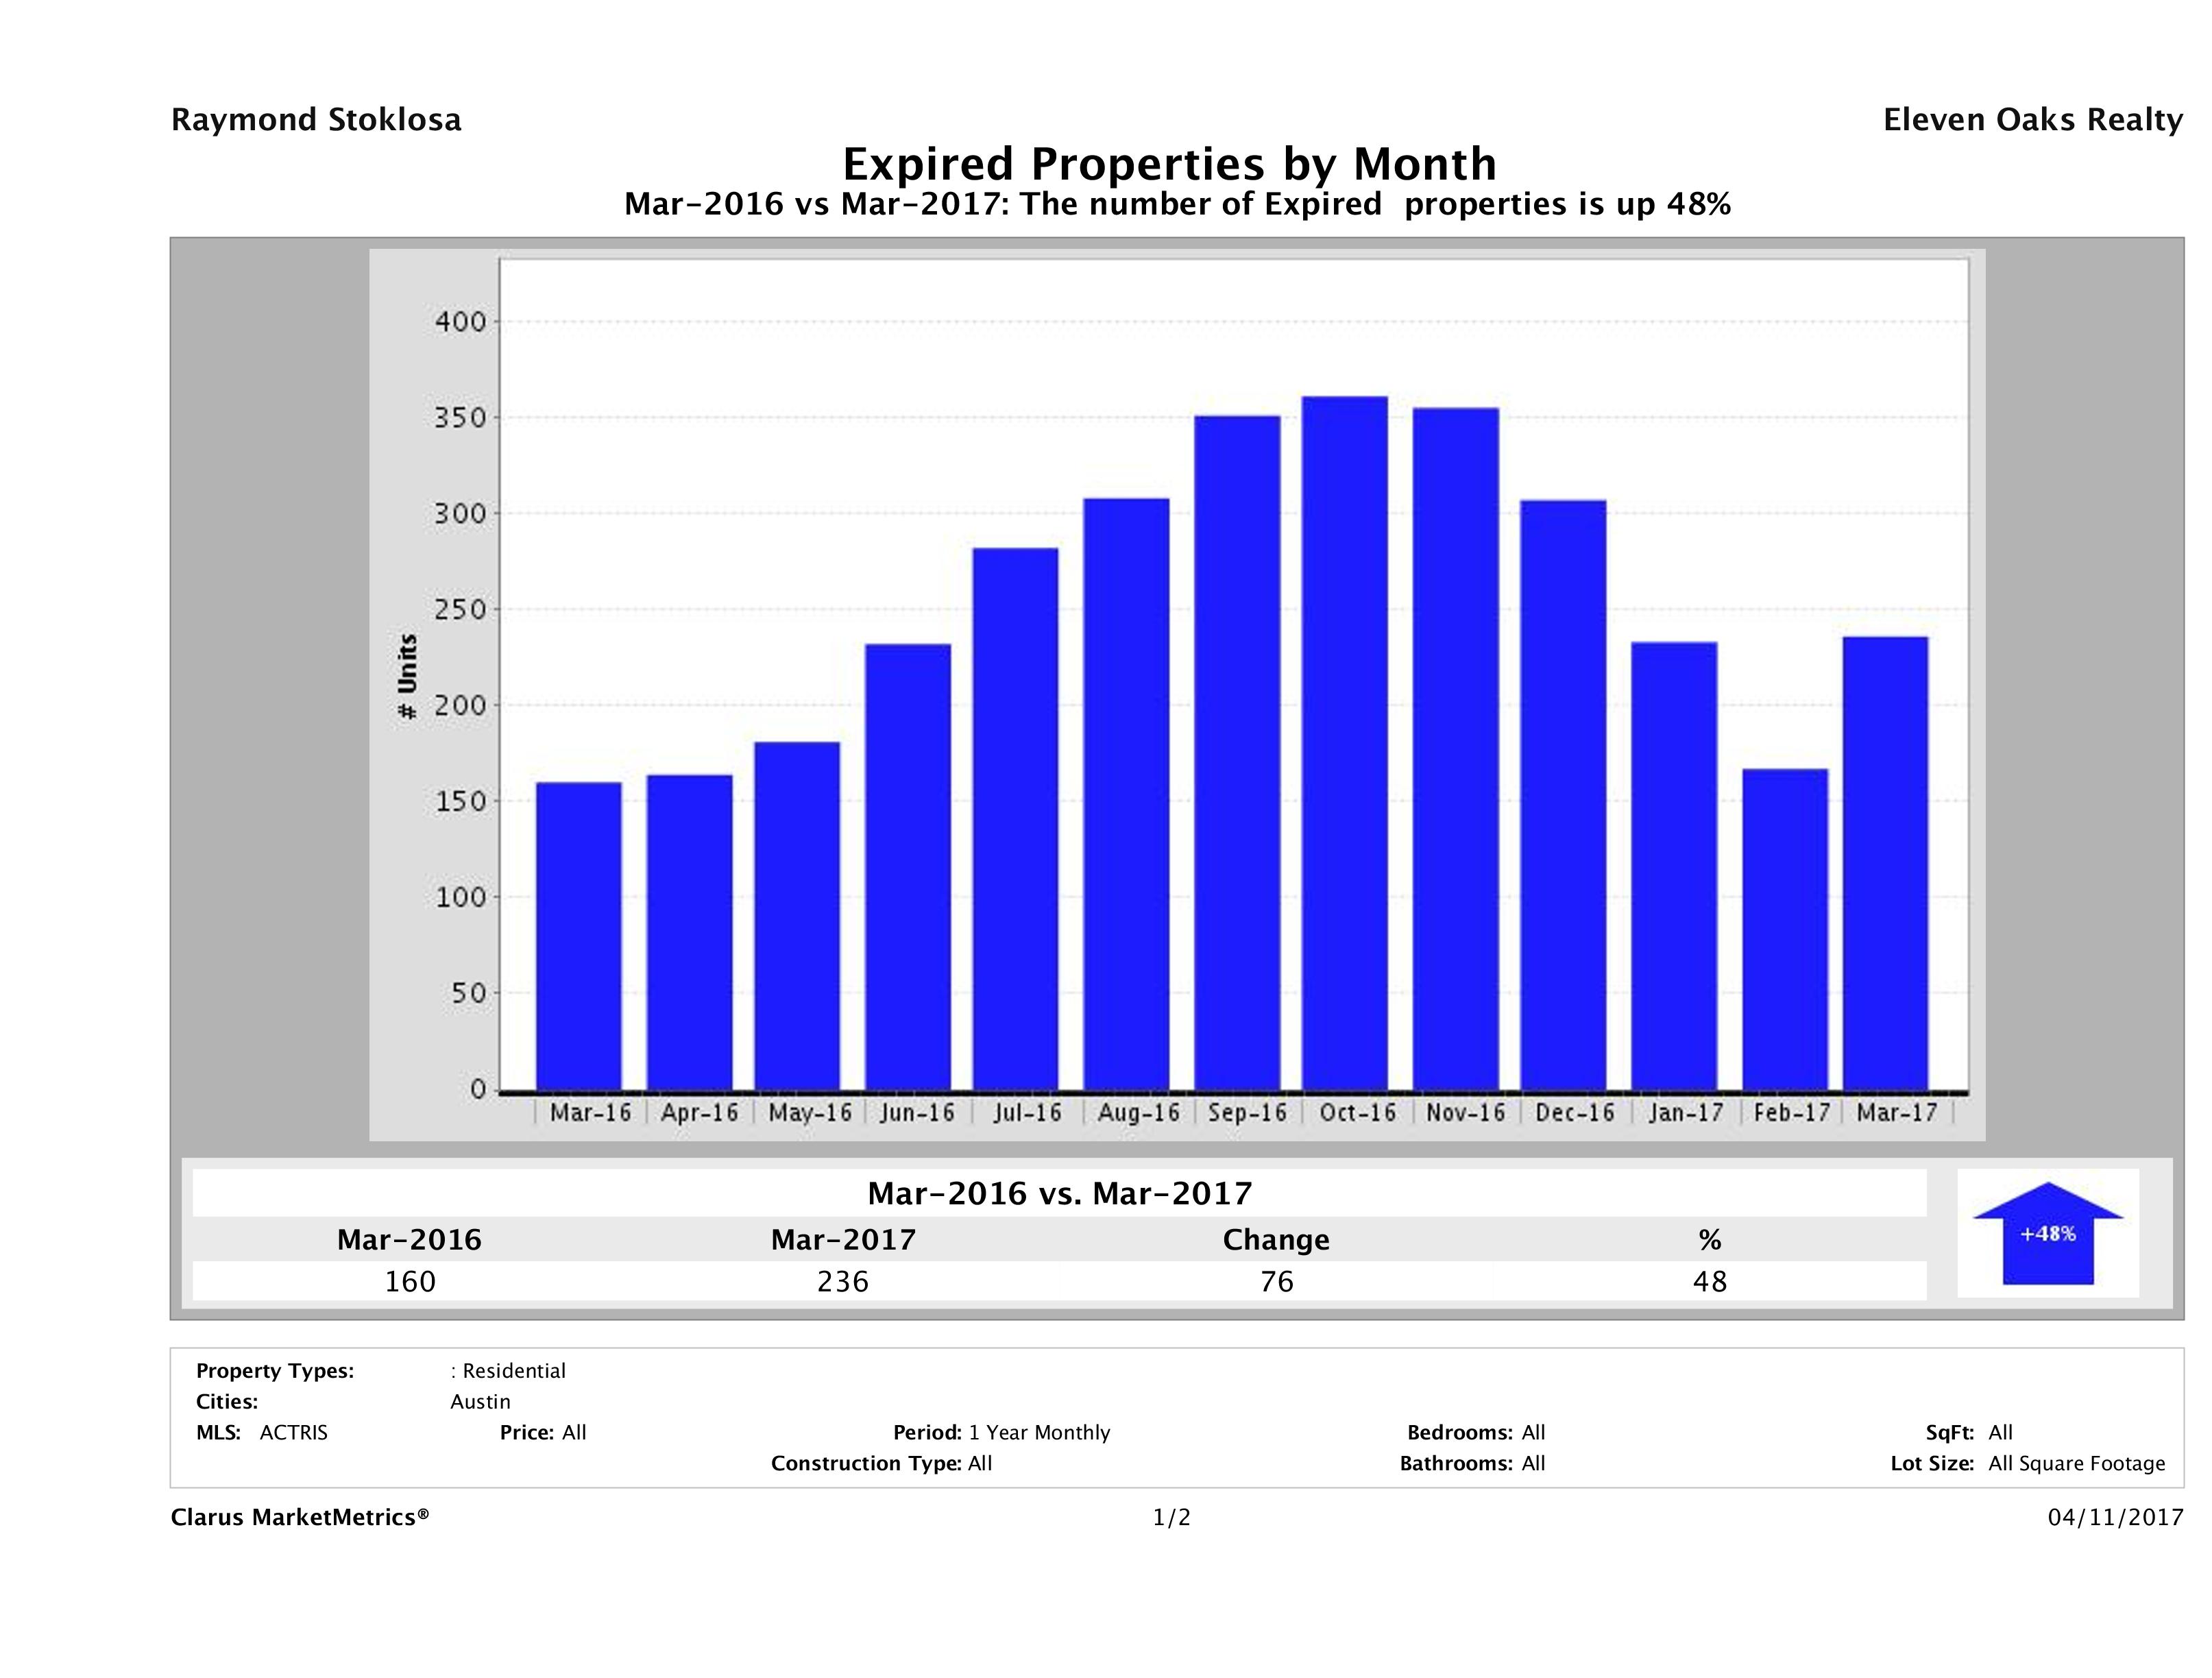
Number of Homes Taken Off the Market Up 48%
In March 2017, there were 236 homes taken off the market compared to 160 in March 2016. This marked a 48% (76 home) increase in year over year numbers. This trend of more homes taken off the market is something we’ve seen for several months in Austin. It seems that some sellers are unrealistic about what they can get for their homes and instead of reducing their prices to a market appropriate level, they decide to take them off the market. Though the Austin market is strong, it is still price sensitive. Buyers are willing to pay top dollar, but not for homes that they don’t feel are a value.
If you need to sell and your home was priced right, maybe there was something else going on. The biggest culprits we see are incorrect info in the MLS and poor marketing. Check out our Austin Home Marketing Plan to see how your homes would be marketed.
Having trouble selling your home? Check out our Austin Home Not Selling resources page to find out why.
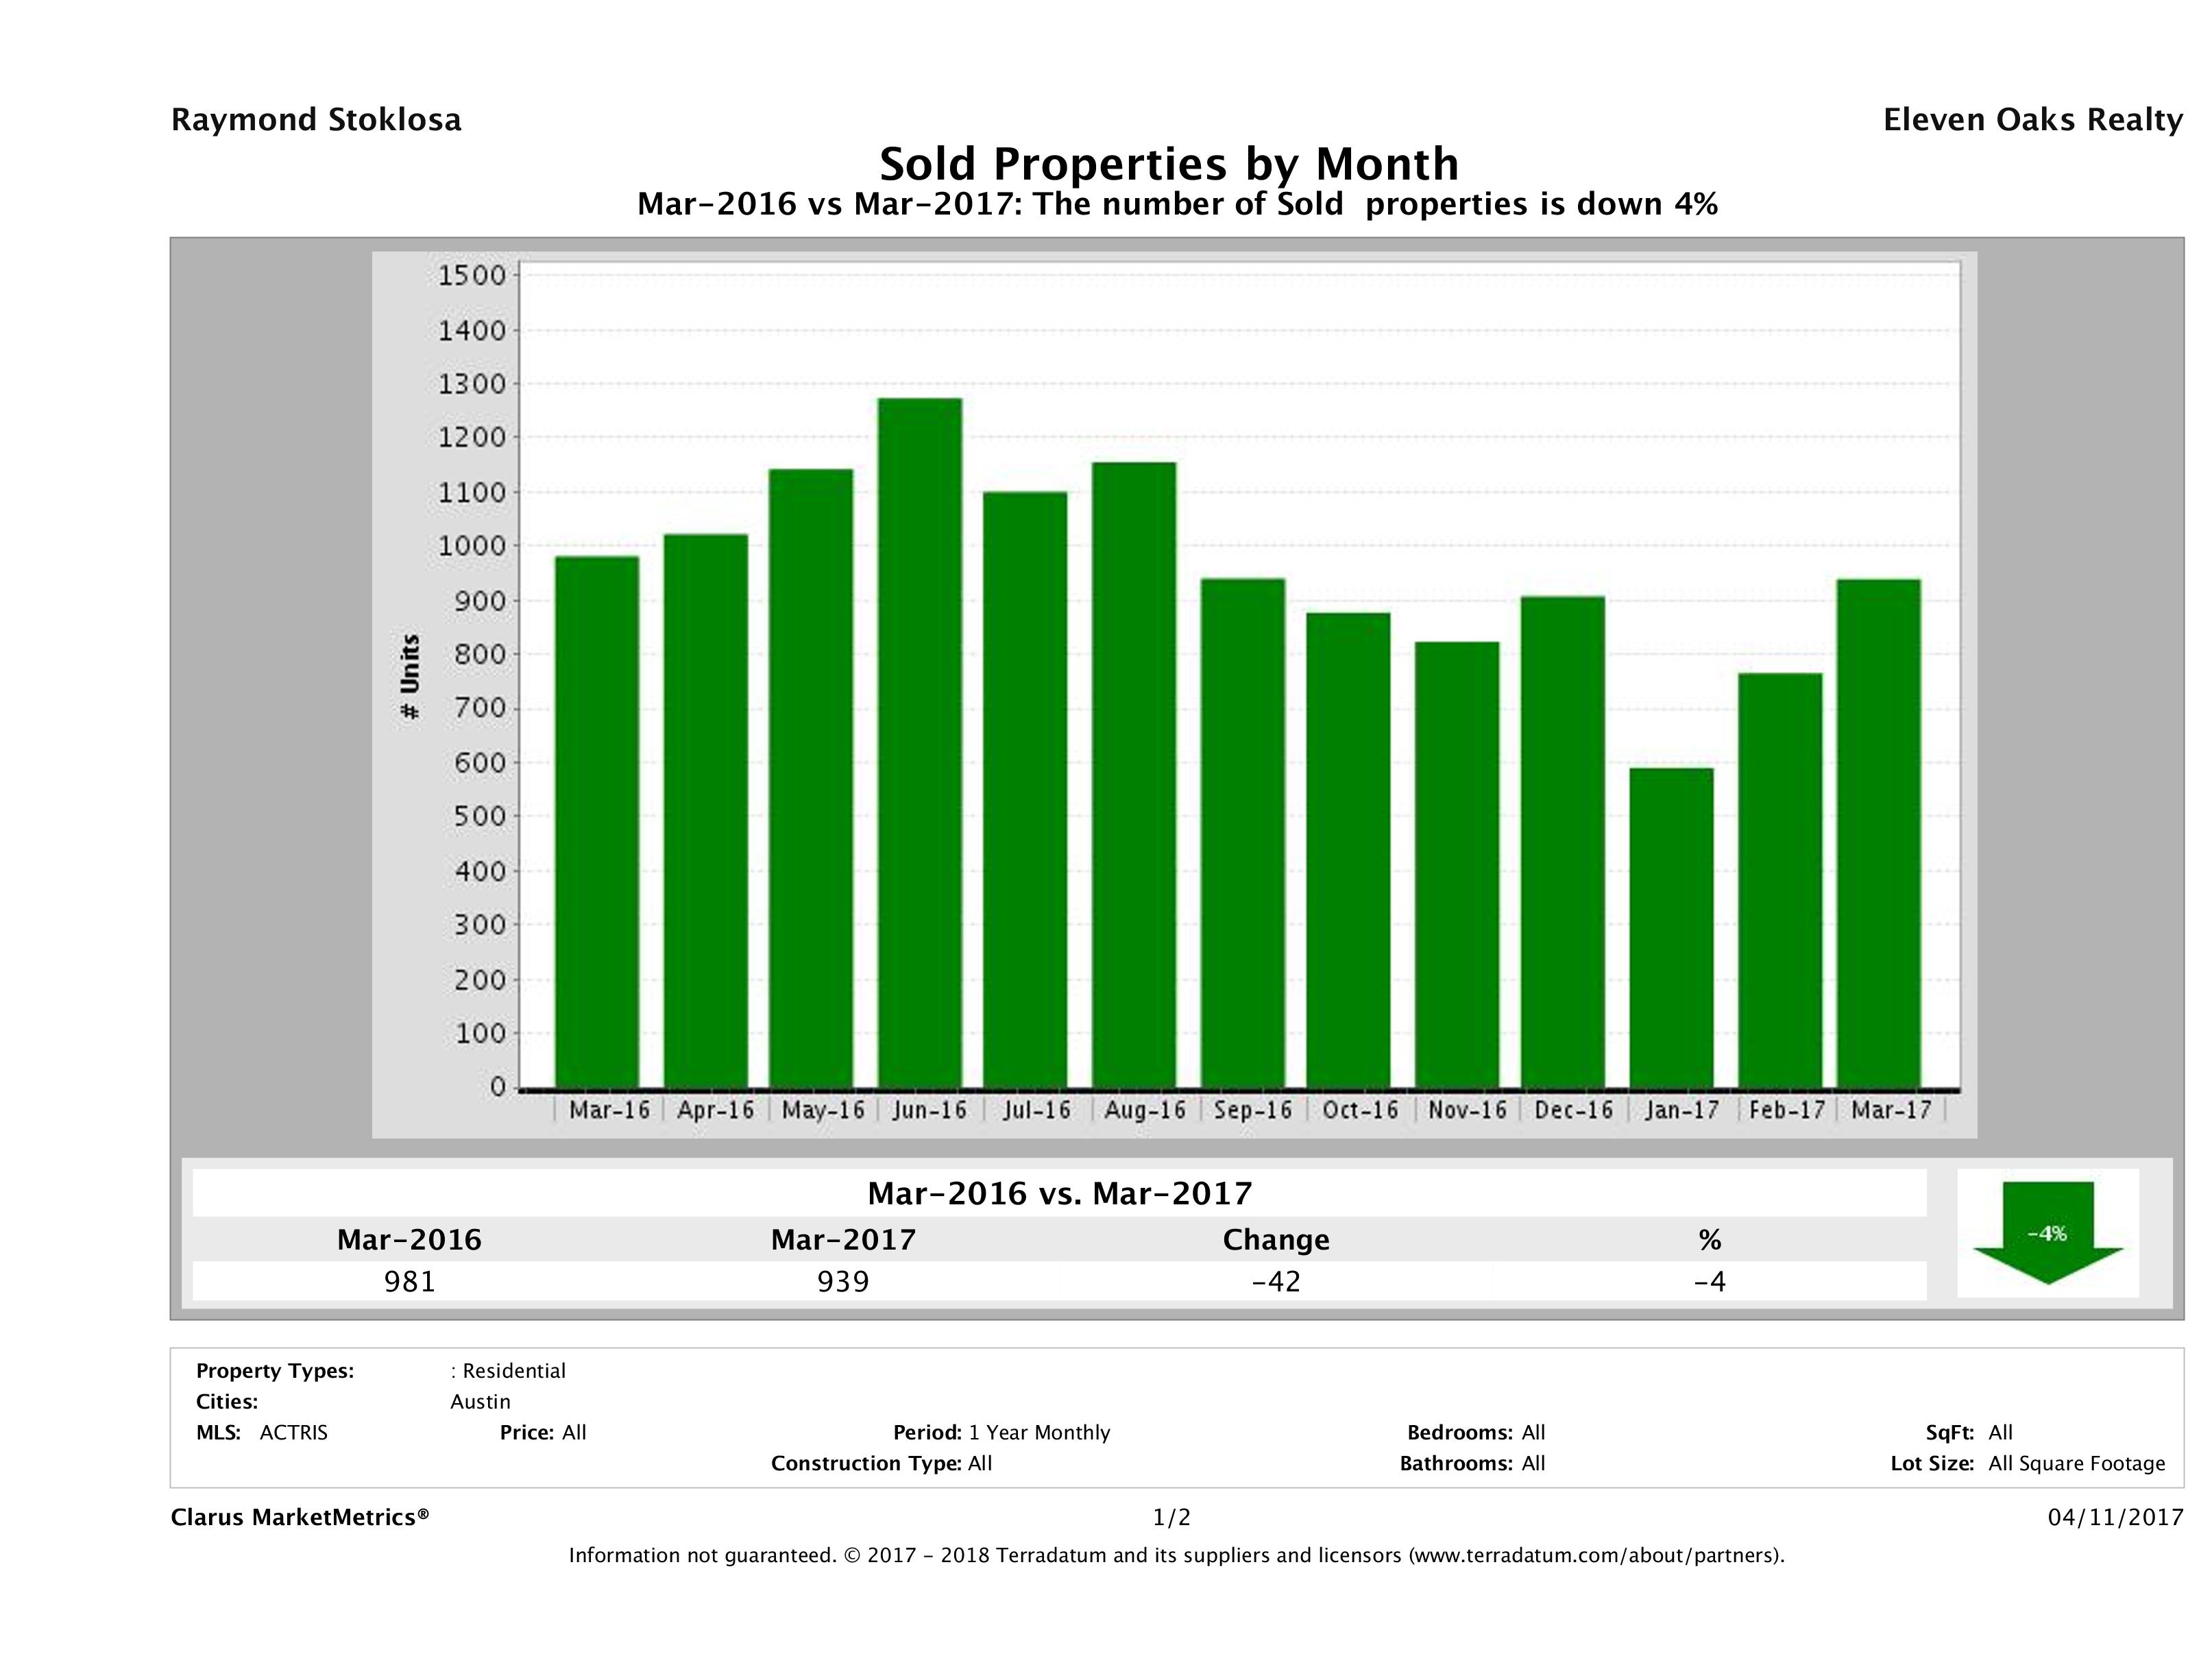
4% Decrease in the Number of Sold Homes in Austin
In March 2017, Austin saw a 4% decrease in the number of homes sold from March 2016 to March 2017. In March 2017, we saw 939 homes sell in Austin compared to 981 in March 2016 marking a 4% (42 home) decrease in year over year numbers.
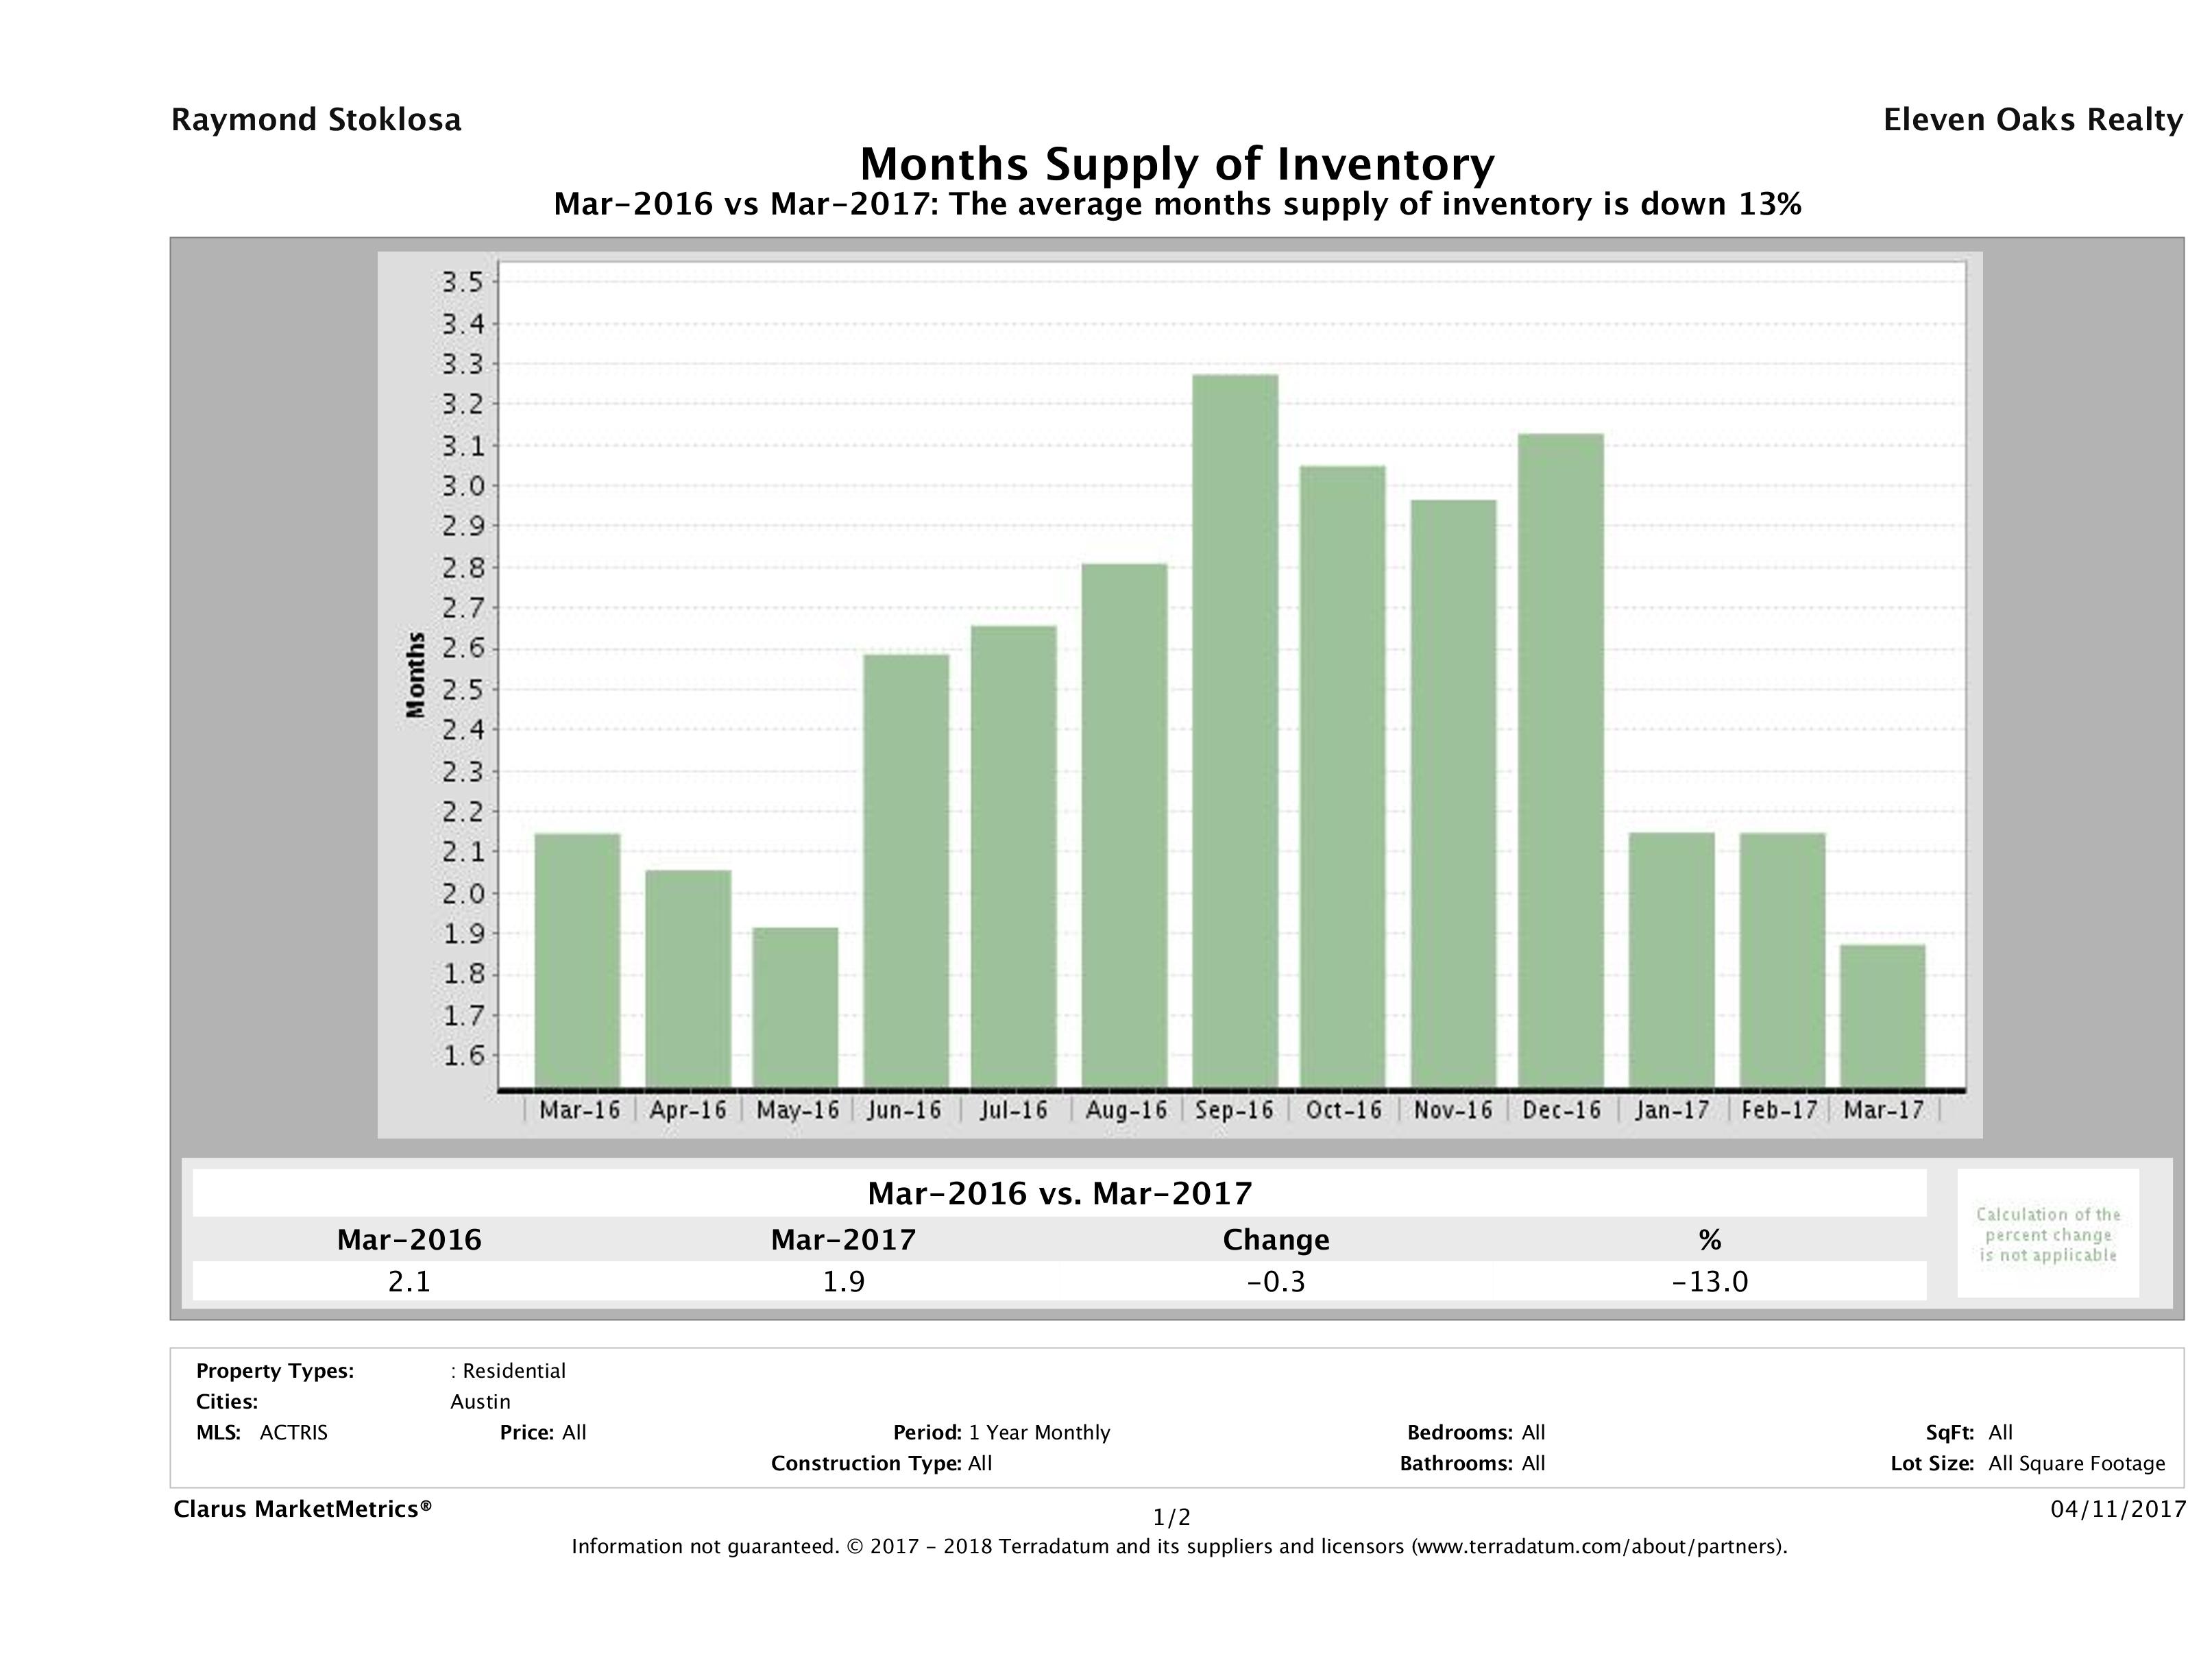
13% Decrease in Austin Housing Inventory
In March 2017, we saw 1.9 months of inventory on the market, compared to 2.1 months of inventory in March 2016, marking a 13% decrease in year over year numbers. For the past few months, we have seen a decrease in inventory. If this continues, we will have extremely low inventory levels when the busy Spring market hits.
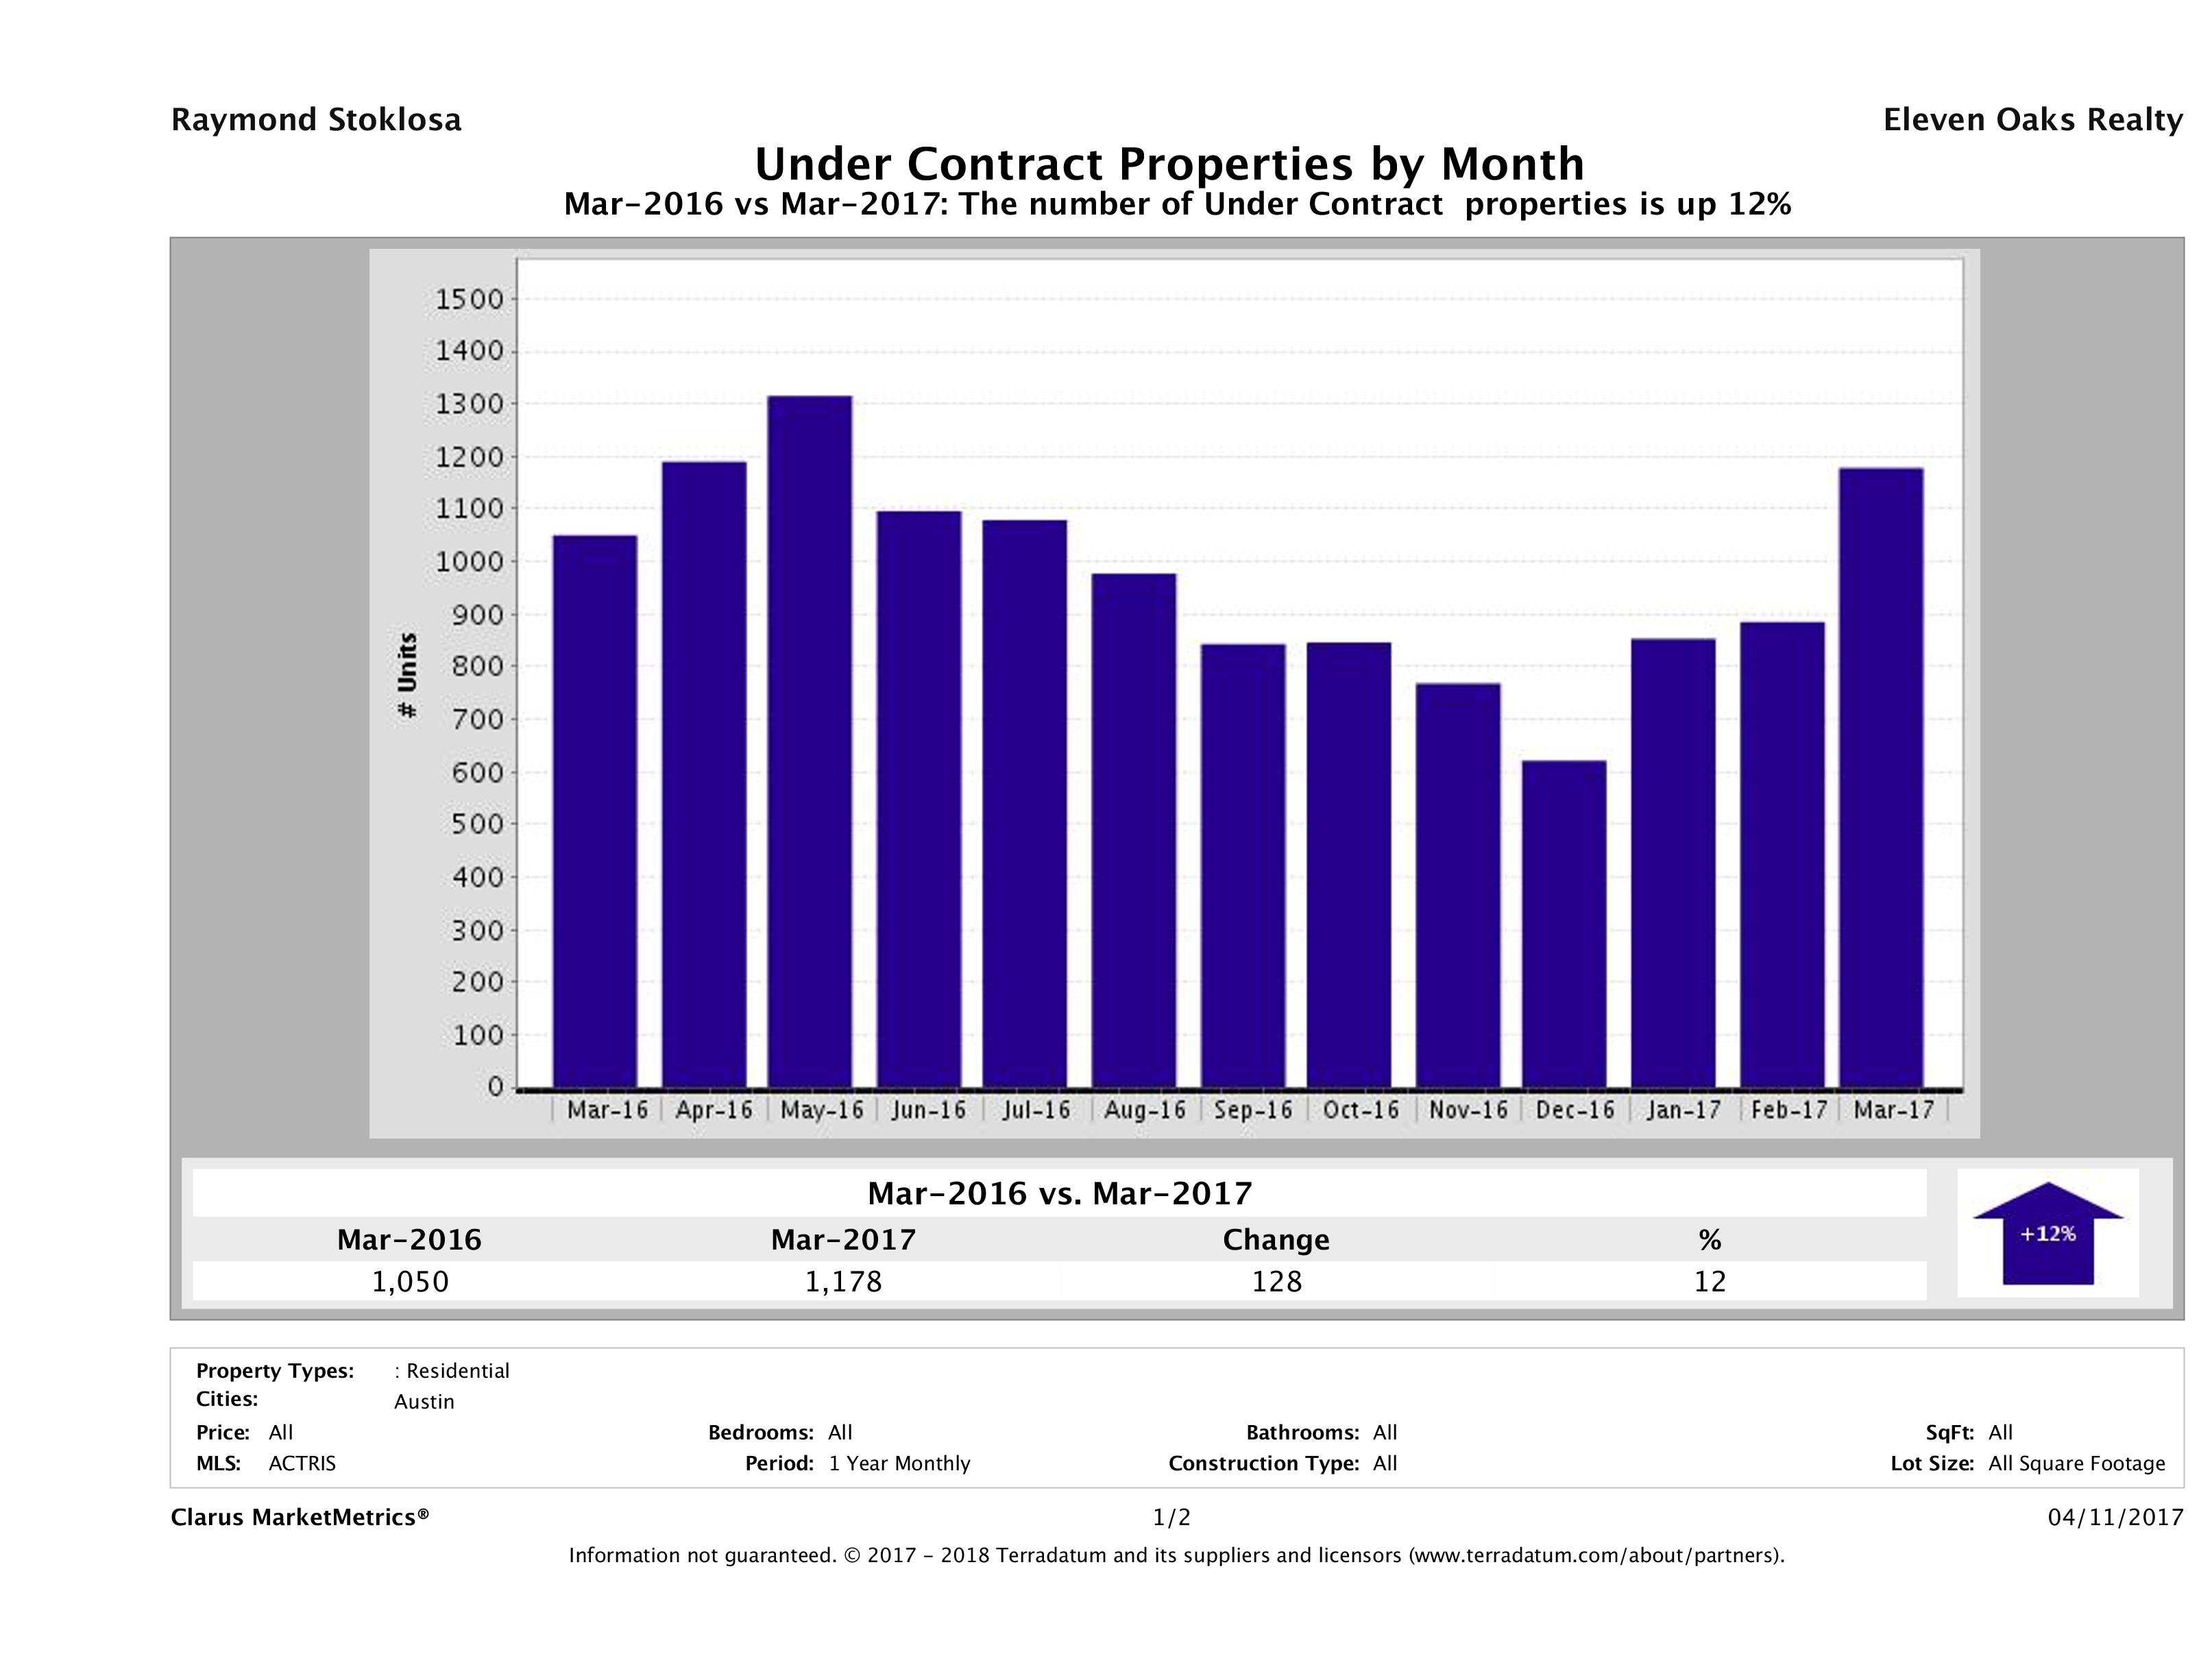
Austin Homes Under Contract Up 12%
In March 2017, 1,178 homes went pending (under contract) in Austin compared to 1,050 in March 2016, marking an 12% (128 home) increase in year over year numbers. As we’ve seen in the market, March was an active month for Austin real estate.
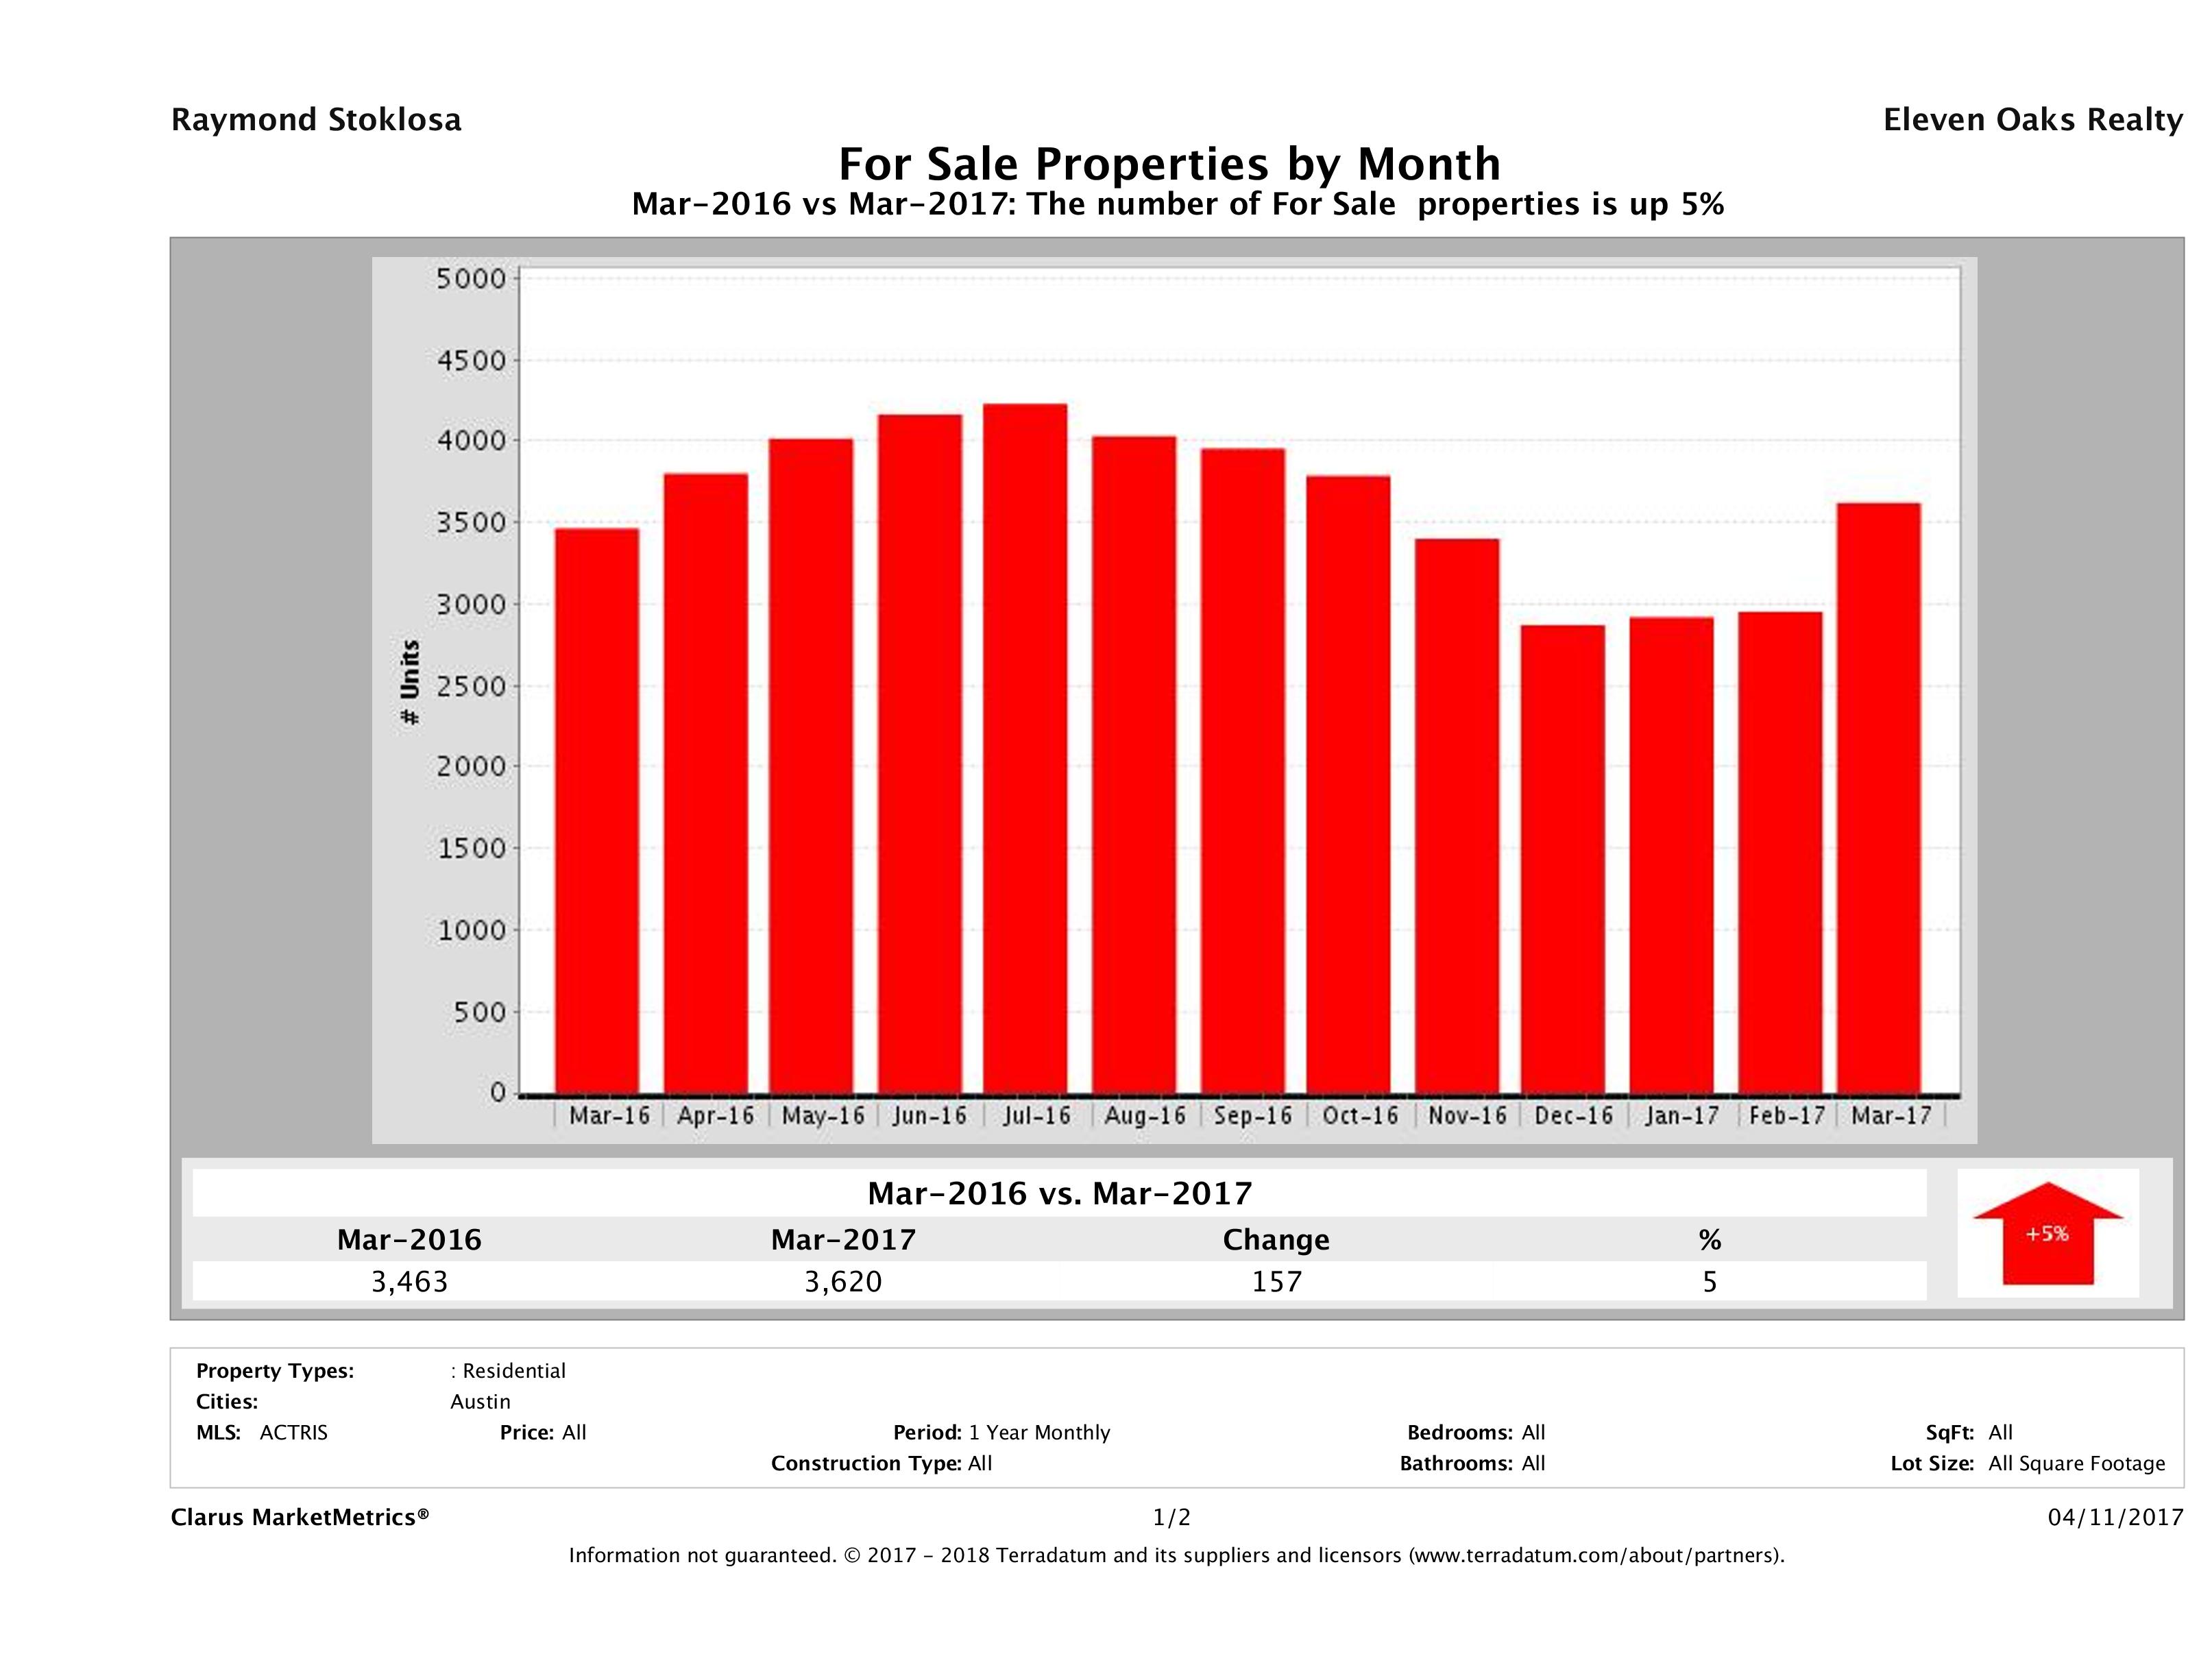
5% Increase in Number of Homes on the Market
In March 2017, we had 3,620 homes for sale in Austin, compared to 3,463 in March 2016, showing a 5% (157 home) increase in year over year numbers.
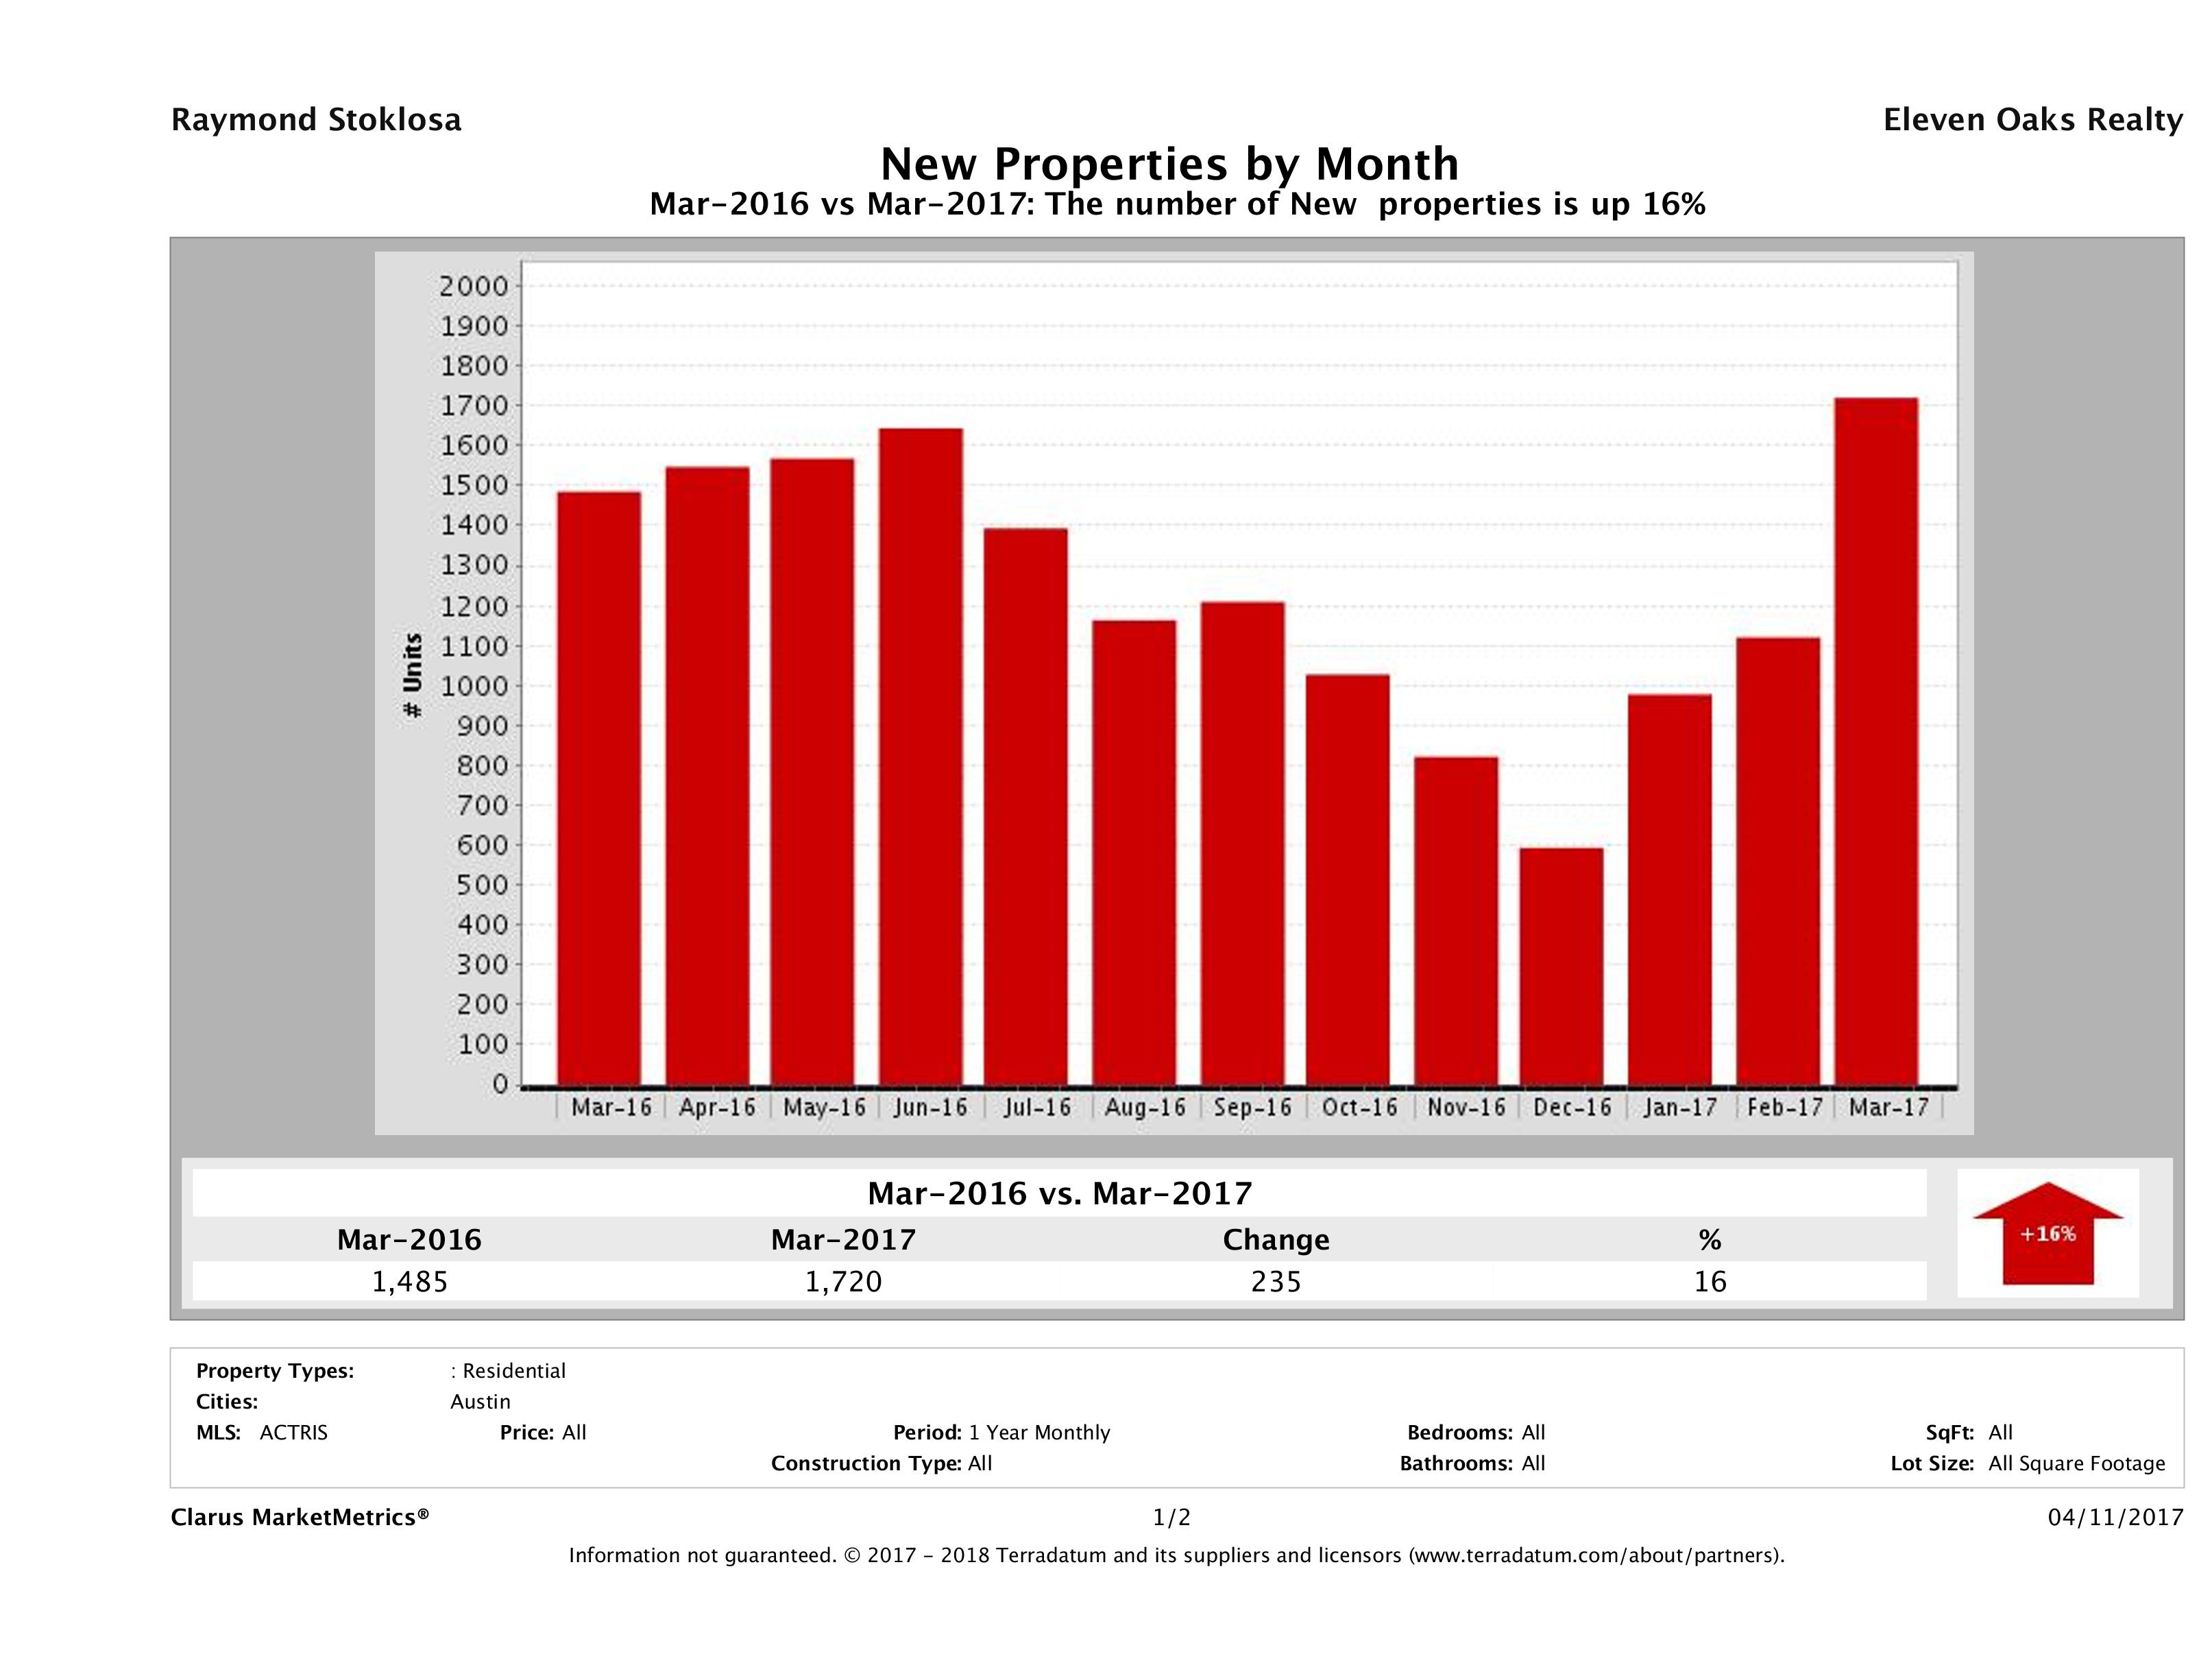
16% Increase in Number of Homes Listed for Sale
In March 2017, we saw 1,720 homes introduced to the market compared to 1,485 in March 2016, a 16% (235 home) increase in year over year numbers. This is the big jump in listings we’ve been expecting to see come online.
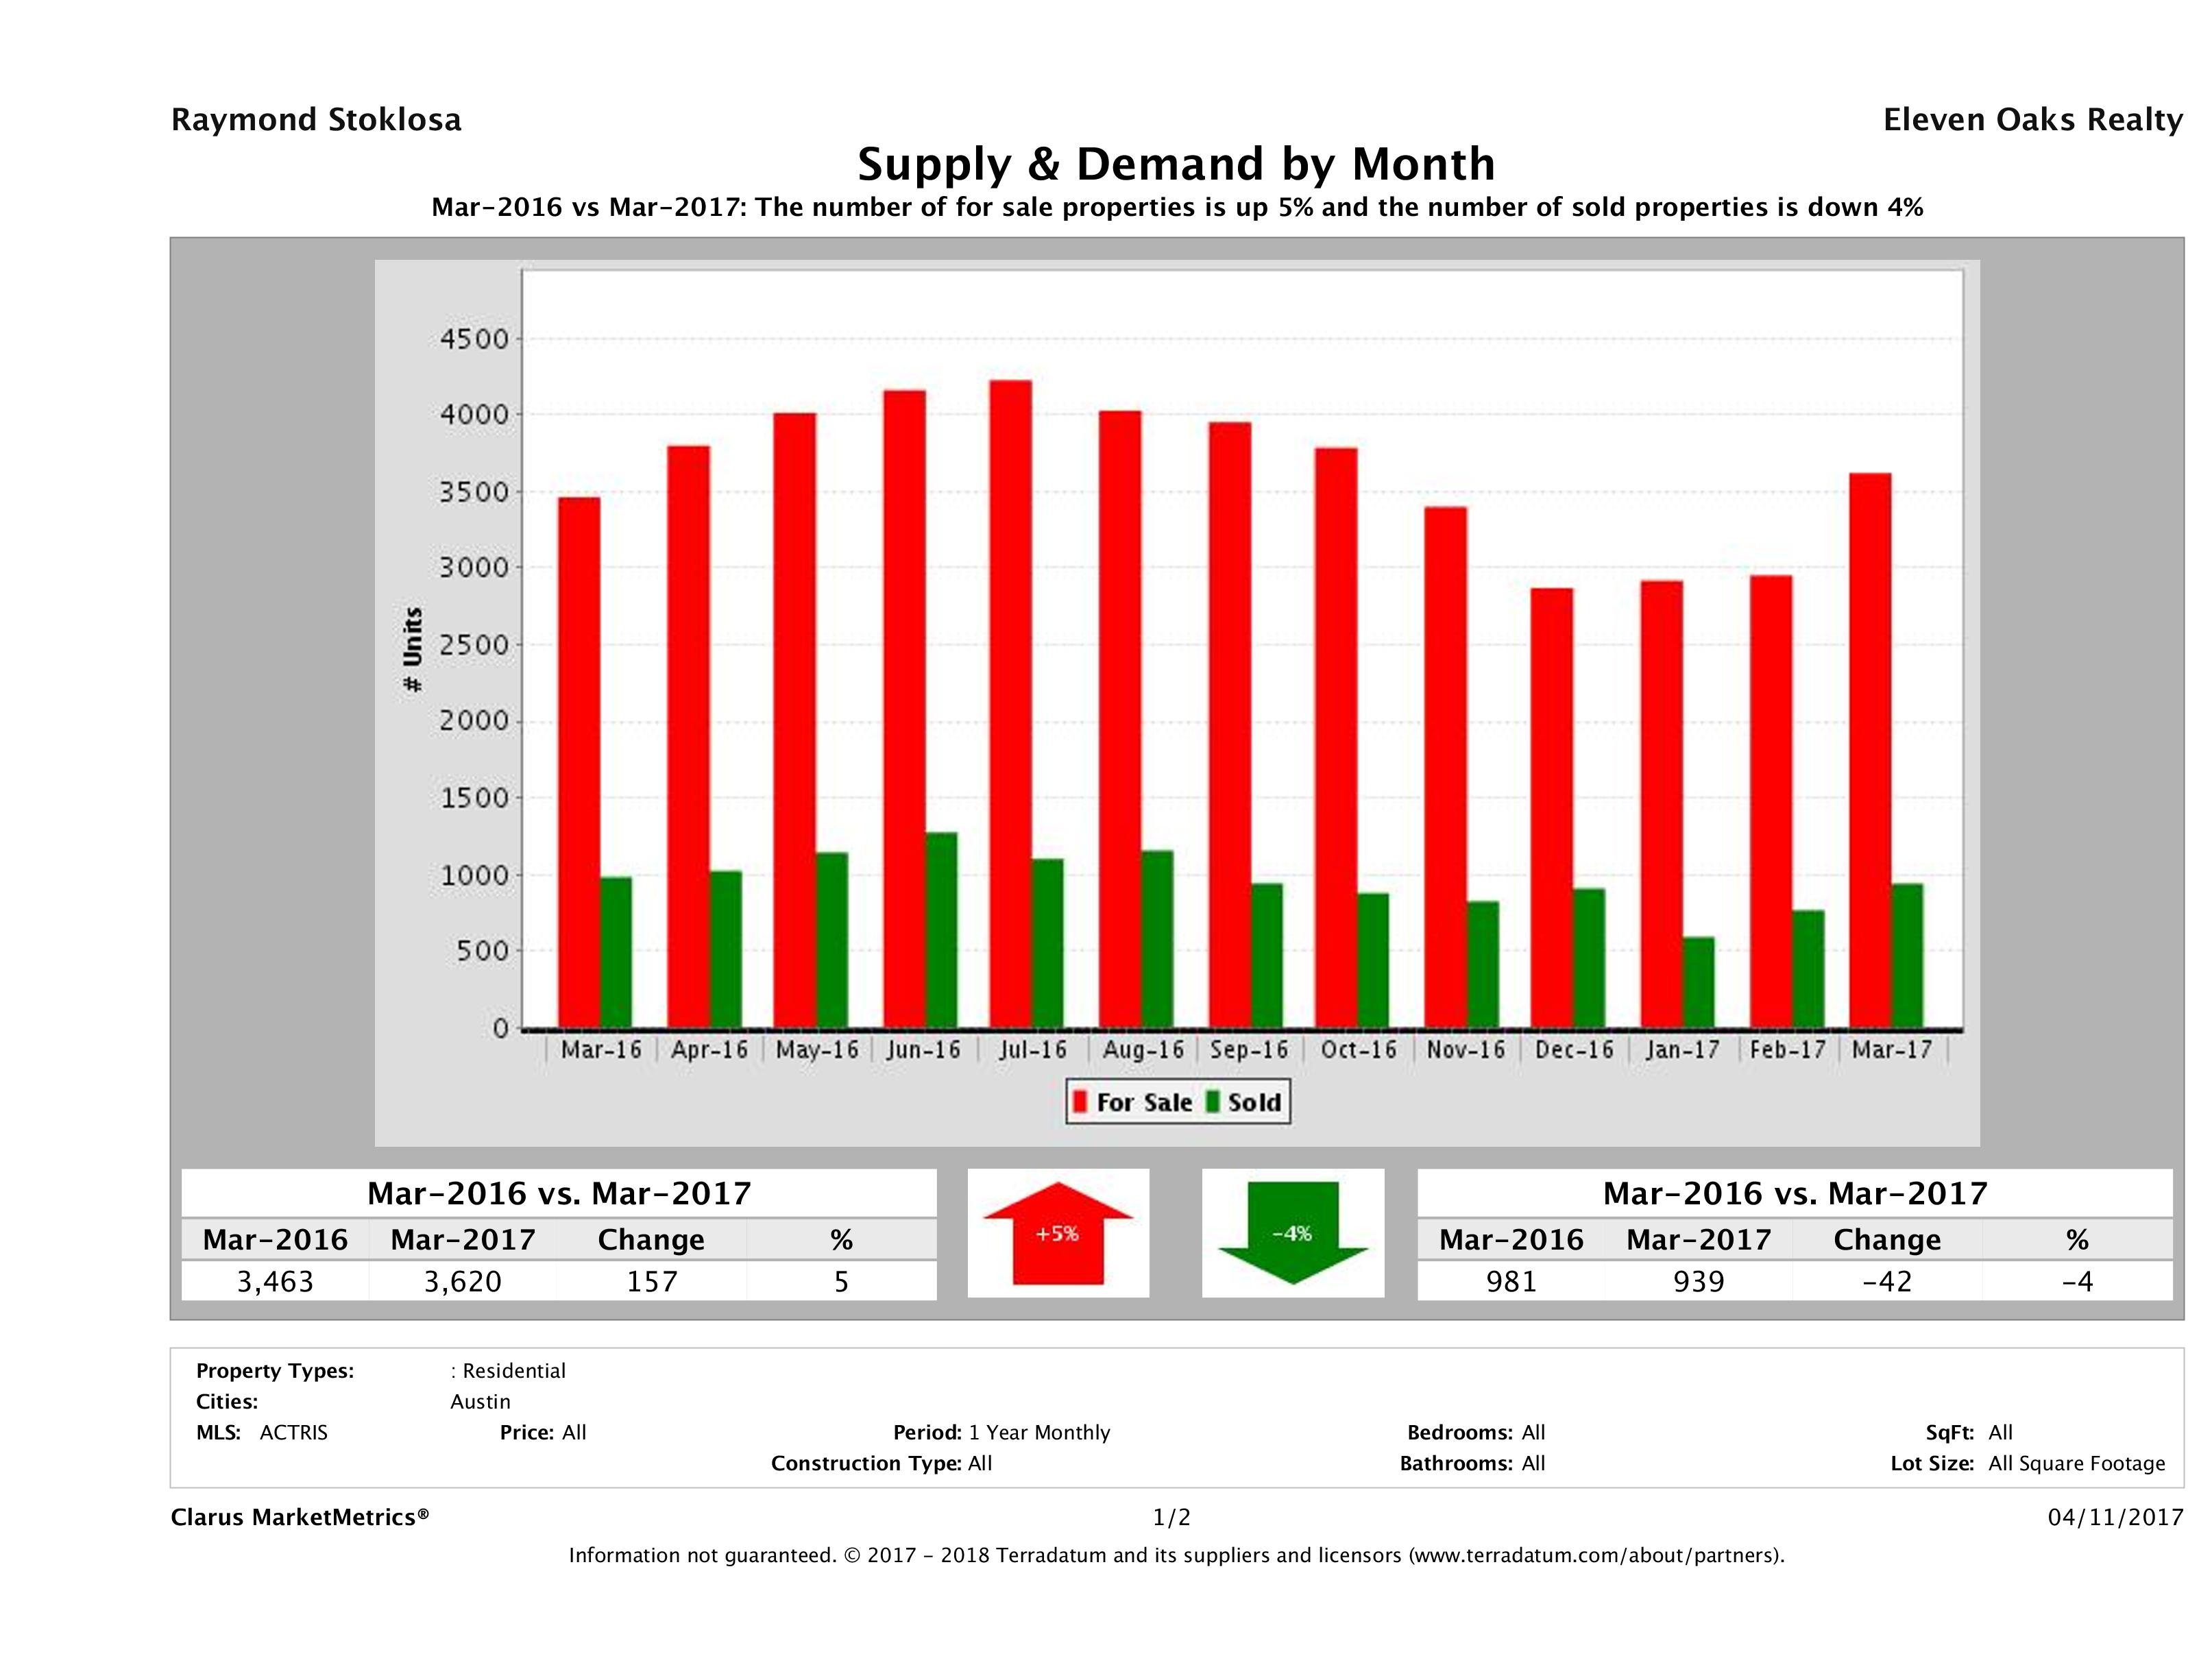
Supply Up 5% and Demand Down 4%
This month we saw a 5% increase in supply (number of properties for sale) and a 4% decrease in demand (number of sold properties). We expect that as spring progresses, more buyers will enter the market and demand will catch supply.
Median for Sale Up 9% vs Median Sold Price Up 8%
This chart compares the Median for Sale Price vs the Median Sold Price to show their relationship. In Austin, we saw a 9% increase in the median for sale price and a 8% increase in the median sold price of a single family home in year over year numbers.
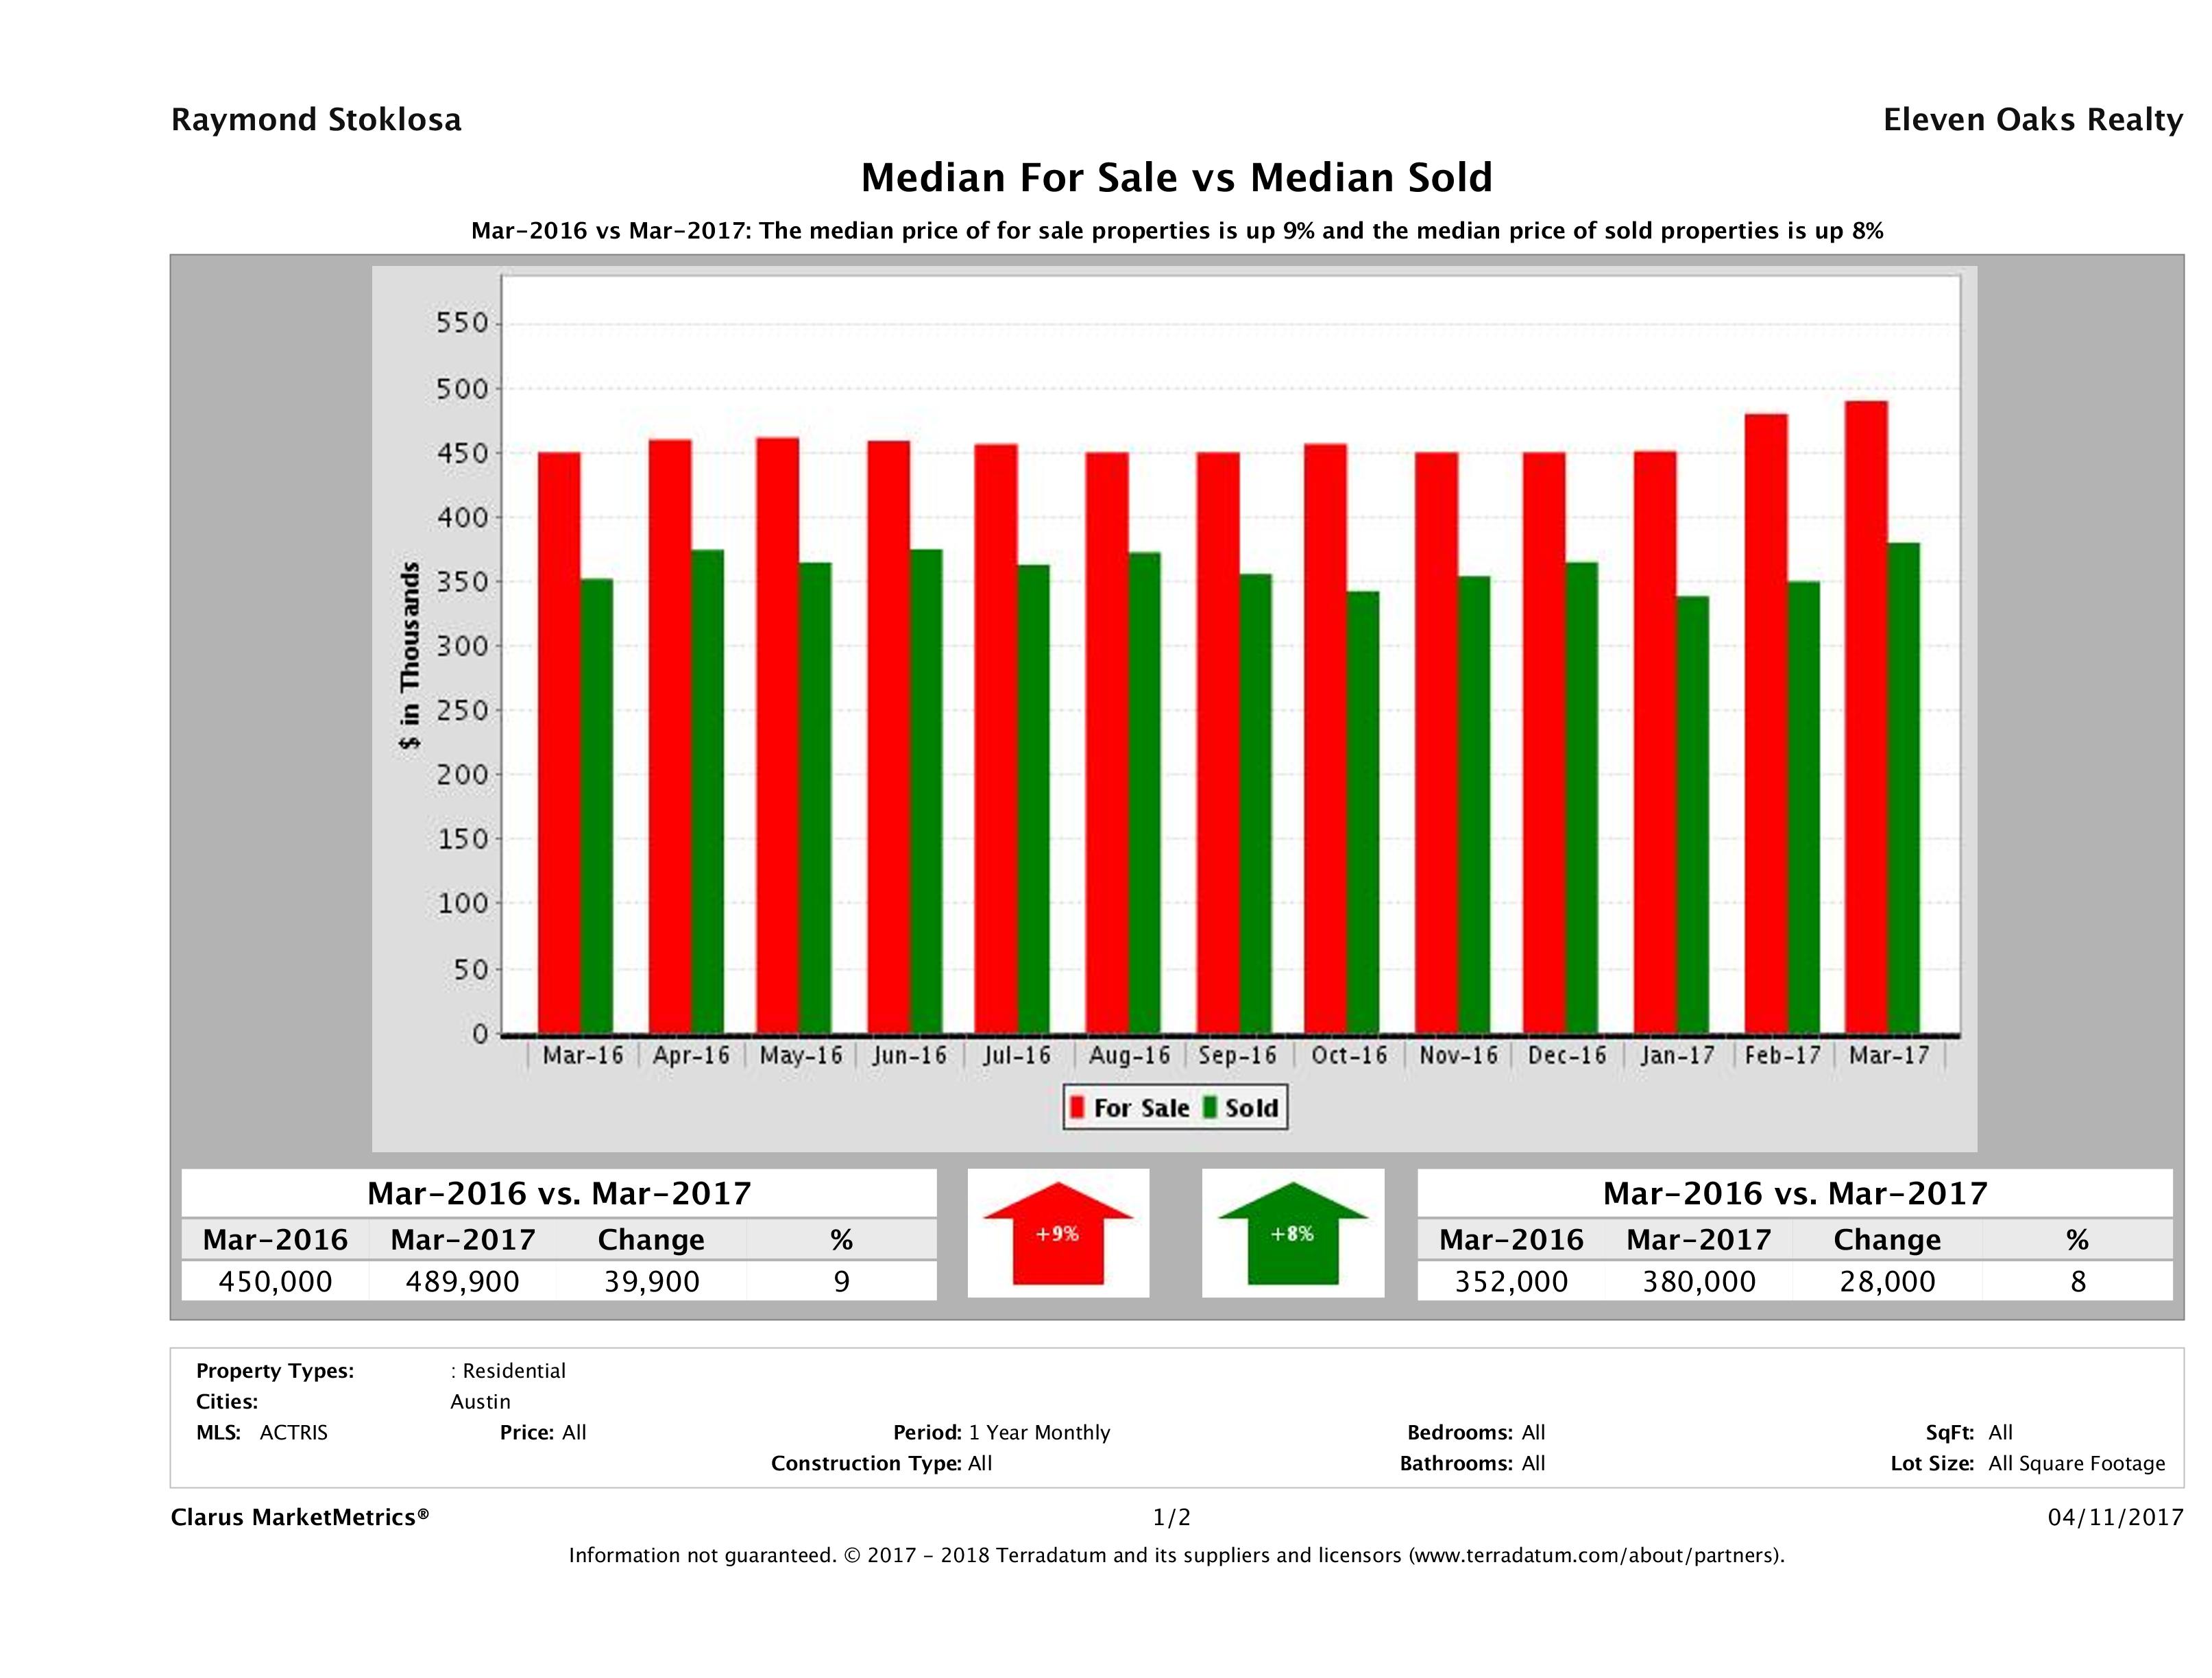
Source: Clarus Market Metrics, ACTRIS Sold Data
March 2017 Austin Real Estate Price Report – Strictly Numbers
For those of you who prefer to see the actual numbers, we’ve included the figures for March 2017 Austin home sales below. The most expensive home that sold in March 2017 sold for $3,870,000 and the least expensive home sold for $45,000. Homes ranged in size from 356 sqft – 7,812 sqft with an average size of 2,231 sqft. The average price per square foot for a home that sold in Austin in March 2017 was $217.23 with the lowest being $45.00/sqft and the highest being $856.74 /sqft. It took, on average, 51 days to sell a home in Austin and sellers received, on average, 97.43% of their original list prices.
| Beds | Baths | SqFt | List Price | LP/SqFt | Sold Price | SP/SqFt | SP/LP | SP/OLP | ADOM | |
|---|---|---|---|---|---|---|---|---|---|---|
| Min | 1 | 1 | 356 | $50,000 | $50.00 | $45,000 | $45.00 | 44.44% | 27.78% | 0 |
| Max | 6 | 9 | 7,812 | $3,995,000 | $983.15 | $3,870,000 | $856.74 | 121.52% | 542.56% | 864 |
| Avg | 3 | 3 | 2,231 | $477,868 | $221.23 | $468,518 | $217.23 | 98.48% | 97.43% | 51 |
| Median | 3 | 3 | 2,029 | $389,000 | $189.45 | $380,000 | $187.46 | 98.87% | 98.01% | 15 |
| Search Criteria | |||
|---|---|---|---|
| Status | Sold | Sold Date | Mar-17 |
| Property Type | Single Family Homes | Number Sold | 949 |
| Source: | ABoR Sales Data | Area | Austin |
Time to Buy? Sell?
As we always say, the best time to buy or sell a home is when you need to buy or sell. If you have a house to buy, buying when its a sellers market may hurt you on the buying end, but you’ll make it up on the selling end. If you’re trying to get into the market for the first time, the only way you’ll know that we’ve “hit bottom” is when its in the rear view mirror. Work with professionals who can help you analyze your financial and lifestyle to determine if now is the right time to buy or sell.
Looking strictly at the numbers, it appears the recommendation for this month is – it’s time to sell. With supply up 1% and demand up 10%, buyers have limited choices. Though time to sell is up 11%, buyers are willing to pay, on average, 6% more than they were last year. If you’re a seller who needs to sell now, work with a professional Realtor who can help you position your home as the best value on the market. There are still highly motivated buyers in the market who are ready to make stronger offers than they were last year. With 2.0 months of inventory, we are still in a seller’s market. Check out our 88 Ways to Sell Your Home Faster and For More Money for some tips on how you can prepare your home to meet the market. For more info about our Home Selling Program and why it is the best in Austin, check out Sell My Austin Home.
If you’re looking to buy, the sooner you get started, the better chance you’ll have at getting a good deal. The Spring market will be here before you know it. With that comes multiple offers and overbids. Though demand is up, we would expect it to go up even more in March and April. Start your search now and find a home before you have more competition. If you’re looking to buy, we can help you be successful, even in this competitive market. We know the market and know how to get the best deal for a buyer. For more info about buying a home, visit Buy a Home in Austin.
Curious How Much You Could Sell Your Austin Home For?
Our Market Snapshot Tool is for you. With just your zip code, we’ll email you a detailed report showing what homes in your neighborhood sold for, how long it took to sell and how the market is trending. Though our Austin Real Estate Price Report is helpful in gauging the overall trend of the market, it doesn’t address neighborhoods specifically. If you’re looking for that type of report, put in your name and zip code below and our system will email you a Neighborhood Market Report.
Questions About the Austin Real Estate Price Report?
Do you have questions about this Austin Real Estate Price Report? Call us at (512) 827-8323 or email us at info@11OaksRealty.com and we’ll help you in any way we can. If you’re looking to buy or sell Austin real estate, don’t forget to check out our Buyer Resources and our Seller Resources for more tips.
Leave a Reply