
Eleven Oaks Realty is proud to present their January 2015 Leander Real Estate Price Report measuring activity in the Leander single family home market.
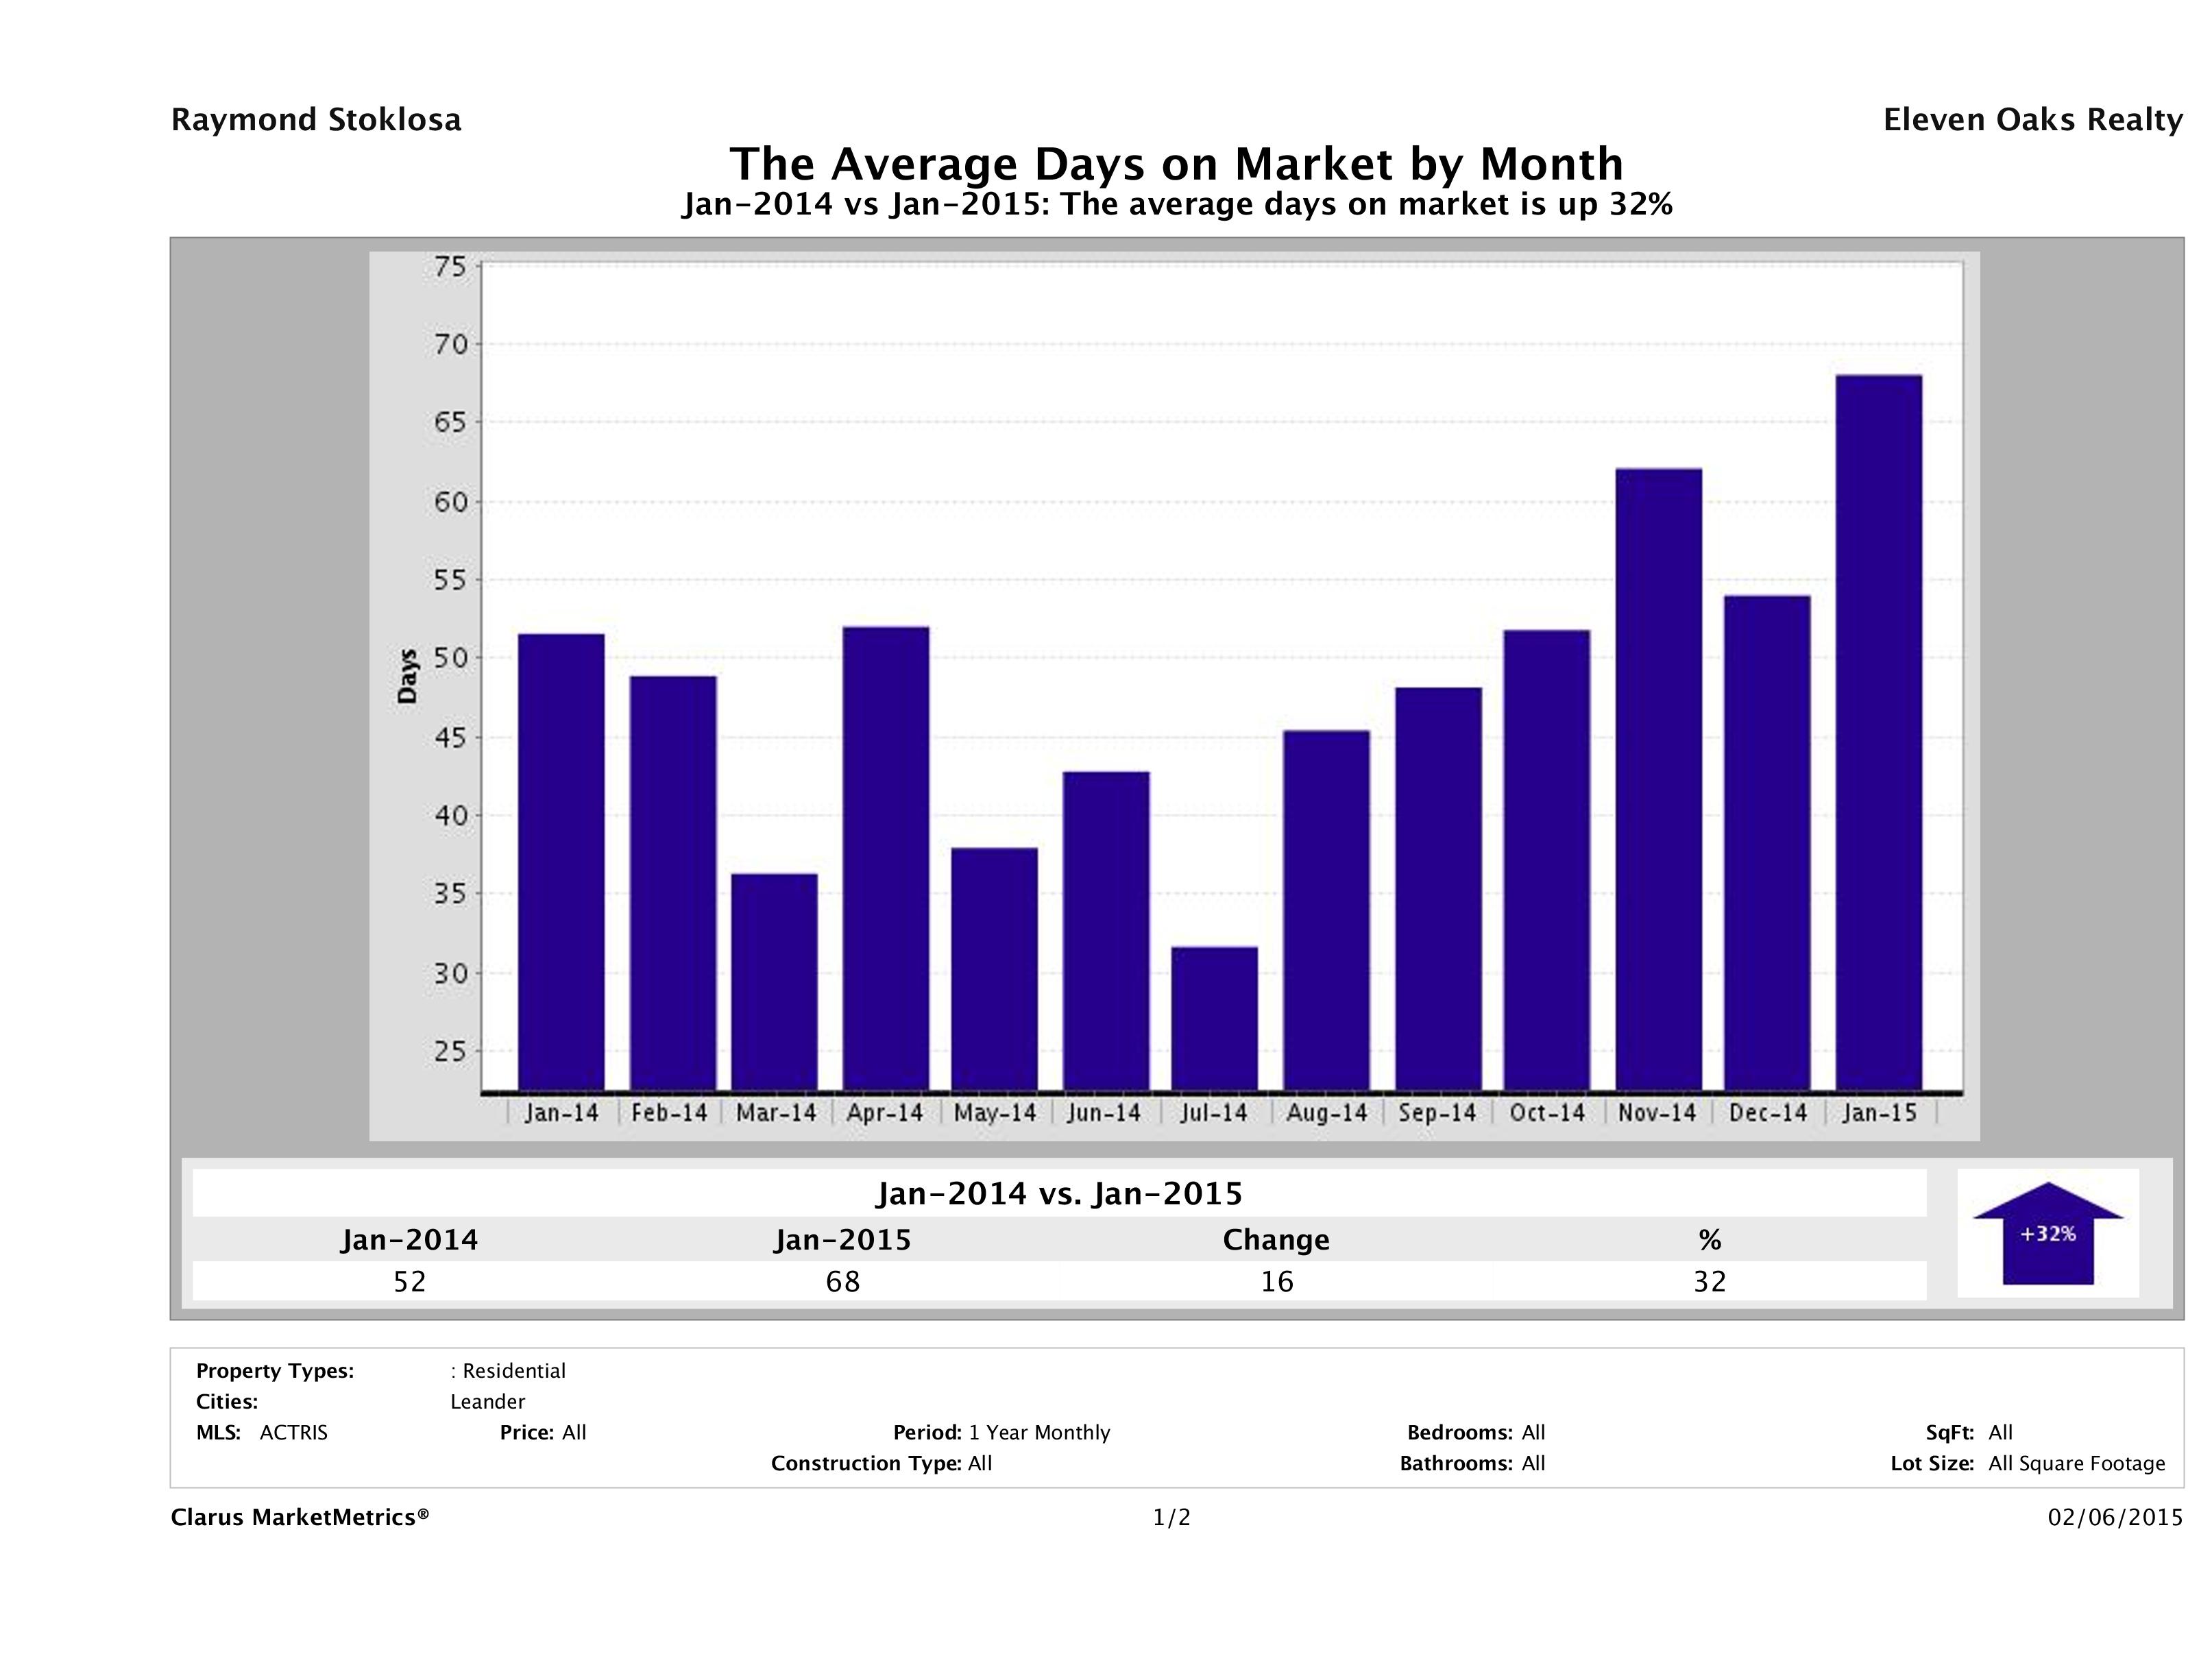
Time to Sell Home in Leander Up 32%
The biggest story in this month’s Leander Real Estate Price Report comes by way of time to sell. In January 2015, it took 68 days to sell a home in Leander, on average, compared to 52 days in January 2014, marking a 32% (16 day) increase in year over year numbers. What makes this data point interesting is it took nearly 30% longer to sell a home in Leander in January than it did in December. Usually we see the opposite. It could just be a fluke, but it could also be a sign of a slower Spring.
What does this mean to buyers? Buyers looking to buy a home in Leander have more time to make a decision than this time last year. Even though the average time to sell is longer, I wouldn’t recommend putting your home search on the back burner. The best homes are still selling quickly. If this increase in time to sell is just a fluke, you’ll want to buy as early in the Spring season as possible as that’s when demand starts to pick up and prices are usually soon to follow.
What does this mean to sellers? If you’re thinking about selling, have some patience. Buyers are still willing to pay slightly more than they were last year, which is a promising sign. Although it might take longer to sell, the wait might be worth it.
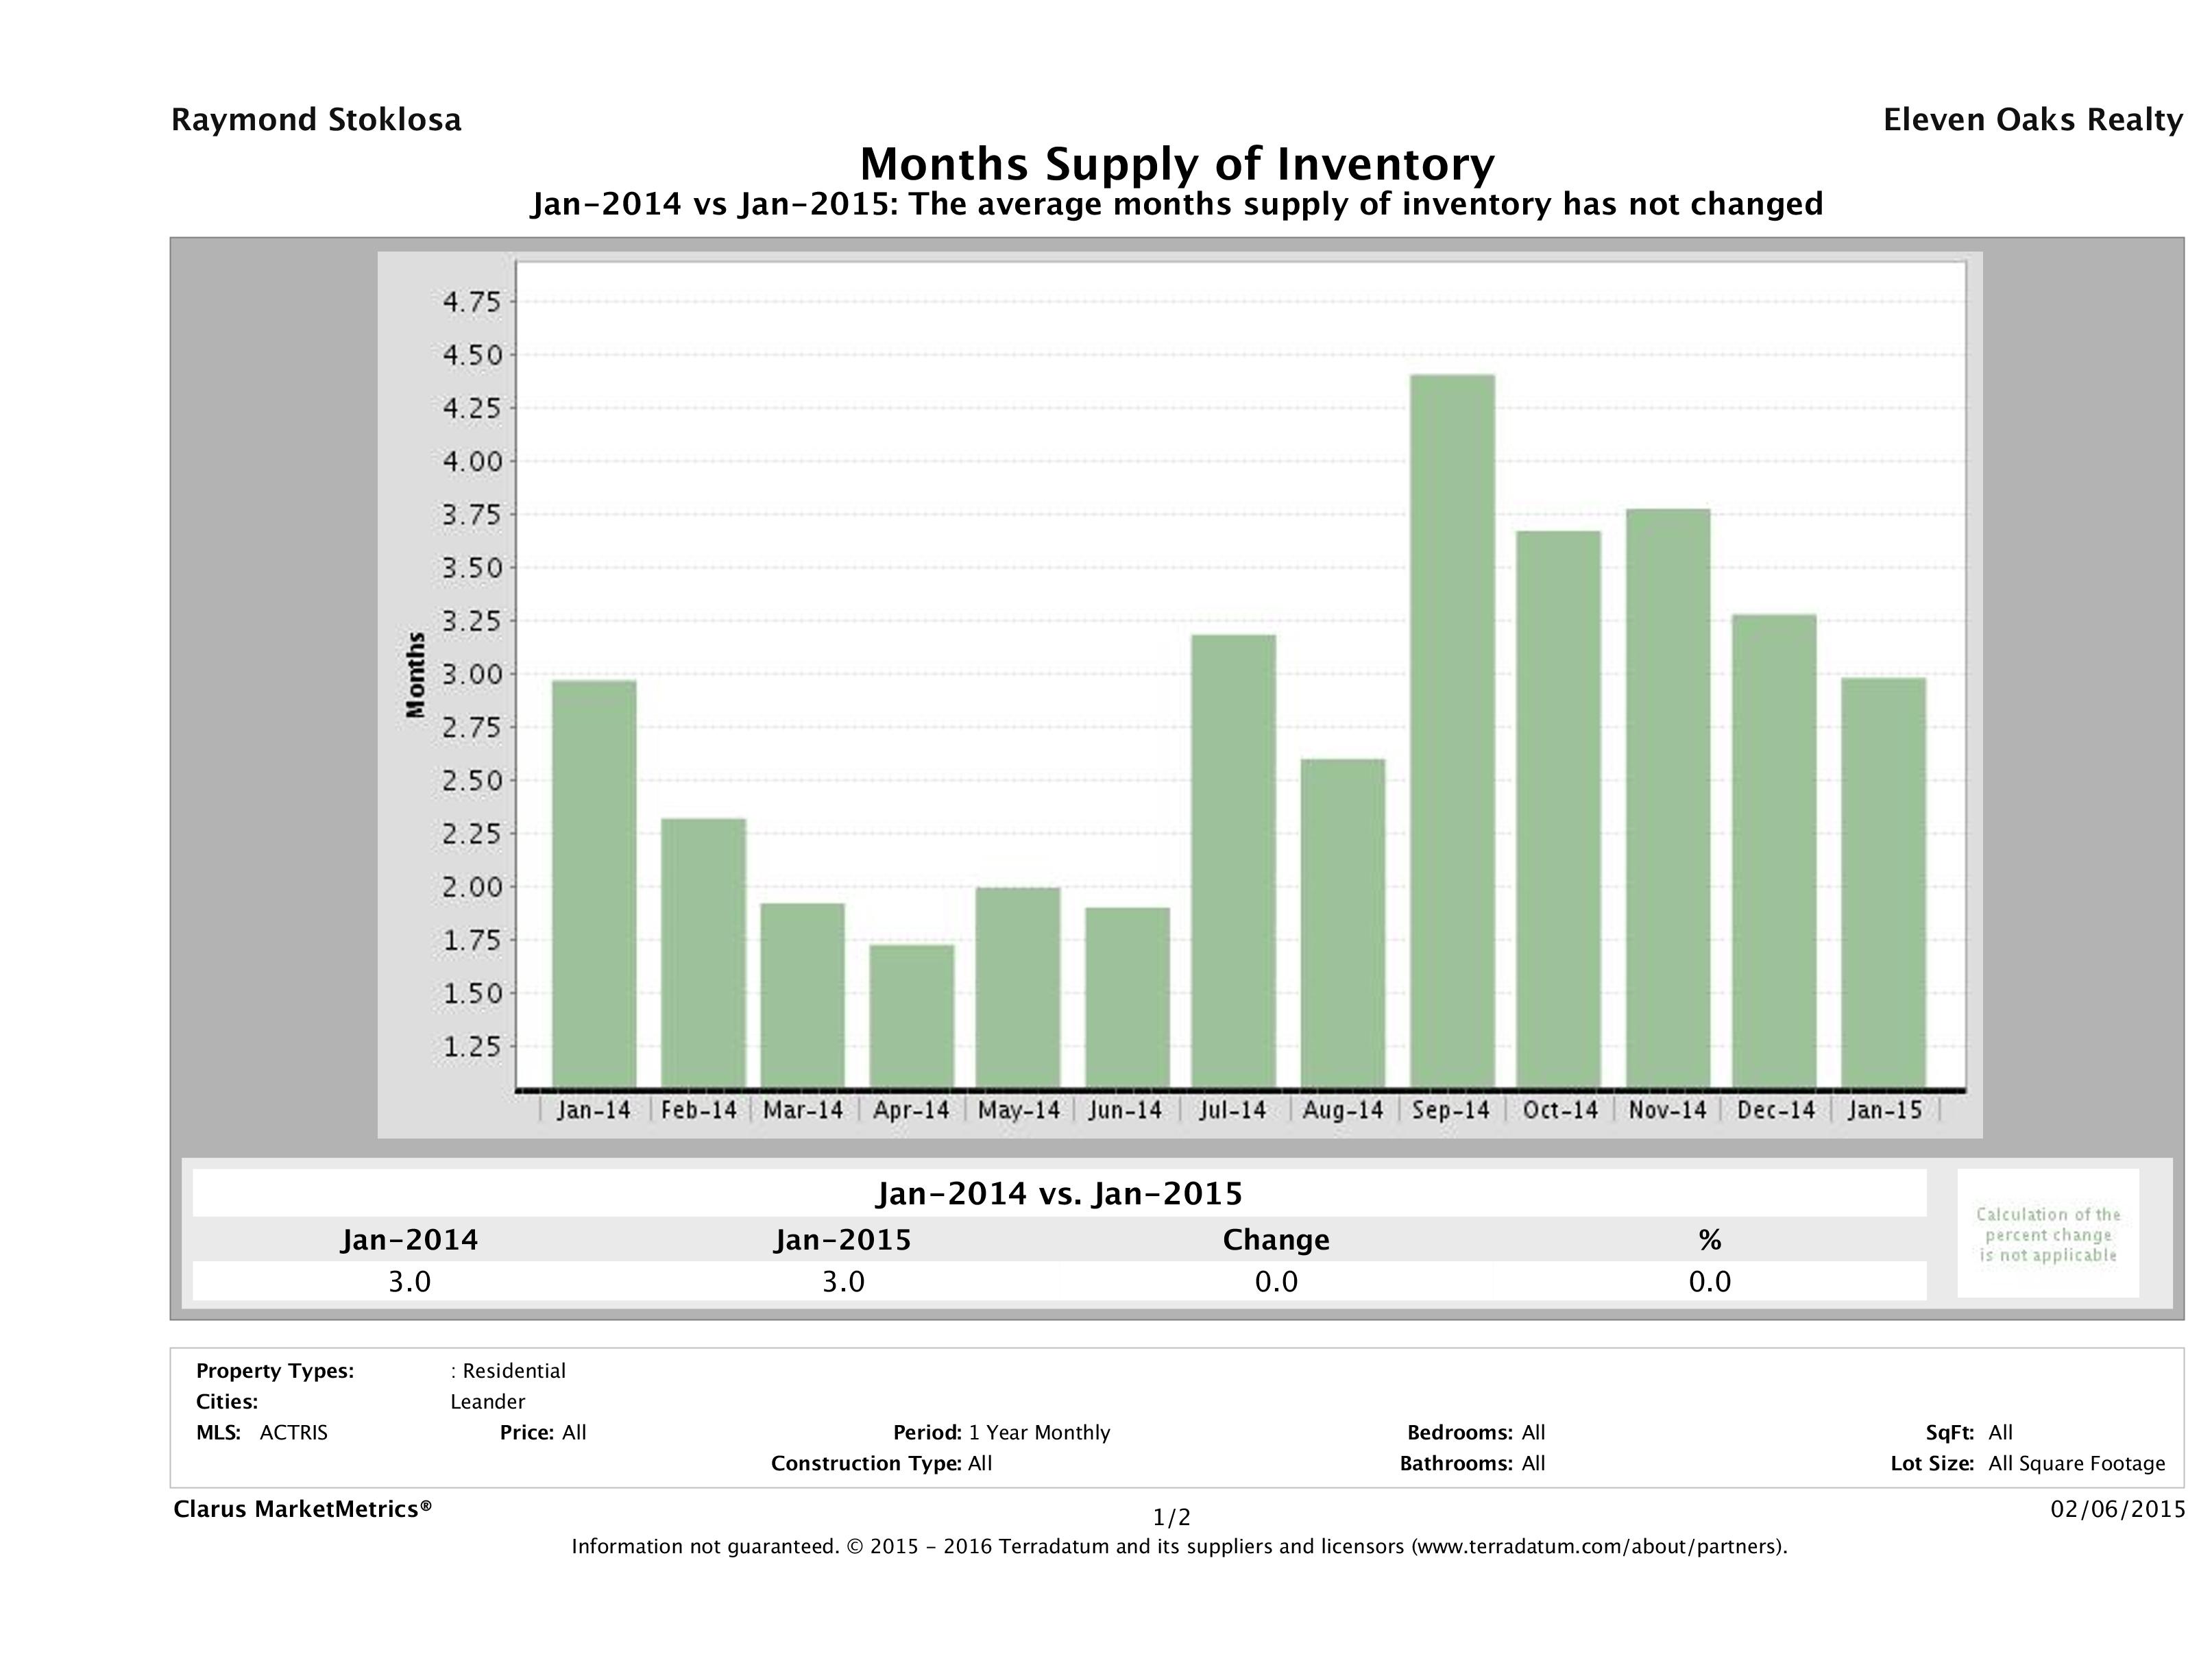
Leander Housing Inventory Saw No Change
In January 2015, we saw 3.0 months of inventory on the market, compared to 3.0 months of inventory in January 2014, showing no change in year over year numbers. This is just on the cusp of being a seller’s market.
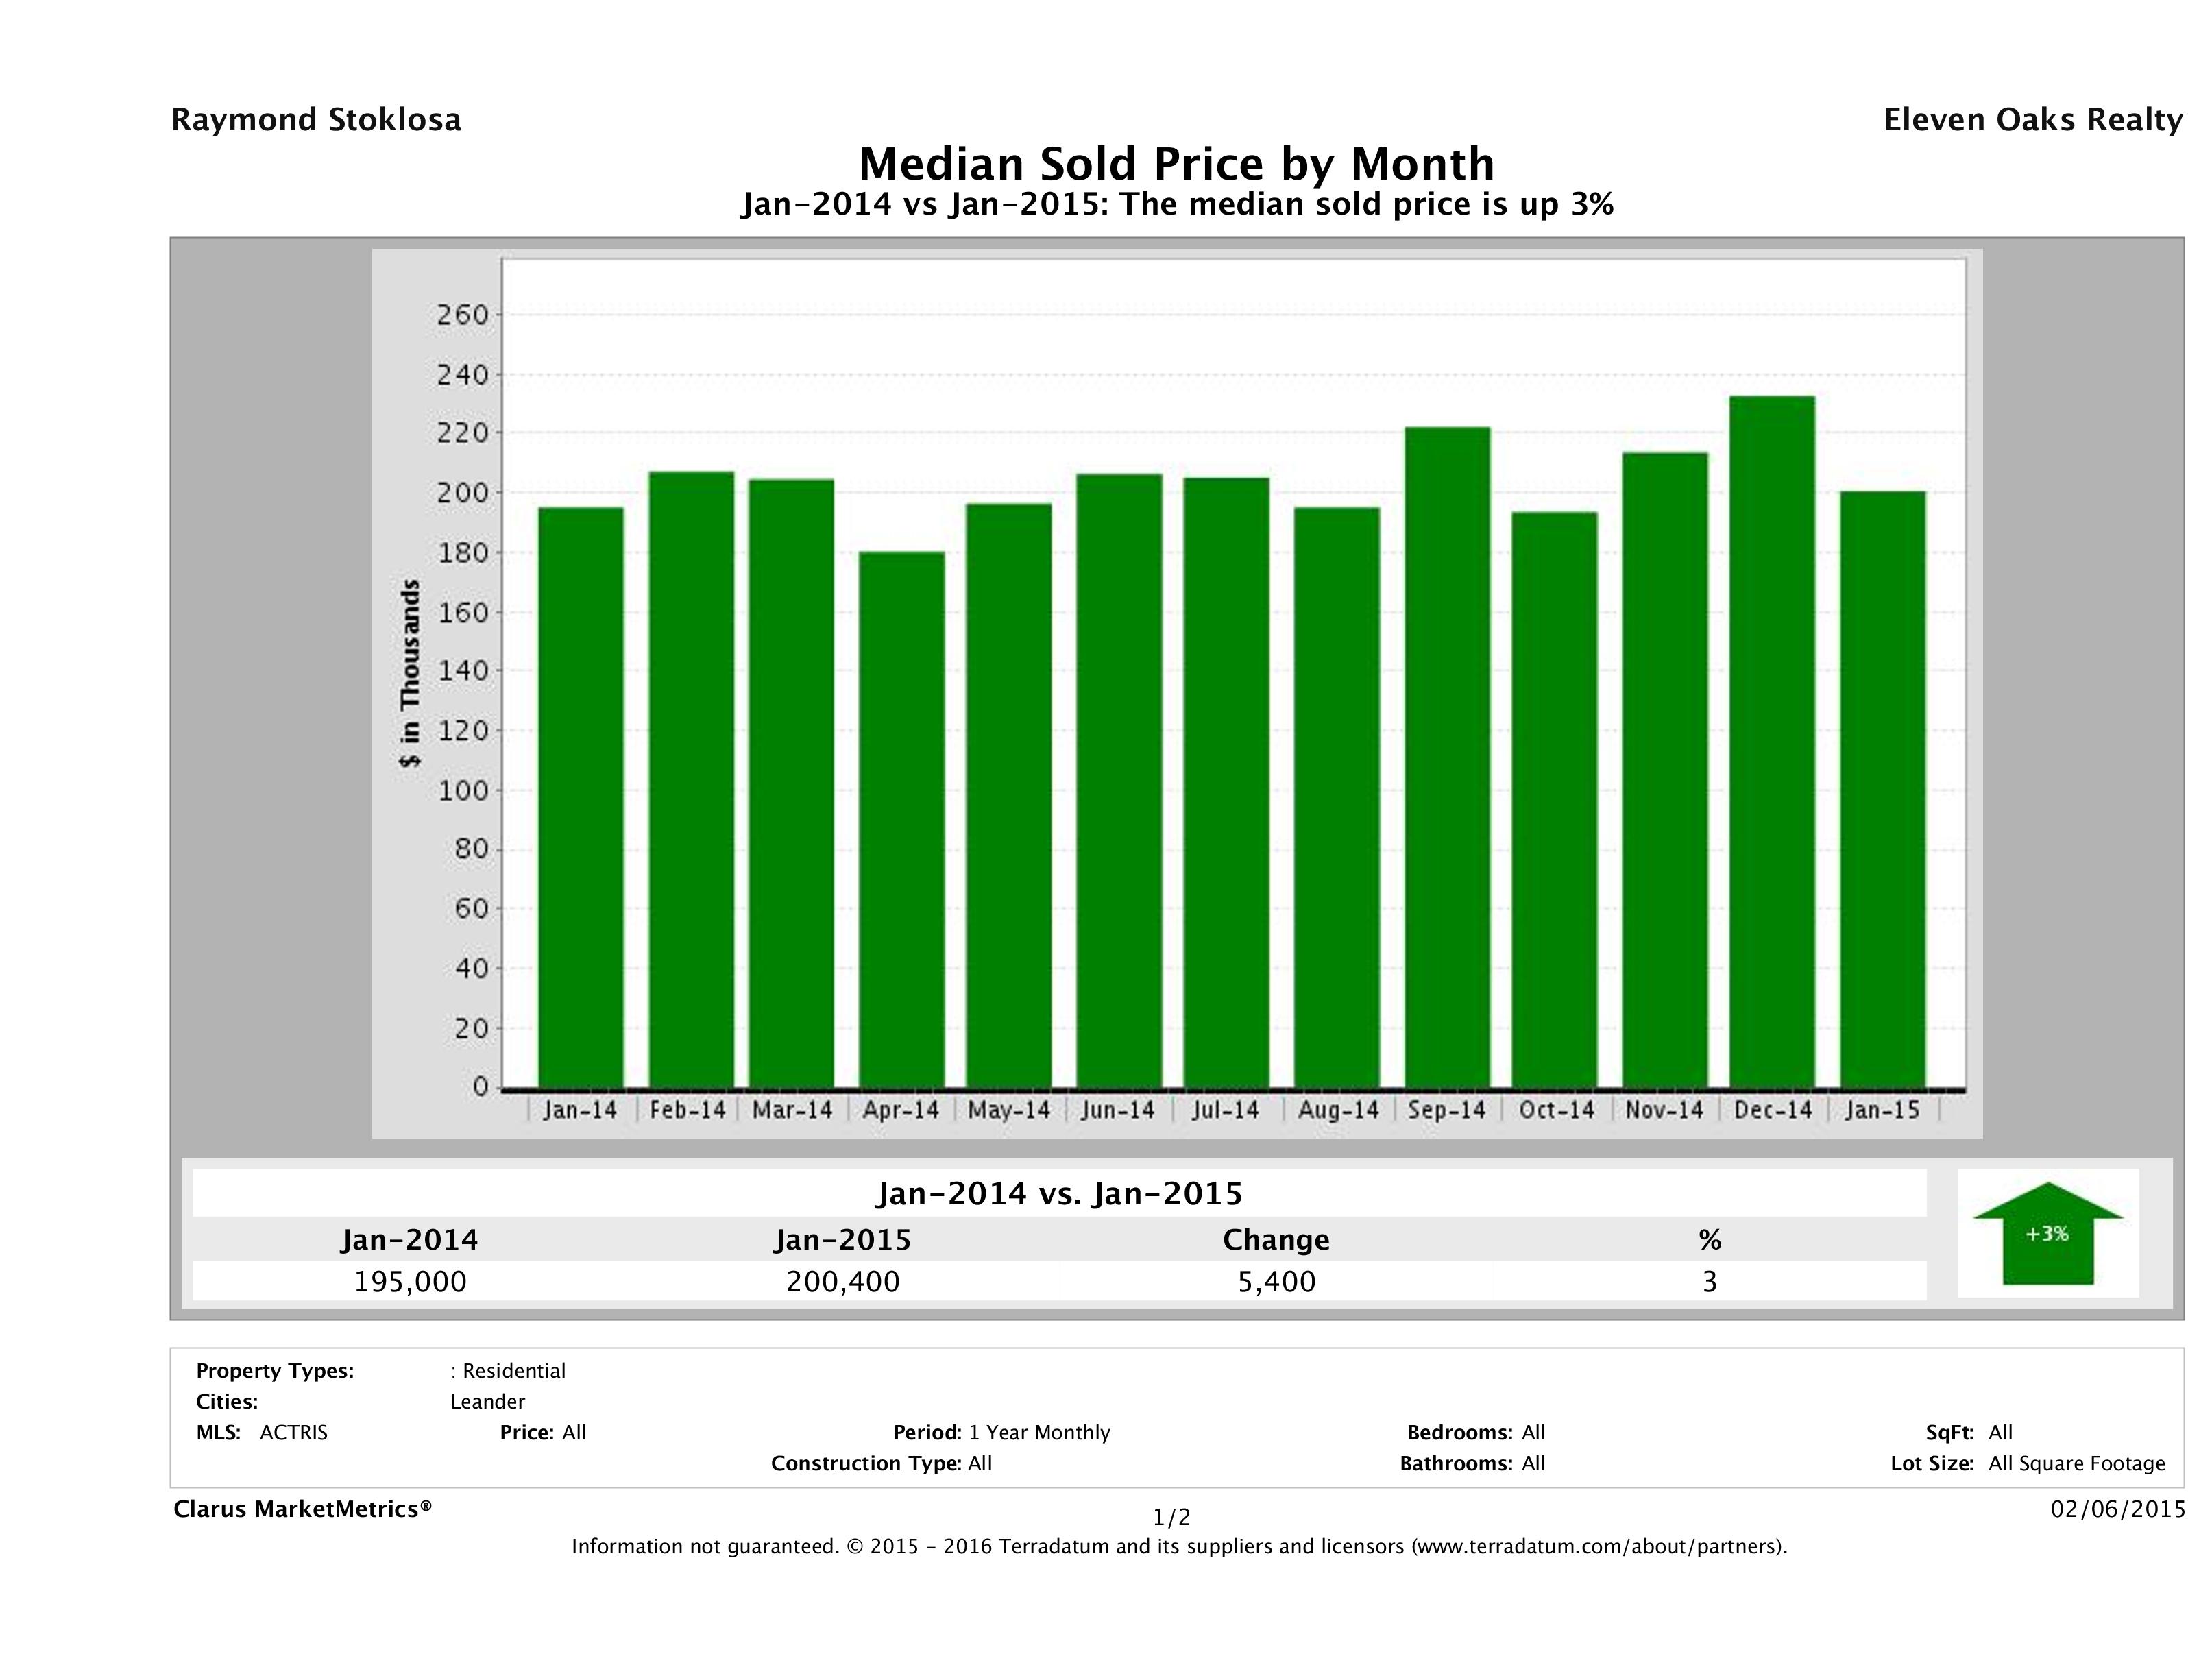
Leander Median Home Price Up 3%
The median home price of a Leander home in January 2014 was $195,000 compared to $200,400 in January 2015, marking a 3% increase in year over year numbers.
Median home price helps us see the distribution of homes sold and does not really give us an indication of the increase or decrease in a particular home’s market value. To analyze market value, we’d have to take an in depth look at a neighborhood. If you’re looking for something like that, please check out our Leander Home Values Report.
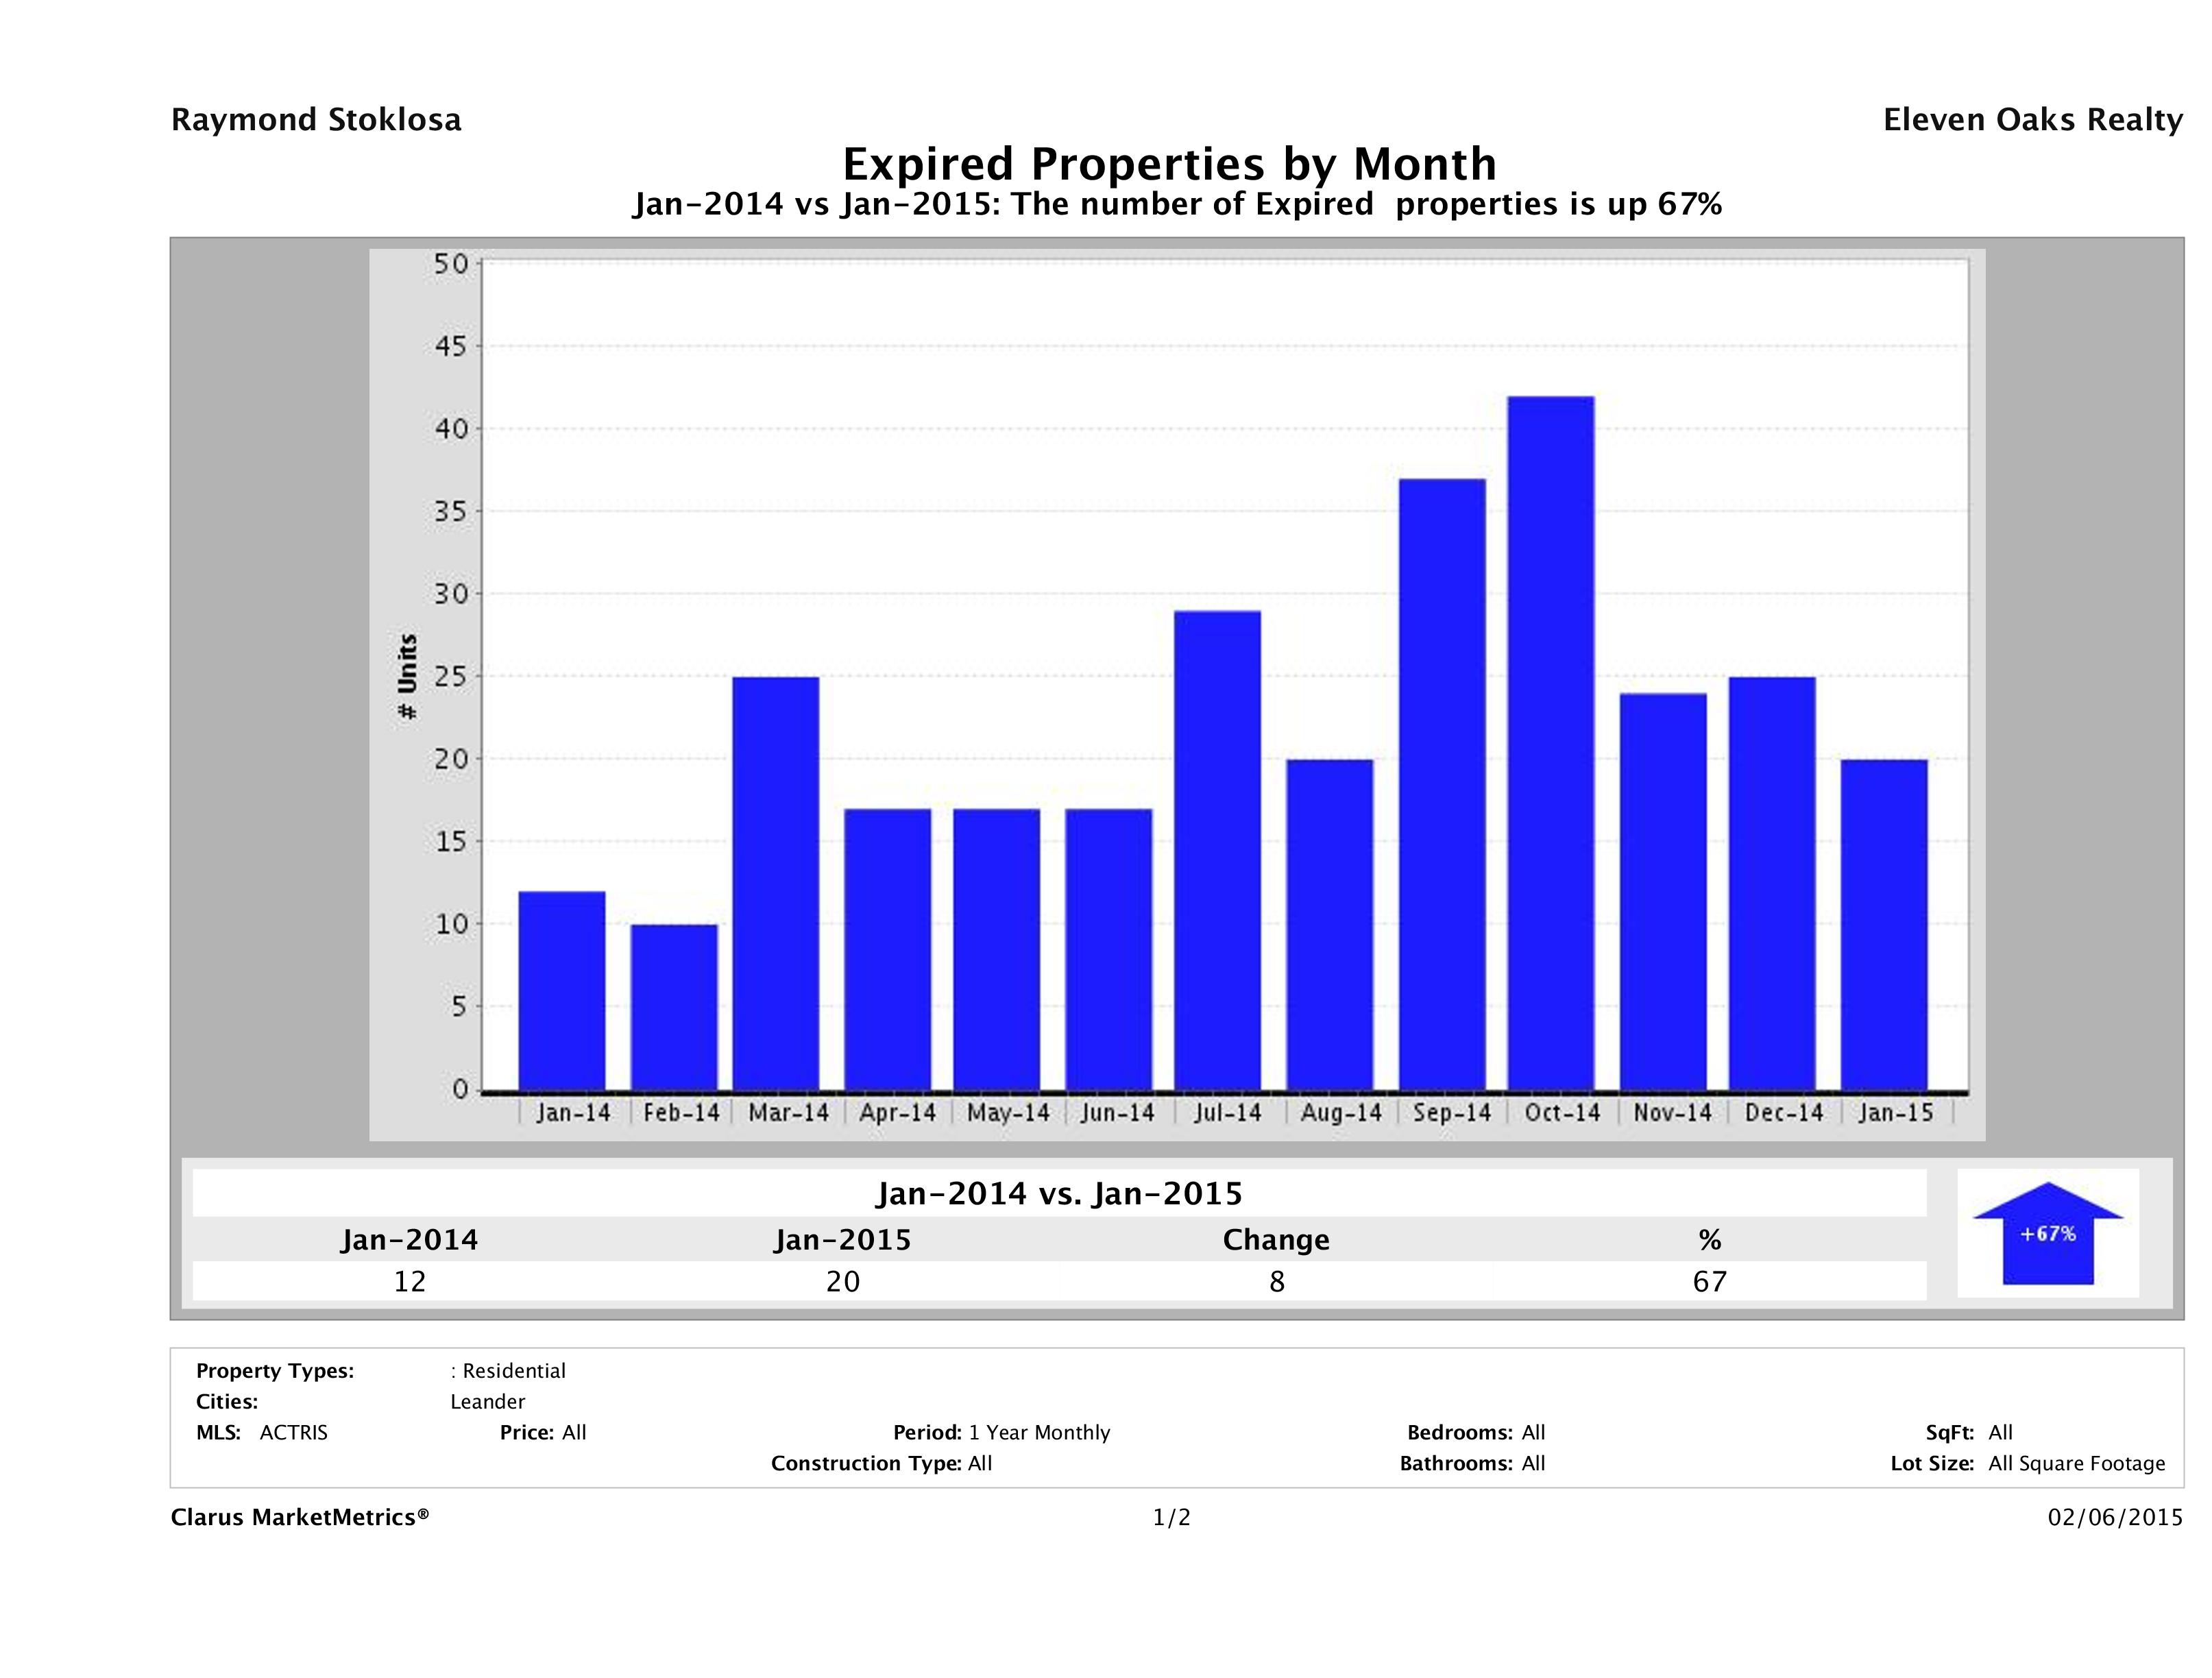
Number of Homes Taken Off the Market Up 67%
In January 2014, there were 12 single family homes taken off the market compared to 20 in January 2015, marking a 67% (8 home) increase city wide. This is a trend we’re seeing in more areas than Leander. It seems sellers who were testing the market are picking January to give up on their dream of a windfall.
If your Leander home was priced right but it still didn’t find a buyer, maybe there was something else going on. The biggest culprits we see are incorrect info in the MLS and poor marketing. Check out our Leander Home Marketing Plan to see how your homes would be marketed if we listed them. If you’d like our opinion on why your home didn’t sell email us at info@11OaksRealty.com.
Having trouble selling your home? Check out our Leander Home Not Selling resources page to find out why.
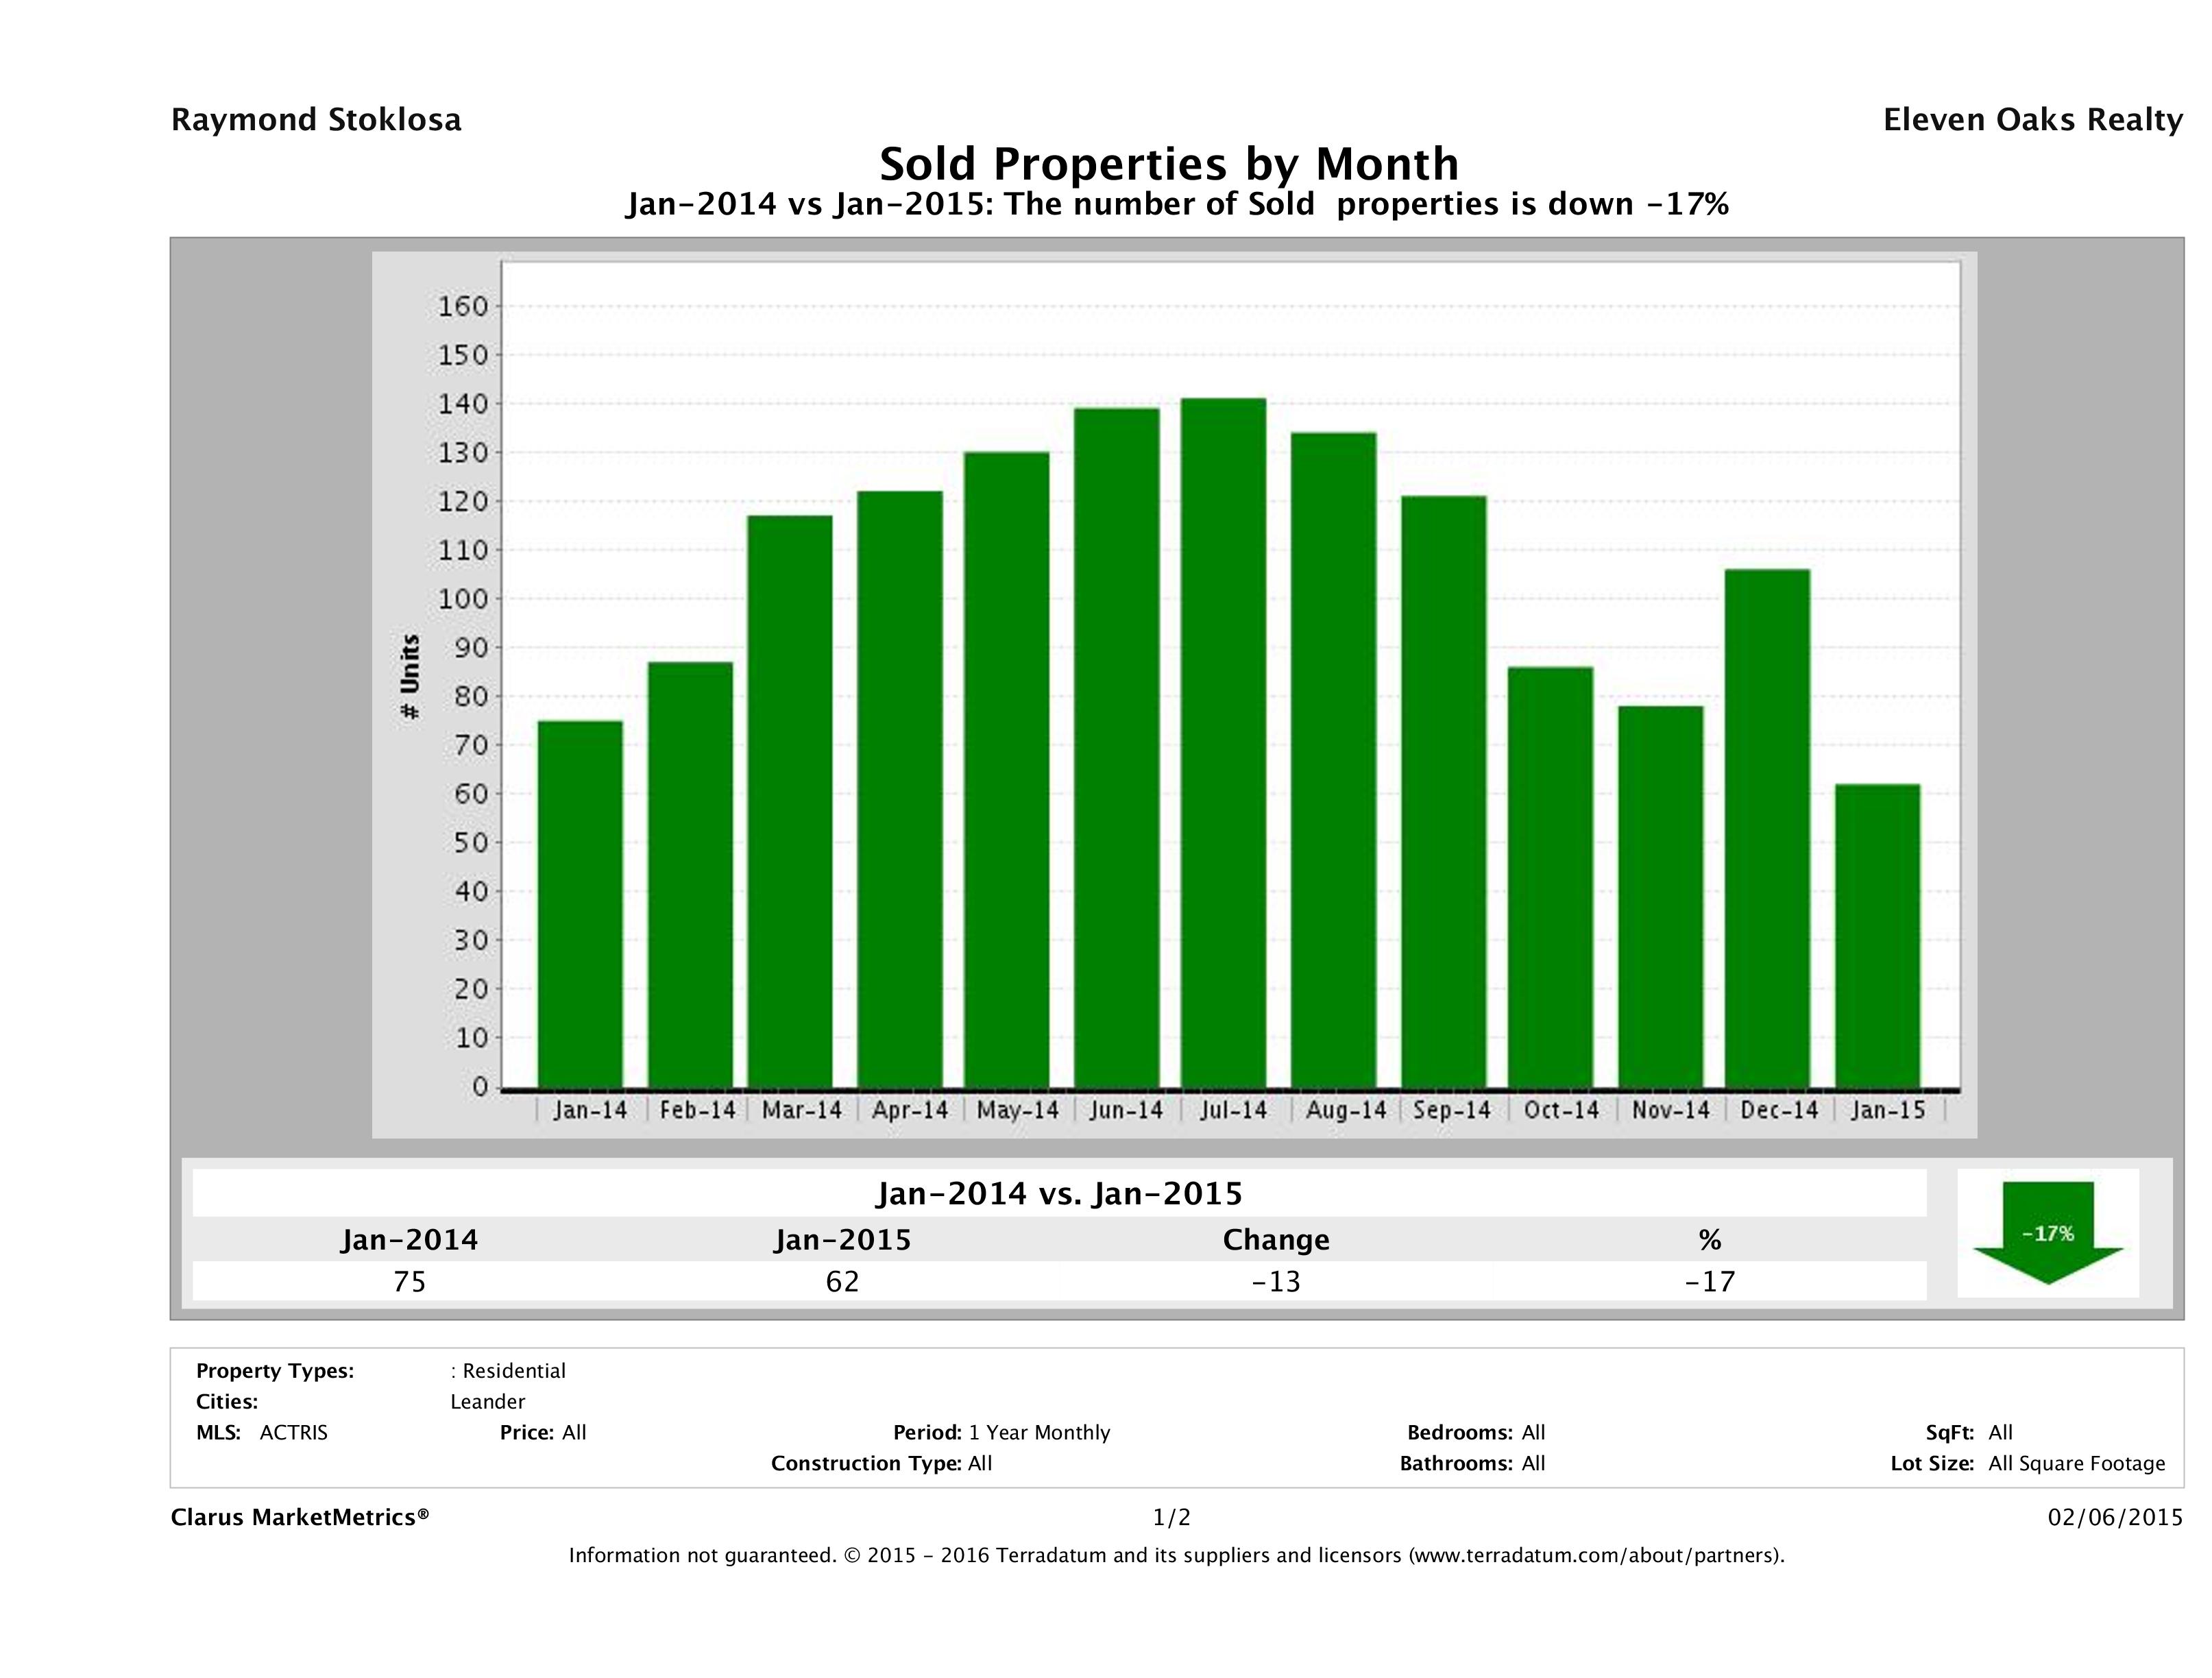
Number of Sold Homes in Leander Down 17%
In January 2015, Leander saw a 17% decrease in the number of homes sold from January 2014 to January 2015. In January 2015, we saw 62 homes sell in Leander compared to 75 in January 2014 marking a 17% (13 home) decrease in year over year numbers.
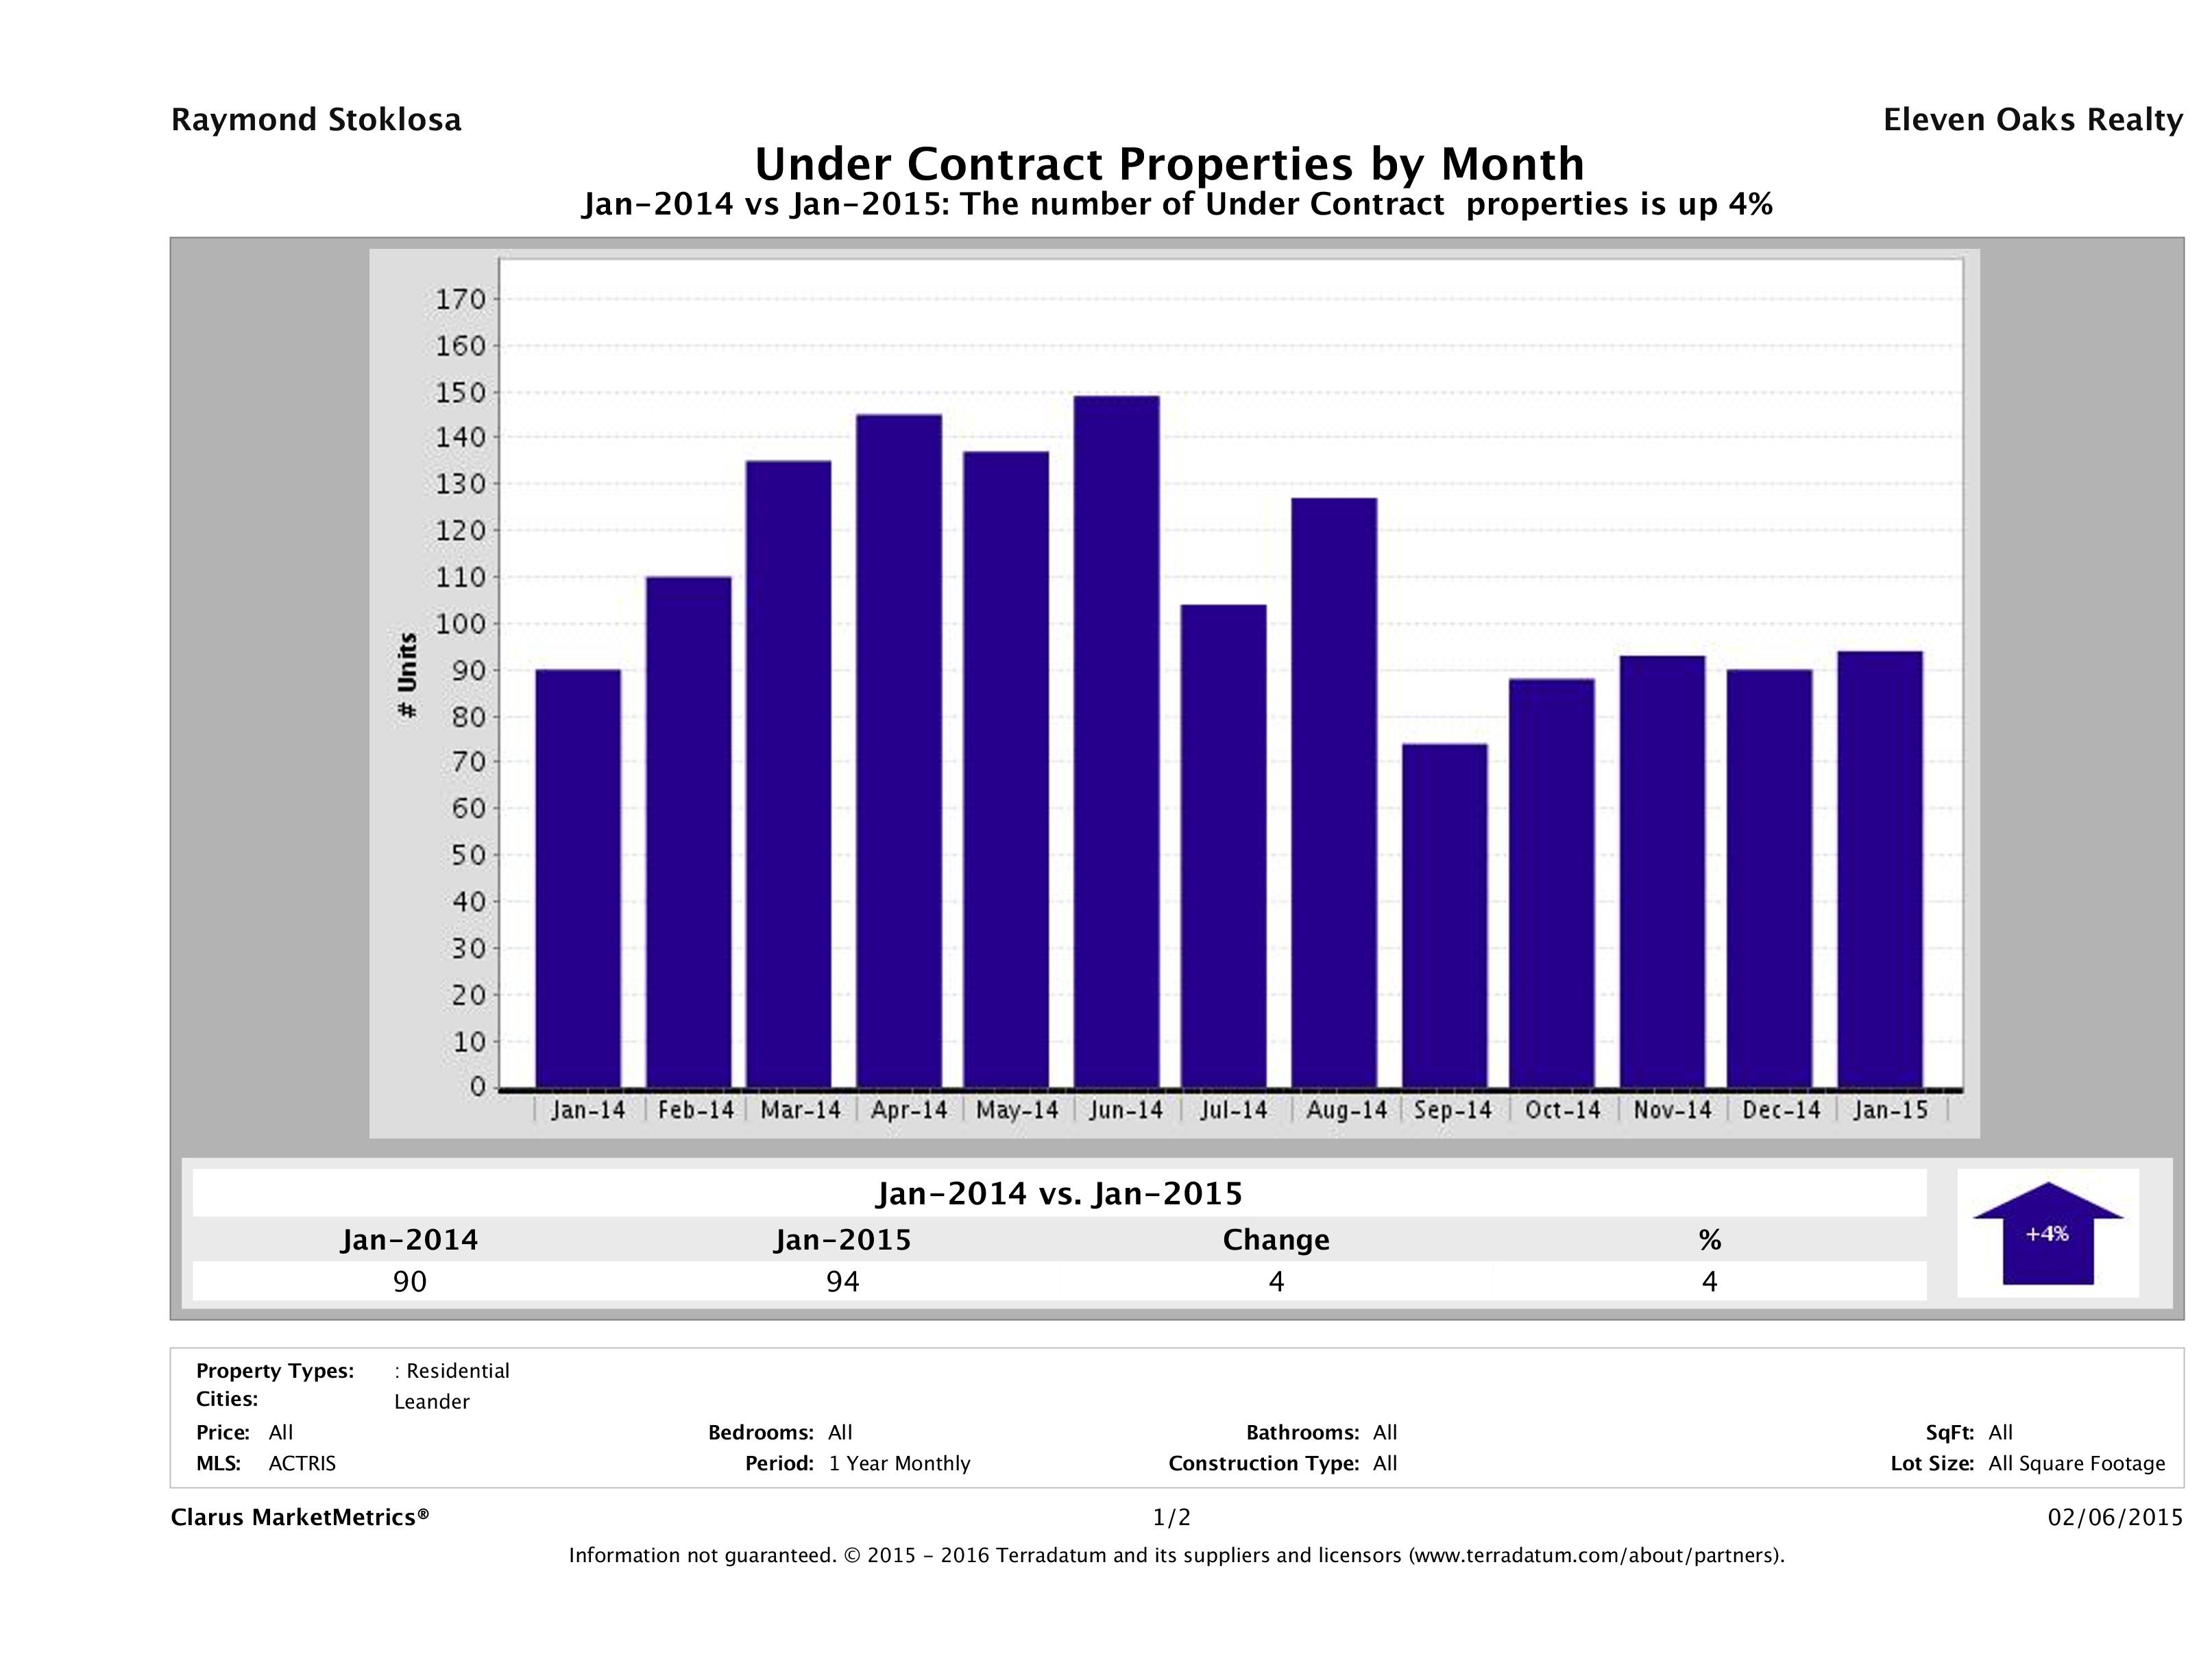
Leander Homes Under Contract Up 4%
In January 2015, 94 homes went pending (under contract) in Leander compared to 90 in January 2014, marking a 4% increase in year over year numbers.
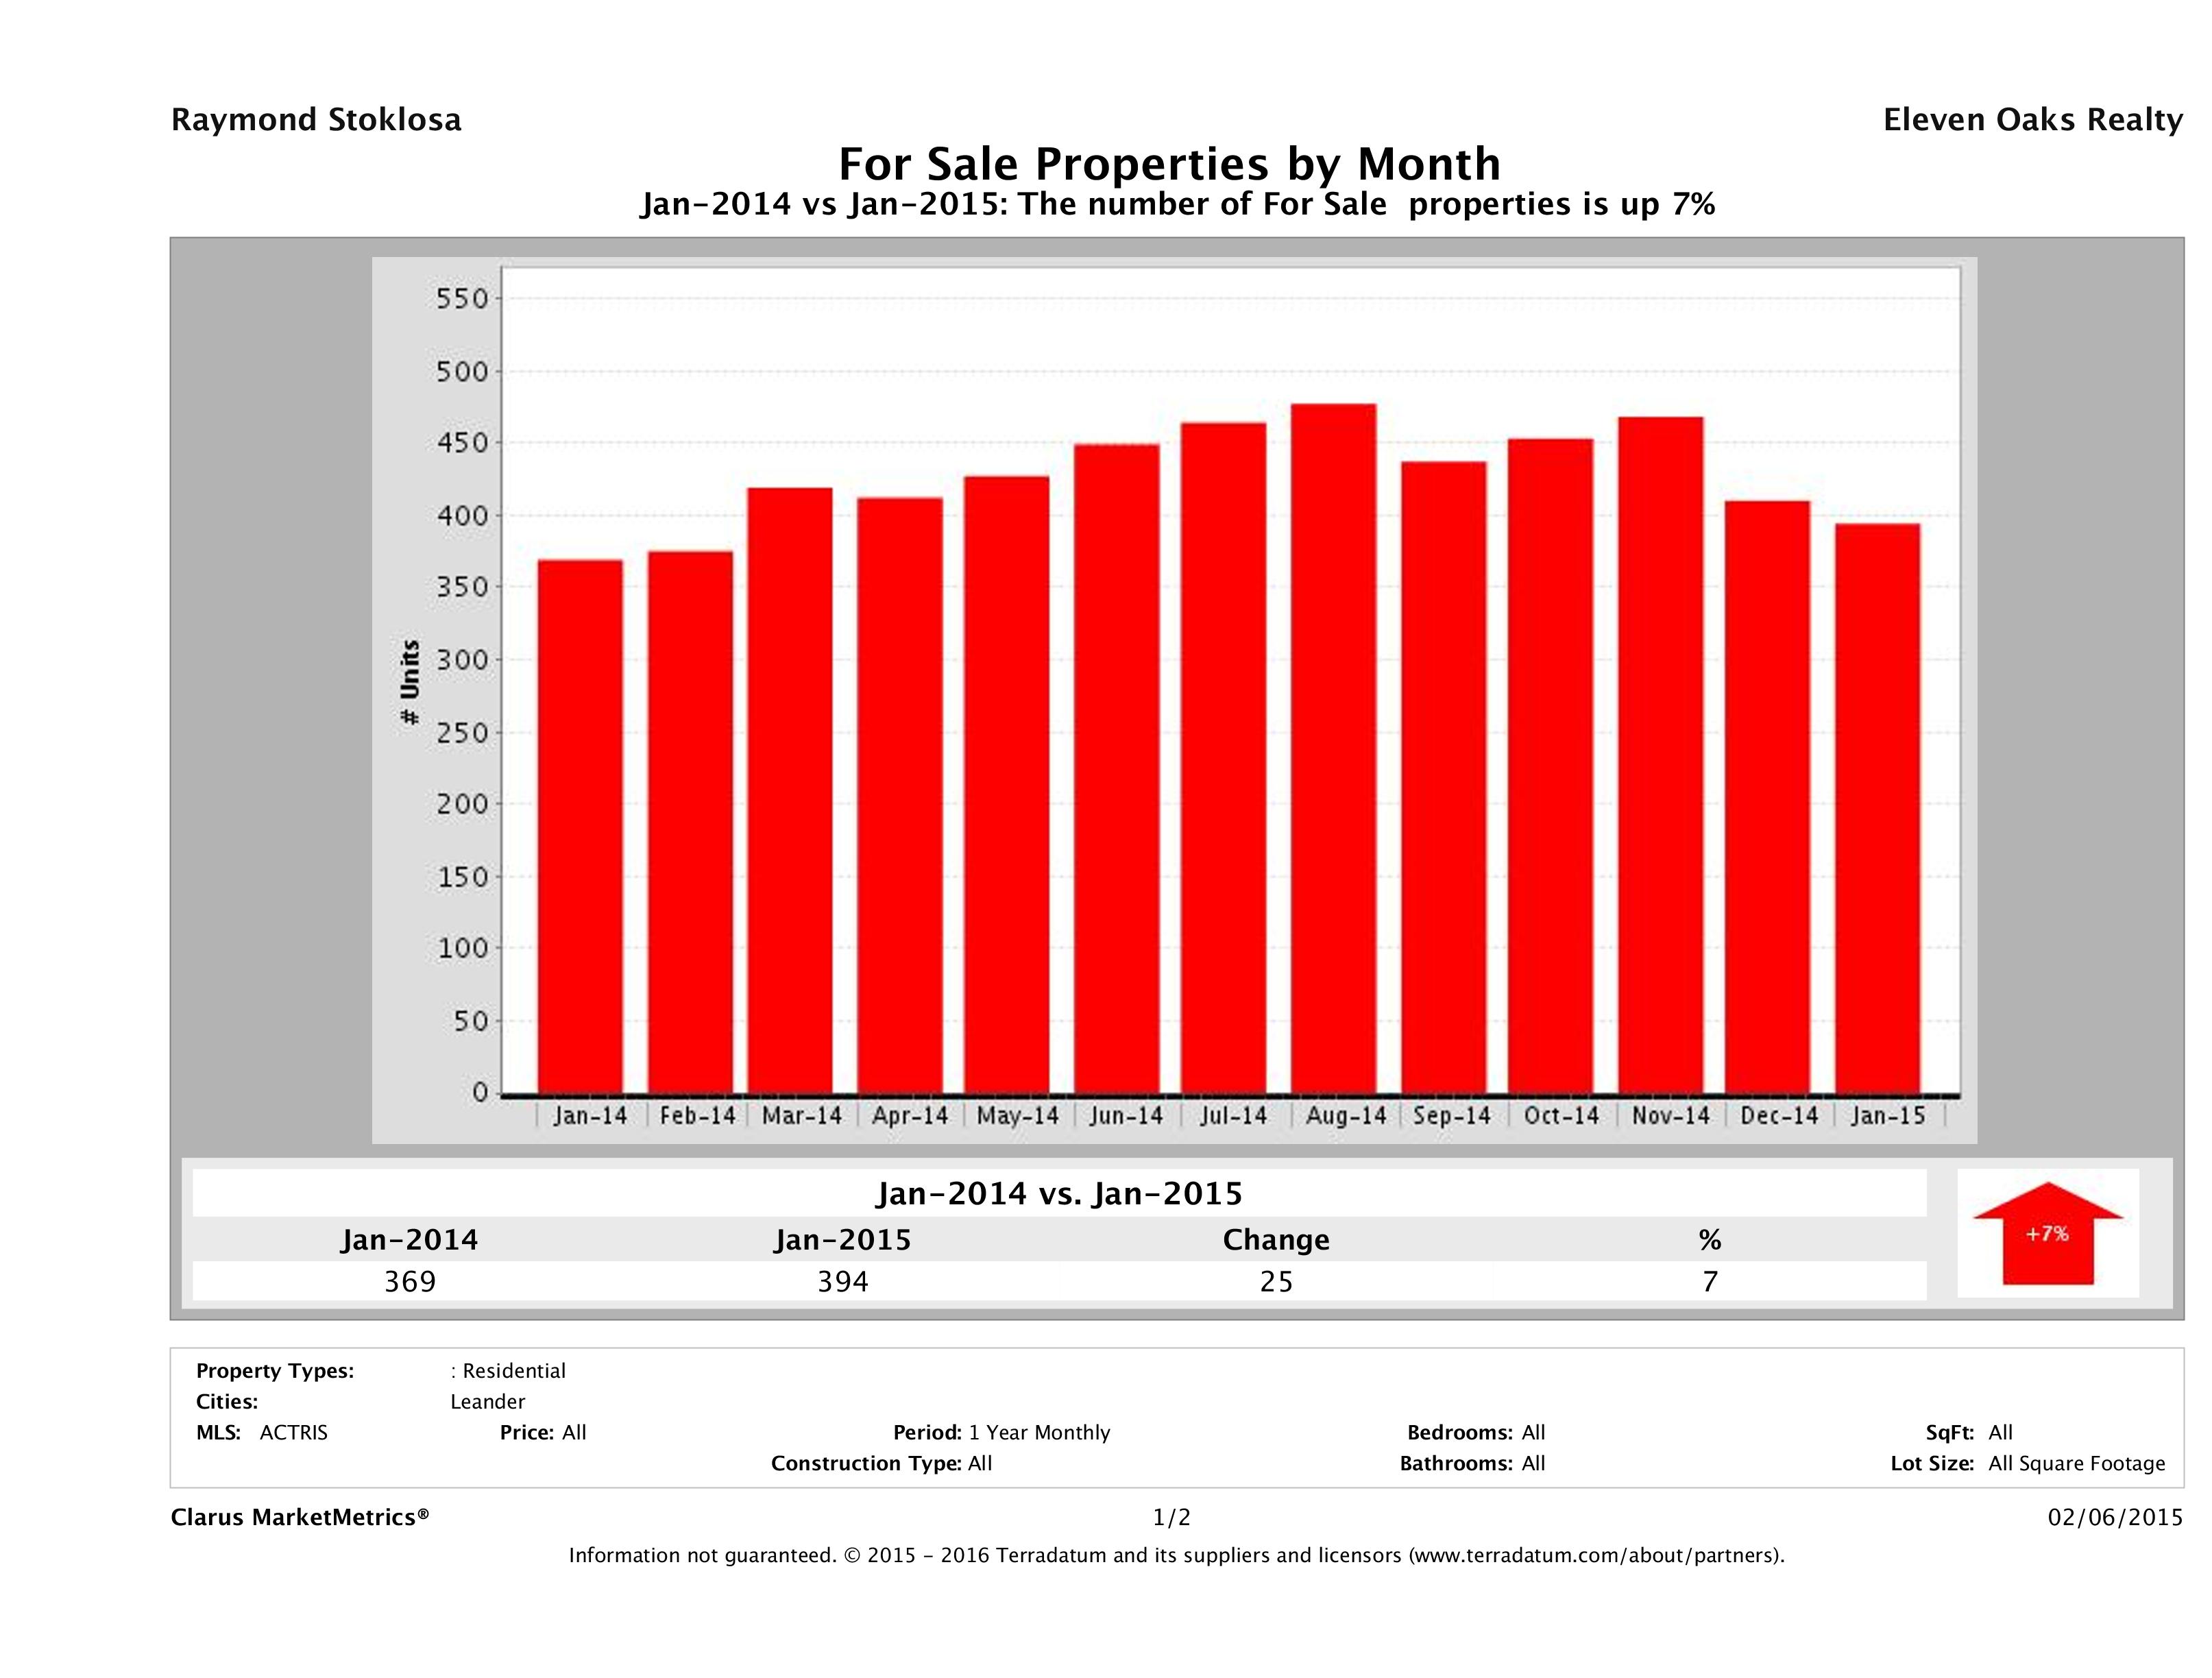
Number of Homes on the Market Up 7%
In January 2015, we had 394 homes for sale in Leander, compared to 369 in January 2014, showing a 7% (25 home) increase in year over year numbers.
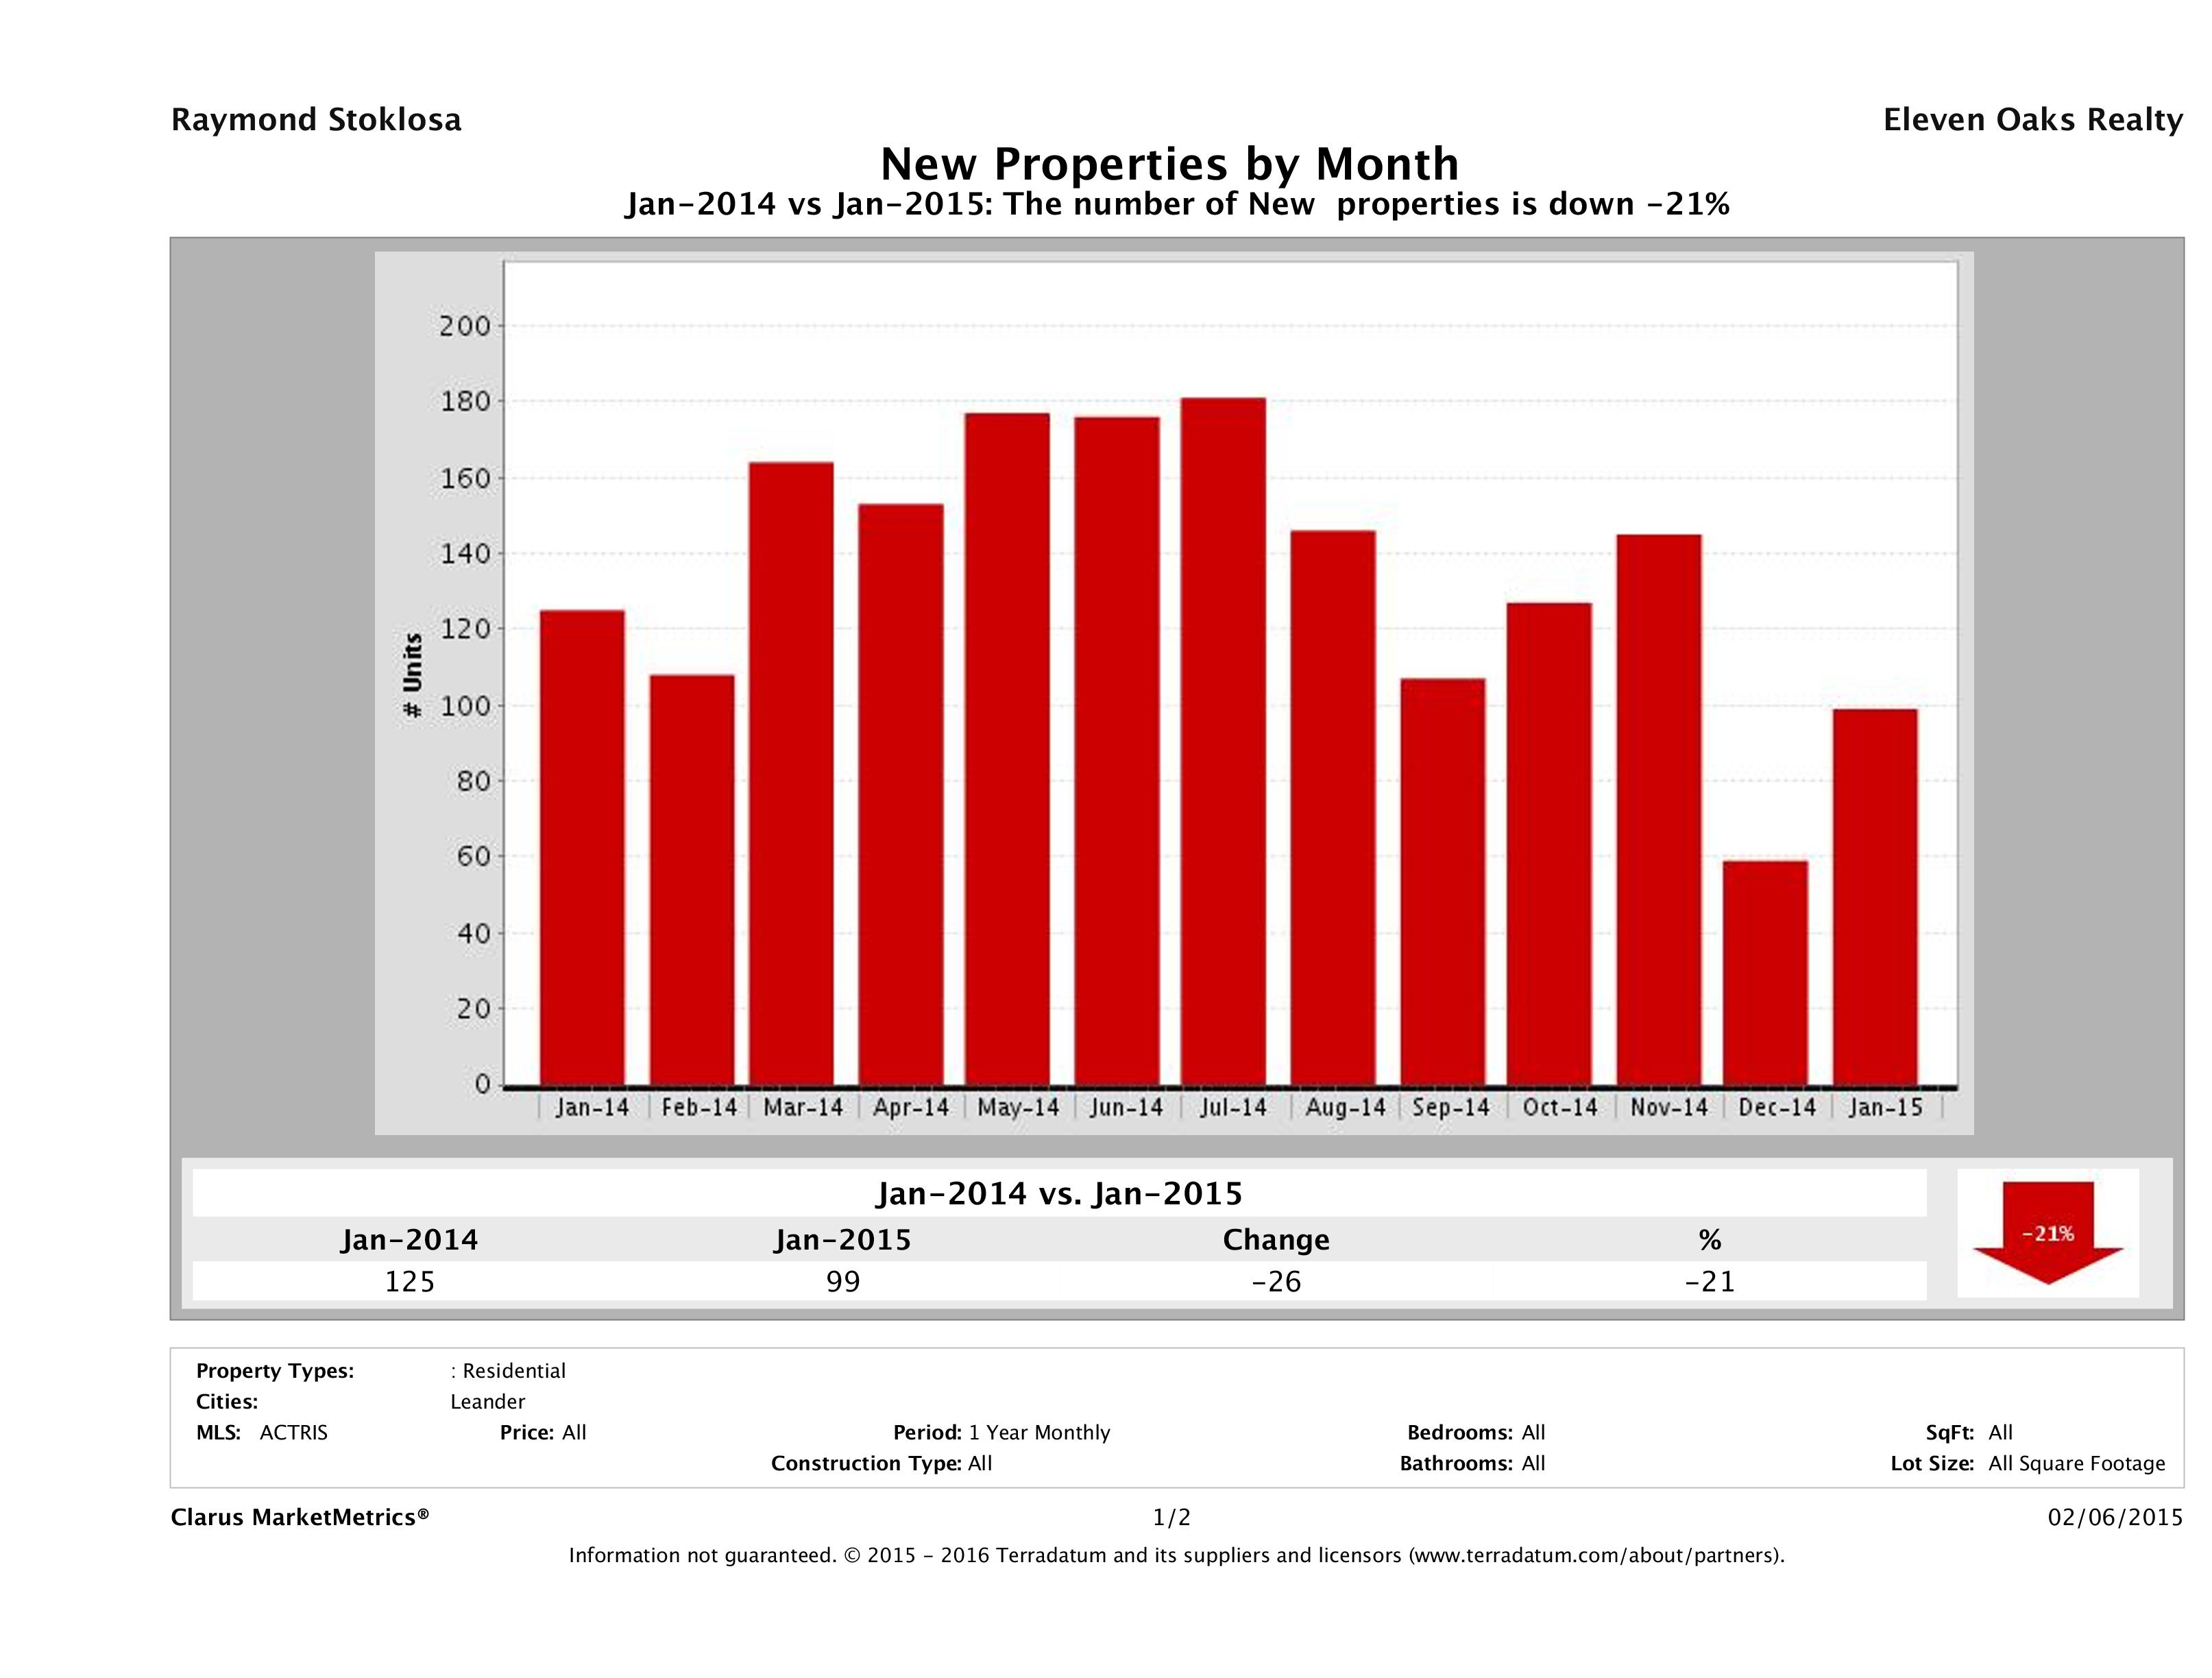
Number of Homes Listed for Sale Down 21%
In January 2015, we saw 99 homes introduced to the market compared to 125 in January 2014, marking a 21% (26 home) decrease. It seems fewer sellers are looking to sell this year compared to last.
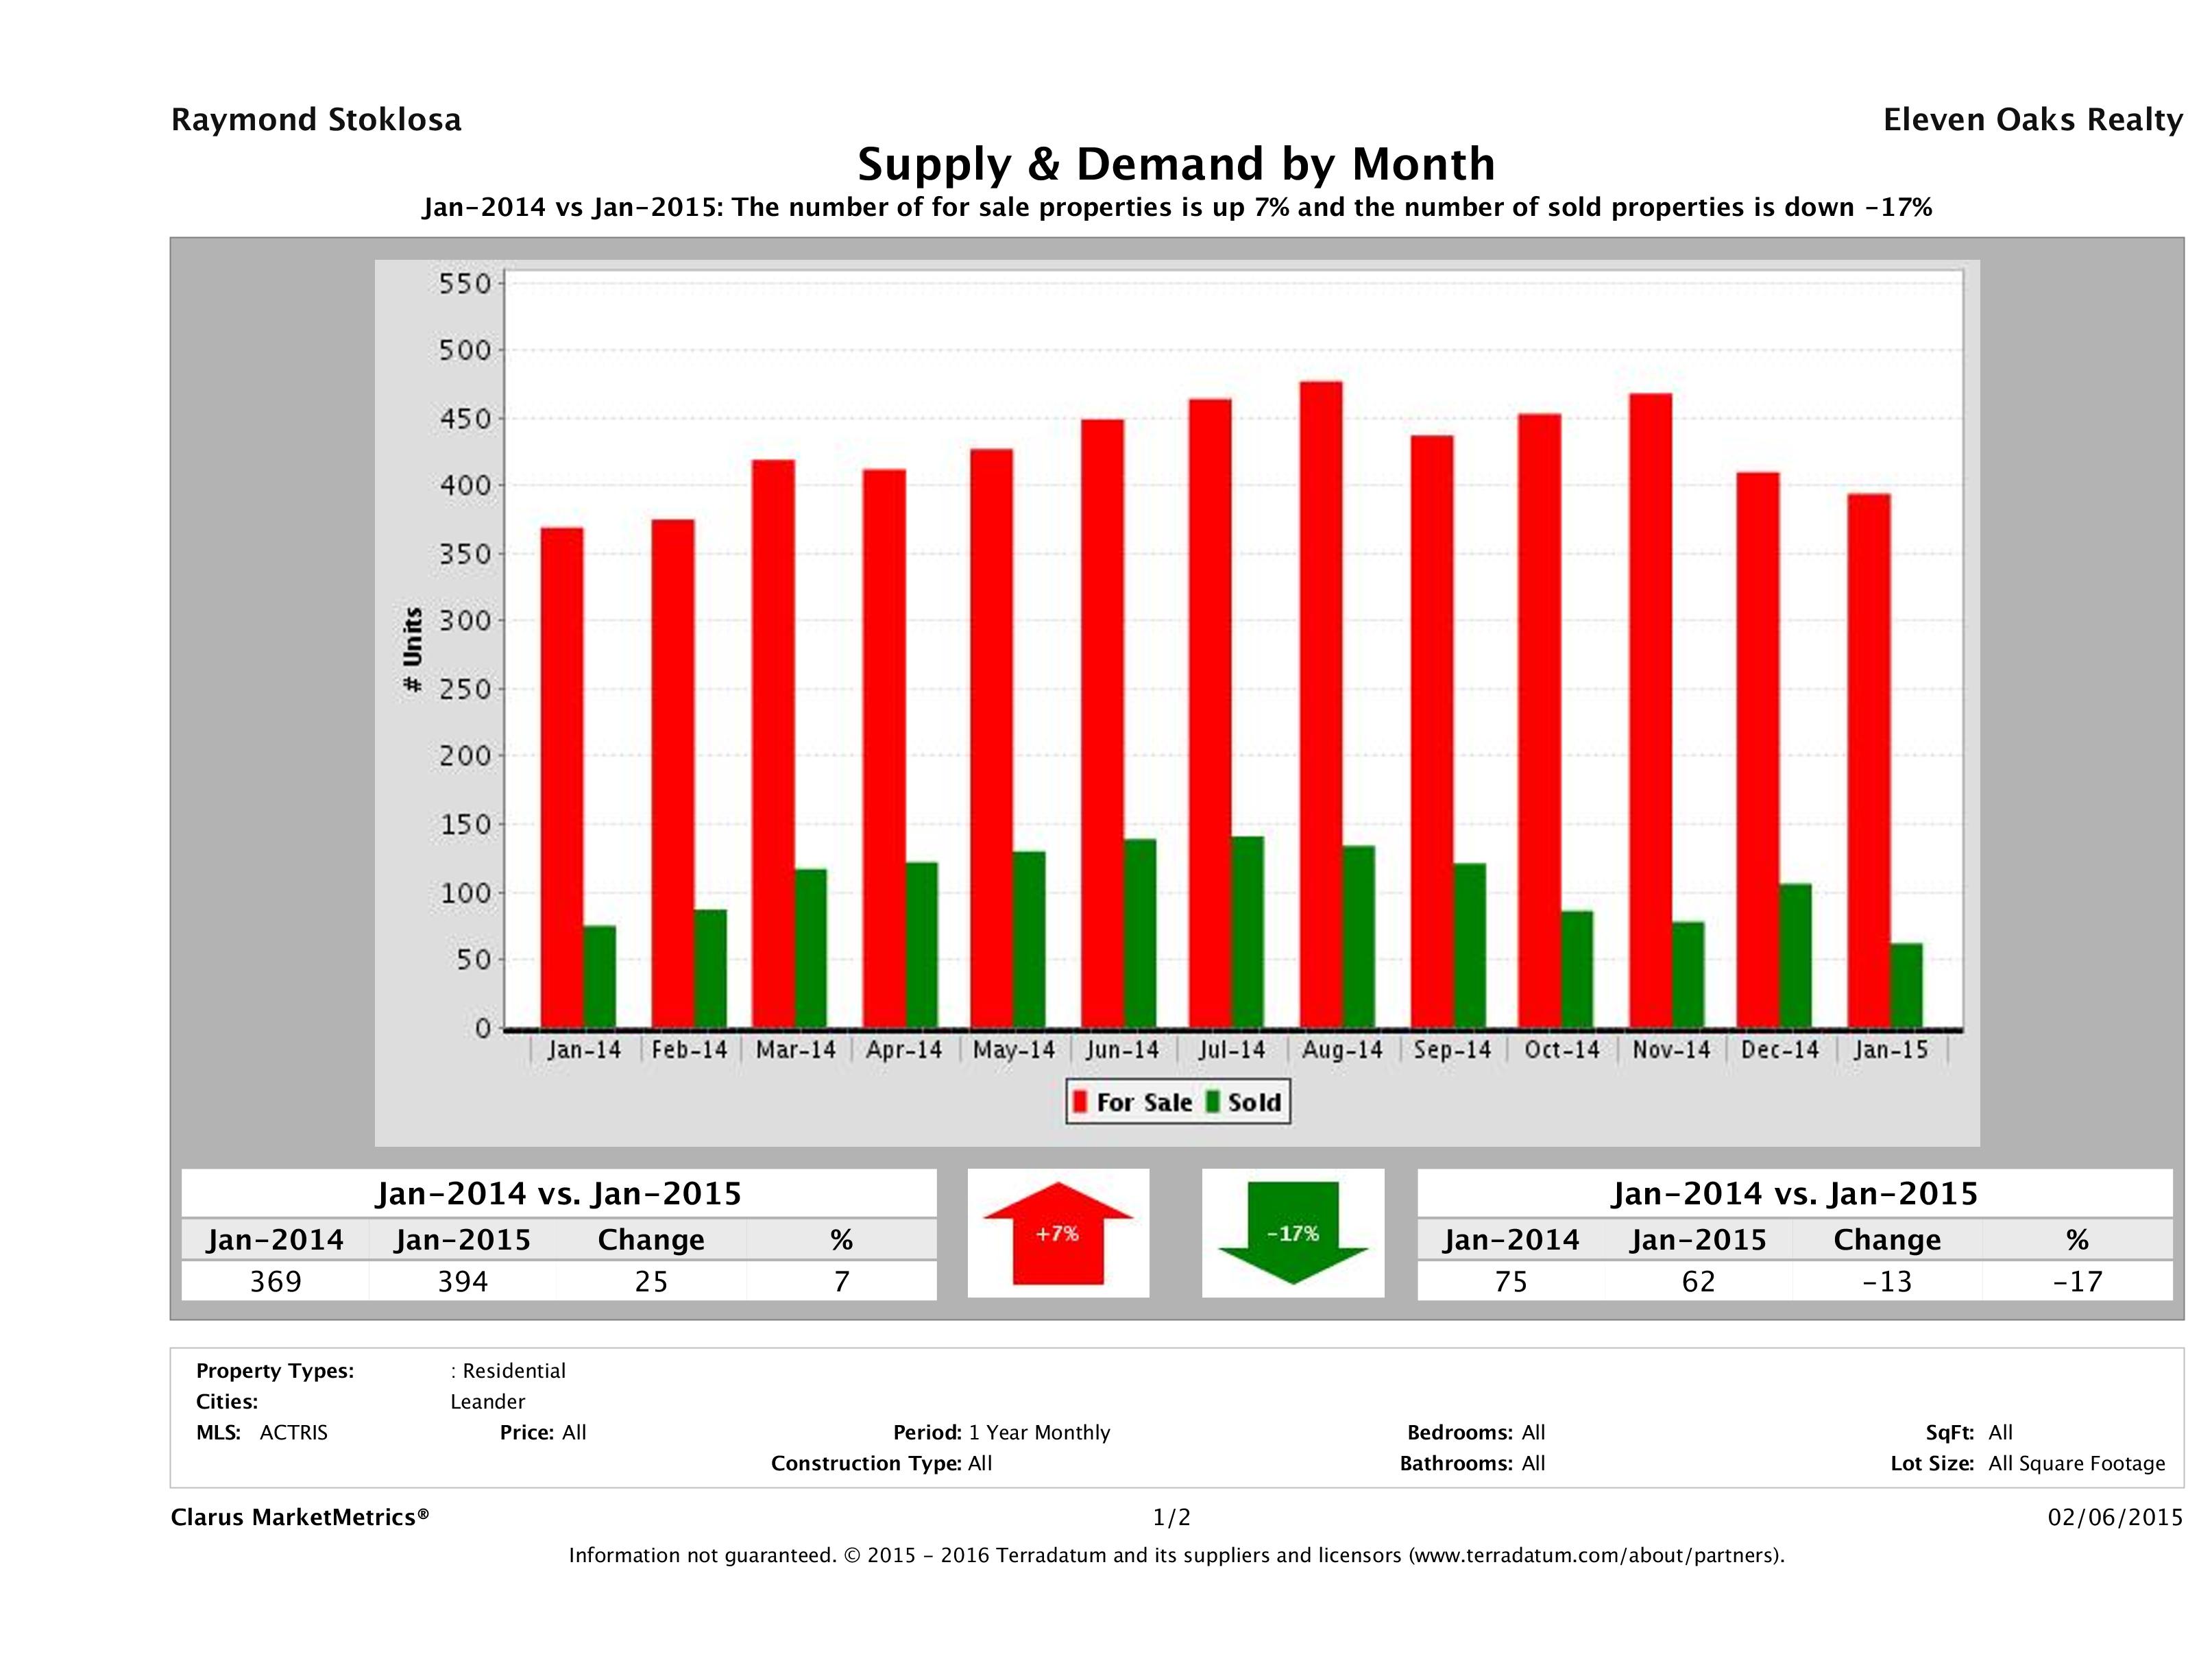
Supply Up 7% and Demand is Down 17%
This month we saw a 7% increase in supply (number of properties for sale) and a 17% decrease in demand (number of sold properties). More supply and less demand usually means good things for buyers.
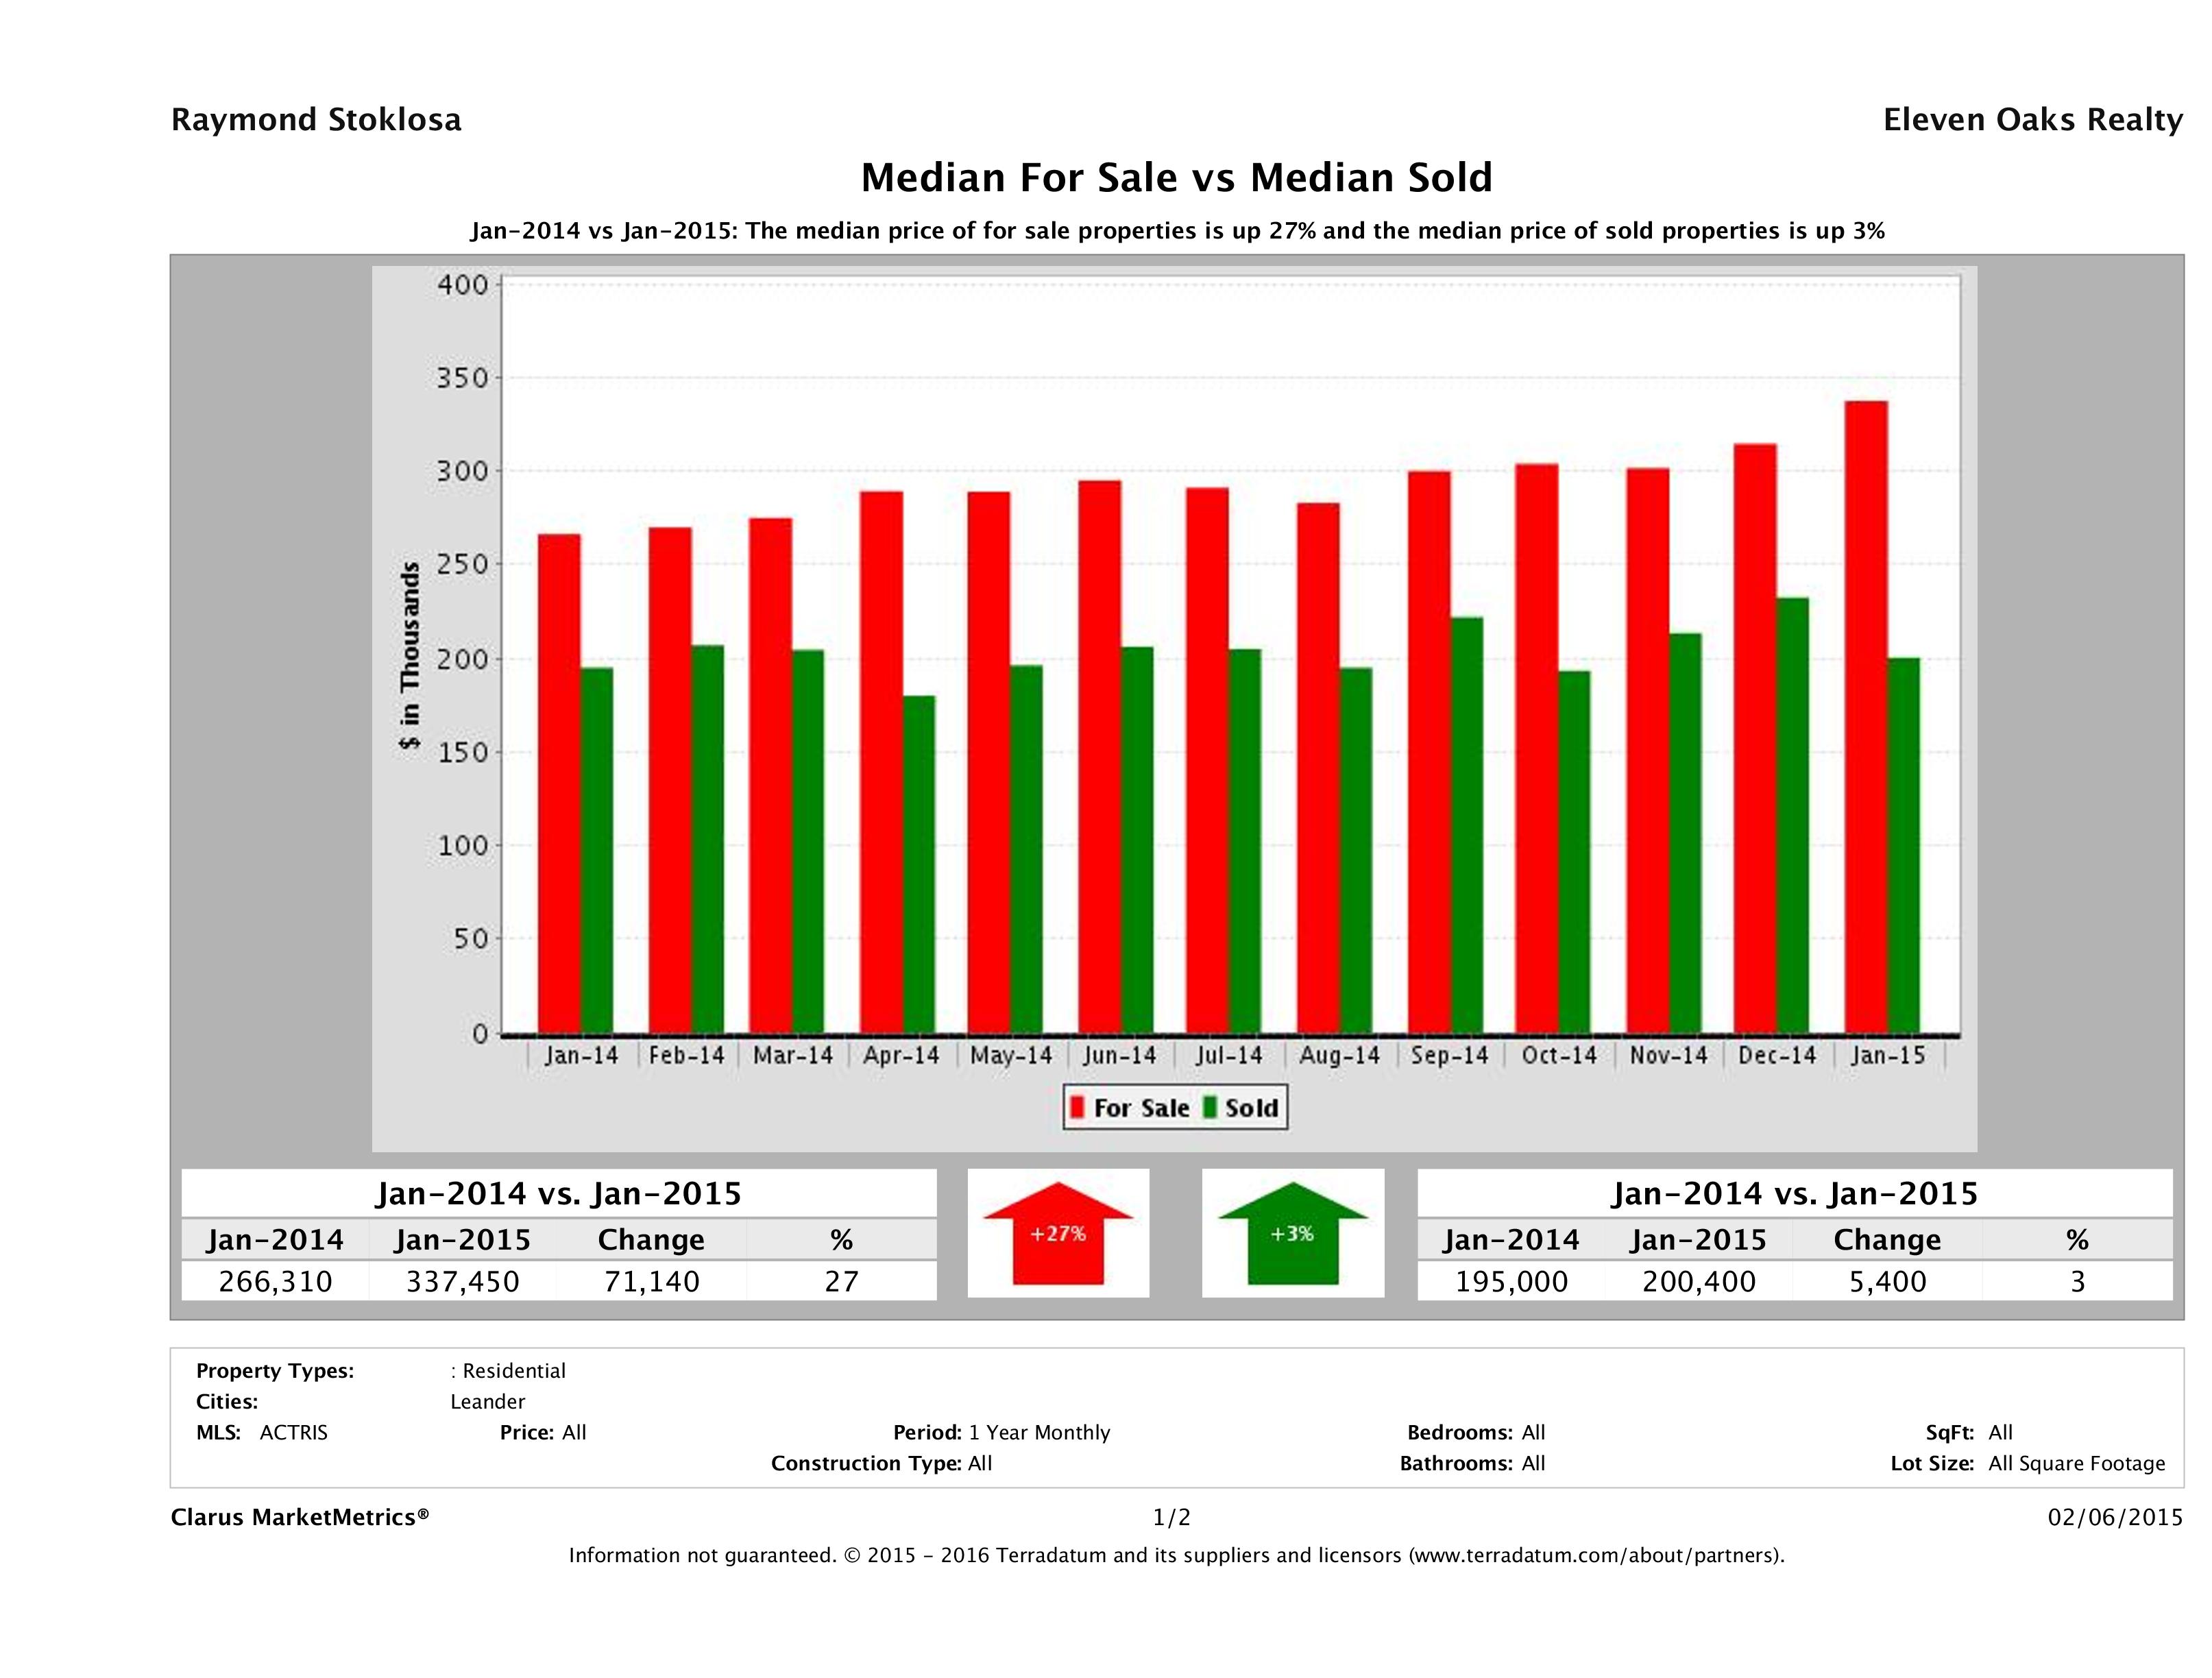
Median for Sale Up 27% vs Median Sold Price Up 3%
This chart compares the Median for Sale Price vs the Median Sold Price to show their relationship. In Leander, we saw a 27% increase in the median for sale price and a 3% increase in the median sold price of a single family home in year over year numbers.
Source: Clarus Market Metrics, ACTRIS Sold Data
January 2015 Leander Real Estate Price Report – Strictly Numbers
For those of you who prefer to see the actual numbers, we’ve included the figures for January 2015 Leander home sales below. The most expensive home that sold in January 2015 sold for $600,000 and the least expensive home sold for $110,000. Homes ranged in size from 944 sqft – 3,700 sqft with an average size of 2,120 sqft. The average price per square foot for a home that sold in Leander in January 2015 was $107.67 with the lowest being $62.31/sqft and the highest being $163.84/sqft. It took, on average, 48 days to sell a home in Leander and sellers received, on average, 95.40% of their original list prices.
| Beds | Baths | SqFt | List Price | LP/SqFt | Sold Price | SP/SqFt | SP/LP | SP/OLP | ADOM | |
|---|---|---|---|---|---|---|---|---|---|---|
| Min | 2 | 1 | 944 | $109,900 | $64.16 | $110,000 | $62.31 | 84.48% | 70.00% | 1 |
| Max | 5 | 4 | 3,700 | $631,930 | $172.56 | $600,000 | $163.84 | 103.82% | 103.82% | 163 |
| Avg | 3 | 3 | 2,120 | $231,807 | $110.57 | $224,737 | $107.67 | 97.46% | 95.40% | 48 |
| Median | 3 | 2 | 1,957 | $204,900 | $110.60 | $200,800 | $107.75 | 98.00% | 96.22% | 30 |
| Search Criteria | |||
|---|---|---|---|
| Status | Sold | Sold Date | Jan 2015 |
| Property Type | Single Family Homes | Number Sold | 66 |
| Source: | ABoR Sales Data | Area | Leander |
Time to Buy? Sell?
As we always say, the best time to buy or sell a home is when you need to buy or sell. If you have a house to buy, buying when its a sellers market may hurt you on the buying end, but you’ll make it up on the selling end. If you’re trying to get into the market for the first time, the only way you’ll know that we’ve “hit bottom” is when its in the rear view mirror. Work with professionals who can help you analyze your financial and lifestyle to determine if now is the right time to buy or sell.
Looking strictly at the numbers, it appears the recommendation for this month is – it’s time to buy. With 3.0 months of inventory on the market, supply up 7% and demand down 17%, buyers who are looking for a deal might be able to negotiate one. Market forces favoring buyers might not last too much longer, so don’t wait. The earlier you can start the home buying process, the less you’ll pay. We expect demand and prices to increase as we head into Spring, which is just around the corner. If you’re looking to buy, we can help you find the right house in the right neighborhood for you and your family. We know the market and know how to negotiate the best deals possible. For more info about buying a home, visit Buy a Home in Leander.
If you’re a selling looking to sell, do everything you can to prepare your home to meet its new owner. Homes that are ready for the market sell faster and for more money. With the median sold price up 3% from last year, we know the buyers that are currently in the market are willing to pay slightly more for a home this year than last year. Make your home appealing to a buyer and you’ll have no trouble finding a buyer willing to pay a fair price. If you’re considering selling, work with a Realtor who knows how to get top dollar for your home. Check out our 88 Ways to Sell Your Home Faster and For More Money for some tips on how you can prepare your home to meet the market. The busiest time of year is just around the corner. Do what you can to prepare your home now and you’ll be ready at the perfect time. For more info about our Home Selling Program, check out Sell My Leander Home.
Questions About the Leander Real Estate Price Report?
Do you have questions about this Leander Real Estate Price Report? Call us at (512) 827-8323 or email us at info@11OaksRealty.com and we’ll help you in any way we can. If you’re looking to buy or sell Leander real estate, don’t forget to check out our Buyer Resources and our Seller Resources for more tips.


Leave a Reply