
Eleven Oaks Realty is proud to present their June 2018 Austin Real Estate Price Report measuring activity in the Austin single family home market.
Austin Median Home Price Down 1%
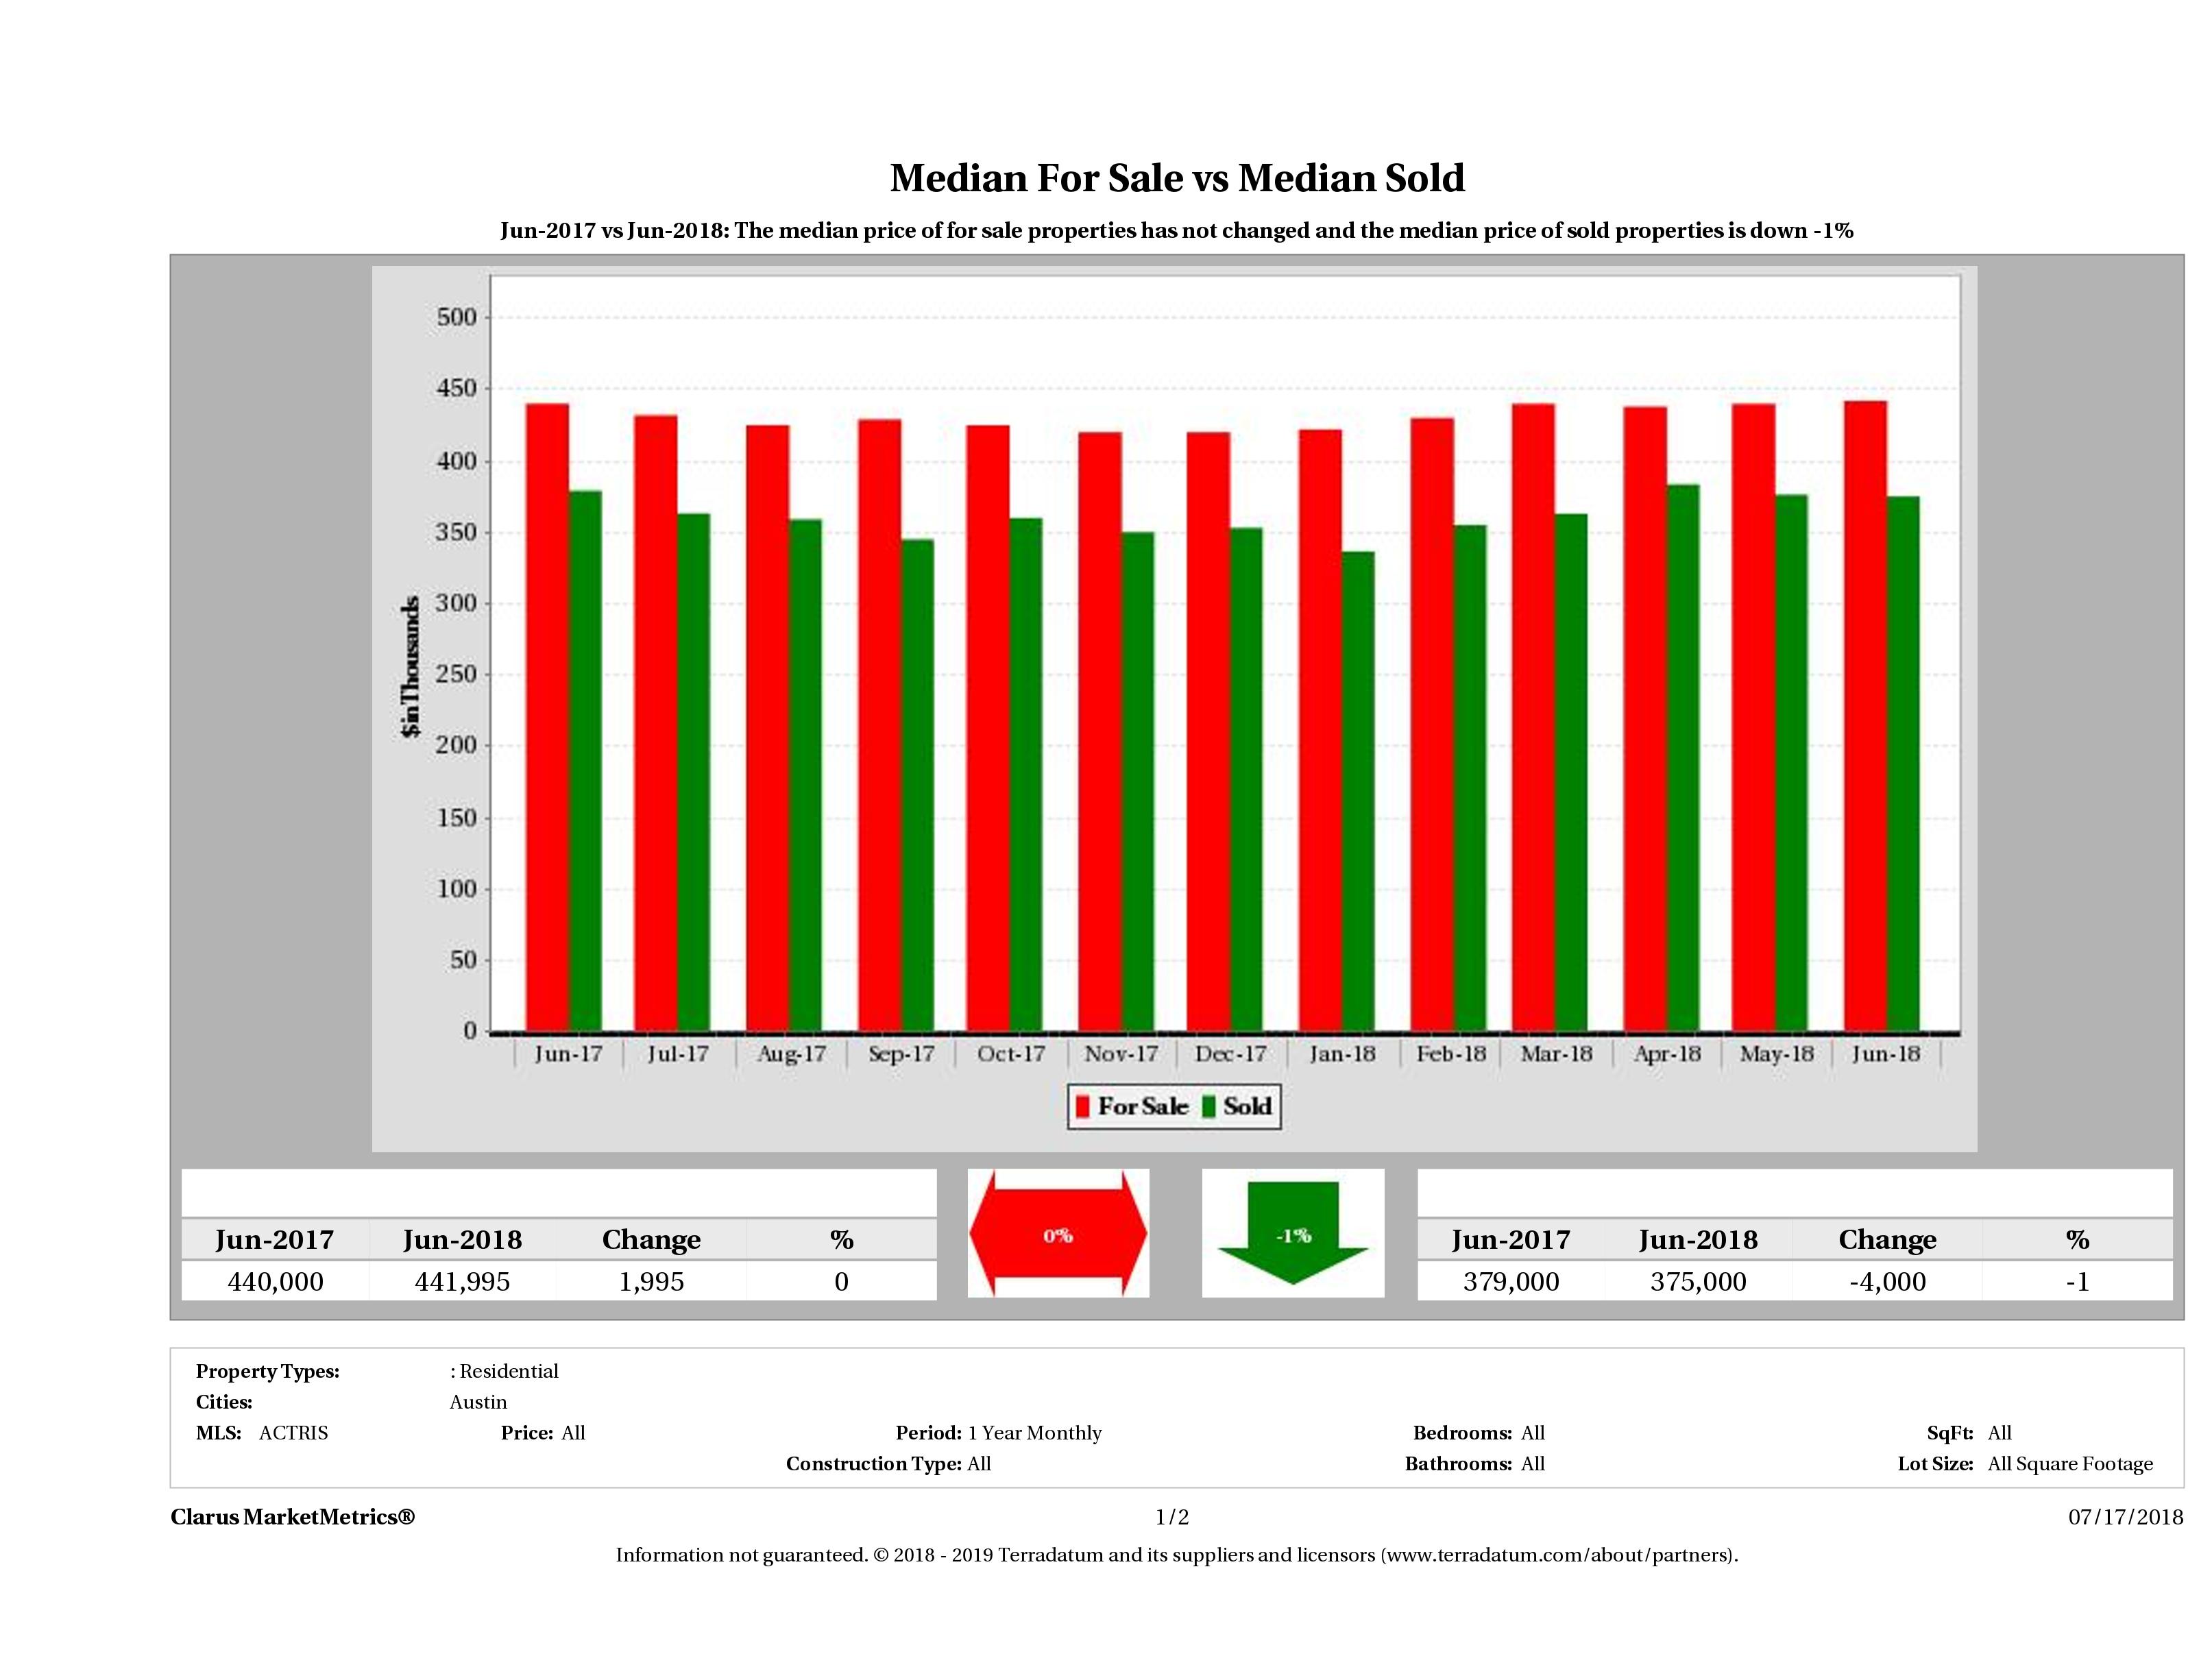
The biggest story this month: median home prices in Austin are down. The median price of an Austin home in June 2017 was $379,000 compared to $375,000 in June 2018, down 1% ($4,000) in year over year numbers. While this is not a large amount, it does show that buyers have a breaking point and are not willing to pay more money than they believe the house to be worth. It will be interesting to see how the rest of the summer unfolds.
Median home price helps us see the distribution of homes sold and does not really give us an indication of the increase or decrease in a particular home’s market value. To analyze market value, we’d have to take an in depth look at a neighborhood. If you’re looking for something like that, please check out our Austin Home Values Report.
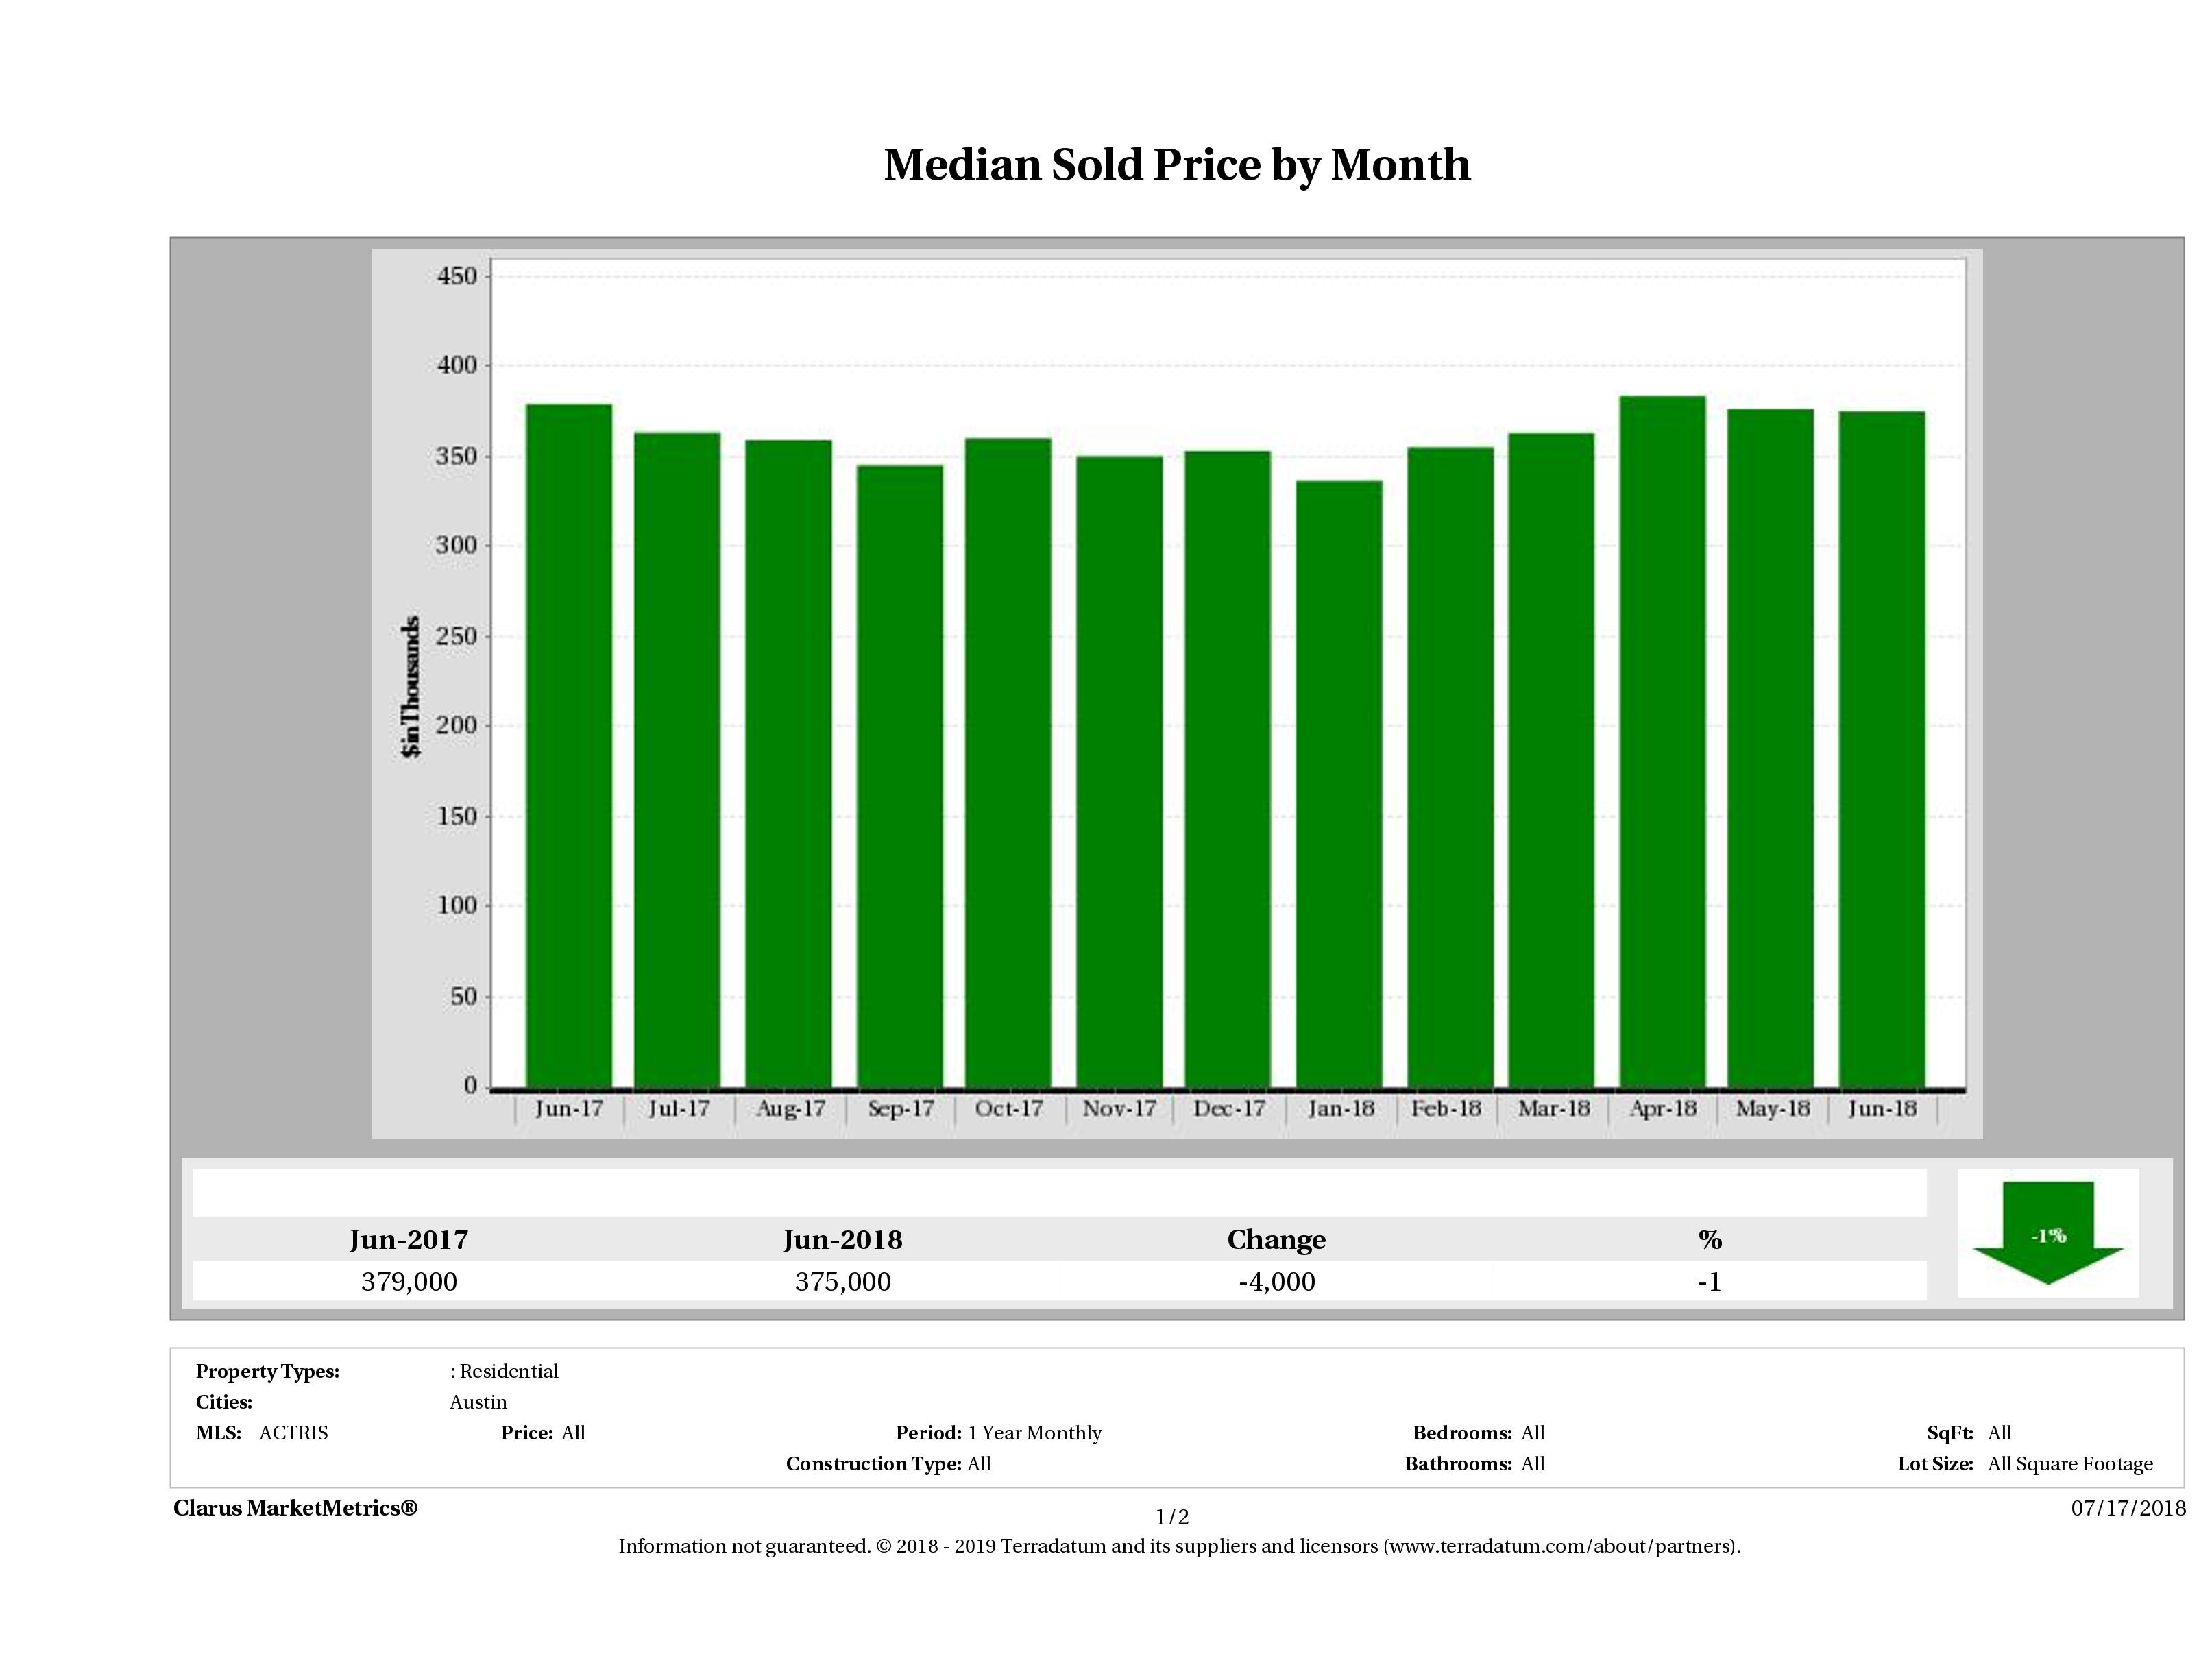
What does this mean to buyers? This is now the second exception in the last 44 months of increases. So while this is notable, the market is still very healthy.
What does this mean to sellers? You need to be priced competitively from the start. Sellers must take advantage of their new-to-market status by generating momentum and competition.
Looking for more actionable facts about the market? Check out our recent post: 3 Key Facts for Austin Home Buyers and Sellers.
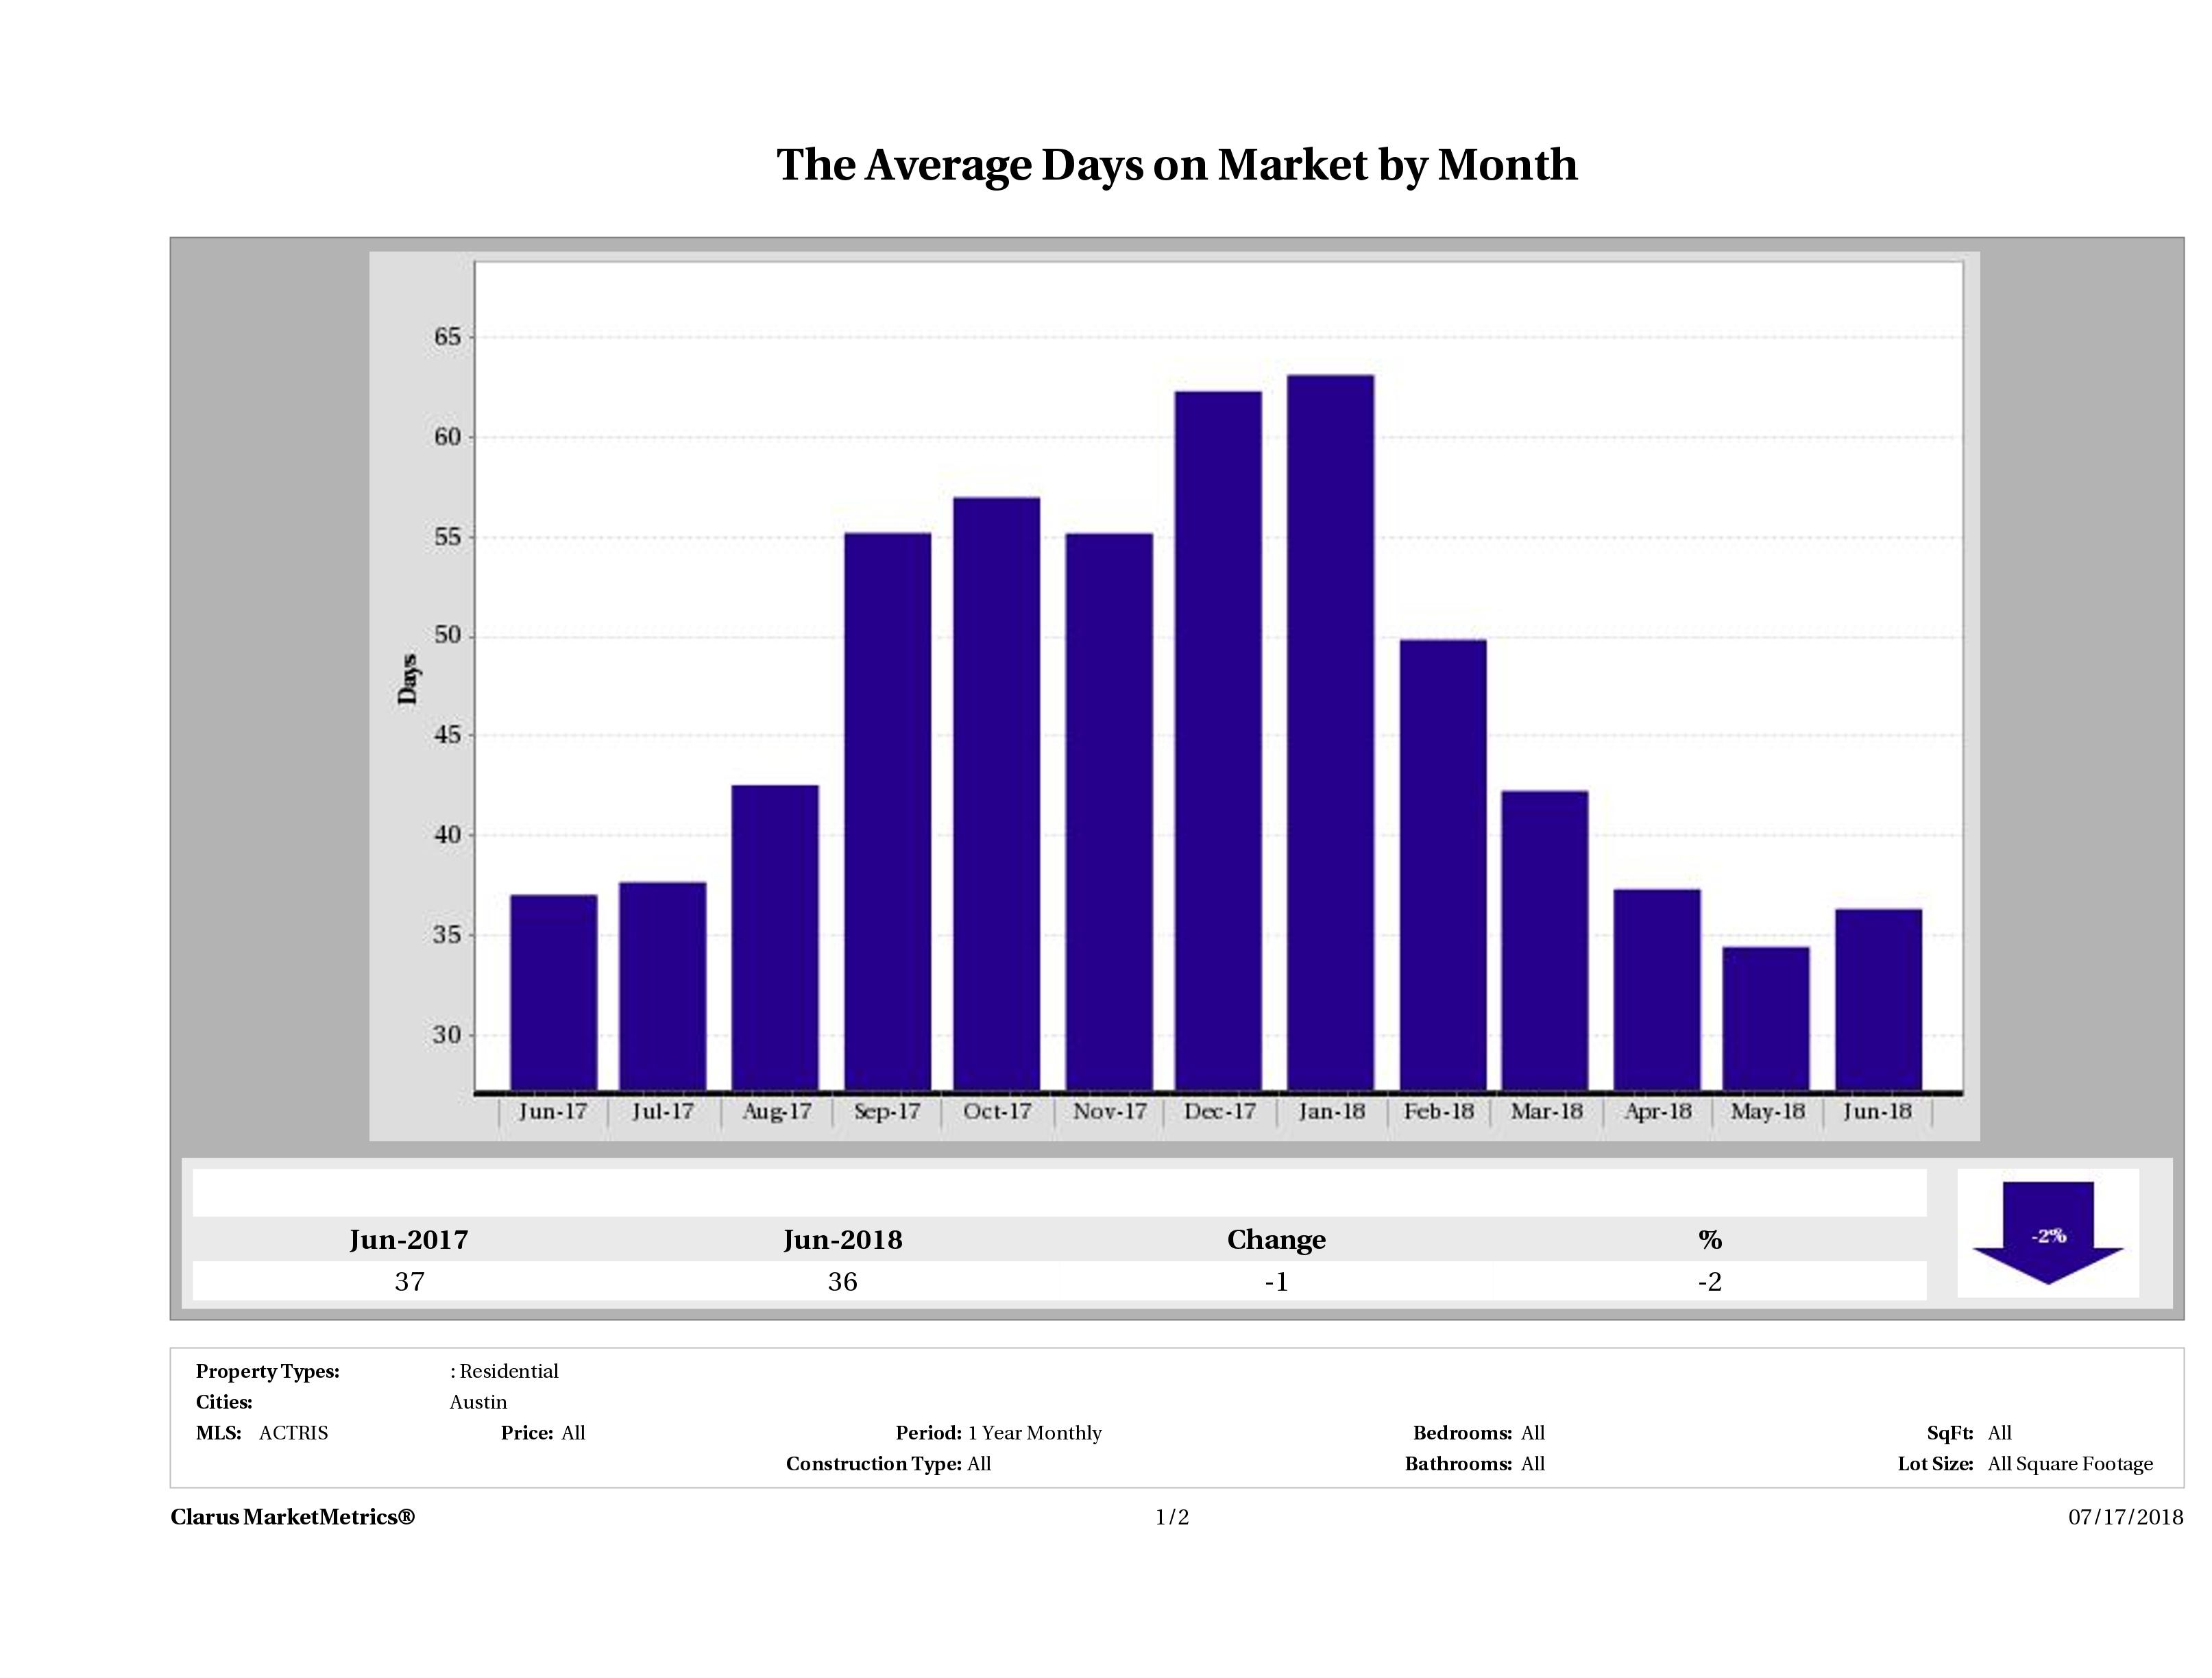
2% Decrease in Time to Sell Home in Austin
In June 2018, it took 36 days to sell a home in Austin, on average, compared to 37 days in June 2017, marking a 2% decrease in year over year numbers.
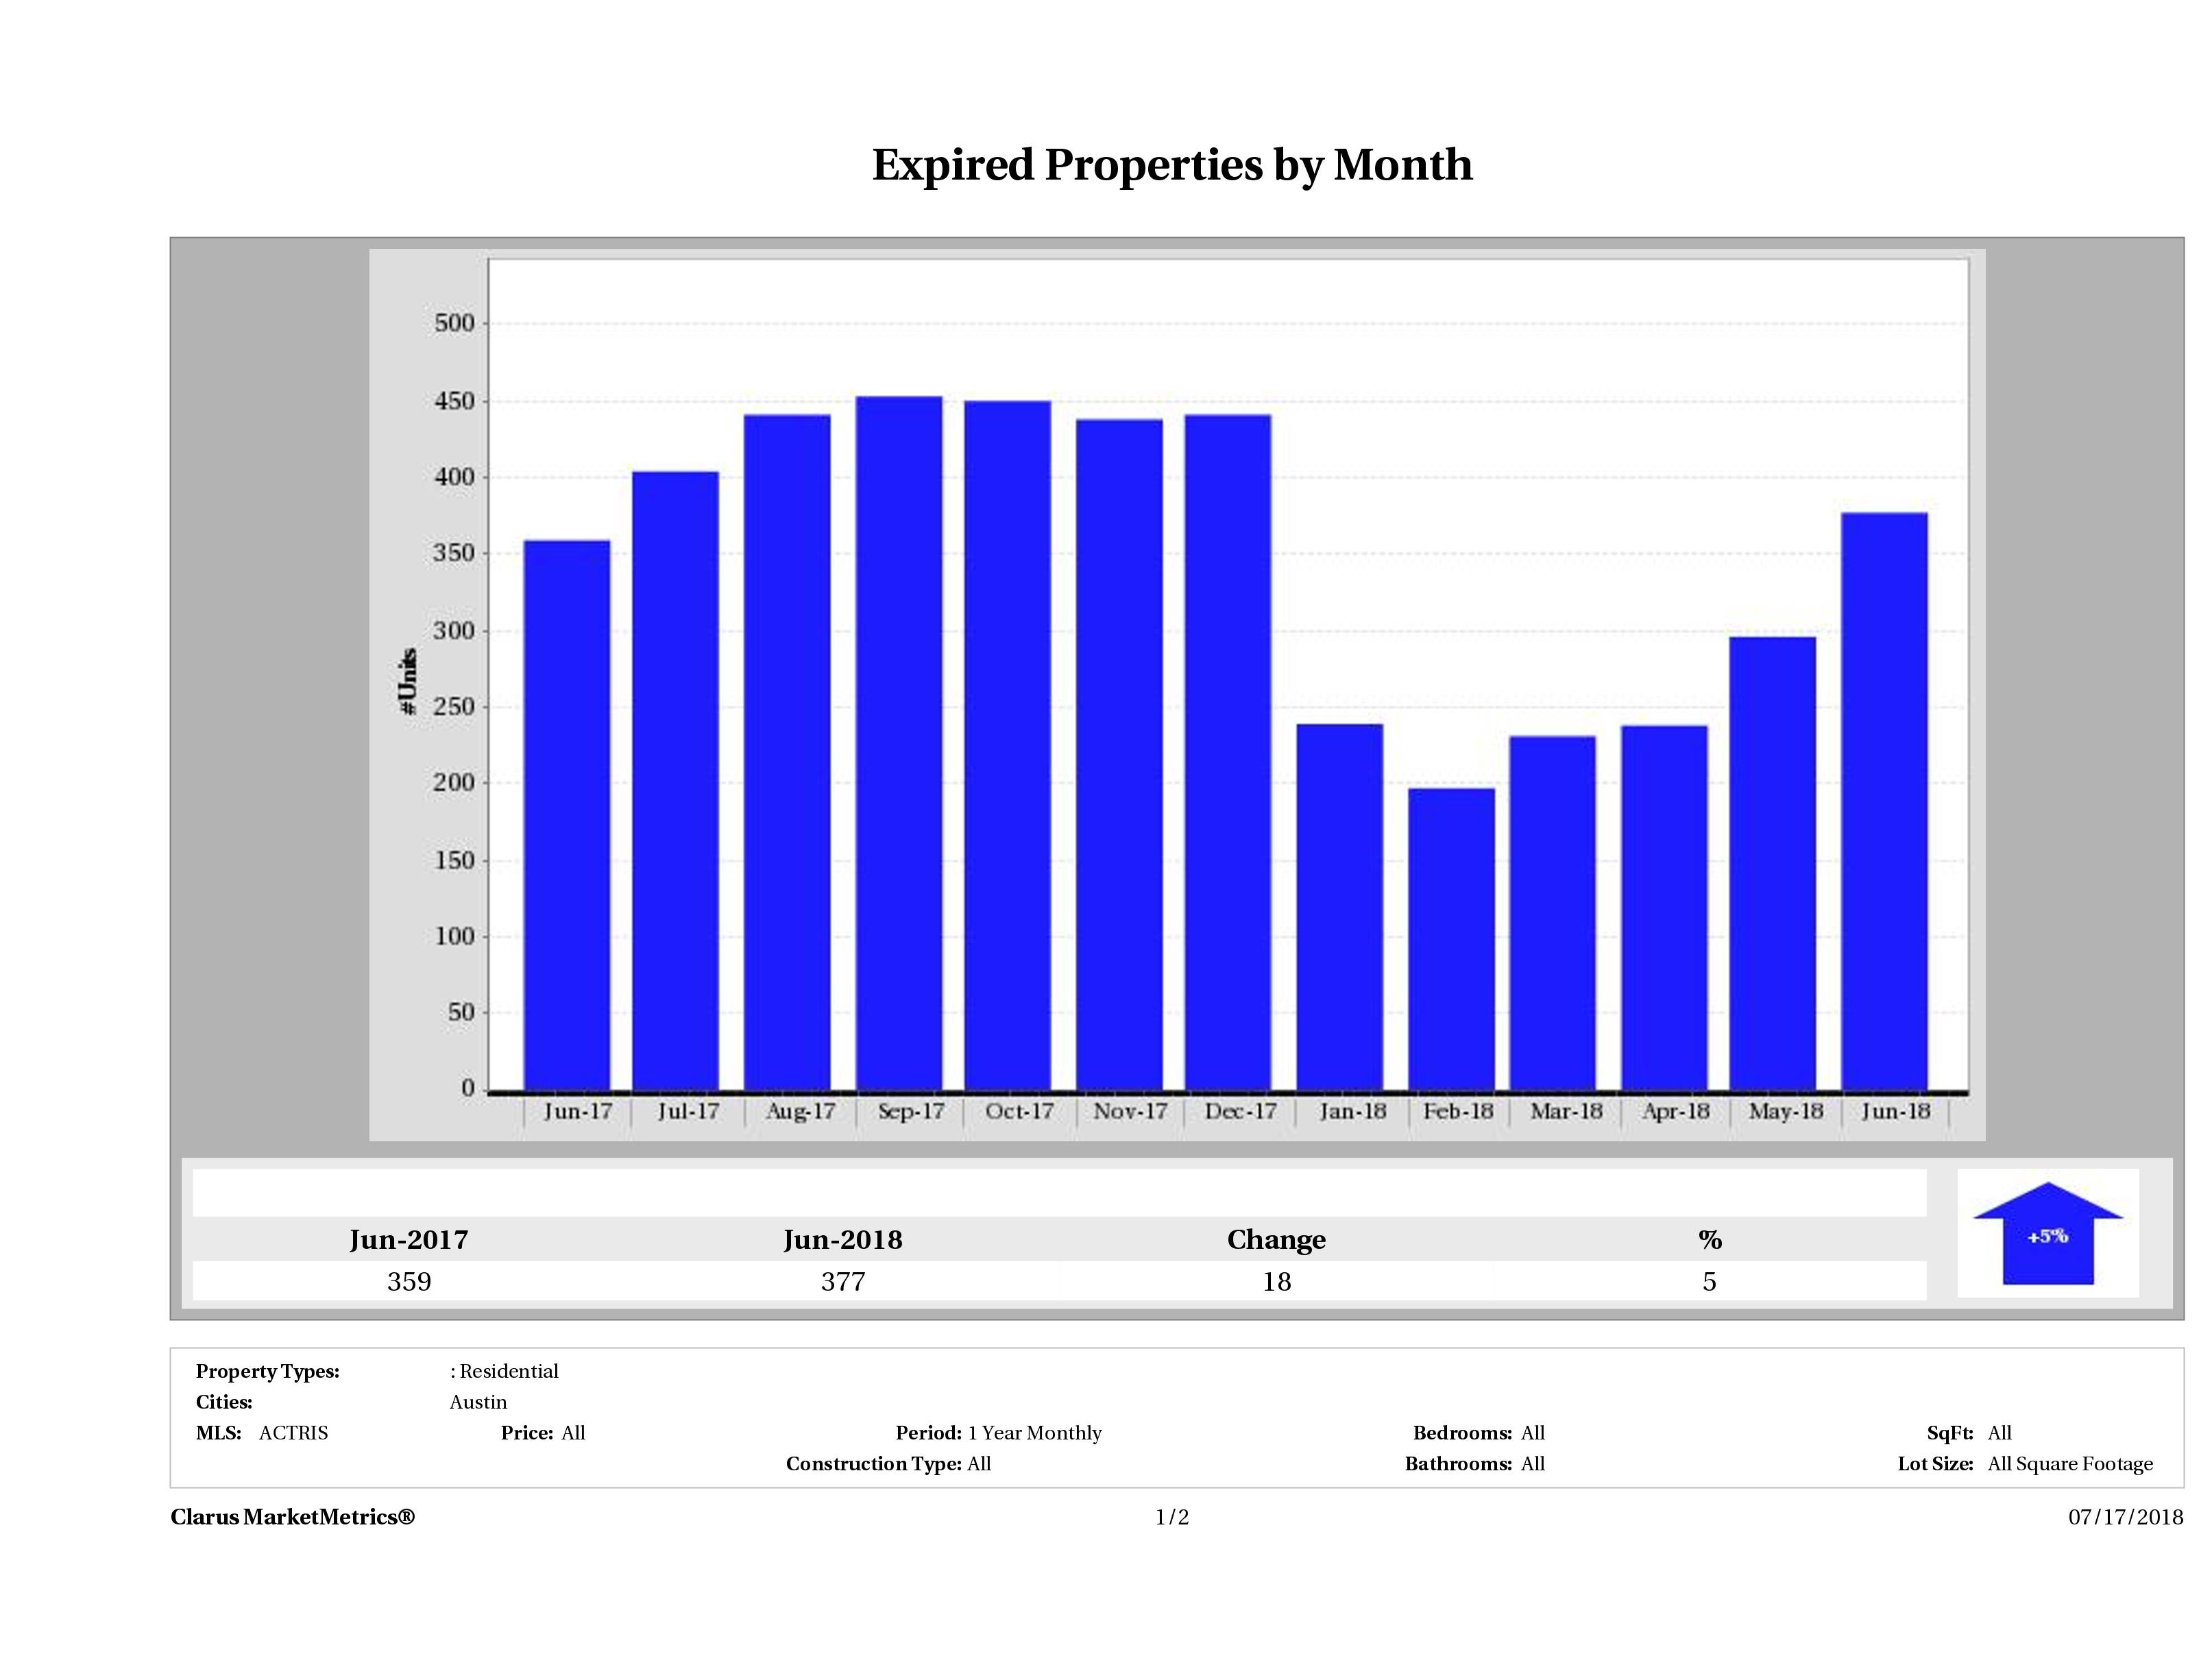
Number of Homes Taken Off the Market Up 5%
In June 2018, there were 377 homes taken off the market compared to 359 in June 2017. This marked a 5% (18 home) increase in year over year numbers. We continue to see unrealistic sellers take their homes off the market rather than lower the price.
If you need to sell and your home was priced right, maybe there was something else going on. The biggest culprits we see are incorrect info in the MLS and poor marketing. Check out our Austin Home Marketing Plan to see how your homes would be marketed.
Having trouble selling your home? Check out our Austin Home Not Selling resources page to find out why.
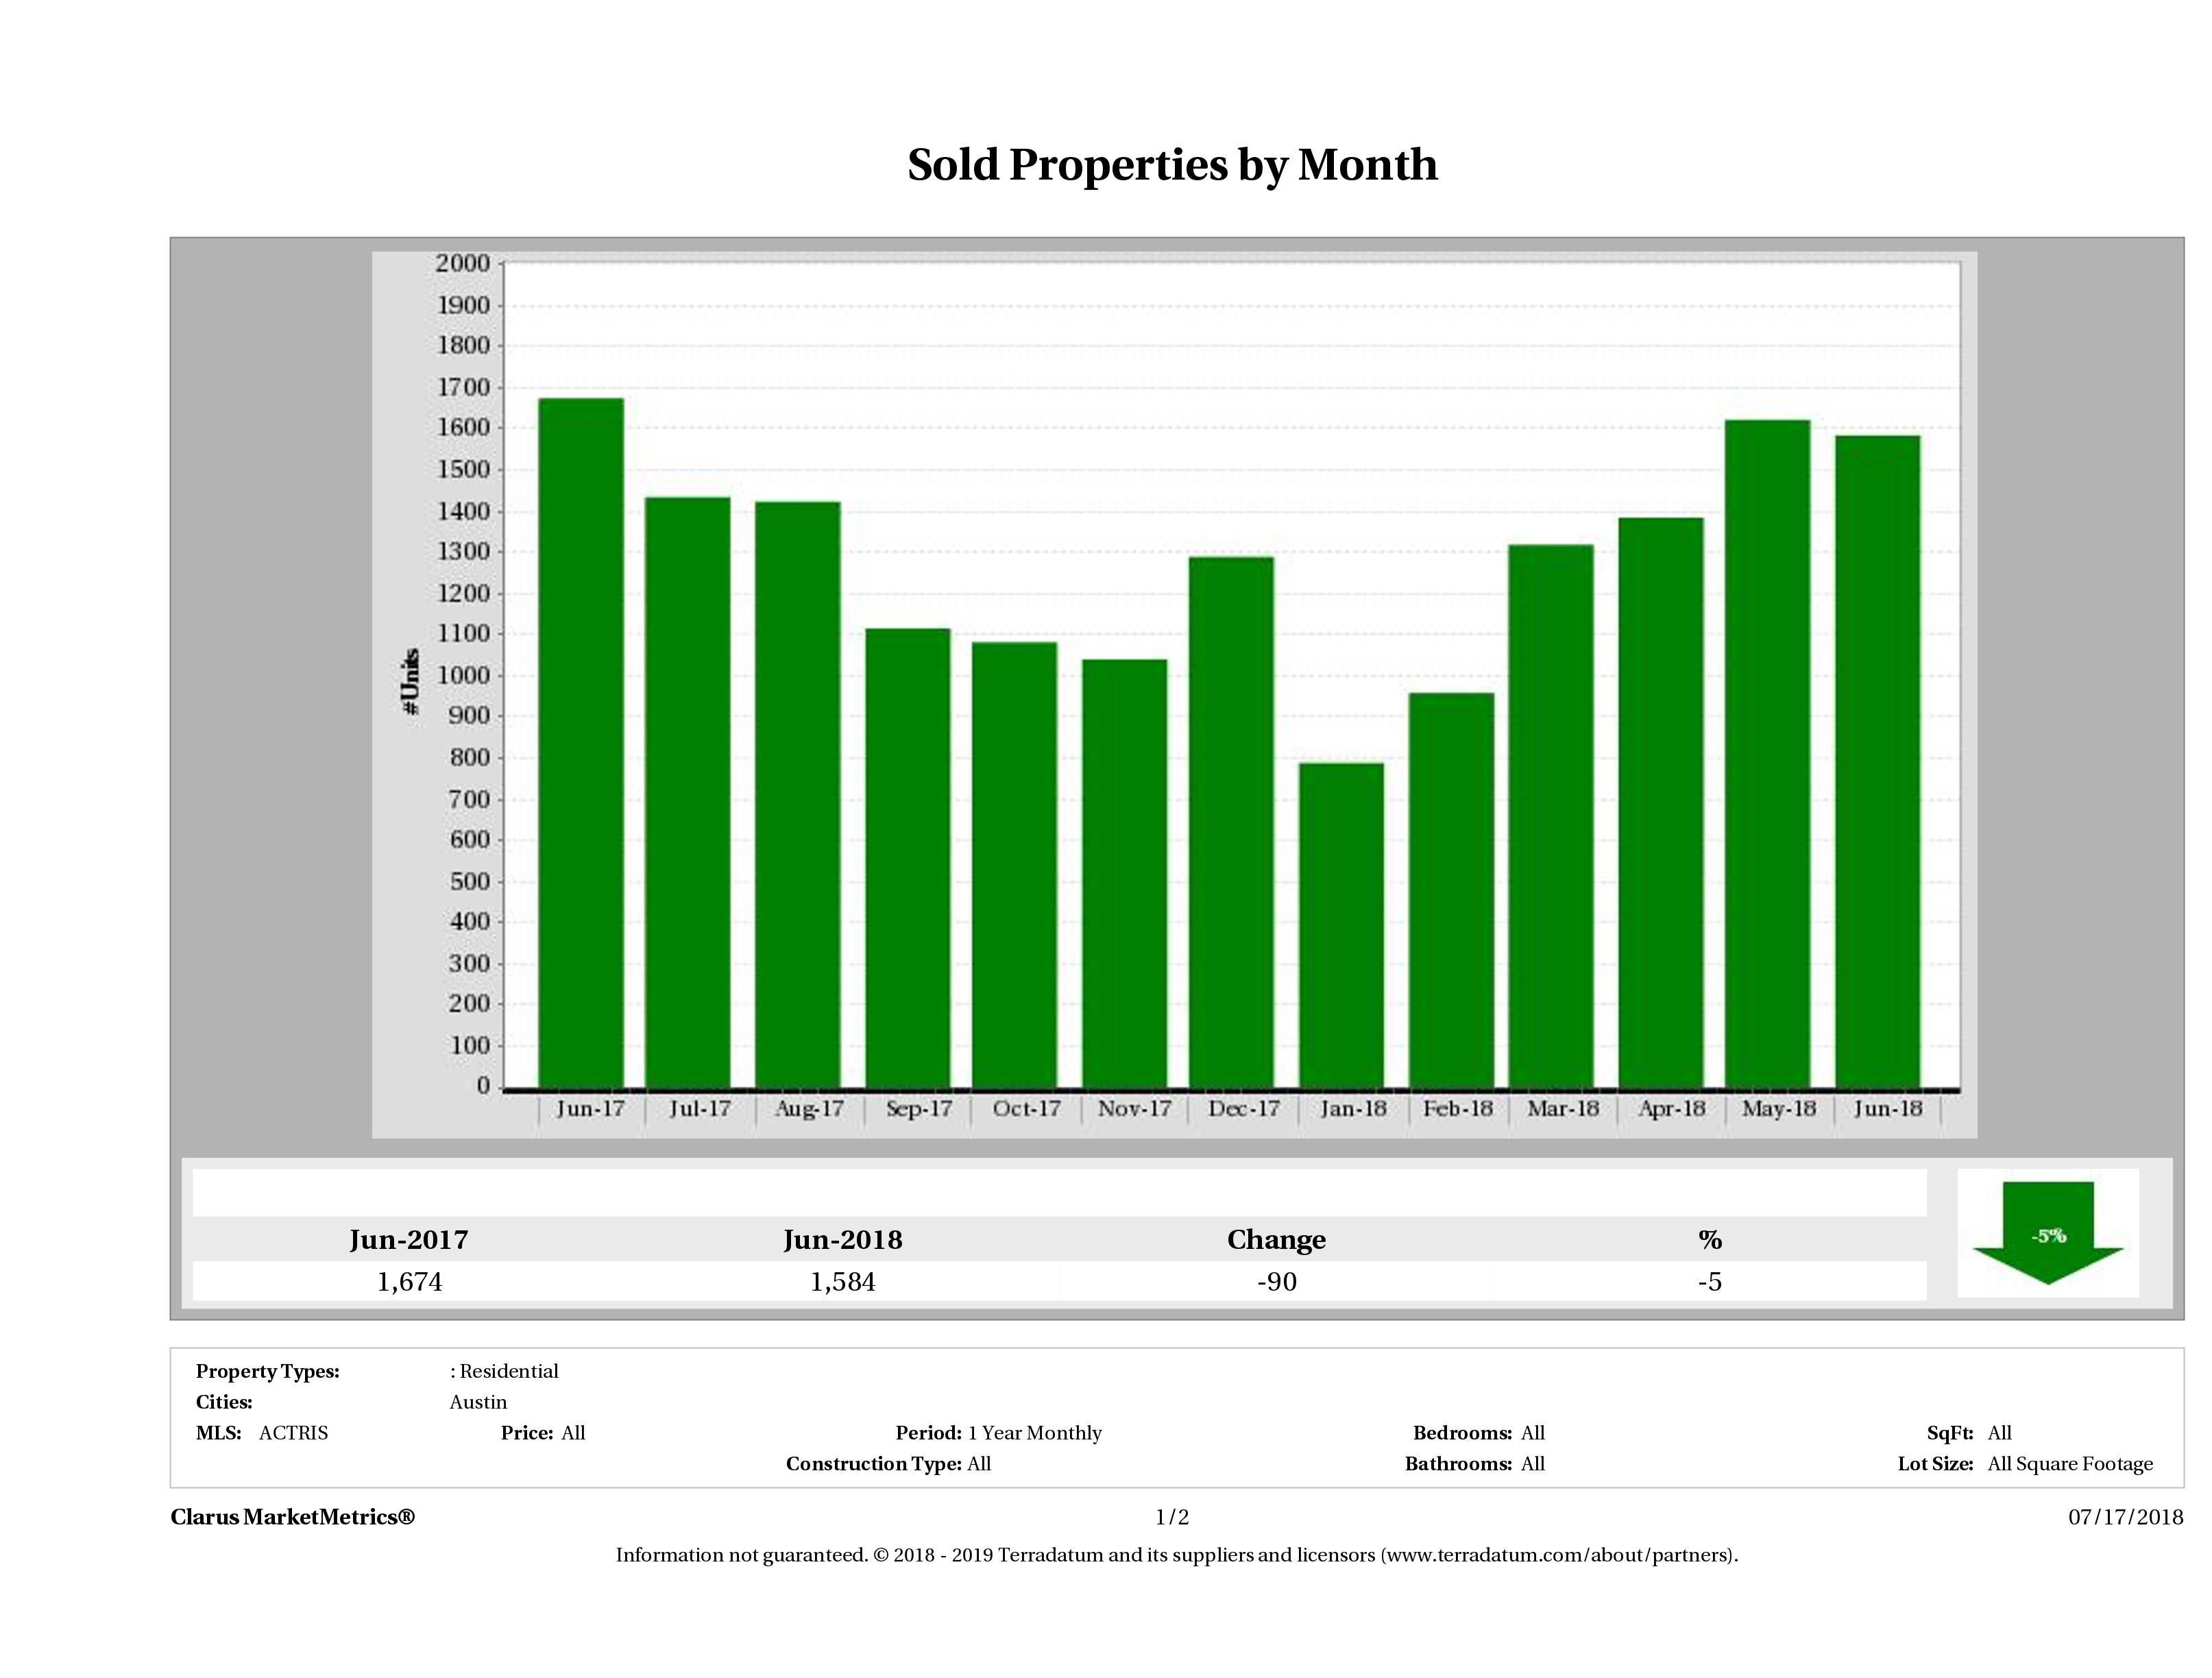
5% Decrease in the Number of Sold Homes in Austin
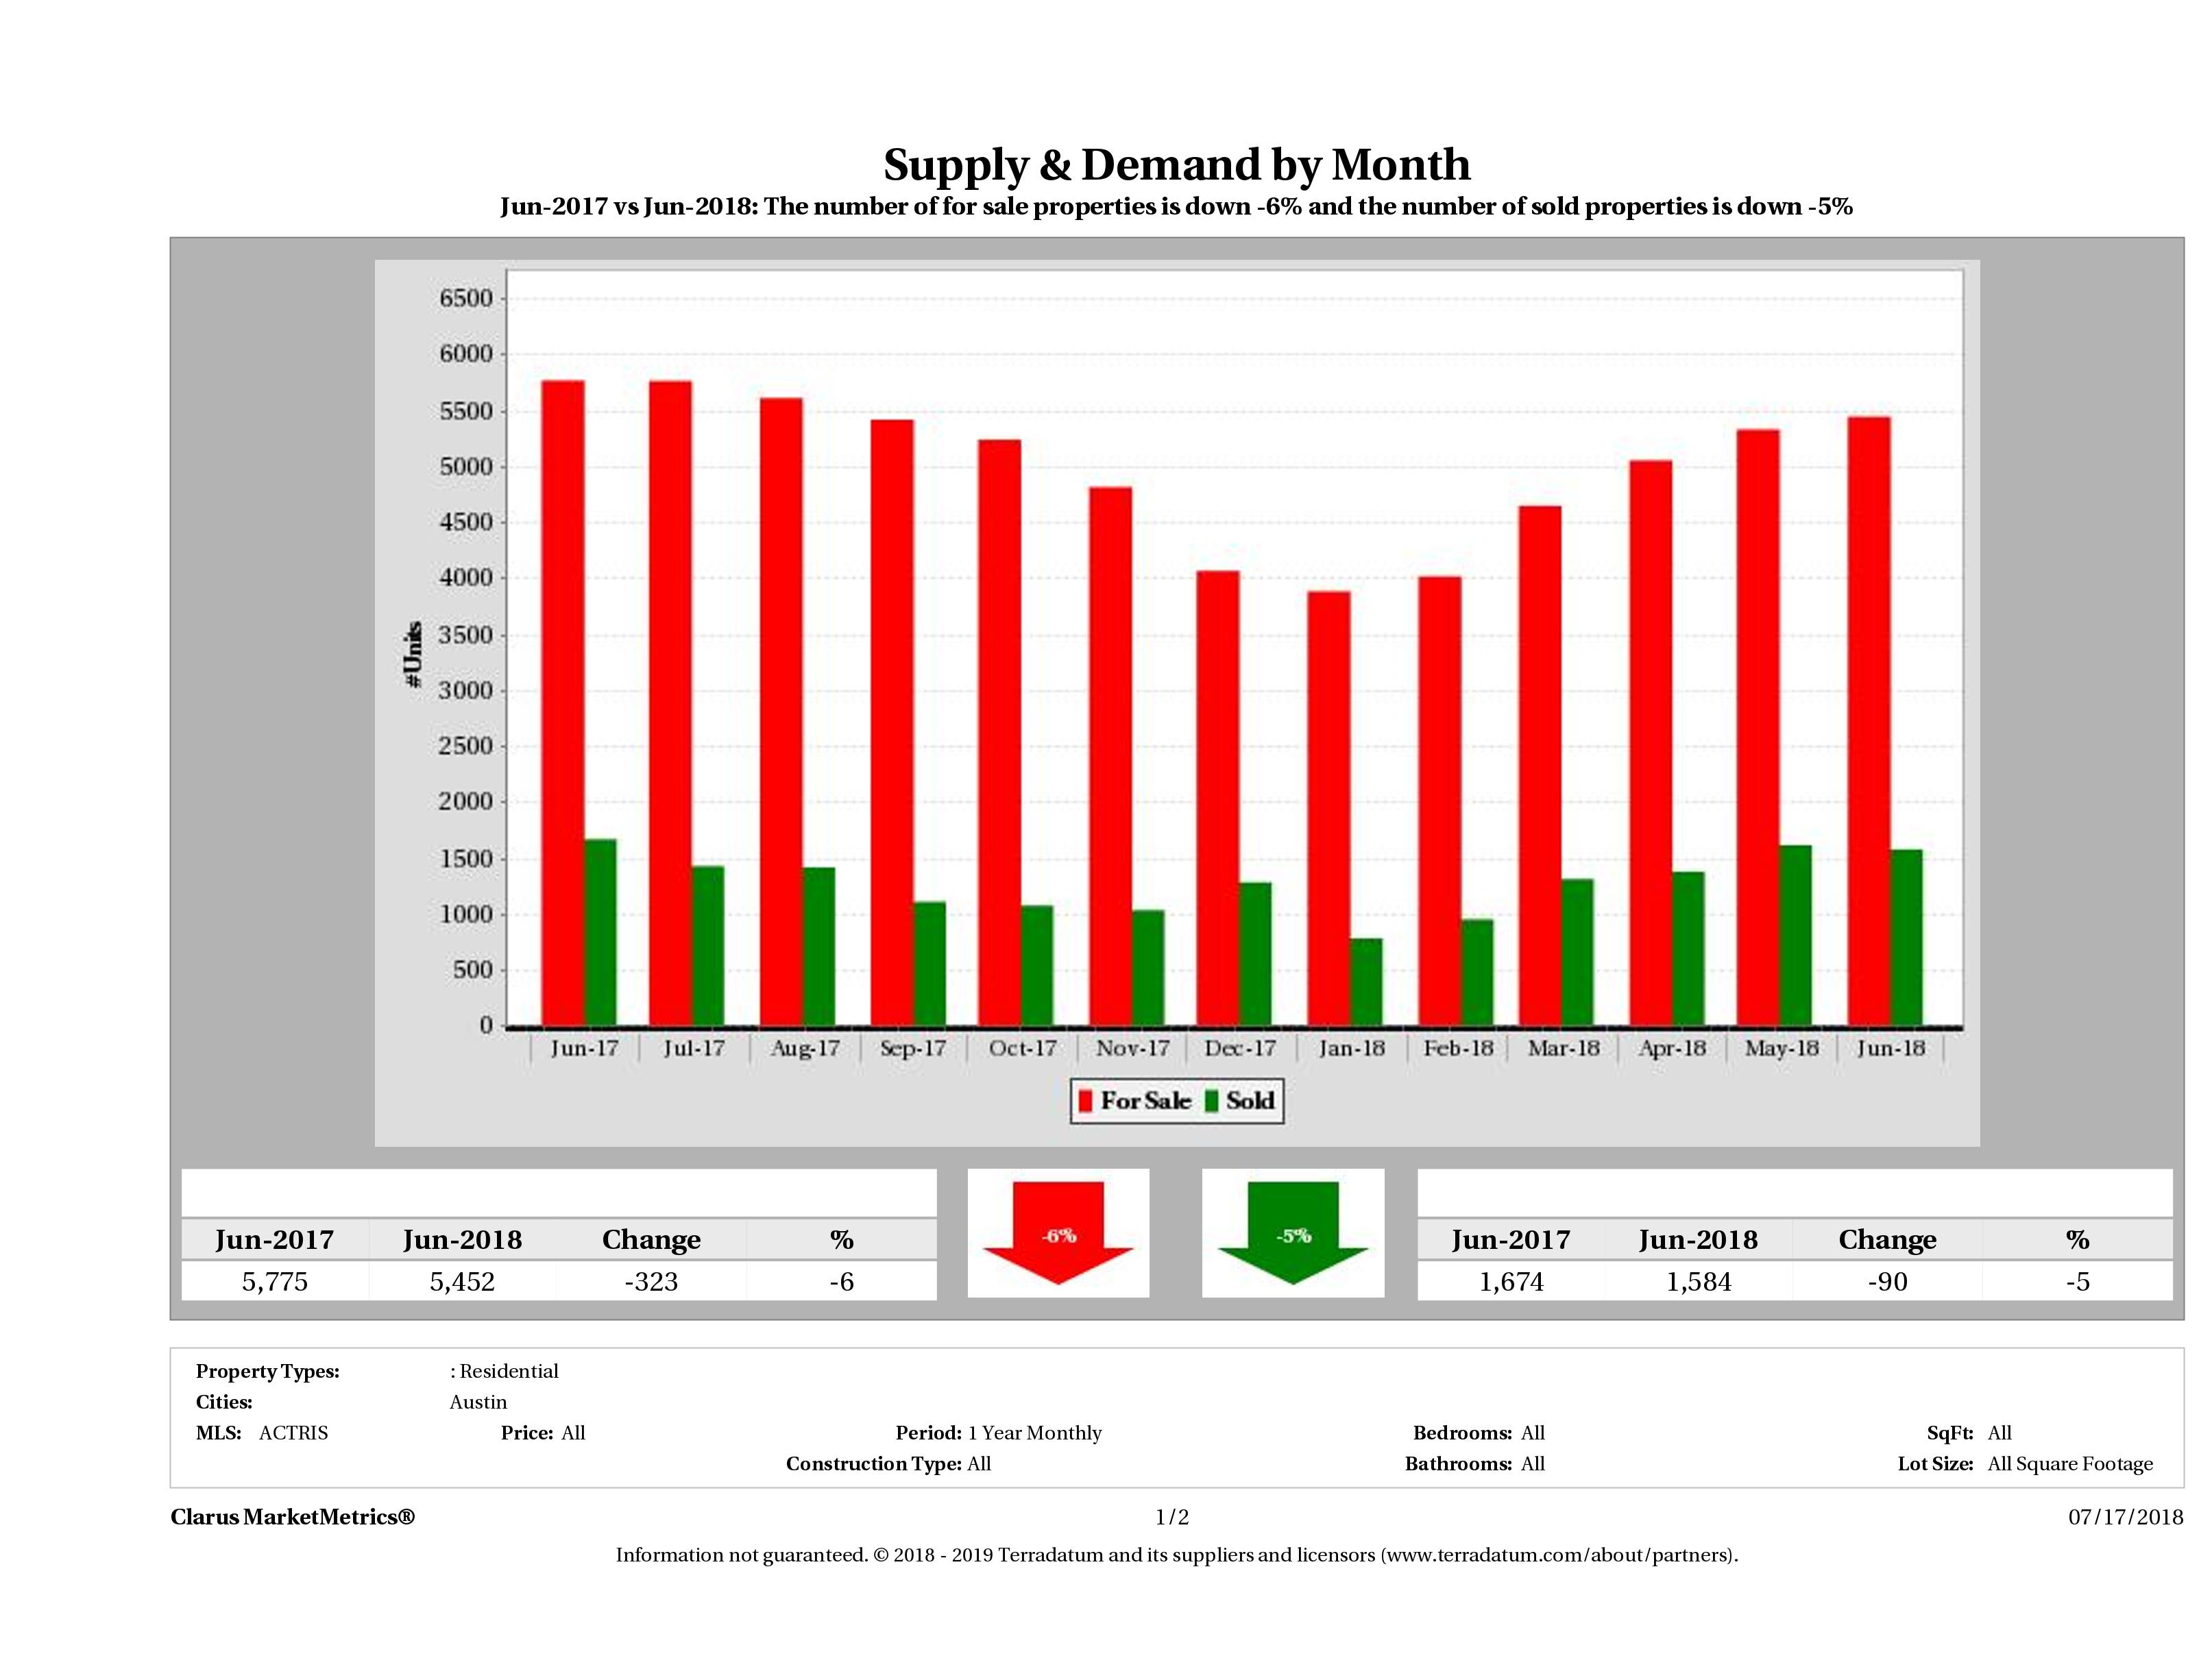
In June 2018, Austin saw a 5% decrease in the number of homes sold from June 2017 to June 2018. In June 2018, we saw 1,584 homes sell in Austin compared to 1,674 in June 2017 marking a 5% (90 home) decrease in year over year numbers.
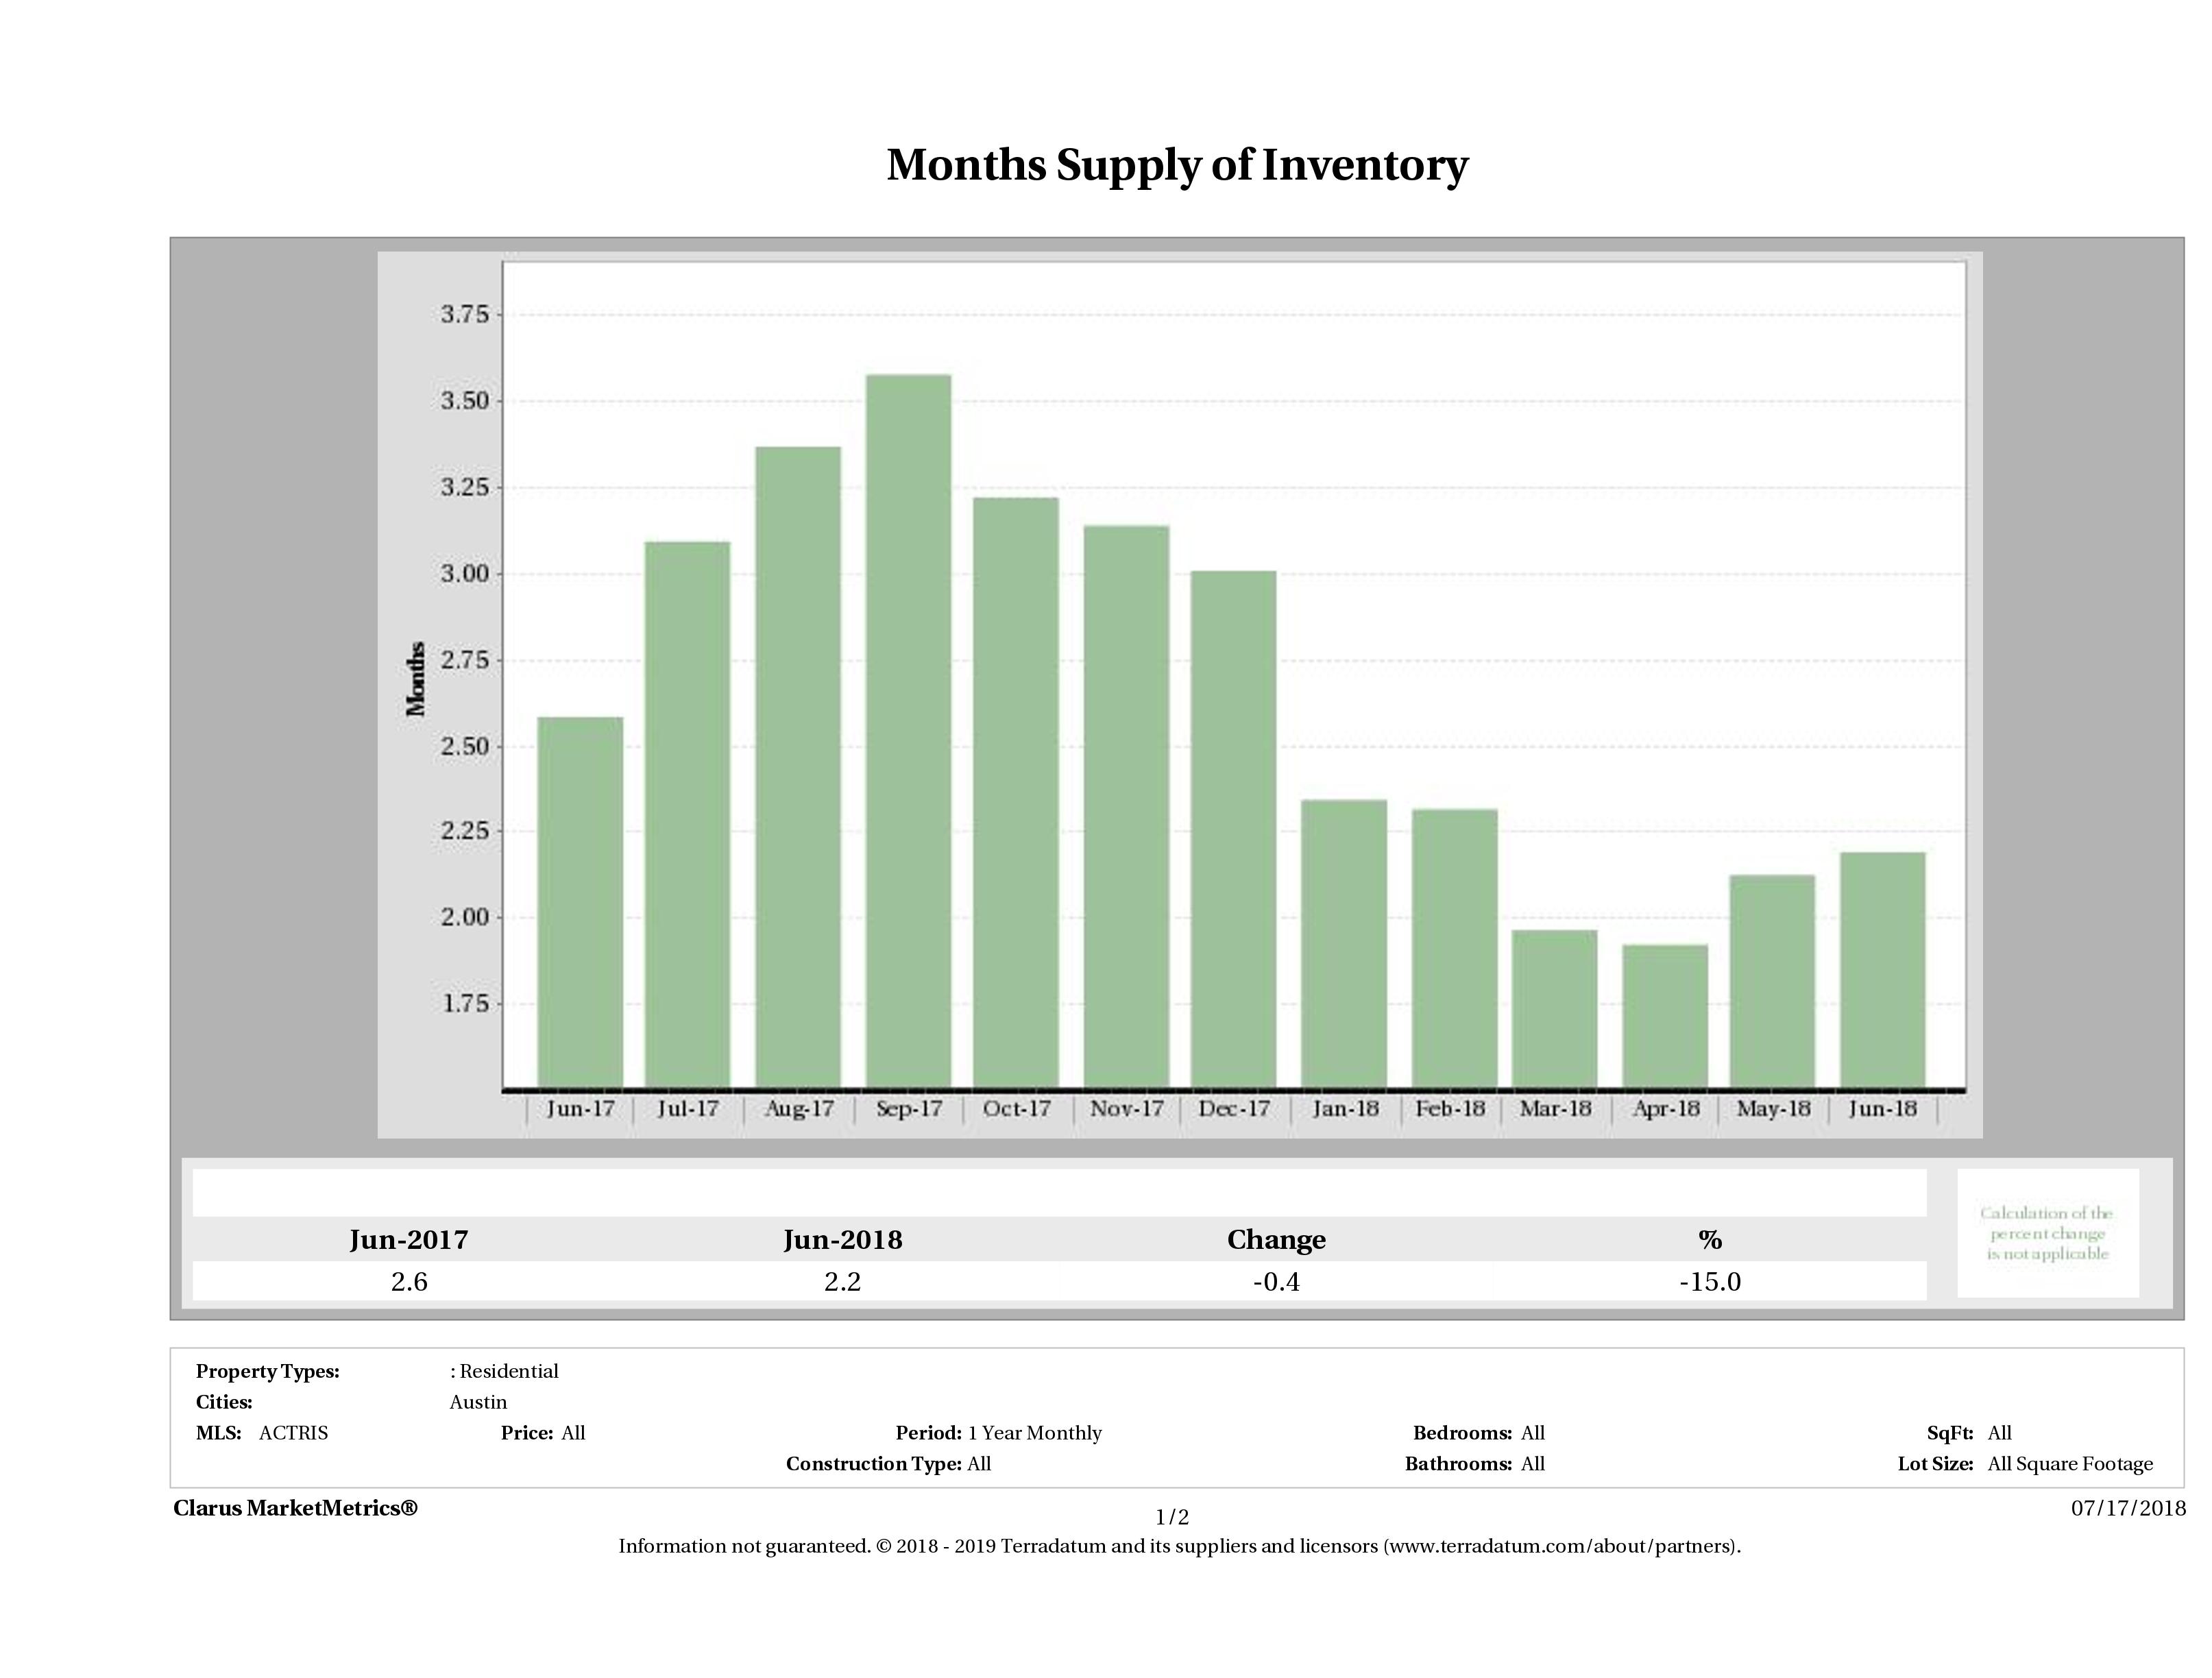
15% Decrease in Austin Housing Inventory
In June 2018, we saw 2.2 months of inventory on the market, compared to 2.6 months of inventory in June 2017, marking a 15% decrease in year over year numbers. For the past year, we’ve consistently seen extremely low inventory levels and this month appears to be no different.
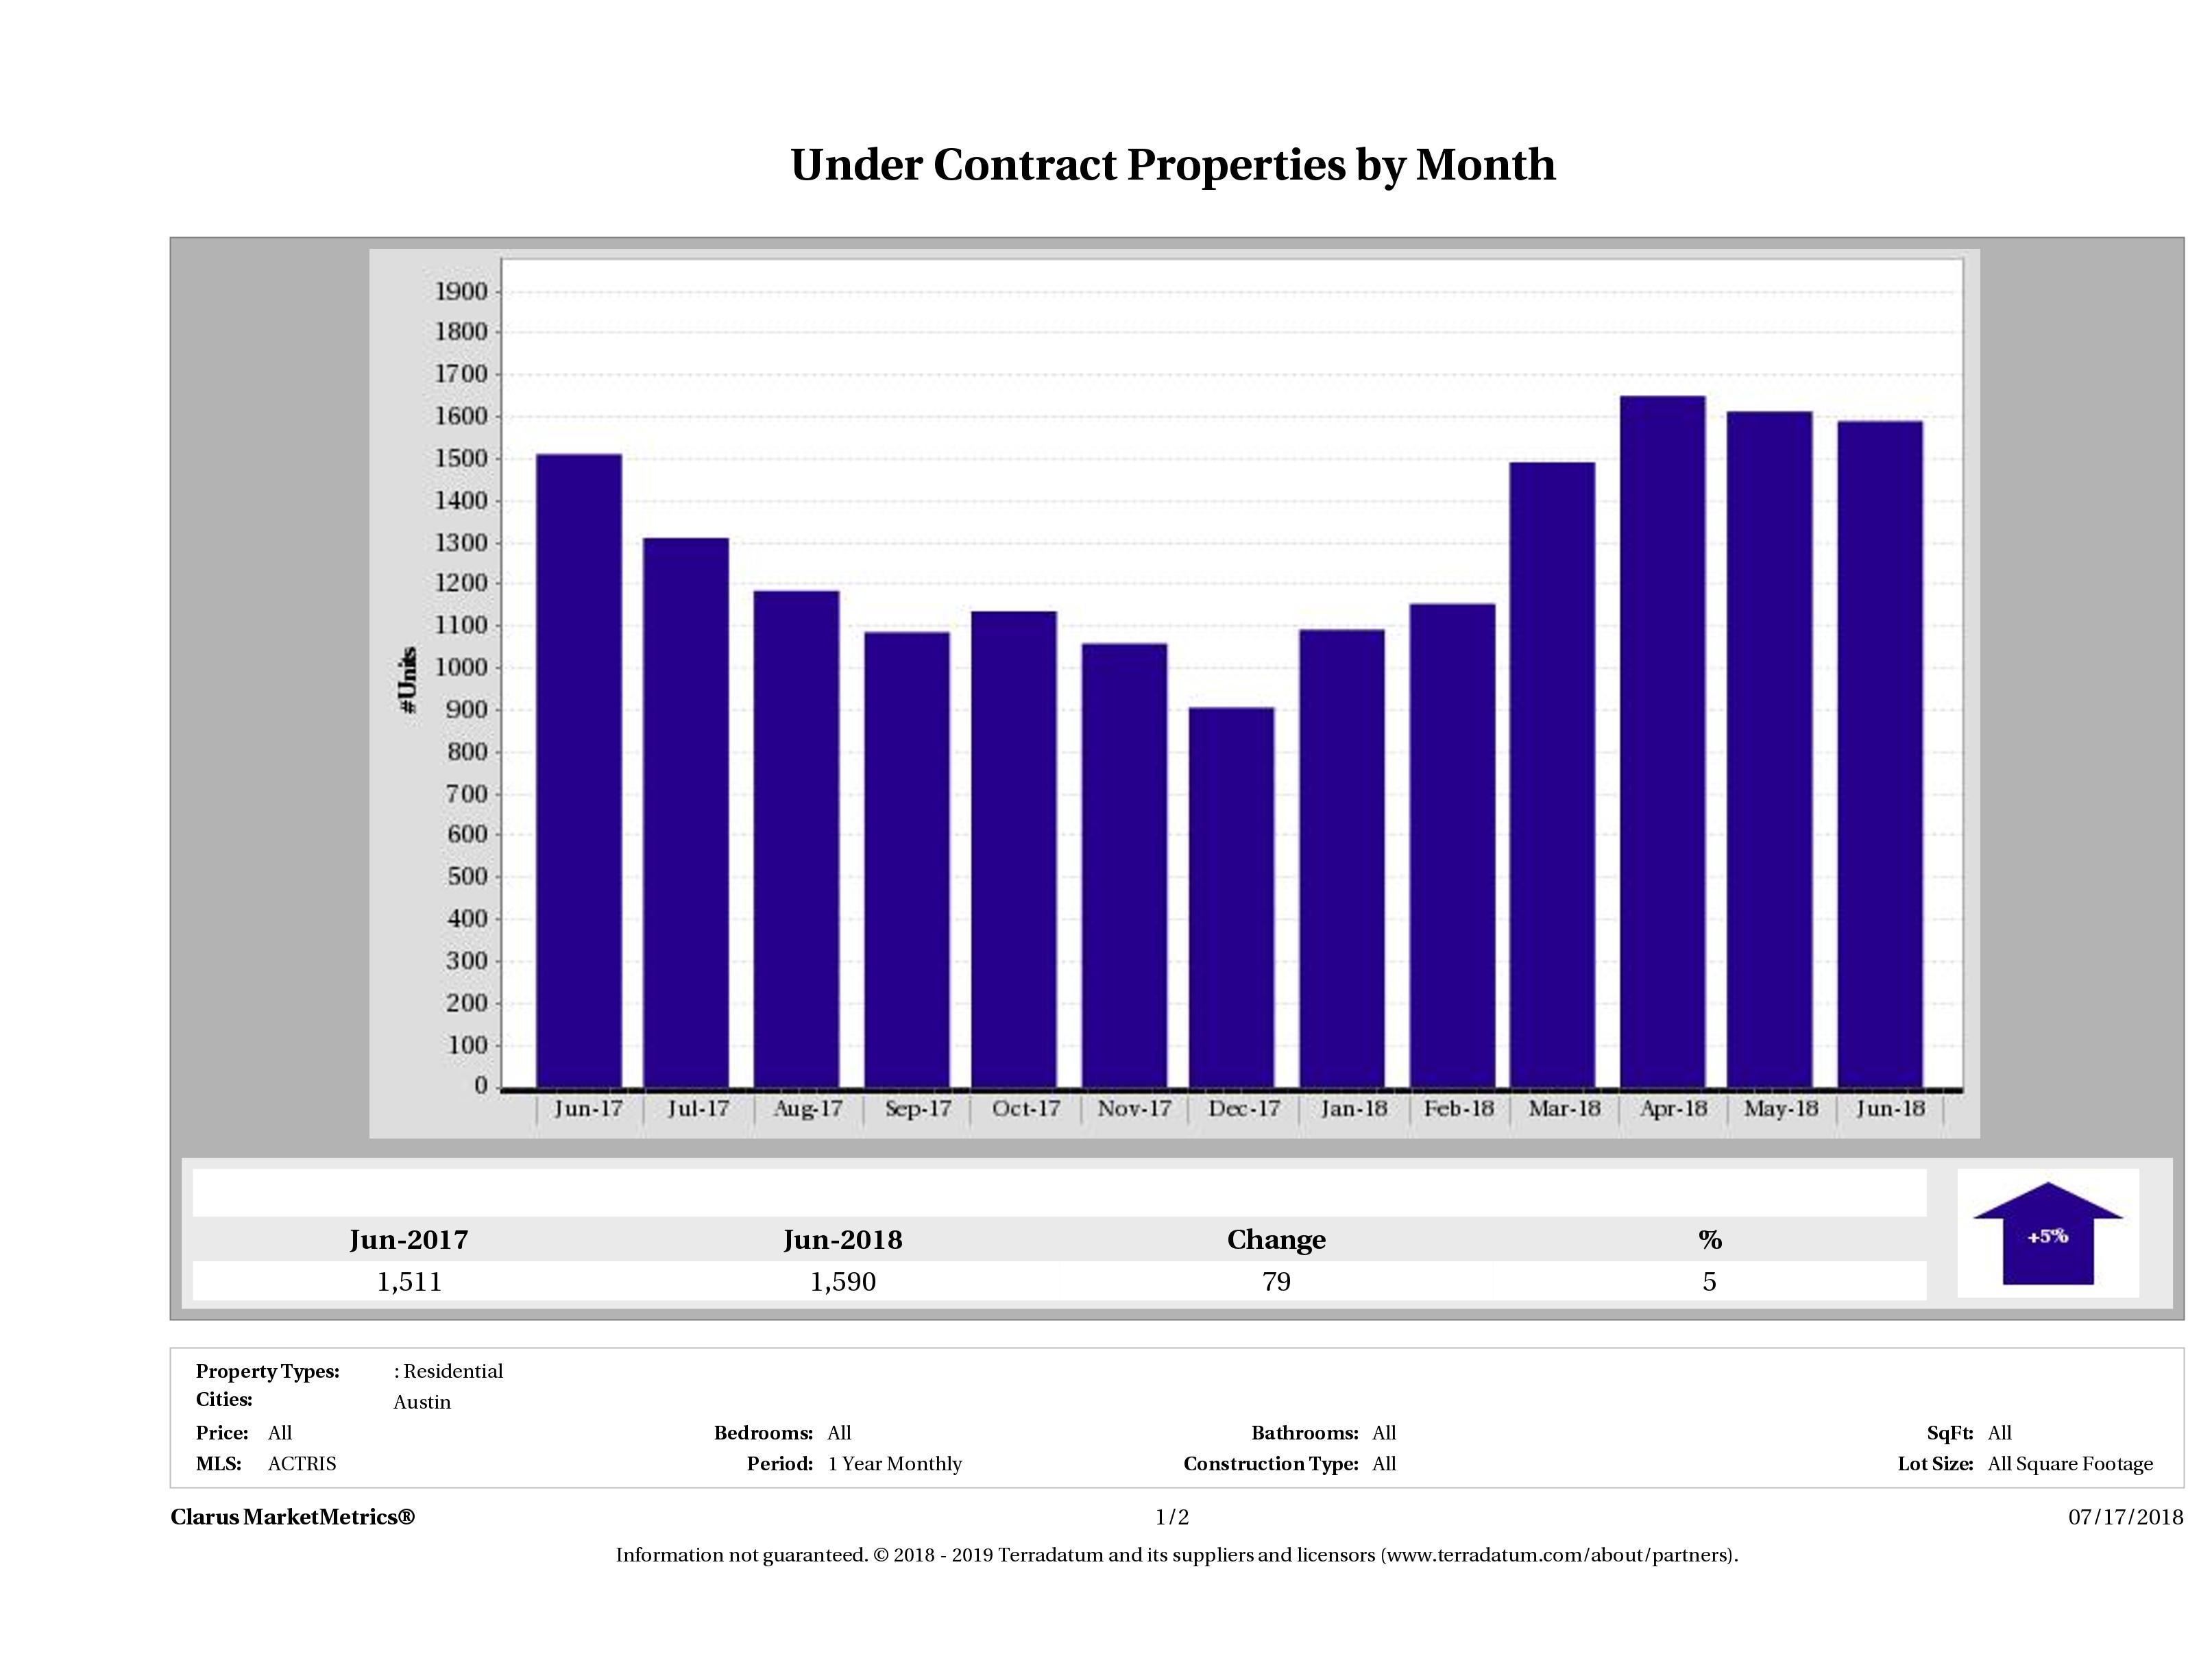
Austin Homes Under Contract Up 5%
In June 2018, 1,590 homes went pending (under contract) in Austin compared to 1,511 in June 2017, marking a 5% (79 home) increase in year over year numbers.
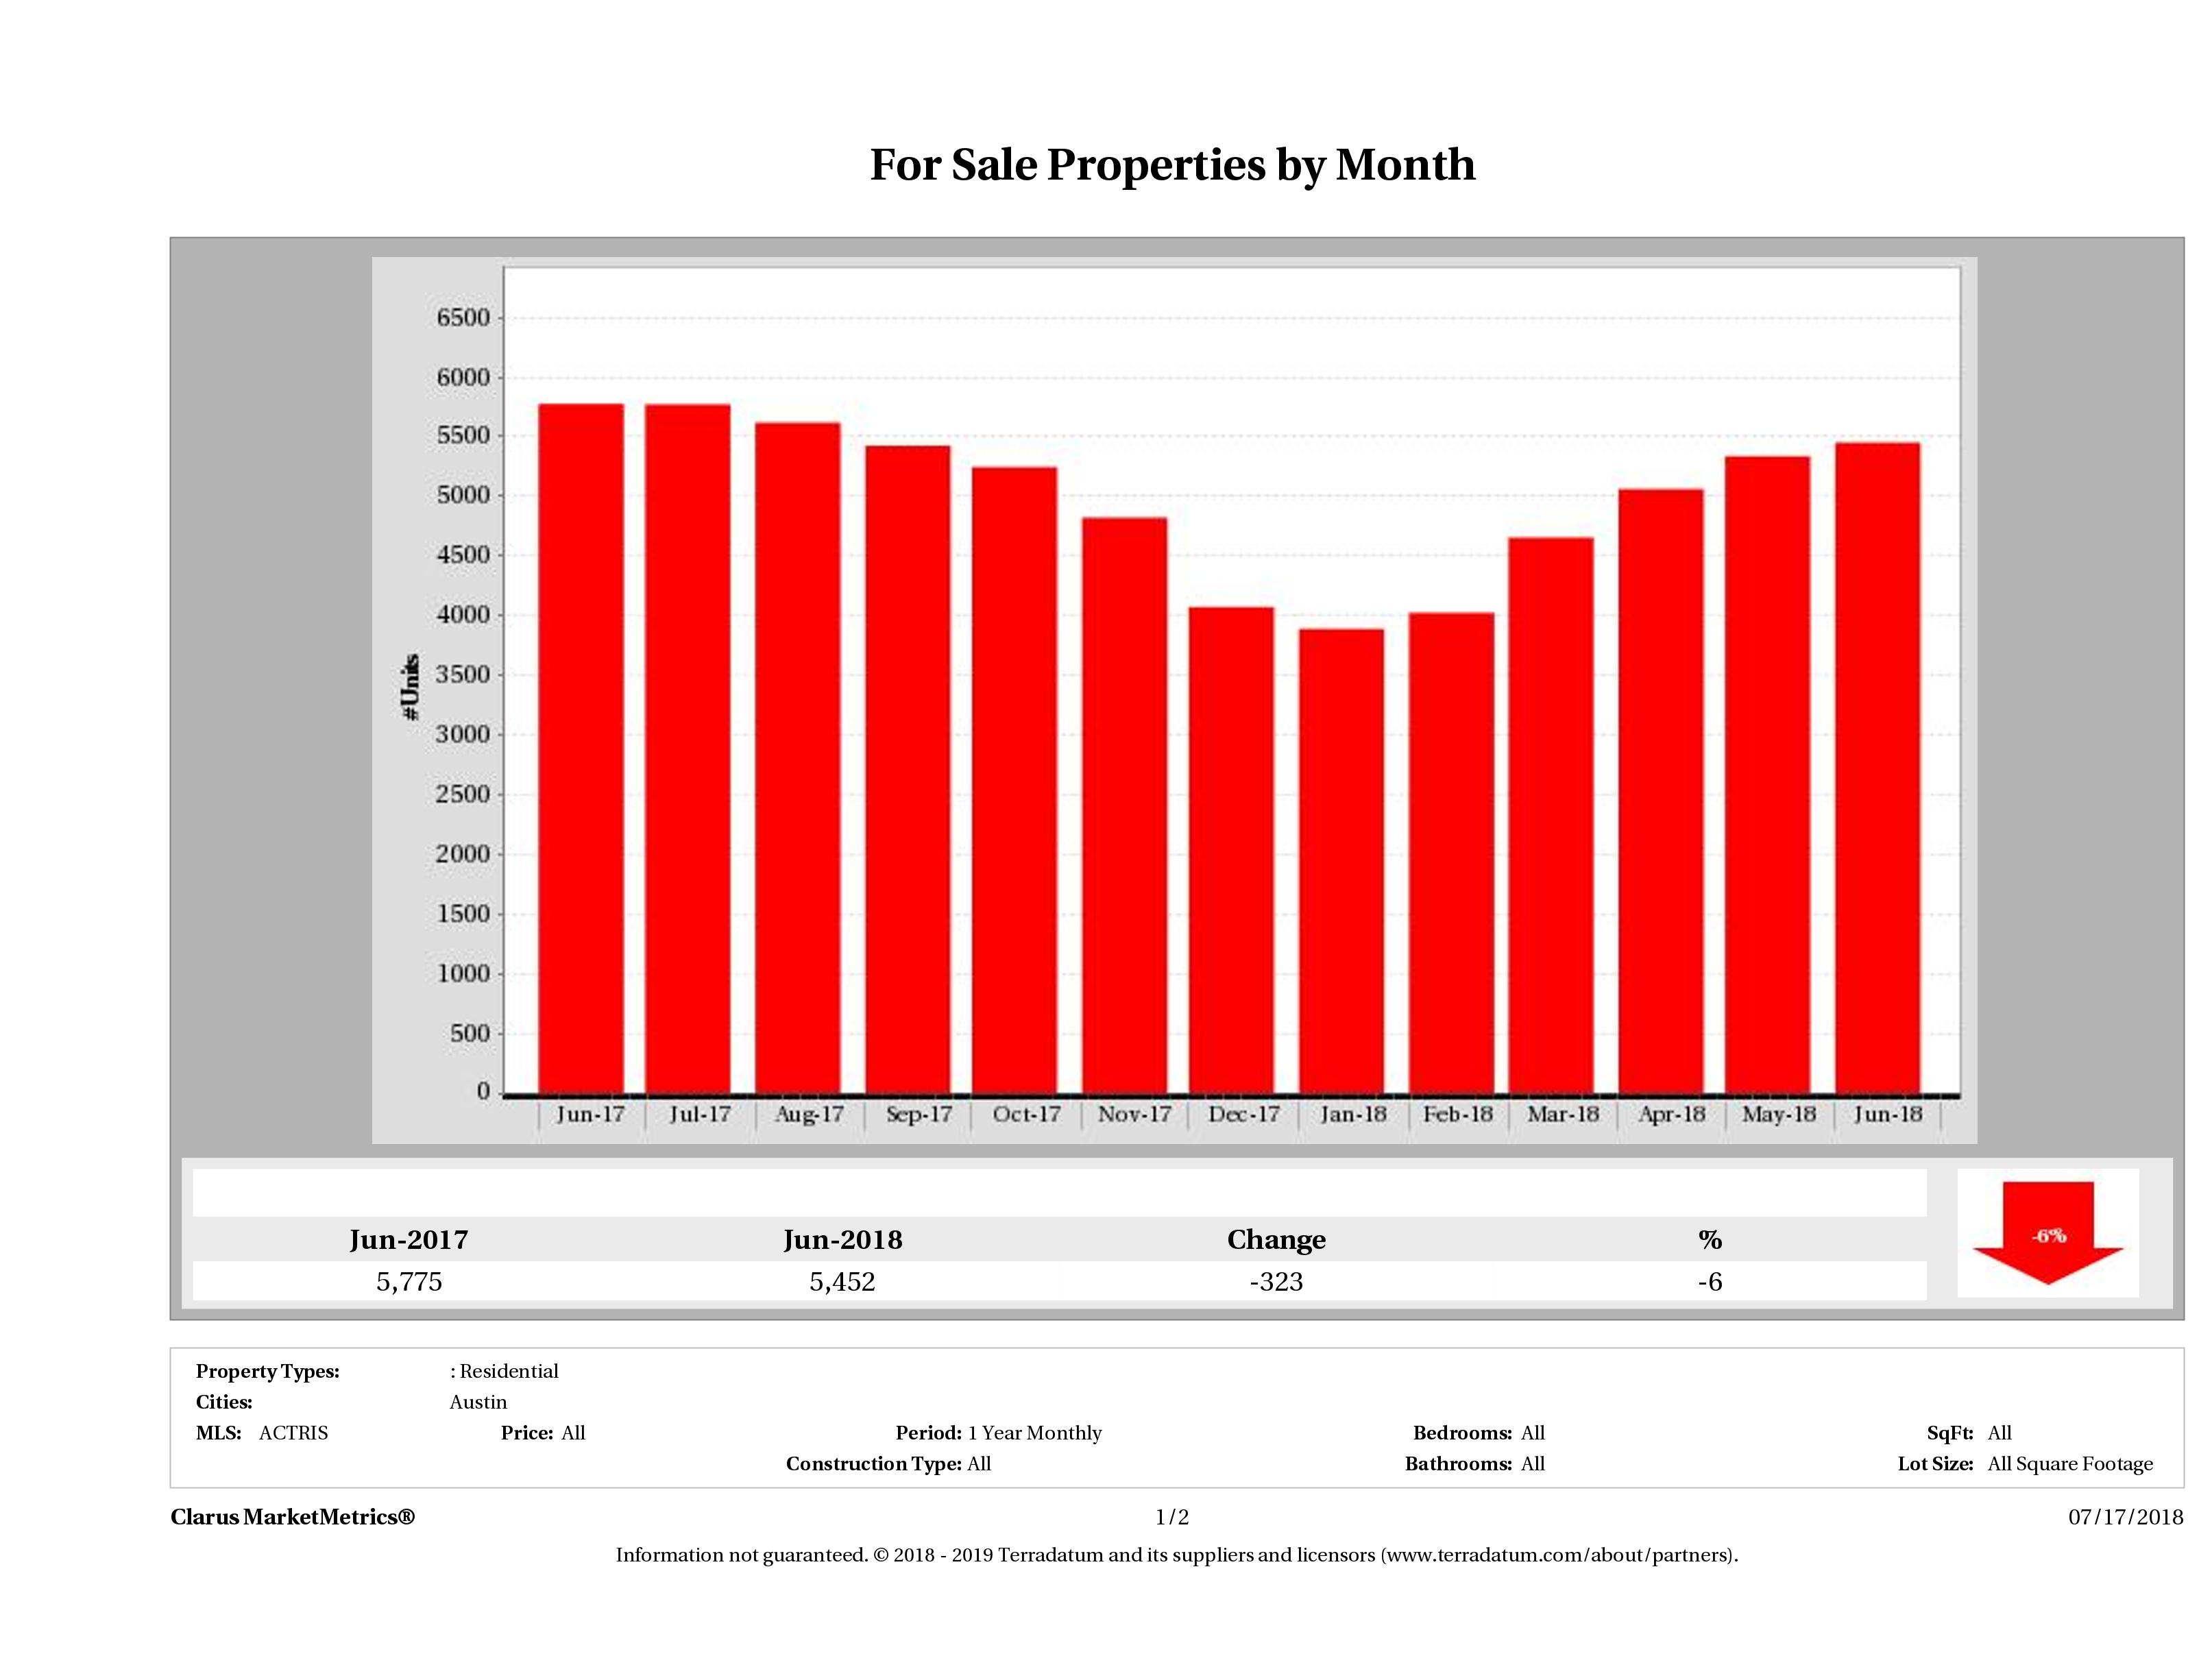
6% Decrease in Number of Homes on the Market
In June 2018, we had 5,452 homes for sale in Austin, compared to 5,775 in June 2017, showing a 5% (323 home) decrease in year over year numbers. With inventory numbers already low this year, even a small drop will be felt by buyers looking for more choices.
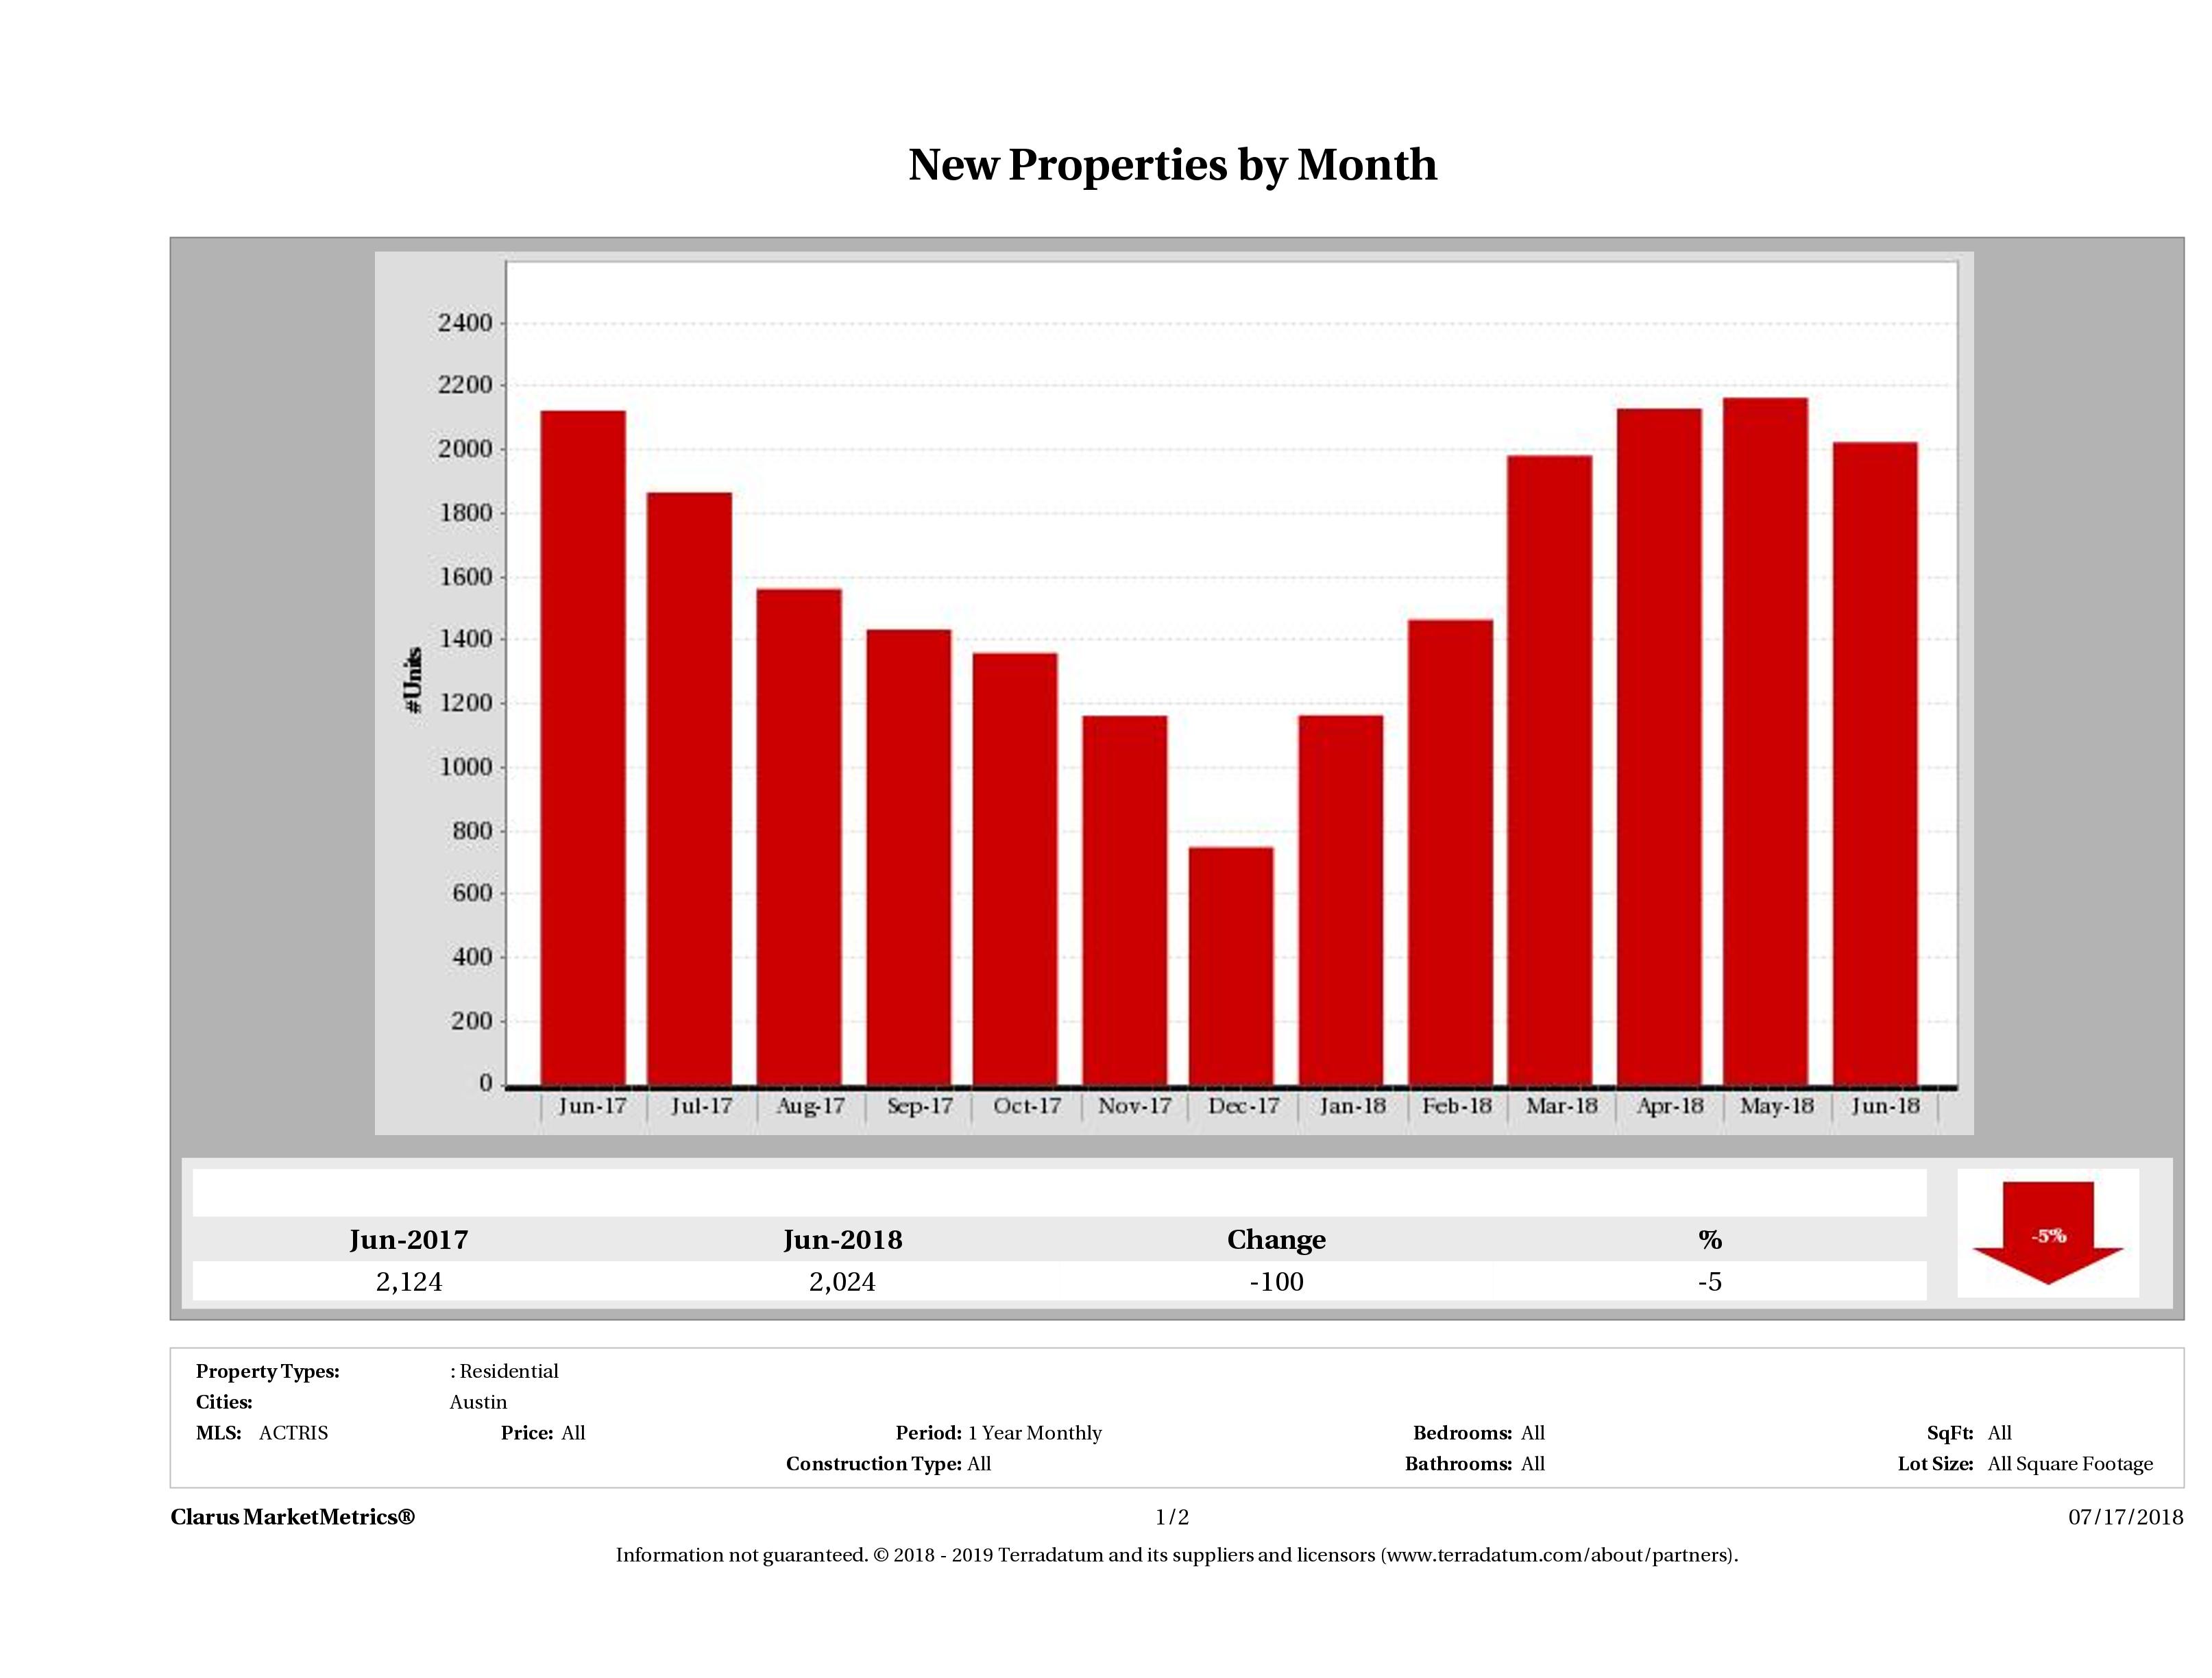
5% Decrease in Number of Homes Listed for Sale
In June 2018, we saw 2,024 homes introduced to the market compared to 2,124 in June 2017, a 5% (100 home) decrease in year over year numbers.
Supply Down 6% and Demand Down 5%
This month we saw a 6% decrease in supply (number of properties for sale) and a 5% increase in demand (number of sold properties). The market is definitely slower than we expected it to be this summer.
Median for Sale Flat vs Median Sold Price Down 1%
This chart compares the Median for Sale Price vs the Median Sold Price to show their relationship. In Austin, we saw virtually no change in the median for sale price and a 1% decrease in the median sold price of a single family home in year over year numbers.
Source: Clarus Market Metrics, ACTRIS Sold Data
June 2018 Austin Real Estate Price Report – Strictly Numbers
For those of you who prefer to see the actual numbers, we’ve included the figures for June 2018 Austin home sales below. The most expensive home that sold in June 2018 sold for $6,886,250 and the least expensive home sold for $160,000. Homes ranged in size from 486 sqft – 13,731 sqft with an average size of 2,292 sqft. The average price per square foot for a home that sold in Austin in June 2018 was $229.90 with the lowest being $80.94/sqft and the highest being $1,998.87/sqft. It took, on average, 32 days to sell a home in Austin and sellers received, on average, 97.92% of their original list prices.
| Beds | Baths | SqFt | List Price | LP/SqFt | Sold Price | SP/SqFt | SP/LP | SP/OLP | ADOM | |
|---|---|---|---|---|---|---|---|---|---|---|
| Min | 1 | 1 | 486 | $159,000 | $82.73 | $160,000 | $80.94 | 71.43% | 66.98% | 0 |
| Max | 7 | 10 | 13,731 | $7,500,000 | $2,421.17 | $6,886,250 | $1,998.87 | 121.67% | 128.00% | 594 |
| Avg | 4 | 3 | 2,292 | $521,031 | $233.10 | $512,023 | $229.90 | 99.01% | 97.92% | 32 |
| Median | 3 | 3 | 2,068 | $400,000 | $195.64 | $402,000 | $194.15 | 99.39% | 98.82% | 10 |
| Search Criteria | |||
|---|---|---|---|
| Status | Sold | Sold Date | Jun-18 |
| Property Type | Single Family Homes | Number Sold | 1272 |
| Source: | ABoR Sales Data | Area | Austin |
Time to Buy? Sell?
As we always say, the best time to buy or sell a home is when you need to buy or sell. If you have a house to buy, buying when its a sellers market may hurt you on the buying end, but you’ll make it up on the selling end. If you’re trying to get into the market for the first time, the only way you’ll know that we’ve “hit bottom” is when its in the rear view mirror. Work with professionals who can help you analyze your financial and lifestyle to determine if now is the right time to buy or sell.
Looking strictly at the numbers, it appears the recommendation for this month is – it’s time to buy. The market has not picked up as much this year so ready-buyers should be positioned well to take advantage. If you’re looking to buy, get started now. The earlier you can start your home search, the more likely you are to be able to negotiate a better deal. As demand increases, sellers will start to see more showings and they will be less motivated to negotiate. Get your search set up and start looking at new listings now. If you’re looking to buy, we can help you be successful. We know the market and know how to get the best deal for a buyer. For more info about buying a home, visit Buy a Home in Austin.
If you’re a seller who needs to sell now, work with a professional Realtor who can help you position your home as the best value on the market. Though we aren’t seeing as much activity, median price is still healthy, showing there are still highly motivated buyers in the market. Check out our 88 Ways to Sell Your Home Faster and For More Money for some tips on how you can prepare your home to meet the market. For more info about our Home Selling Program and why it is the best in Austin, check out Sell My Austin Home.
Curious How Much You Could Sell Your Austin Home For?
Our Market Snapshot Tool is for you. With just your zip code, we’ll email you a detailed report showing what homes in your neighborhood sold for, how long it took to sell and how the market is trending. Though our Austin Real Estate Price Report is helpful in gauging the overall trend of the market, it doesn’t address neighborhoods specifically. If you’re looking for that type of report, put in your name and zip code below and our system will email you a Neighborhood Market Report.
Questions About the Austin Real Estate Price Report?
Do you have questions about this Austin Real Estate Price Report? Call us at (512) 827-8323 or email us at info@11OaksRealty.com and we’ll help you in any way we can. If you’re looking to buy or sell Austin real estate, don’t forget to check out our Buyer Resources and our Seller Resources for more tips.


Leave a Reply