The Dream Home Realty Group at Sky Realty is proud to present their July 2011 Austin Real Estate Price Report measuring activity in the Austin single family home market.
Looking for another area of town? Contact Us at (512) 827-8323 and we’ll get it over to you.
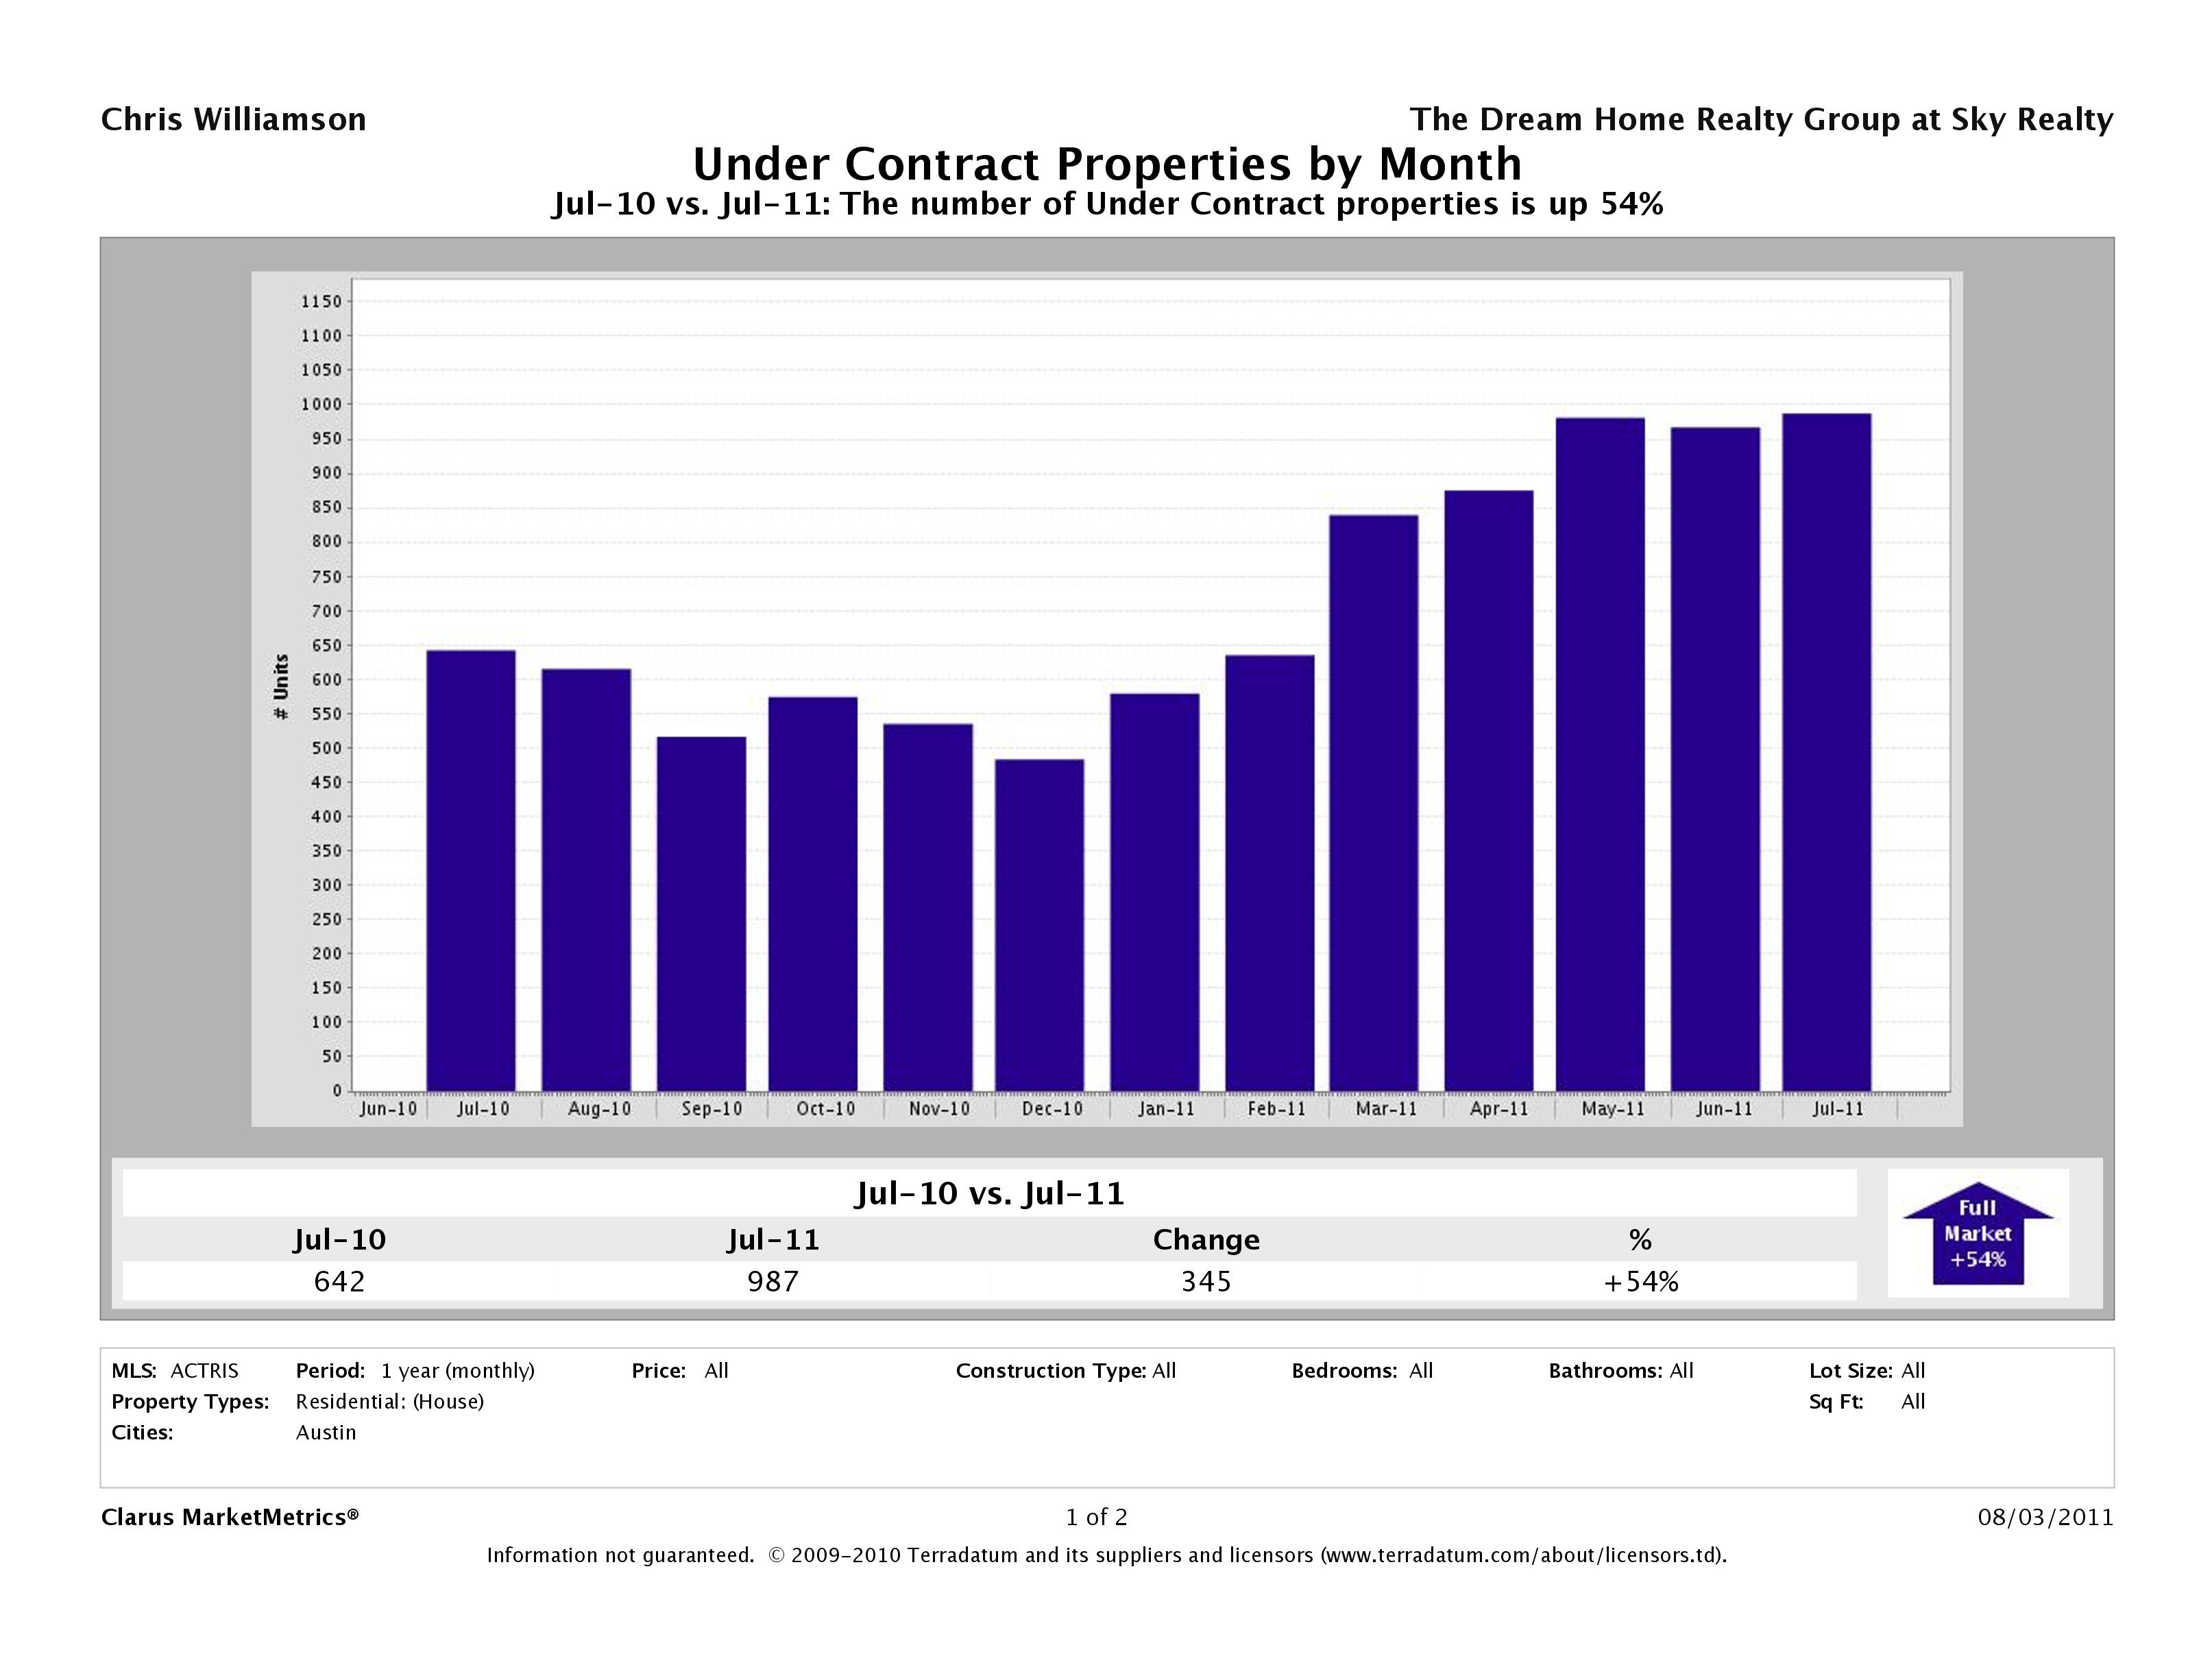
54% More Homes Under Contract than July 2010
For a third month in a row, the biggest story came by way of number of homes that accepted a contract. In July 2011, we saw a 54% increase in the number of homes that accepted a contract (aka pending or under contract) with 987 homes accepting a contract in July 2011 vs only 642 in July 2010. Though it still seems sellers are still sitting on the fence, buyers are seizing the opportunity with historically low interest rates and making a move to purchase homes with low monthly payments.
What does this mean for sellers? If you need to sell, take advantage of the increased number of buyers and low inventory (as you’ll see in the following graphs) get your homes on the market now. Activity will start to slow down as kids go back to school and you don’t want to have missed the boat.
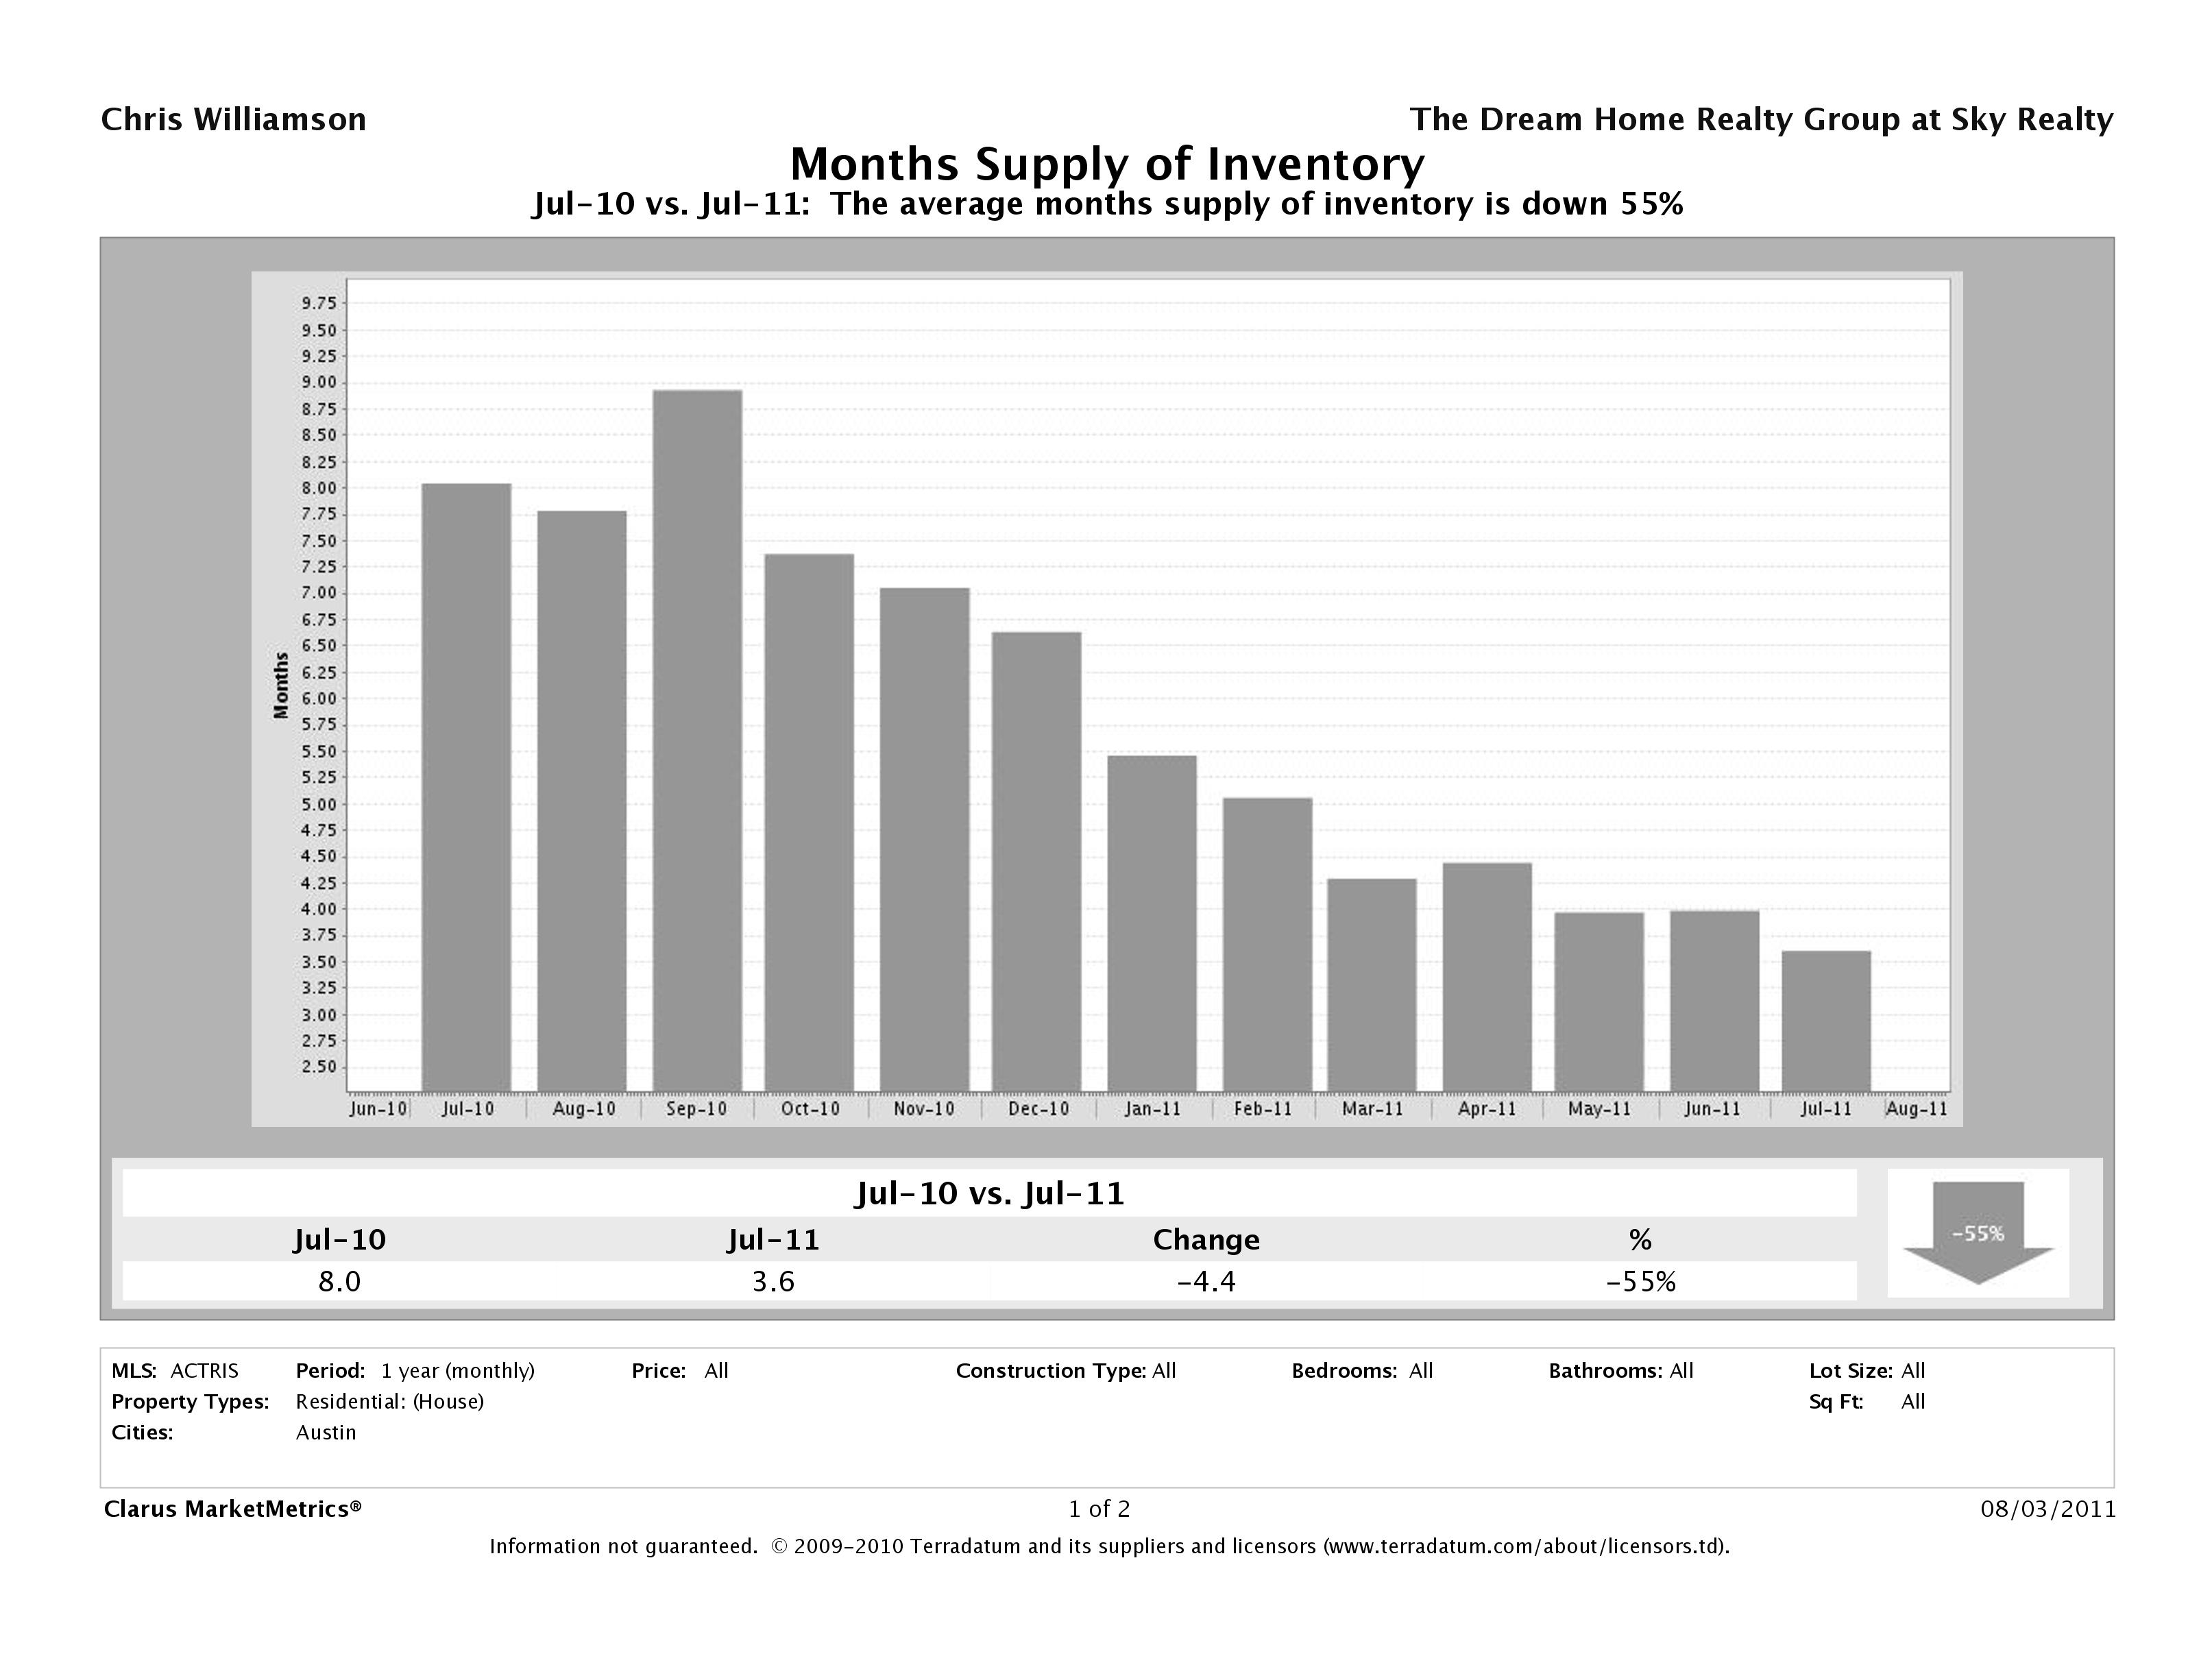
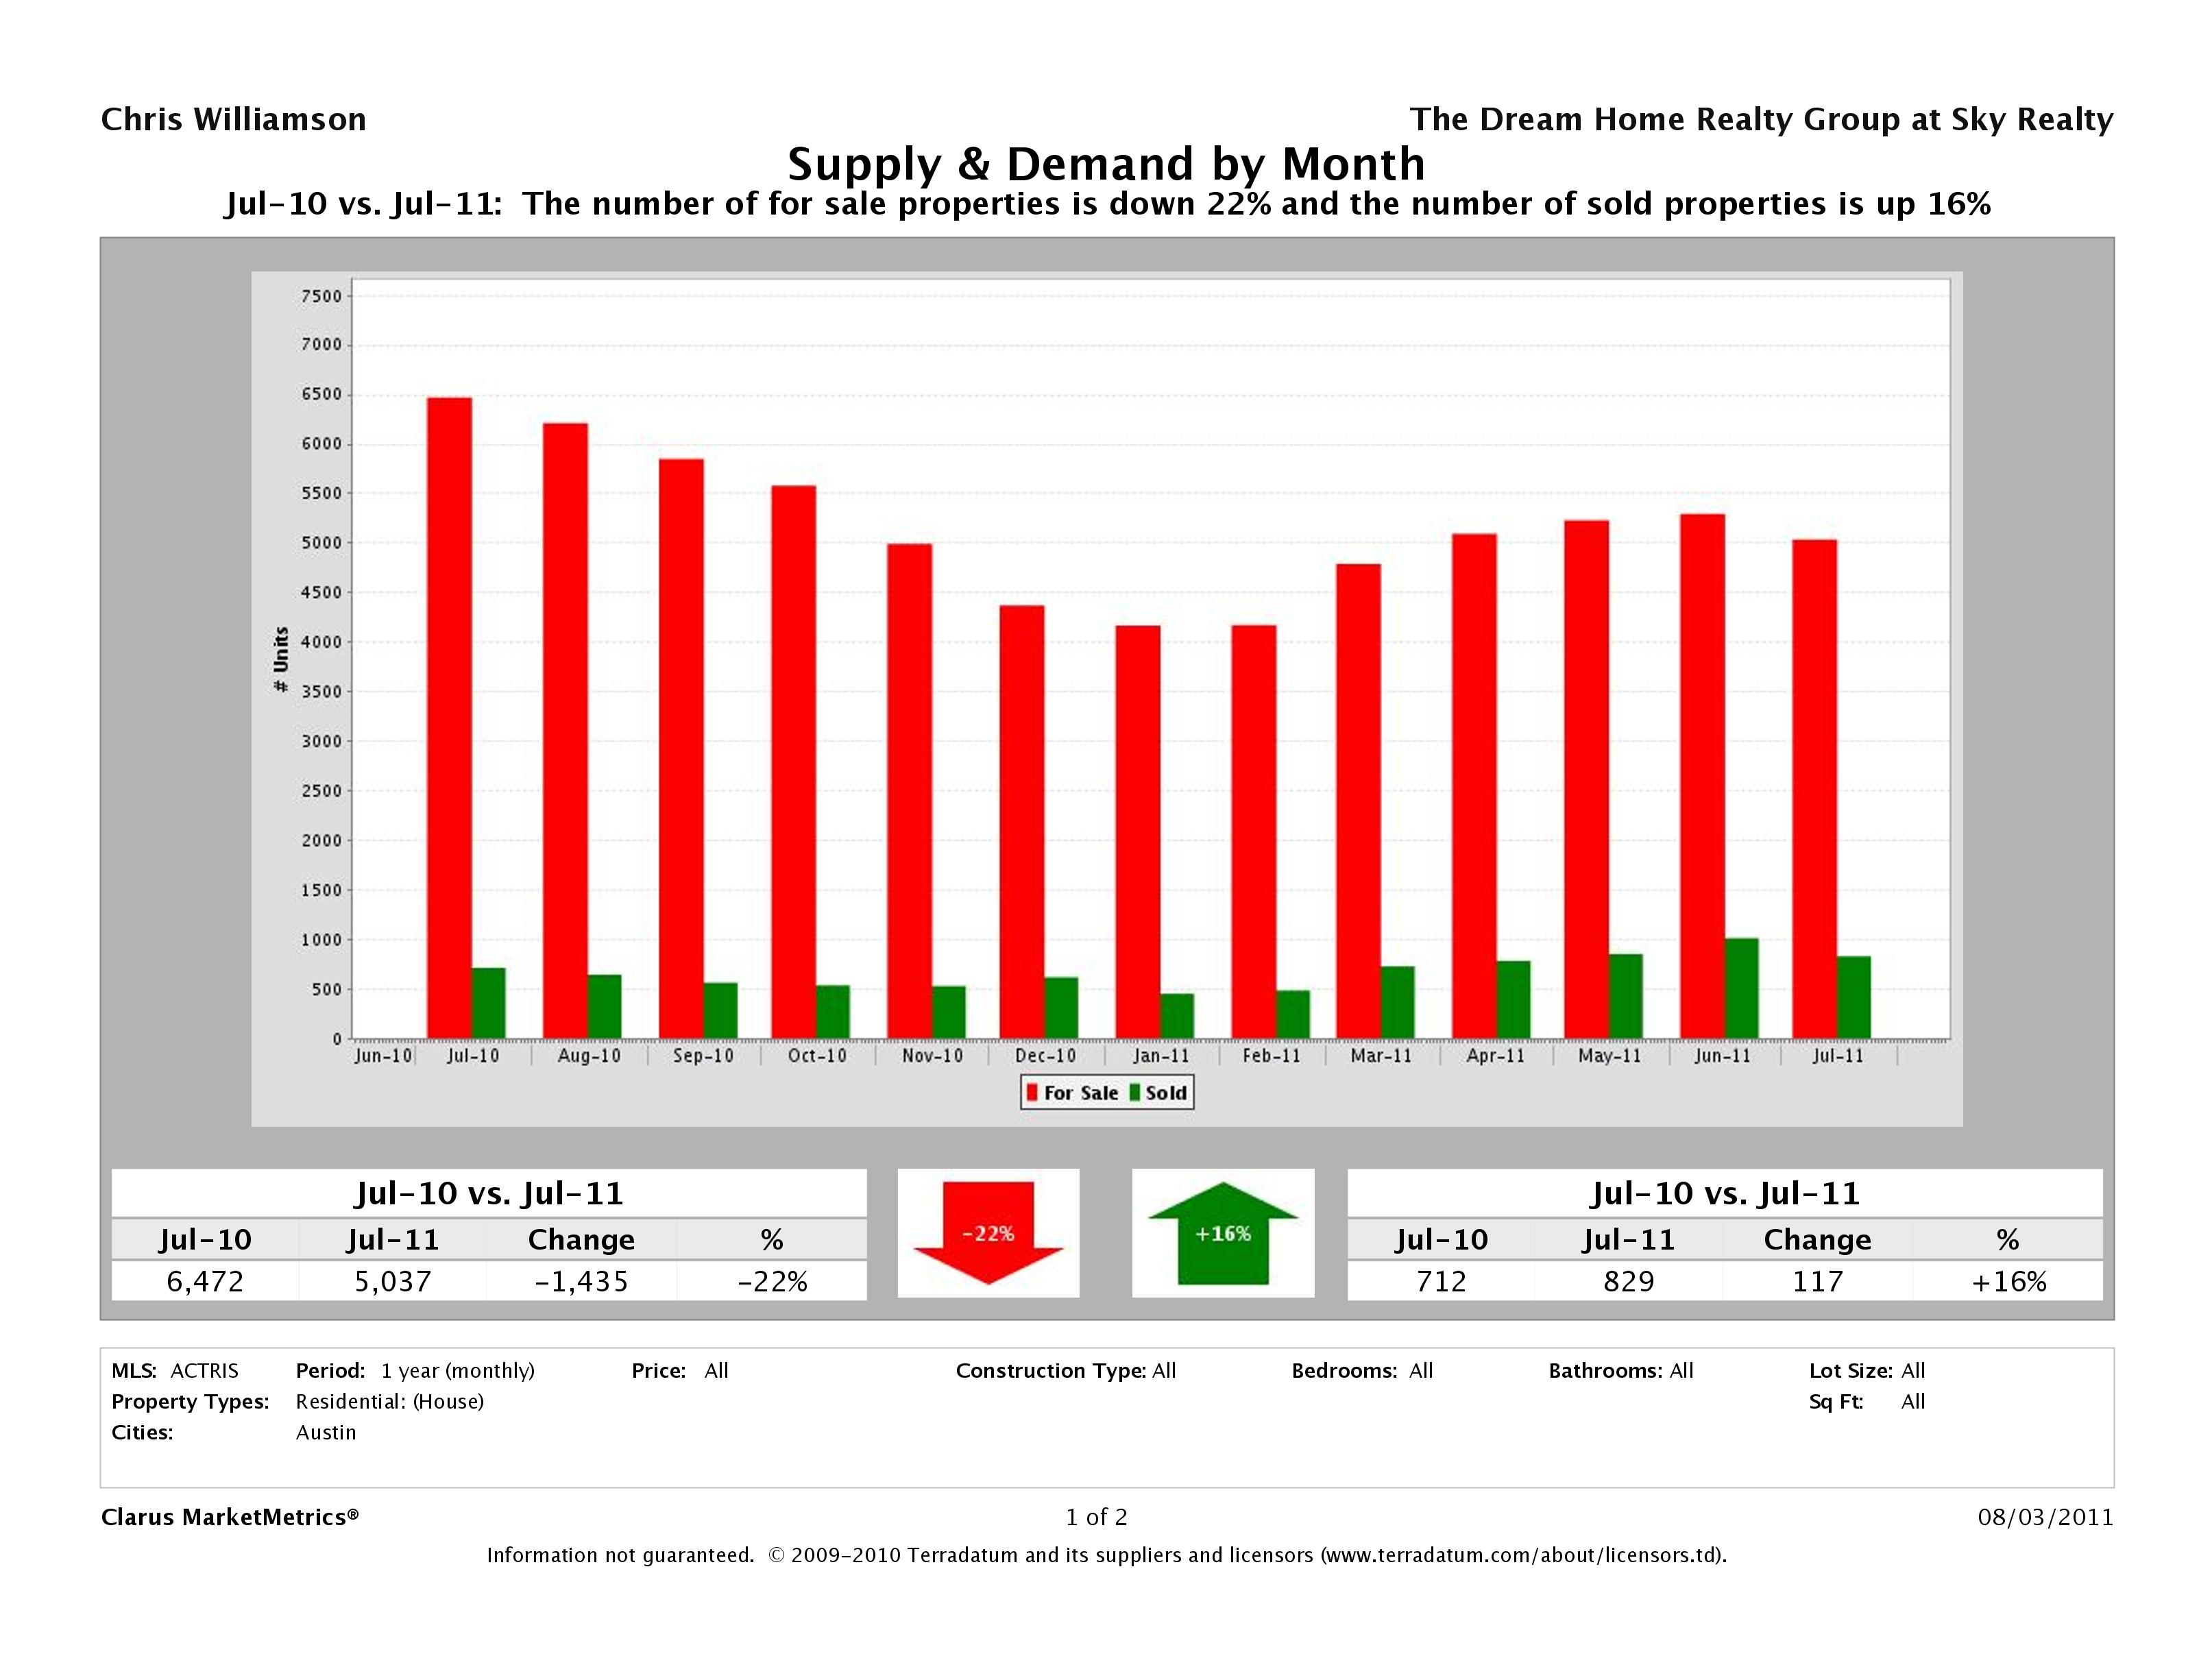
Austin Housing Inventory Continues to Decline to Historically Low Levels
For the last four months, the big story was the declining inventory. For the fourth month in a row, we’ve seen a decrease in the amount of housing inventory on the market in Austin. In July 2011, we saw a 55% decrease in months supply of inventory from July 2010 numbers to 3.6 months. July 2011 numbers mark the lowest inventory we’ve seen in Austin in over two and a half years. As we come to the end of the peak Summer buying season it will be interesting to see if these numbers increase or if they continue to dip.
What does this mean to sellers? If you are thinking of selling, do it now while buyers have fewer choices. Positioning your home as one of the best values on the market will help you sell your home quickly.
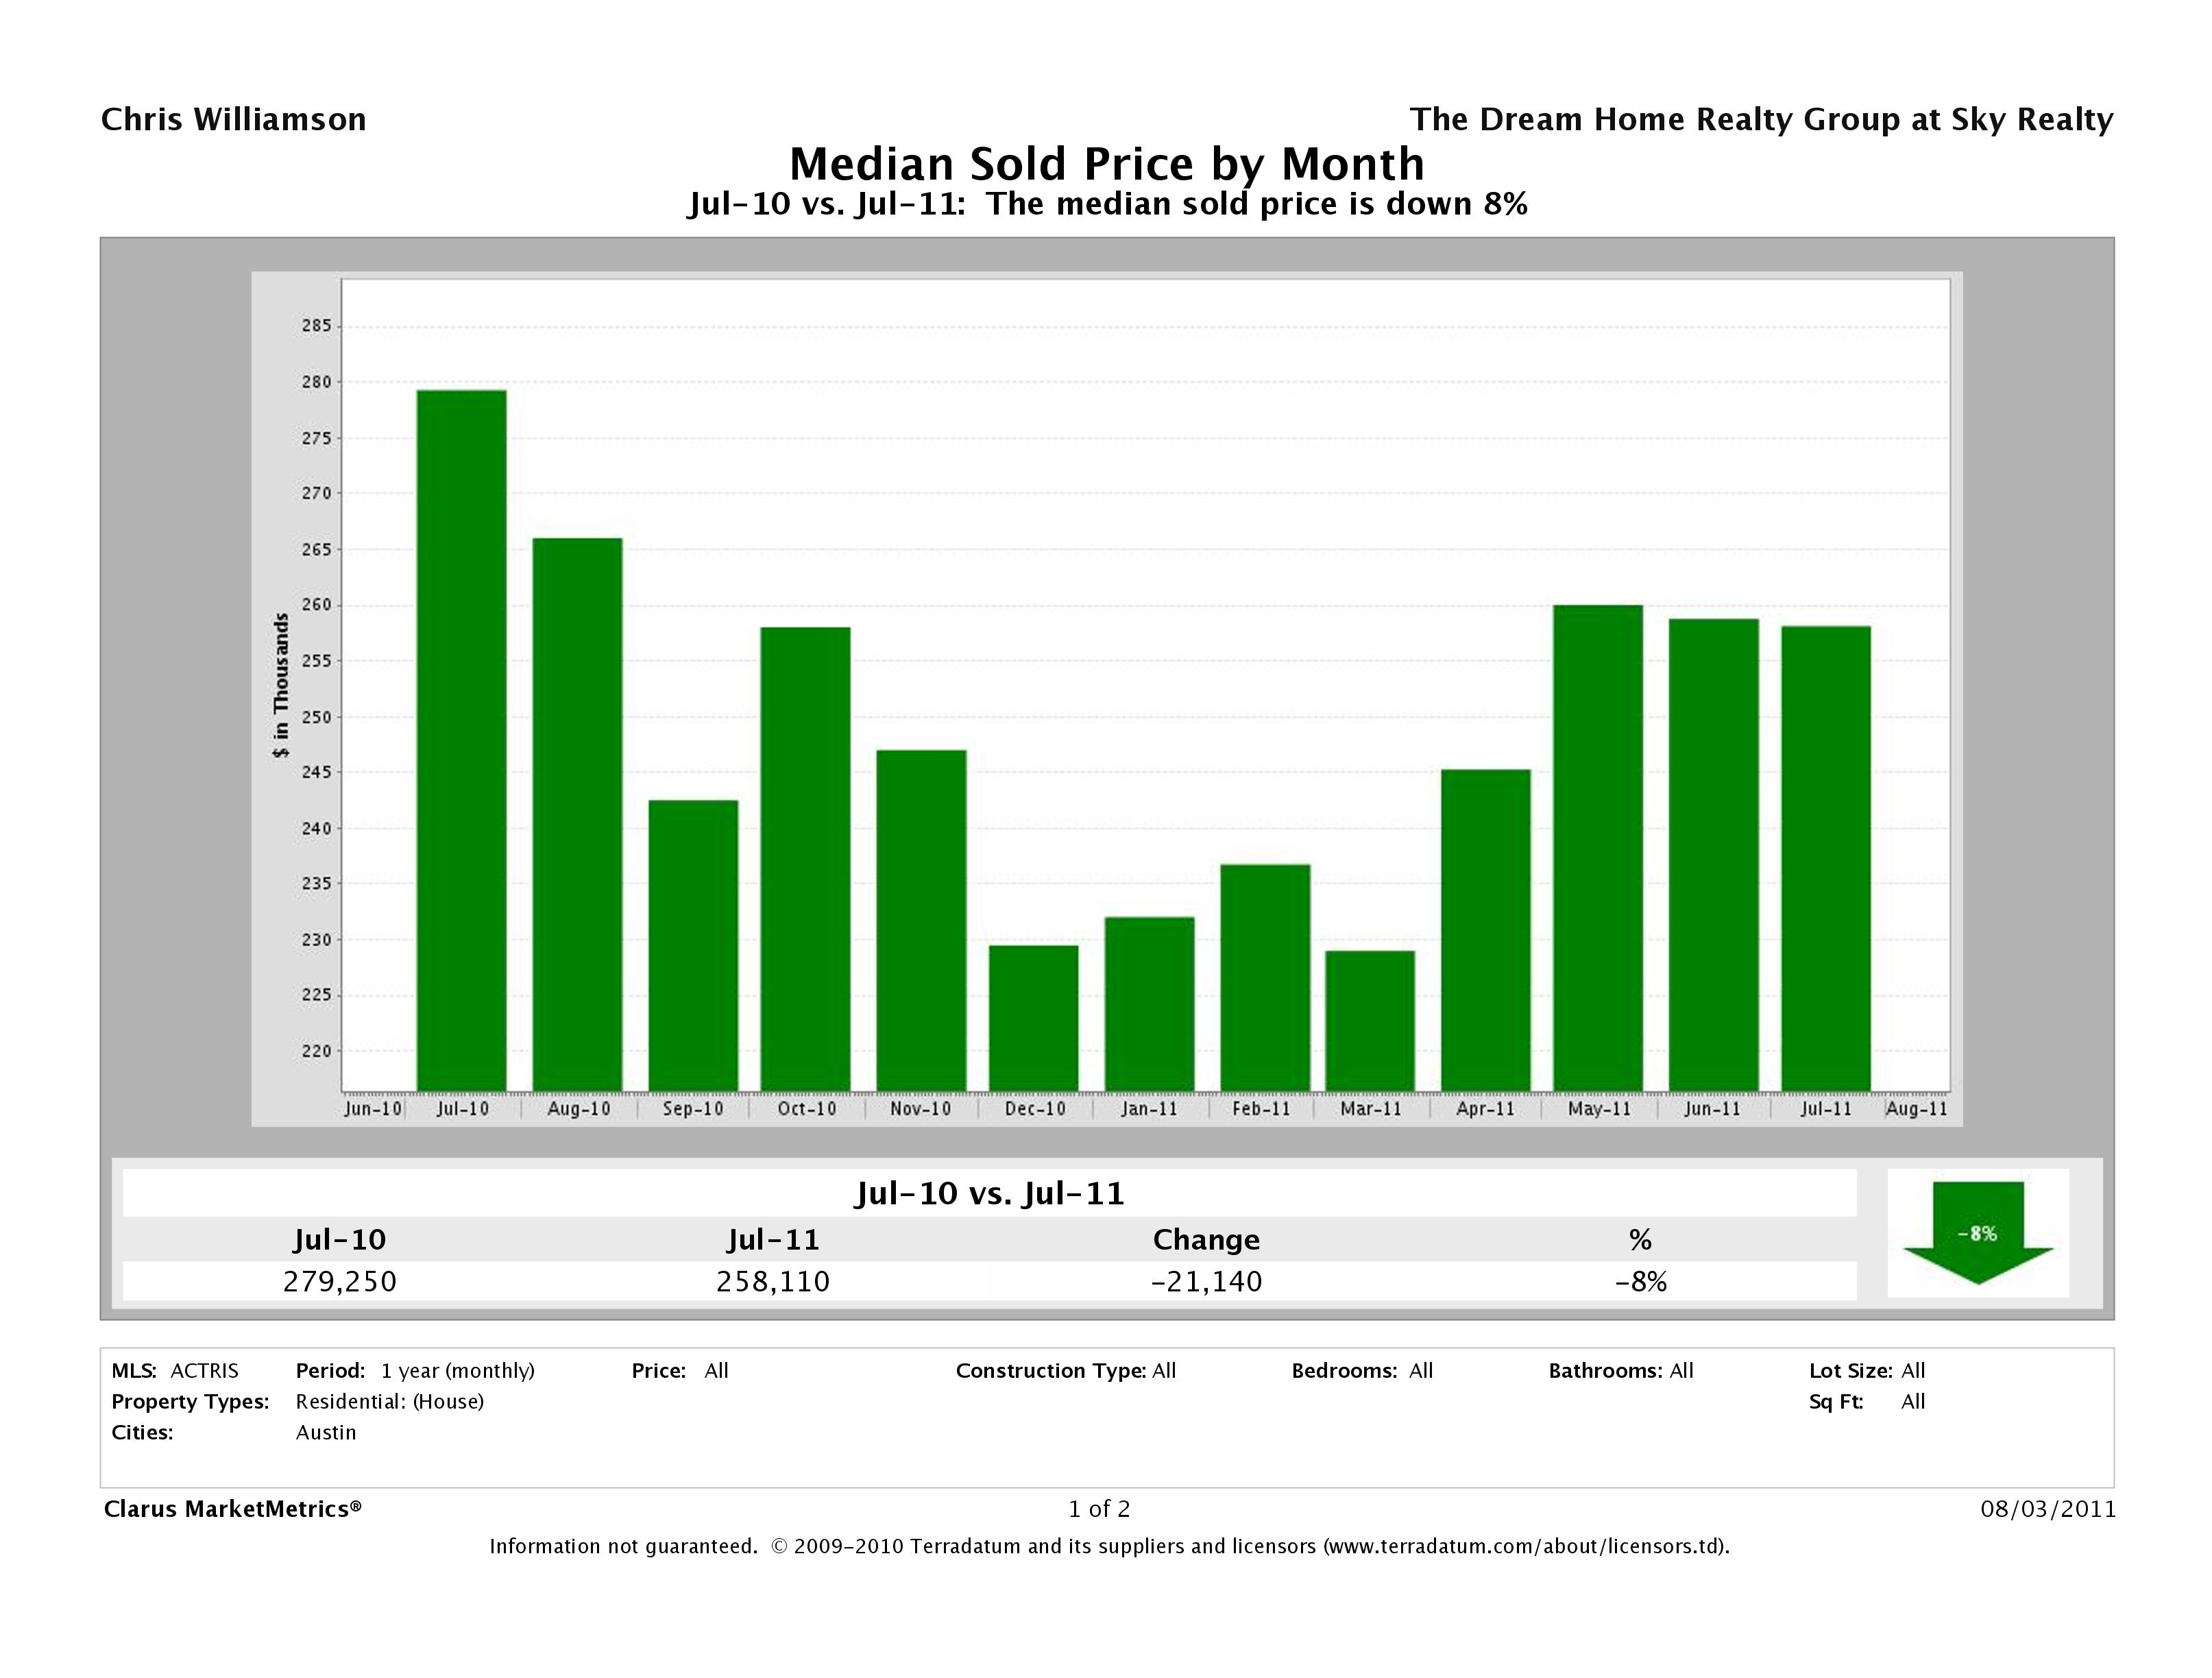
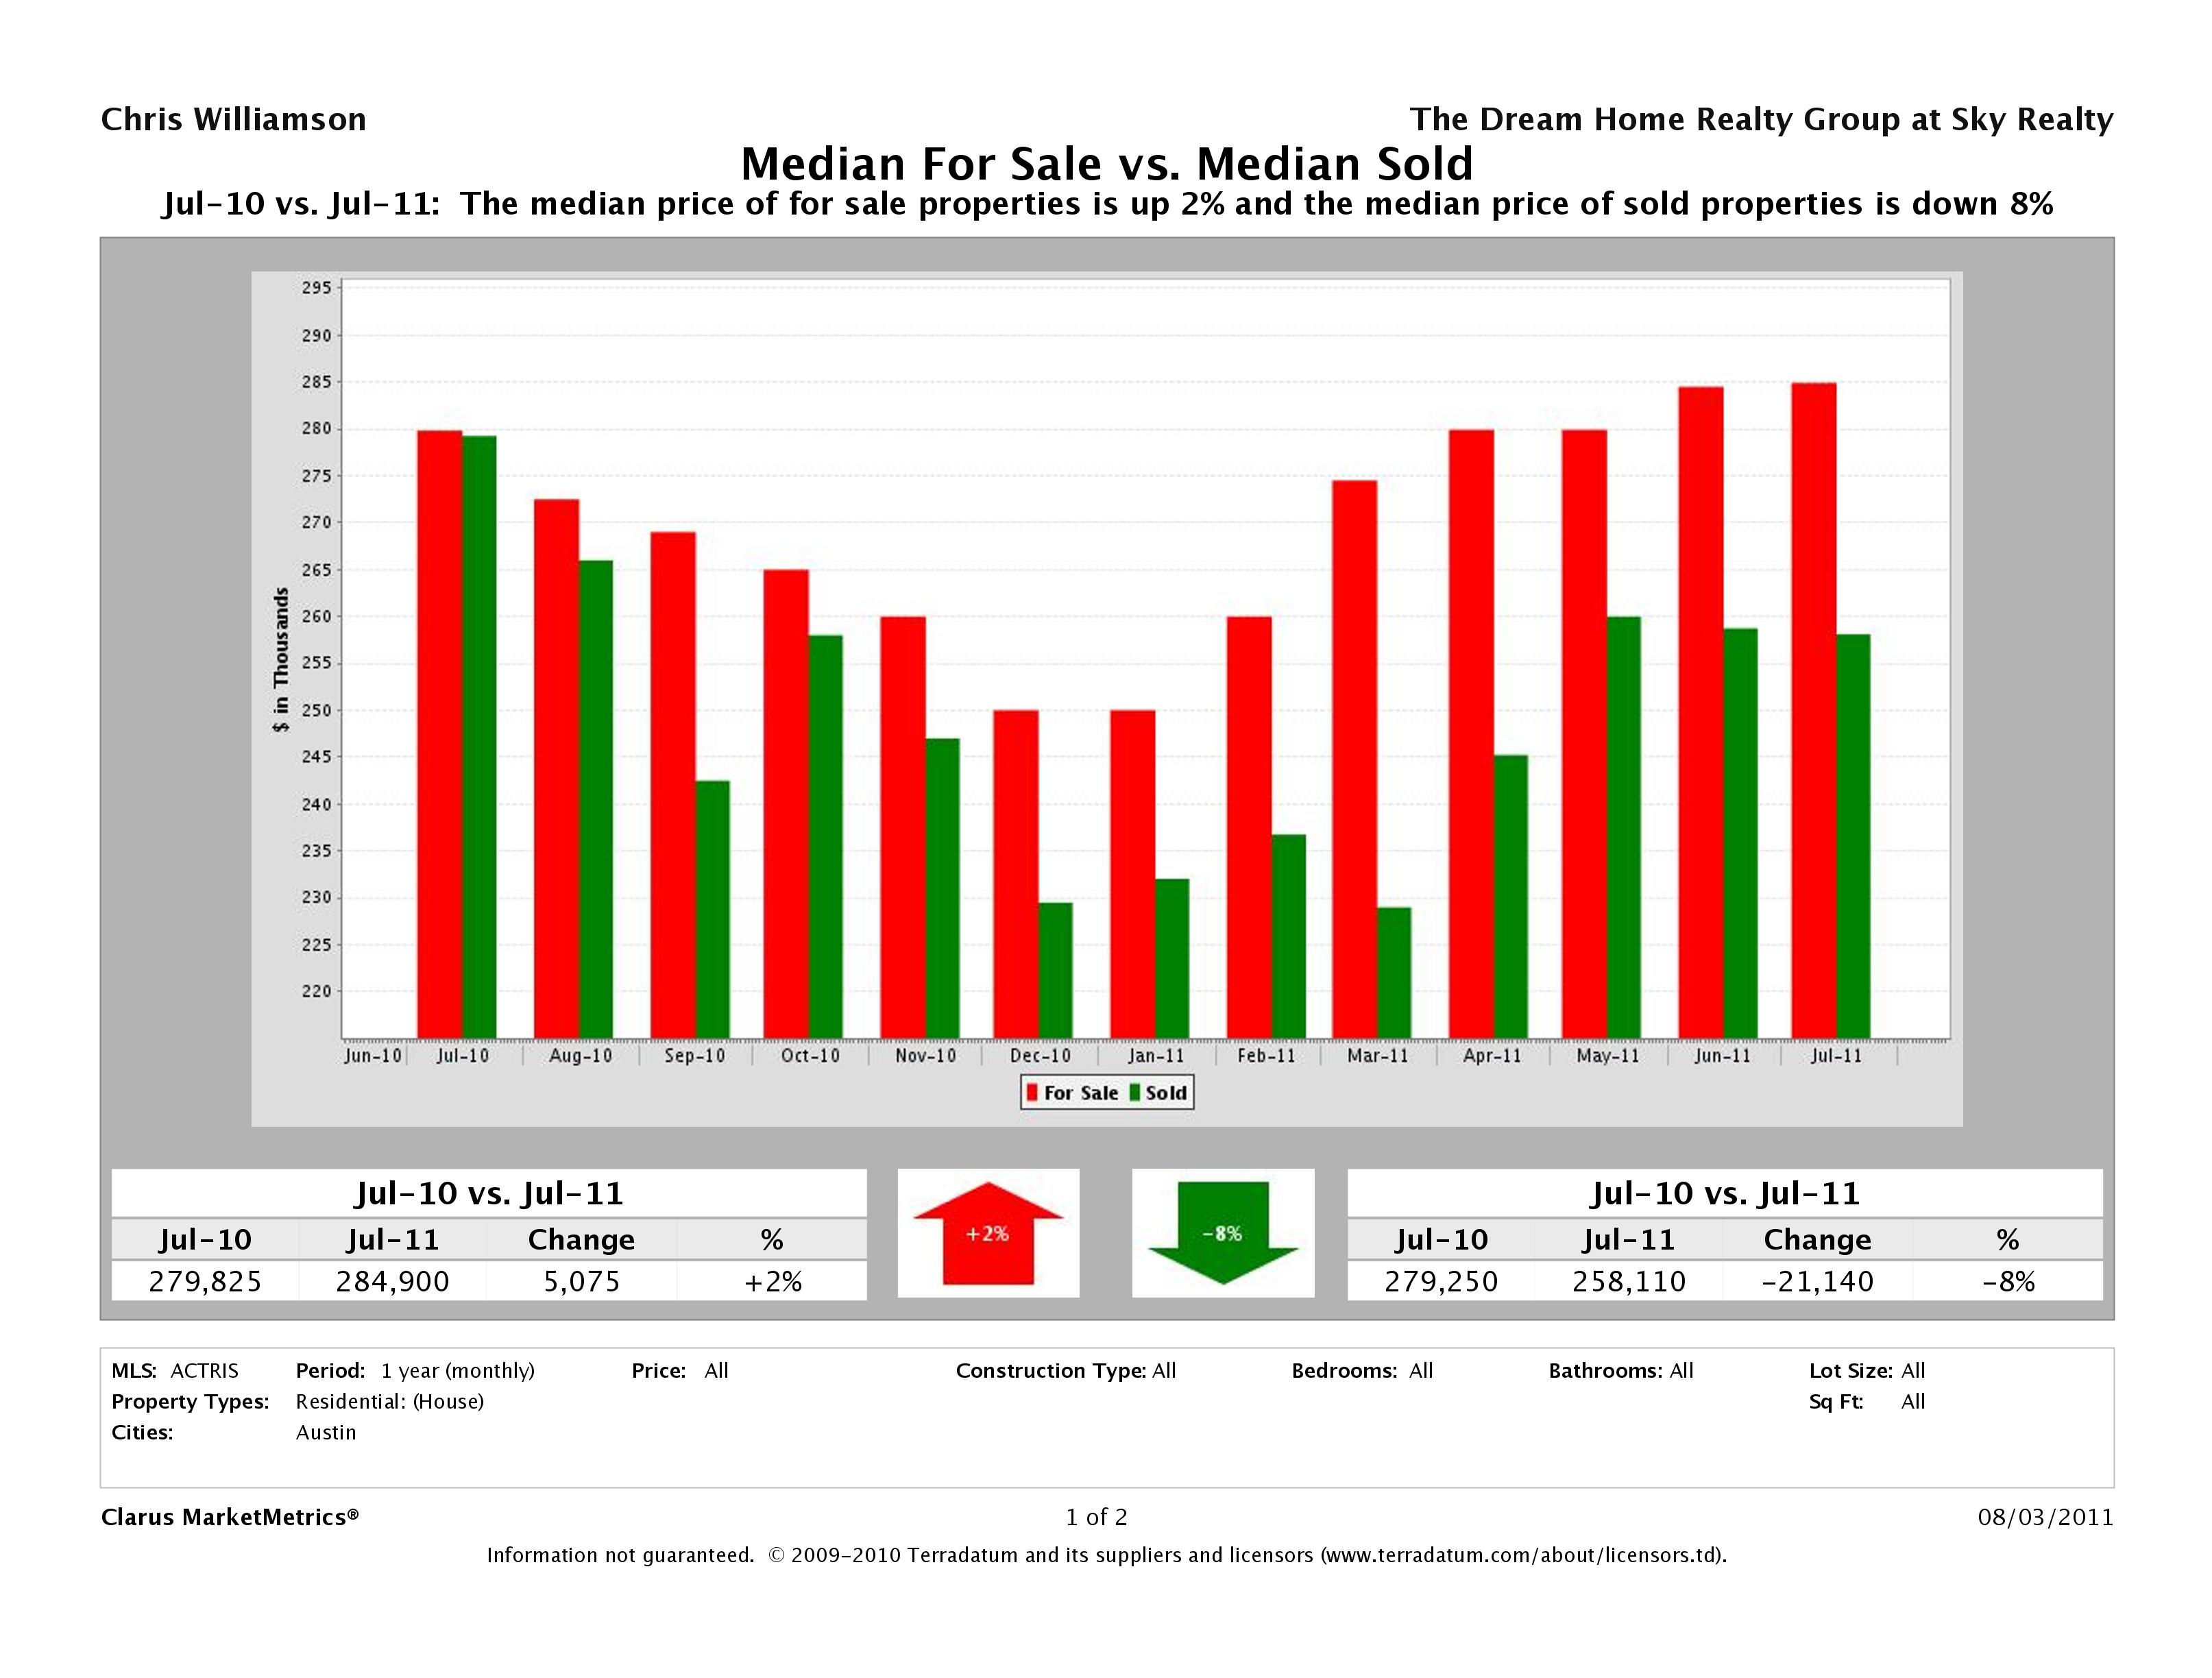
Austin Median Home Price Down 8%
This month, we saw an 8% decrease in the median home price in Austin with a $21,140 decrease in year over year numbers. The median home price in July 2010 was $279,250 vs $258,110 in July 2011. As we predicted last month, we saw a small decrease in the median home price in Austin for the month of July which is typical. It seems the best houses were purchased during the best buying months and buyers that are still in the market now are buying the less desirable homes at a discount.
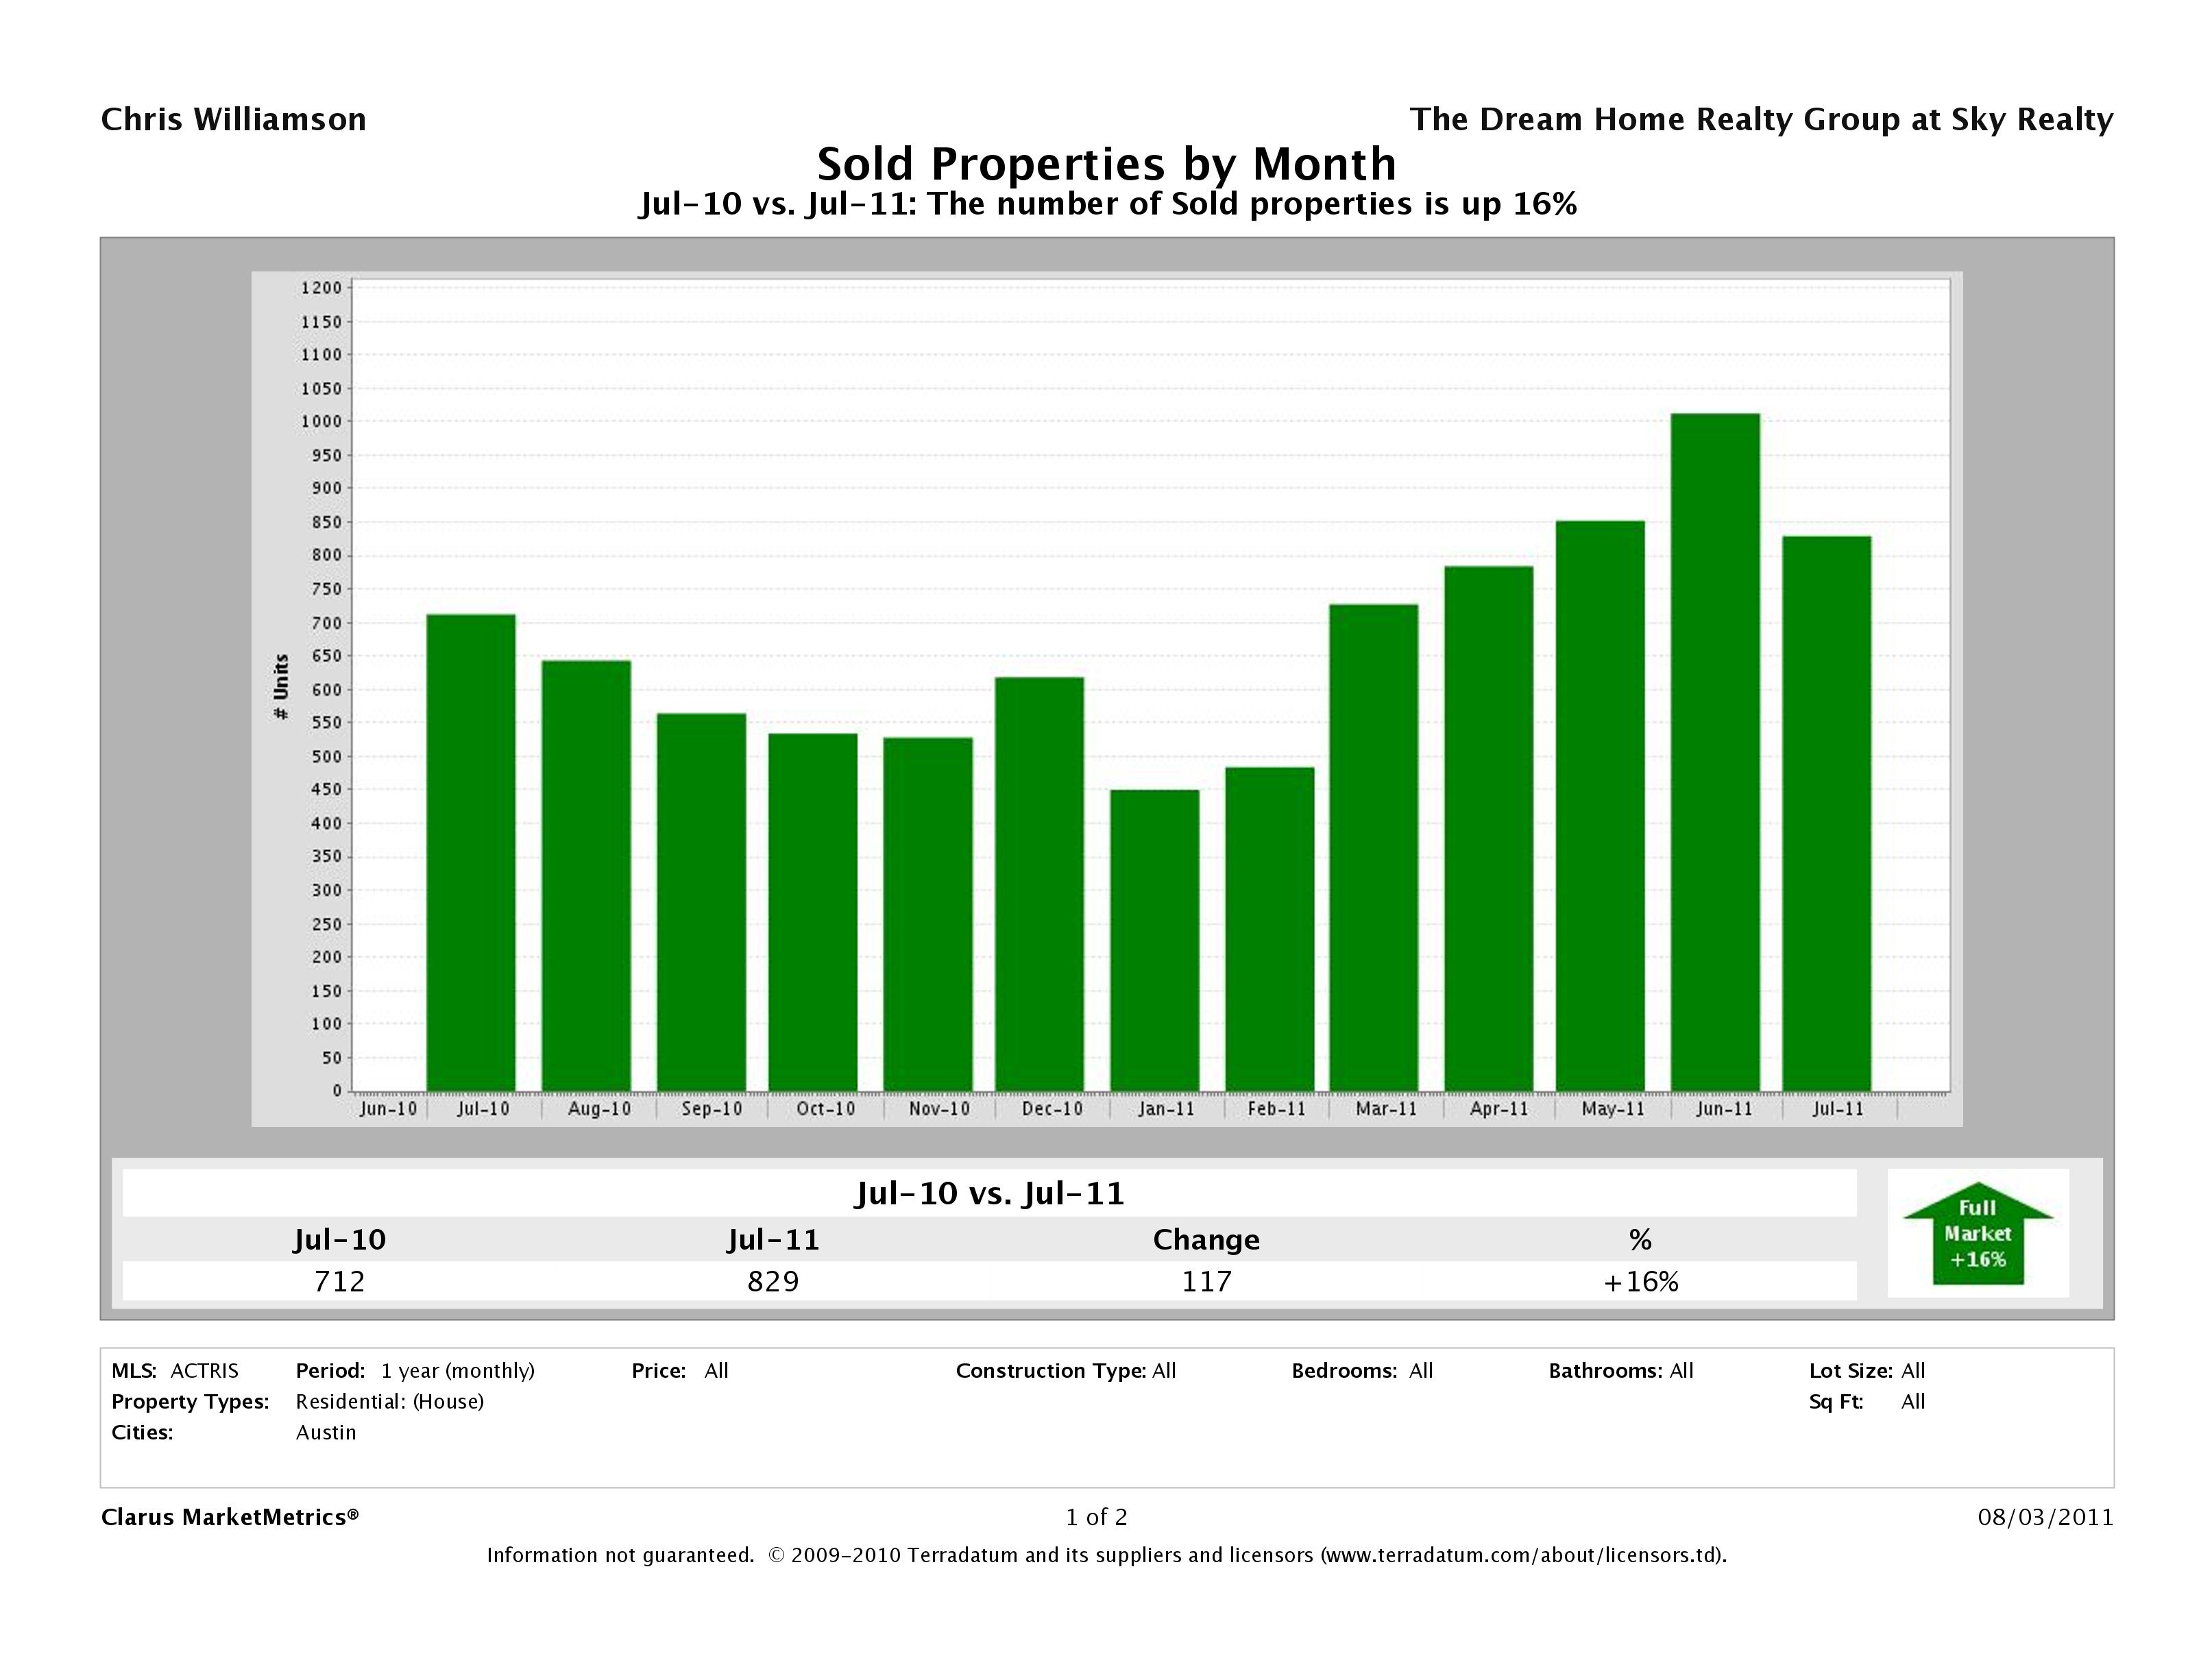
Number of Sold Homes in Austin Up 16%
We finally saw an increase in the number of closed sales this month to cath up with May and June increases in under contract (pending sales). As we expected, the numbers would be a bit higher in July as properties with long escrow periods began to close. In July 2011 we had 829 homes that sold vs 712 homes sold in June 2010, an increase of 16%.
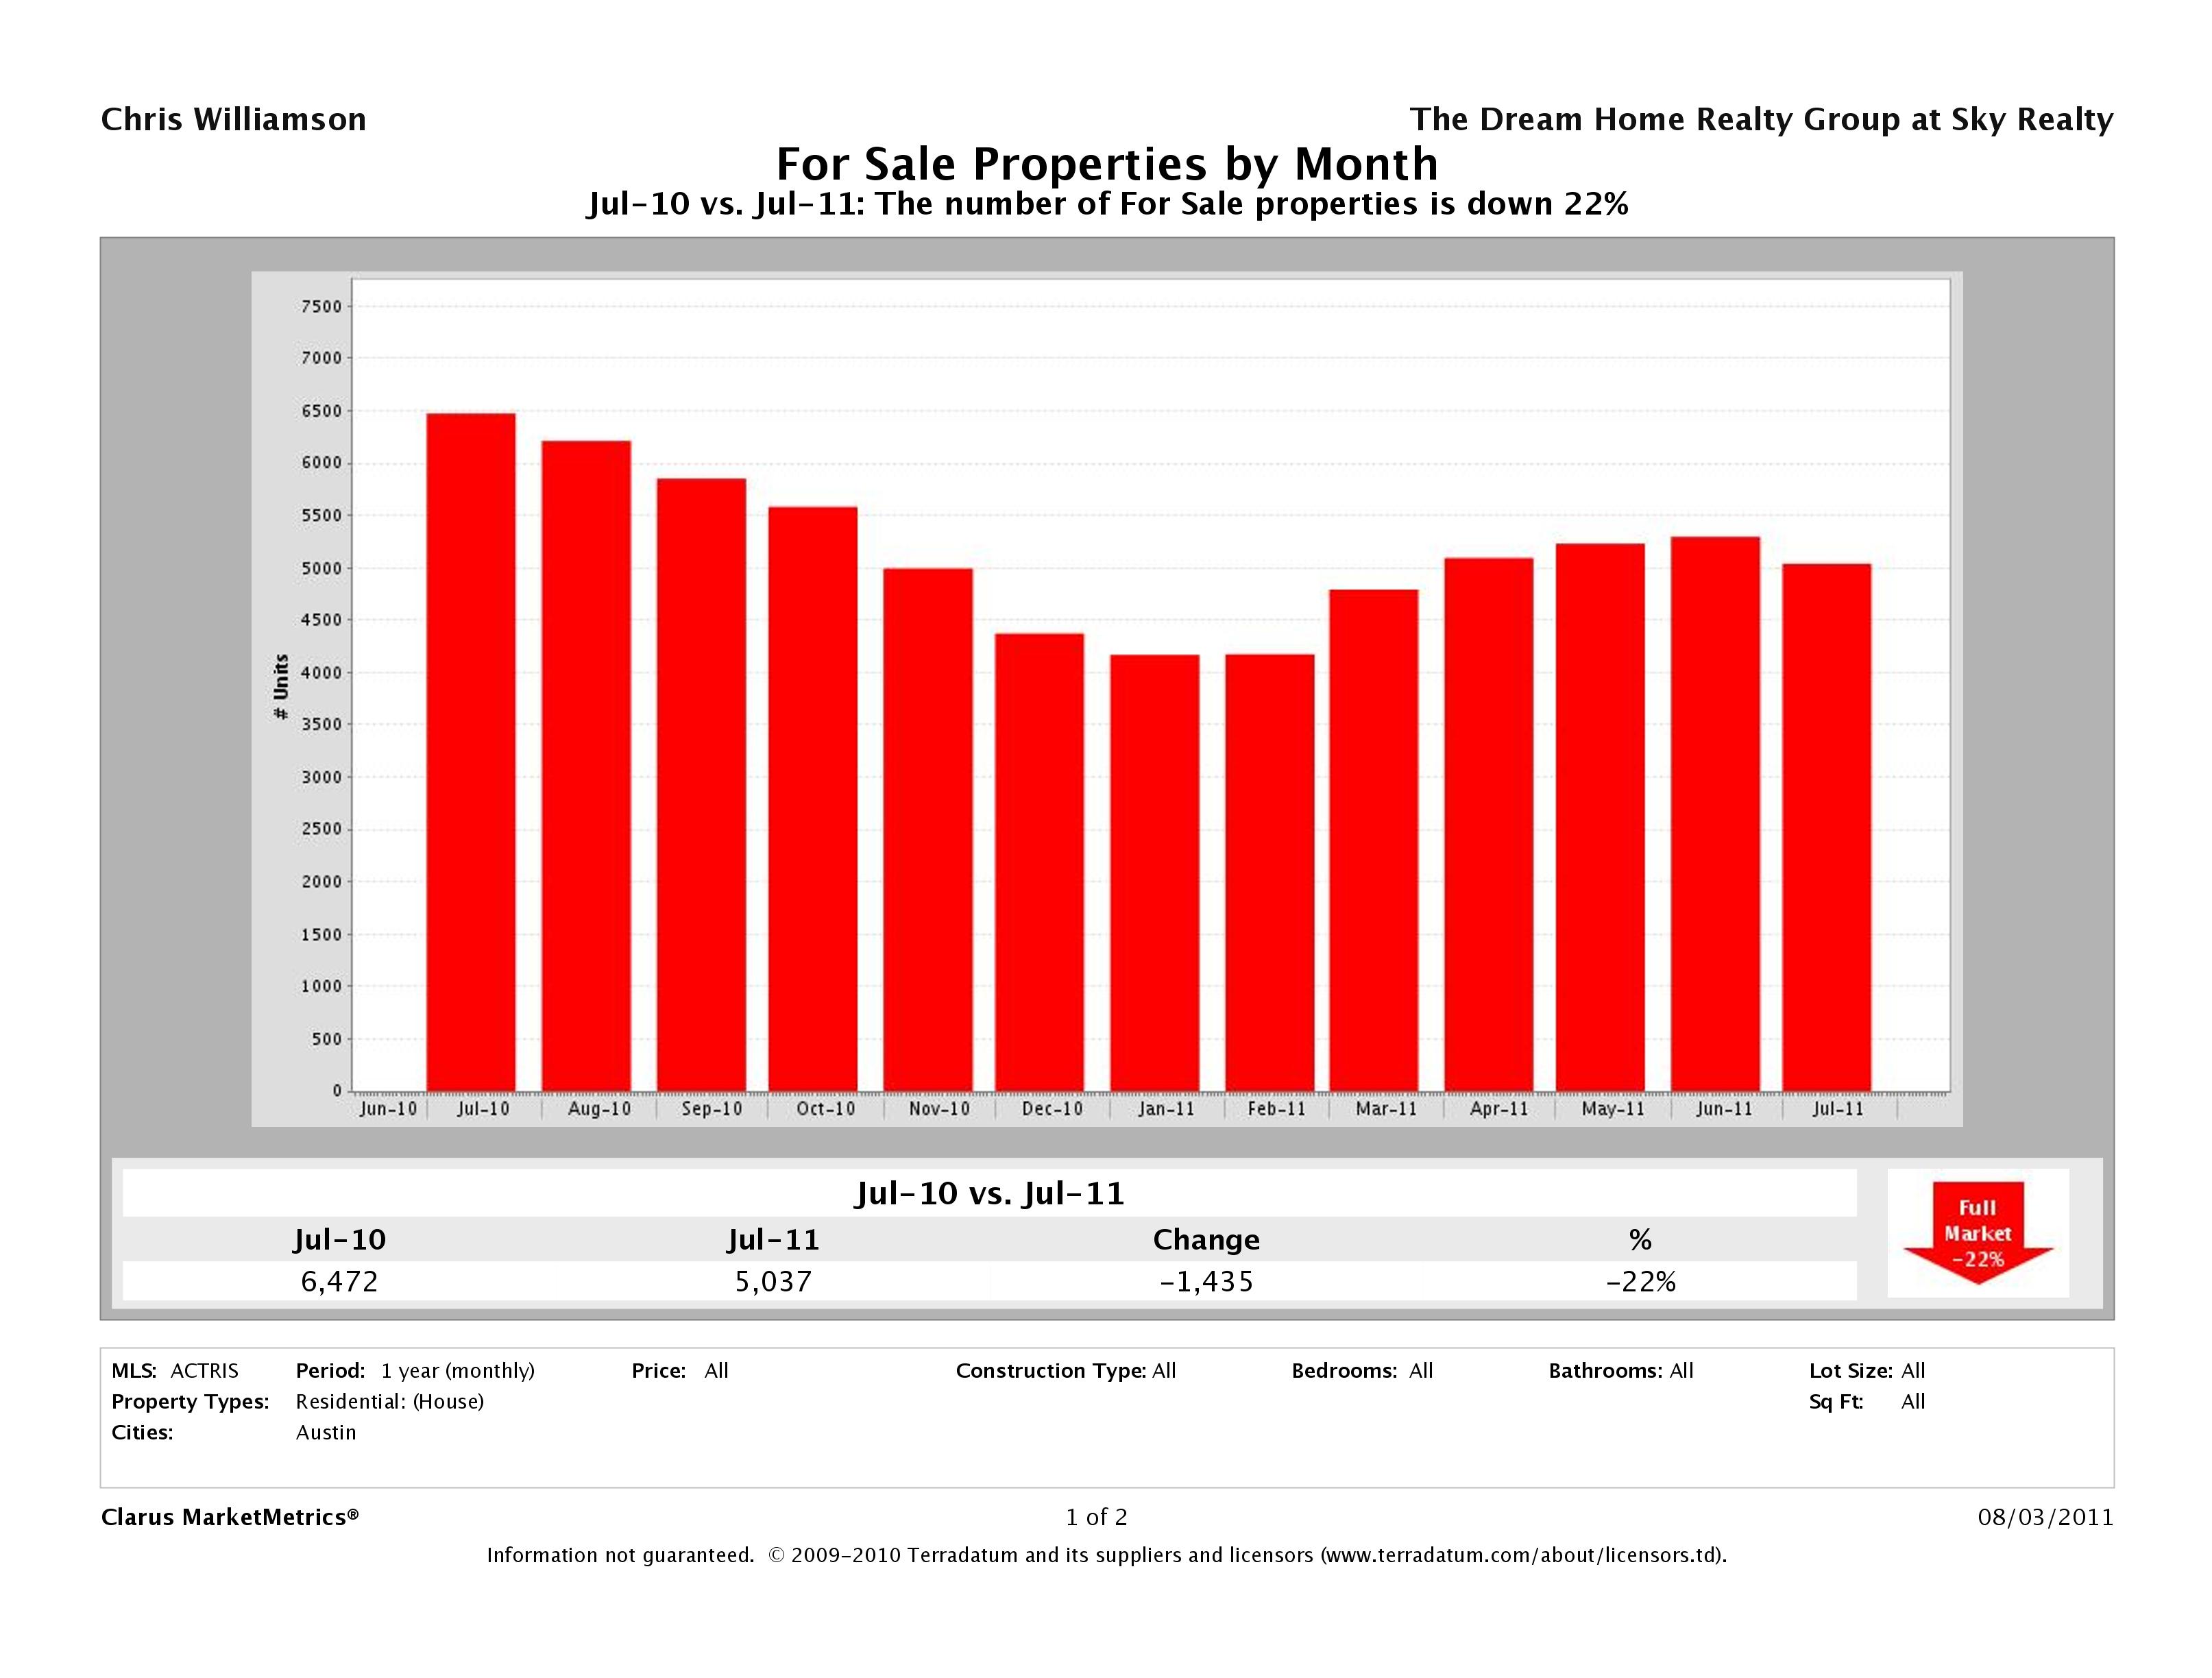
22% Fewer Austin Homes for Sale
Again, we saw a decrease in the number of homes for sale in Austin down 22% from July 2010 numbers. Last year at this time, there were 6,472 homes for sale while this year we only had 5,037 homes listed on the market. Like last month, this decreased number of homes for sale is partially due to the large number of homes that went pending this month and partially due to the fact that sellers are still reluctant to sell.
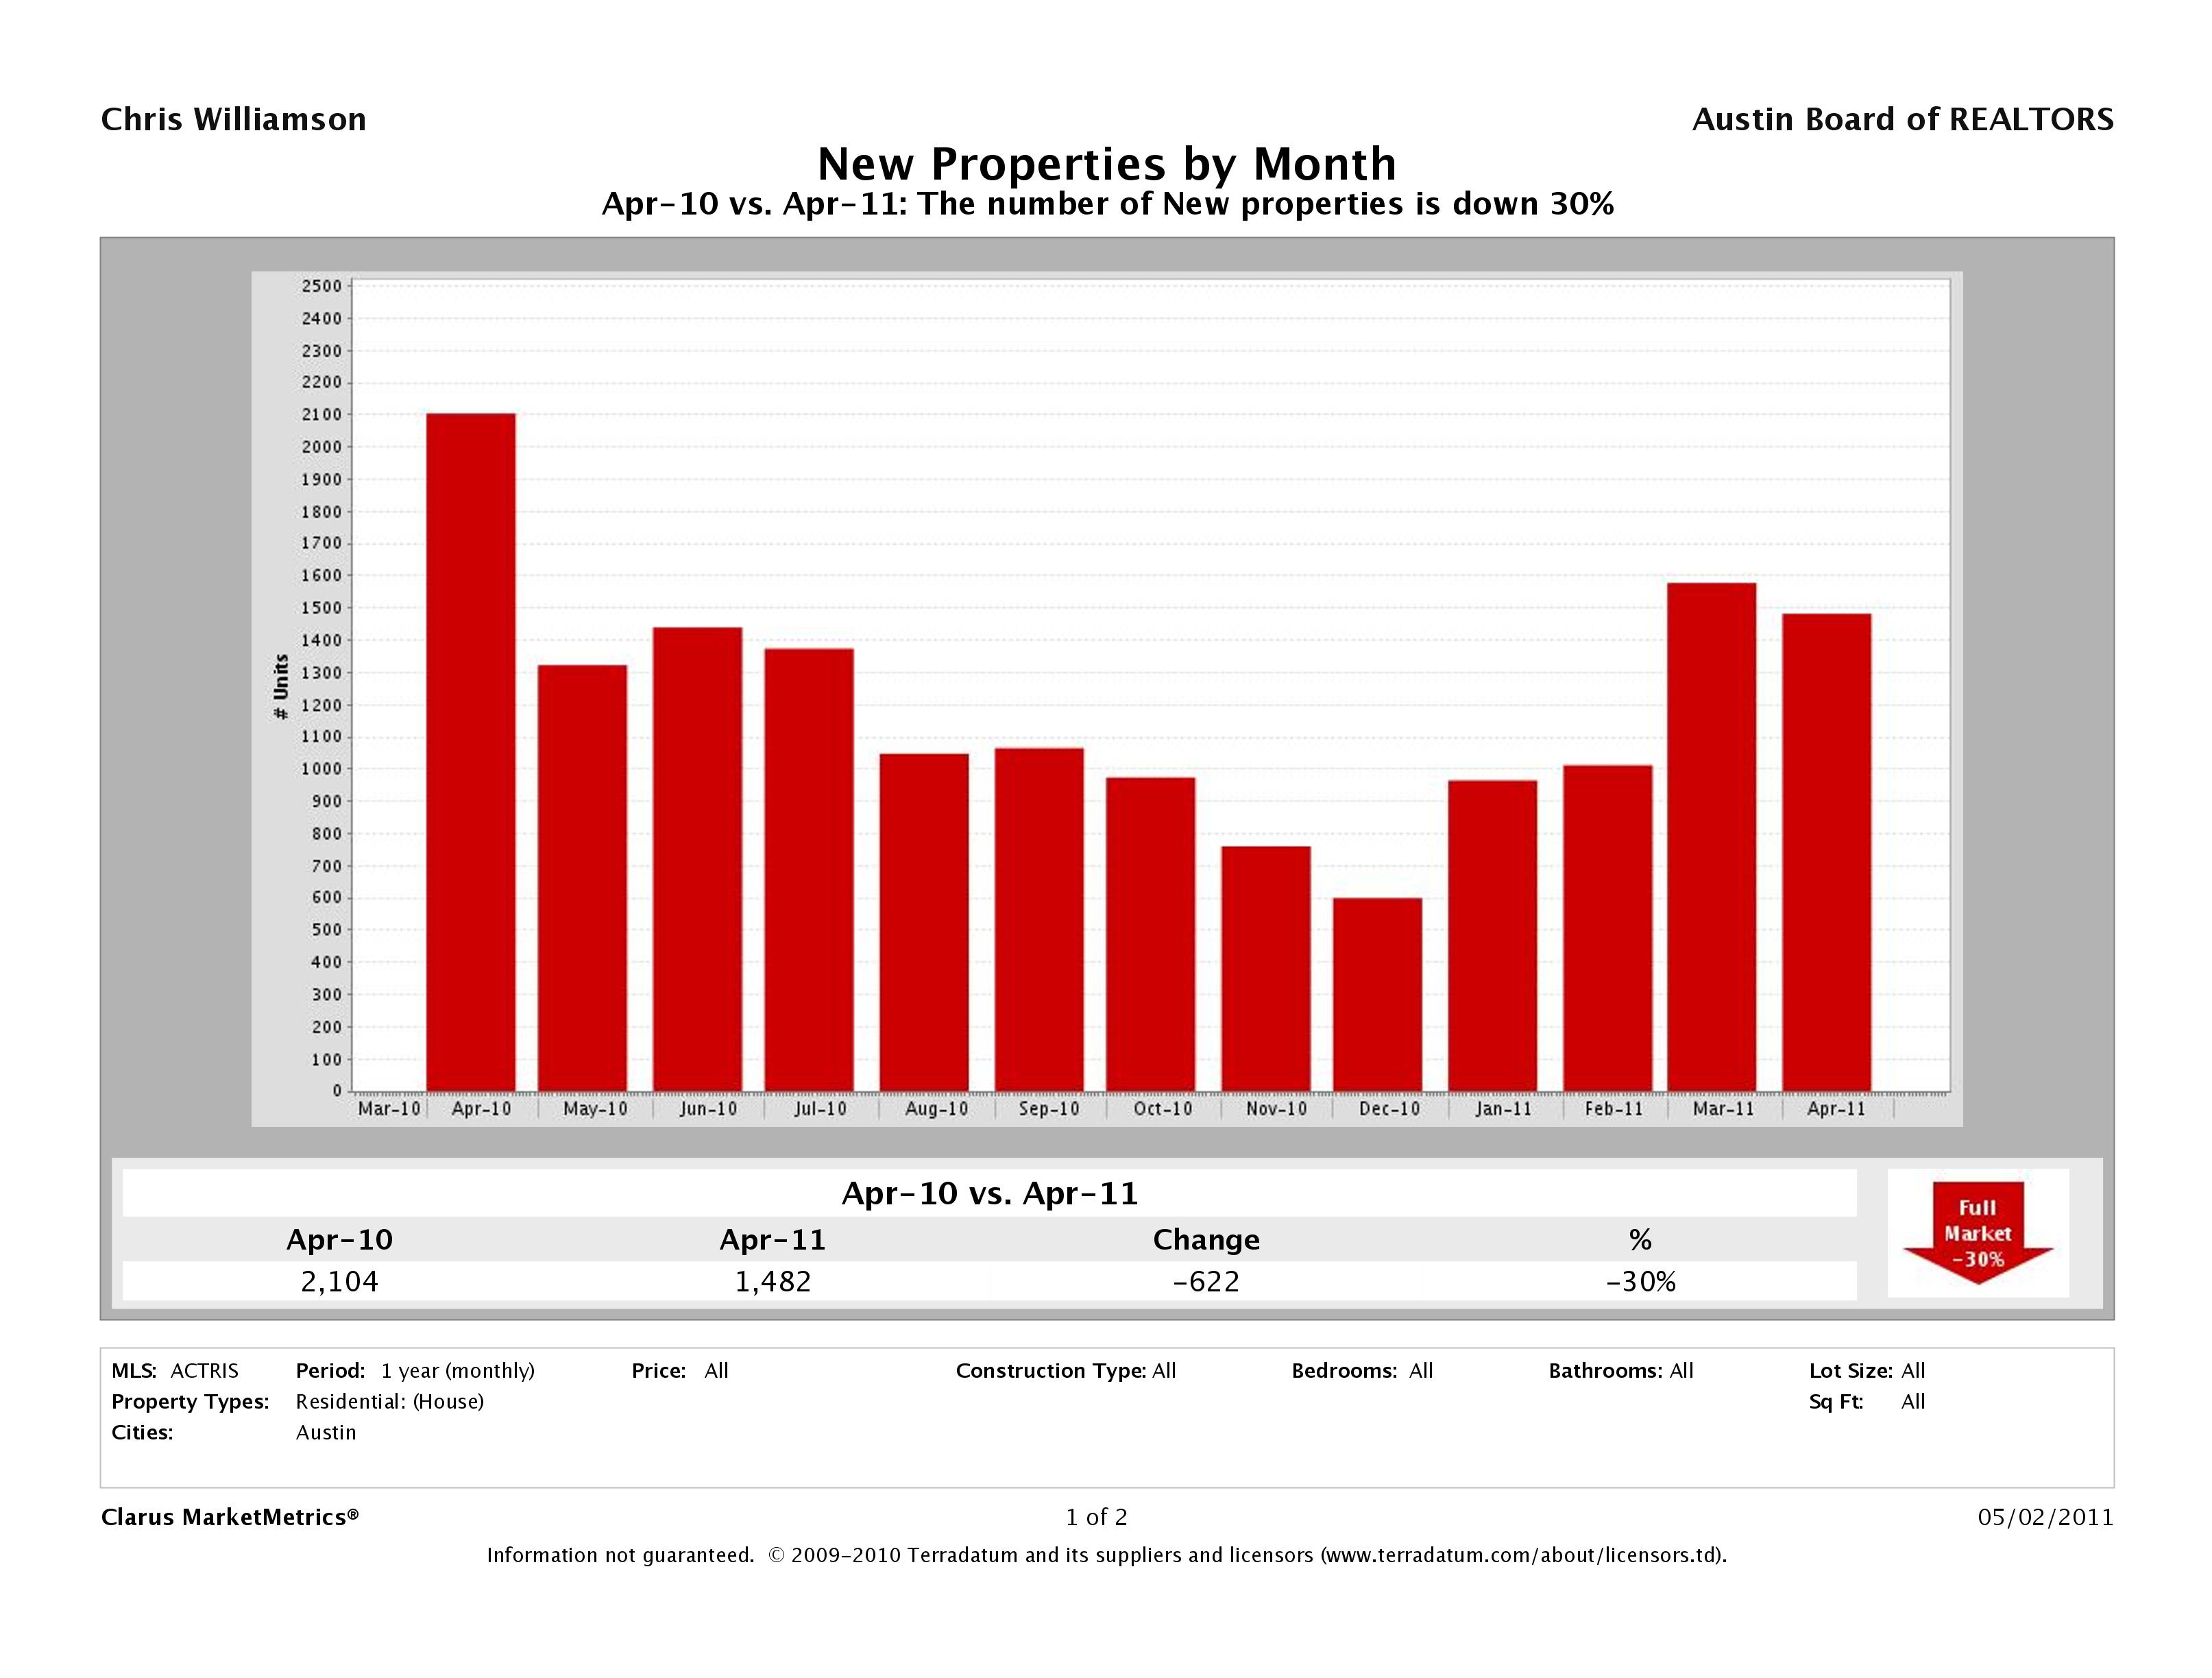
Number of Homes Listed for Sale Down 14%
This month, we saw a 14% decrease in the number of homes listed for sale in Austin with 1,182 new listings in July 2011 vs 1,374 new listings in July 2010. It seems sellers continue to be reluctant to sell, or decide to hold onto their homes longer than they have in the past.
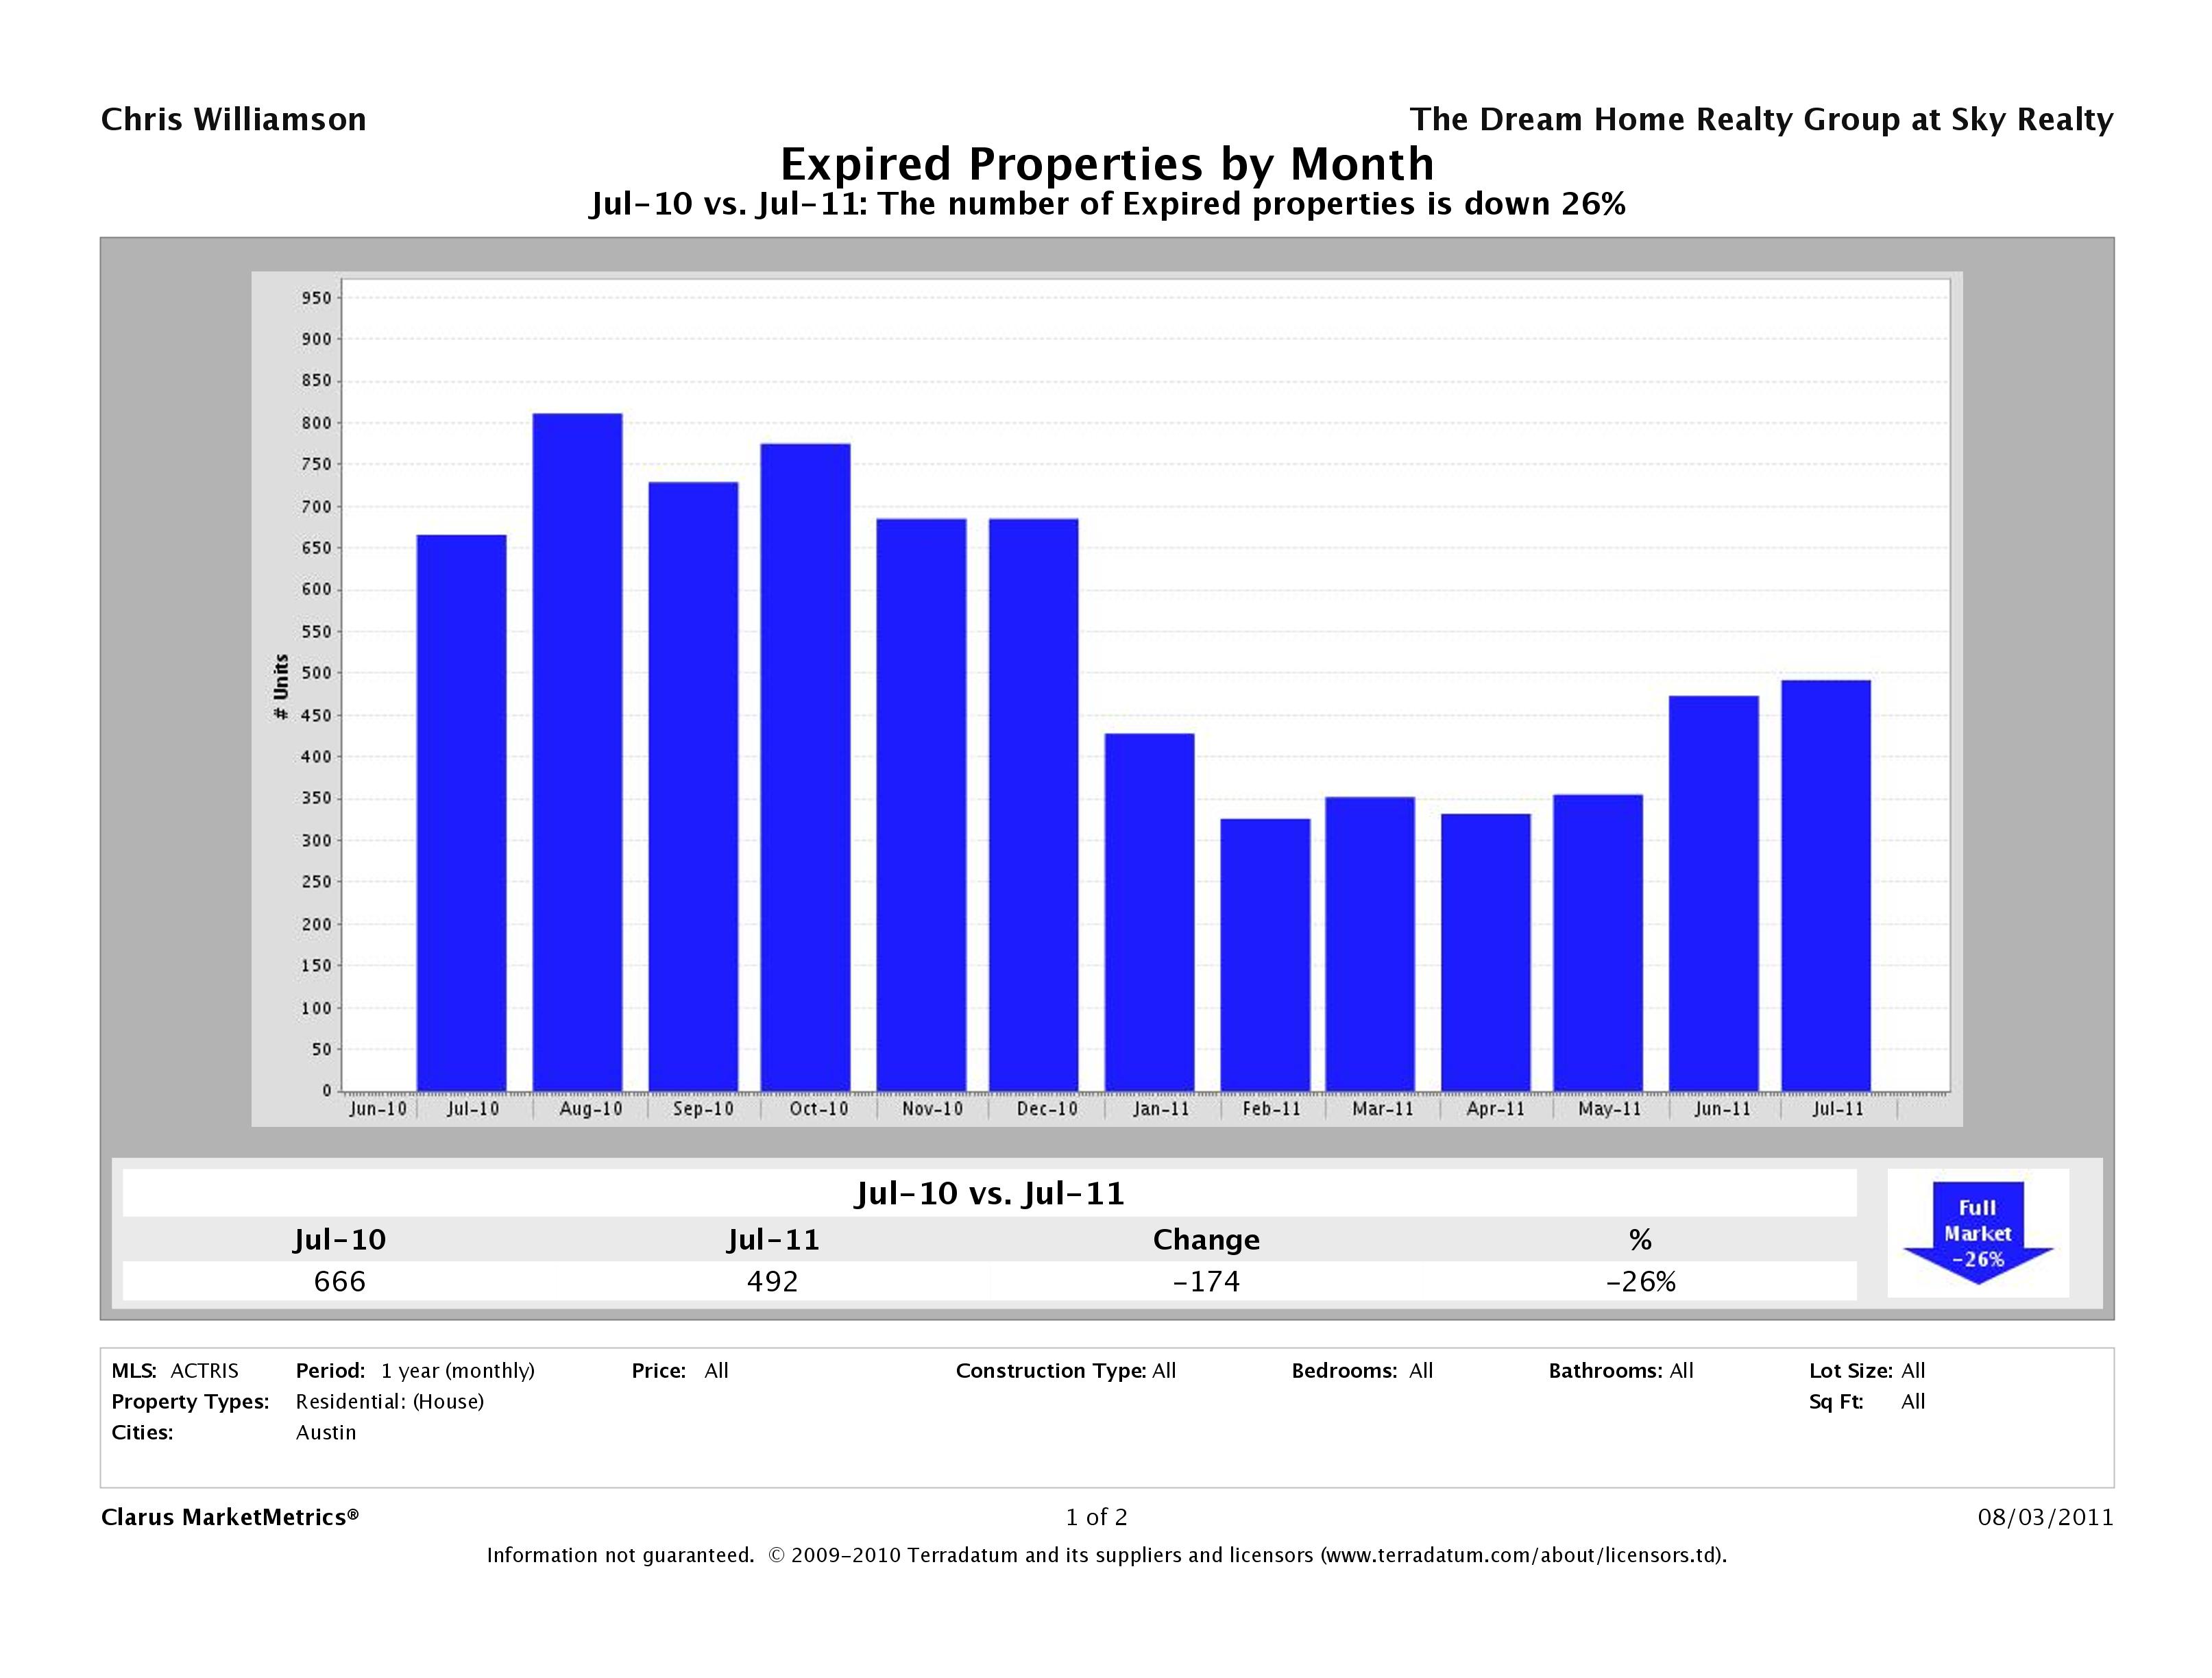
Number of Homes Taken Off the Market Down 26%
With such huge increases in the number of homes that went pending this month, this 26% decrease in the number of homes taken off the market (expired) is to be expected.
Did your home expire? Check out our Austin Home Not Selling resources page.
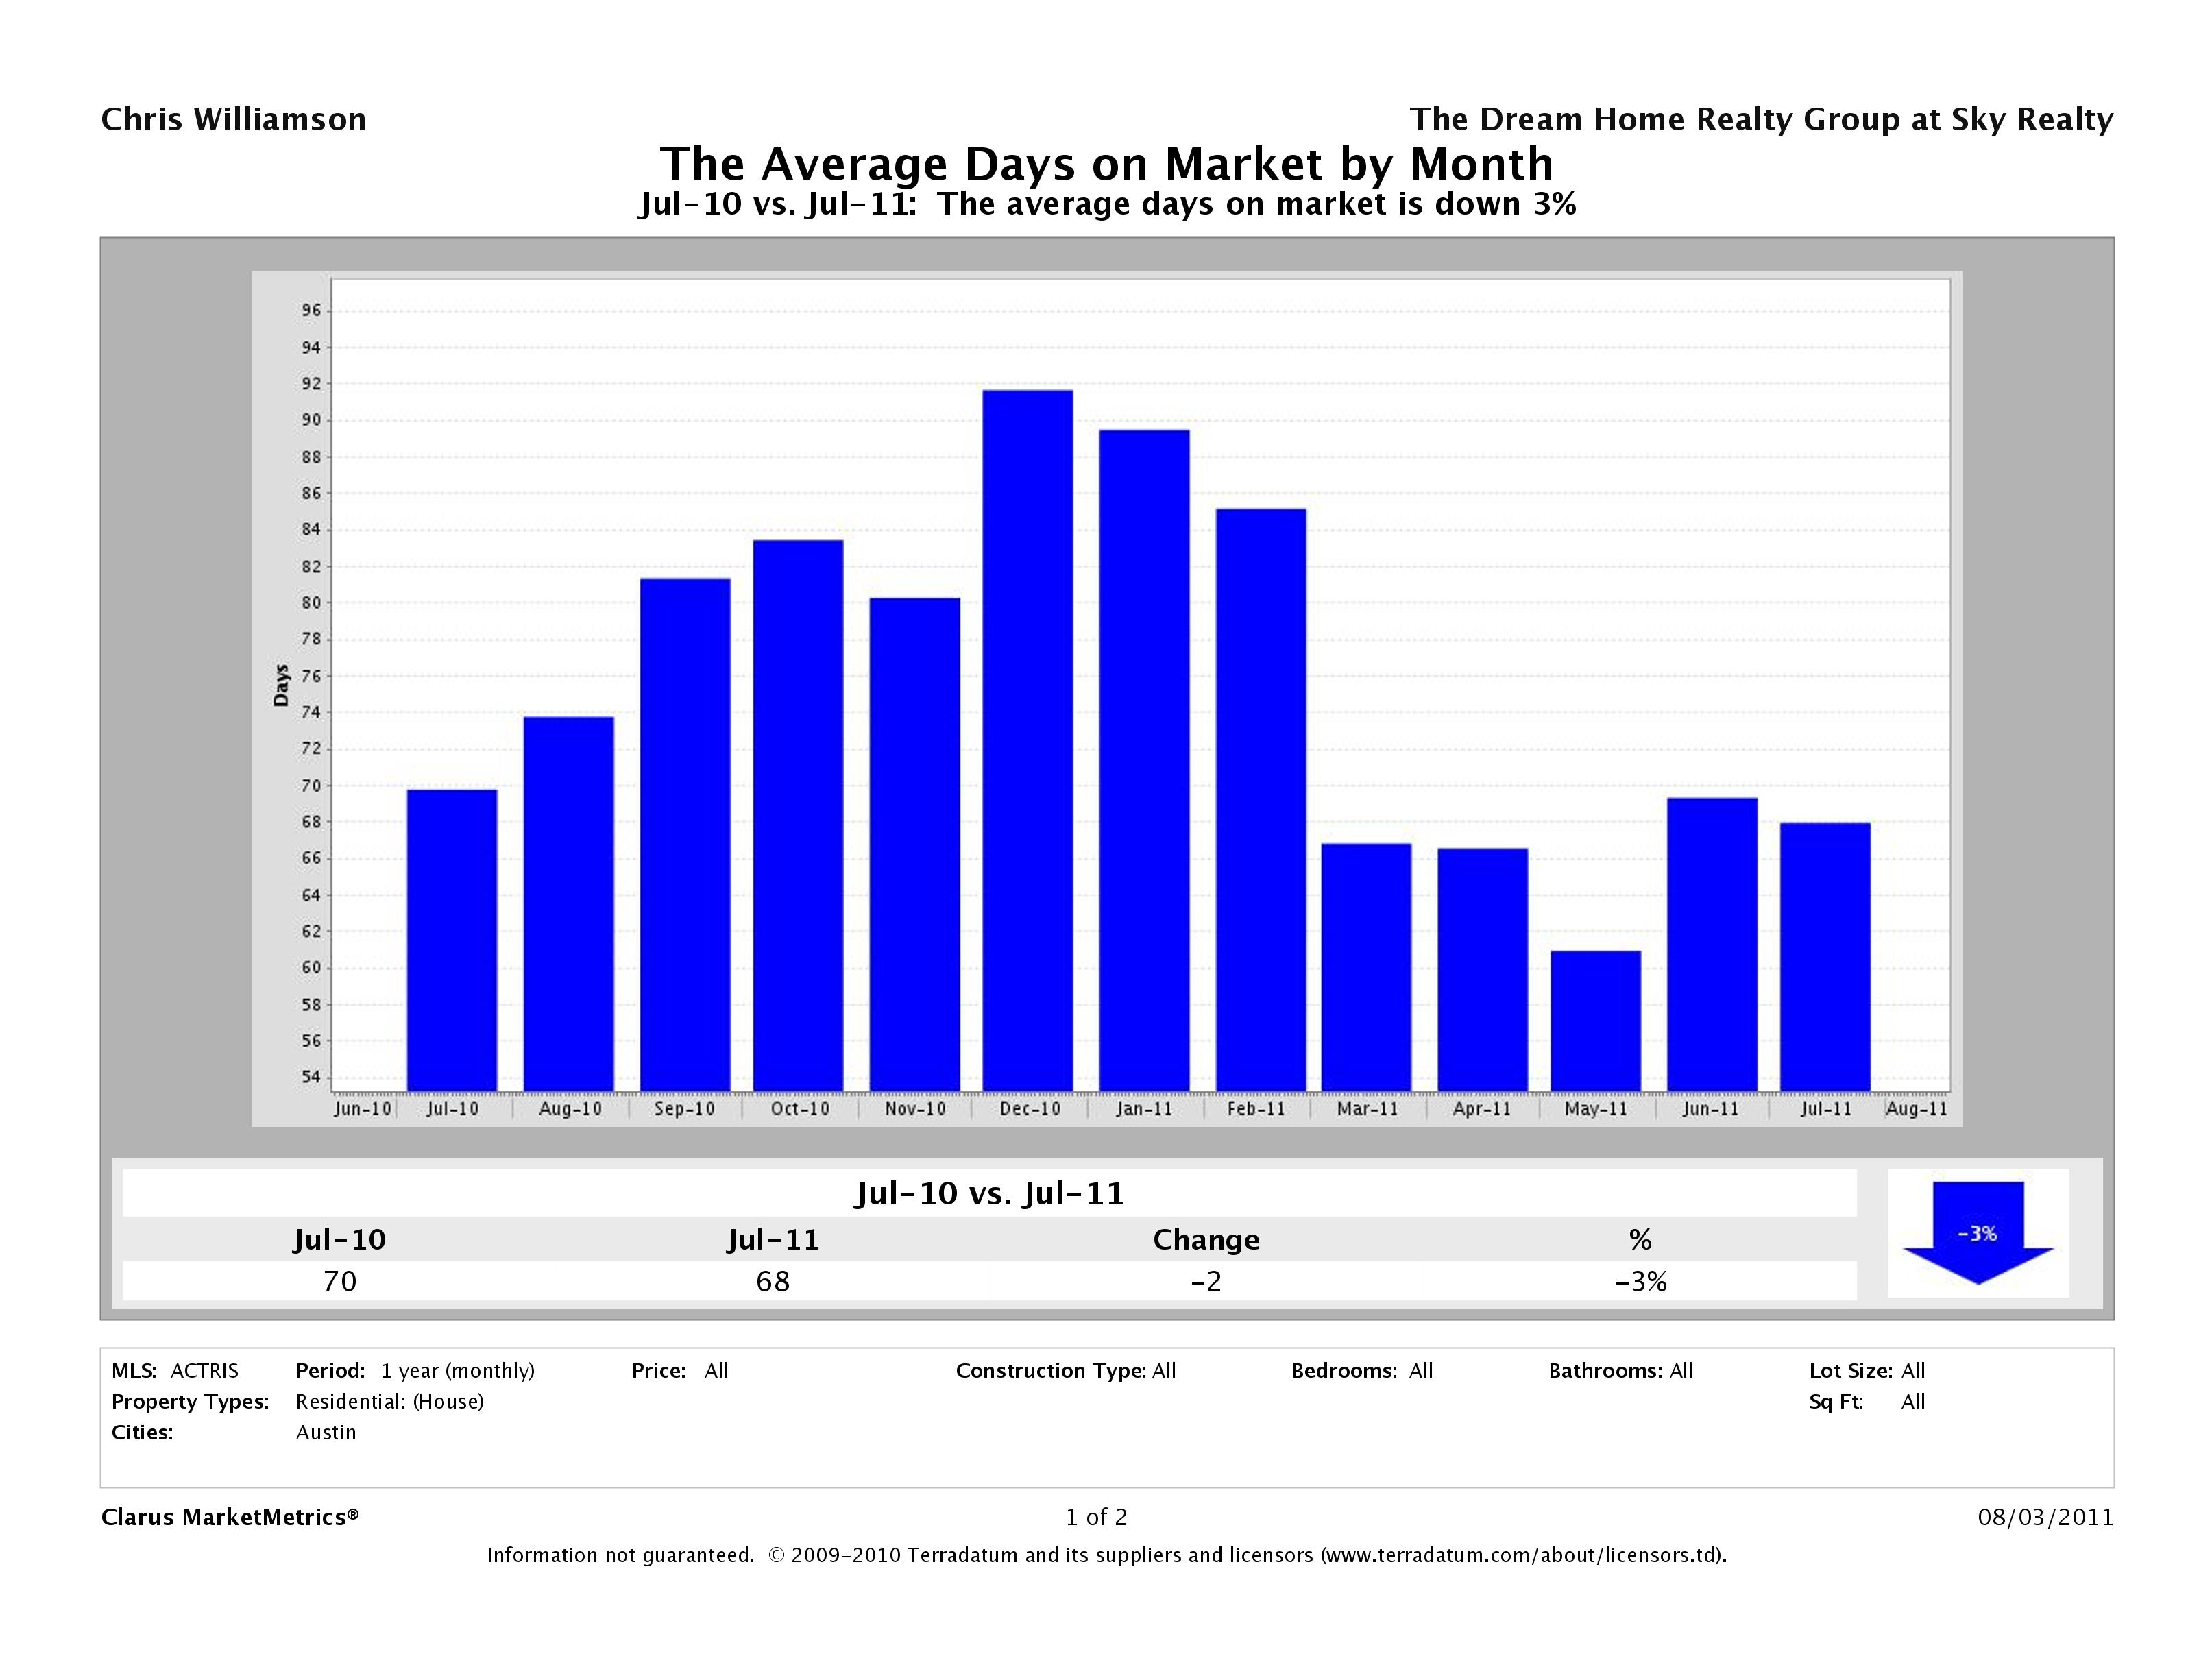
Time to Sell Home in Austin Down 3%
In July 2010, it took, on average, 70 days to sell a home in Austin while in July 2011, its taking around 68 days. Statistically, this isn’t too much of a difference, so we’ll just call this even.
Supply is Down and Demand is Up
This month we’ve seen a 22% decrease in supply (number of properties for sale) and a 16% increase in demand (number of sold properties). As we predicted in last month’s report, July 2011 buyers came out strong and have continued to purchase available inventory.
Median for Sale Up 2% vs Median Sold Price Down 8%
This chart compares the Median for Sale Price vs the Median Sold Price to show their relationship. In Austin, we saw a 2% decrease in the median for sale price of a single family home in year over year numbers. The median sold price was down 8%, decreasing $21,140 in year over year numbers. It seems although sellers are getting more realistic with their pricing, buyers are continuing to negotiate favorable deals.
Source: Clarus Market Metrics, ACTRIS Sold Data
Time to Buy? Sell?
As we always say, the best time to buy or sell a home is when you need to buy or sell. If you have a house to sell, selling when its a buyers market may hurt you on the selling end, but you’ll make it up on the buying end. If you’re trying to get into the market for the first time, the only way you’ll know that we’ve “hit bottom” is when its in the rear view mirror. Work with professionals who can help you analyze your financial and lifestyle to determine if now is the right time to buy or sell.
Looking strictly at the numbers, it appears the recommendation for this month is the same as its been the last four months…its time to sell. With inventory at its lowest levels we’ve seen in the last 2+ years, dipping even further from last month’s 2 year plus low, a home that’s priced right should have no problem finding a buyer. Buyers again came out in record numbers in July 2011. As we head into back to school time, buyers will start to get distracted. If you need to sell, try to get it on the market as soon as possible. For more info about the best home selling program in Austin, visit Sell My Austin Home.
If you’re a buyer, that doesn’t mean sit on the fence. Buyers have negotiated great deals from sellers who need to sell. If you’re looking to get into the market, the best time to find a great deal is any time you can. For more info about our Home Buyer Representation Program, check out Buy a Home in Austin.
Questions About the Austin Real Estate Price Report?
Do you have questions about this Austin Real Estate Price Report? Call us at (512) 827-8323 or email us at info@AustinRealEstateHomesBlog.com and we’ll help you in any way we can. If you’re looking to buy or sell Austin real estate, don’t forget to check out our Buyer Resources and our Seller Resources for more tips.
Leave a Reply