
Eleven Oaks Realty is proud to present their April 2013 Austin Real Estate Price Report measuring activity in the Austin single family home market.
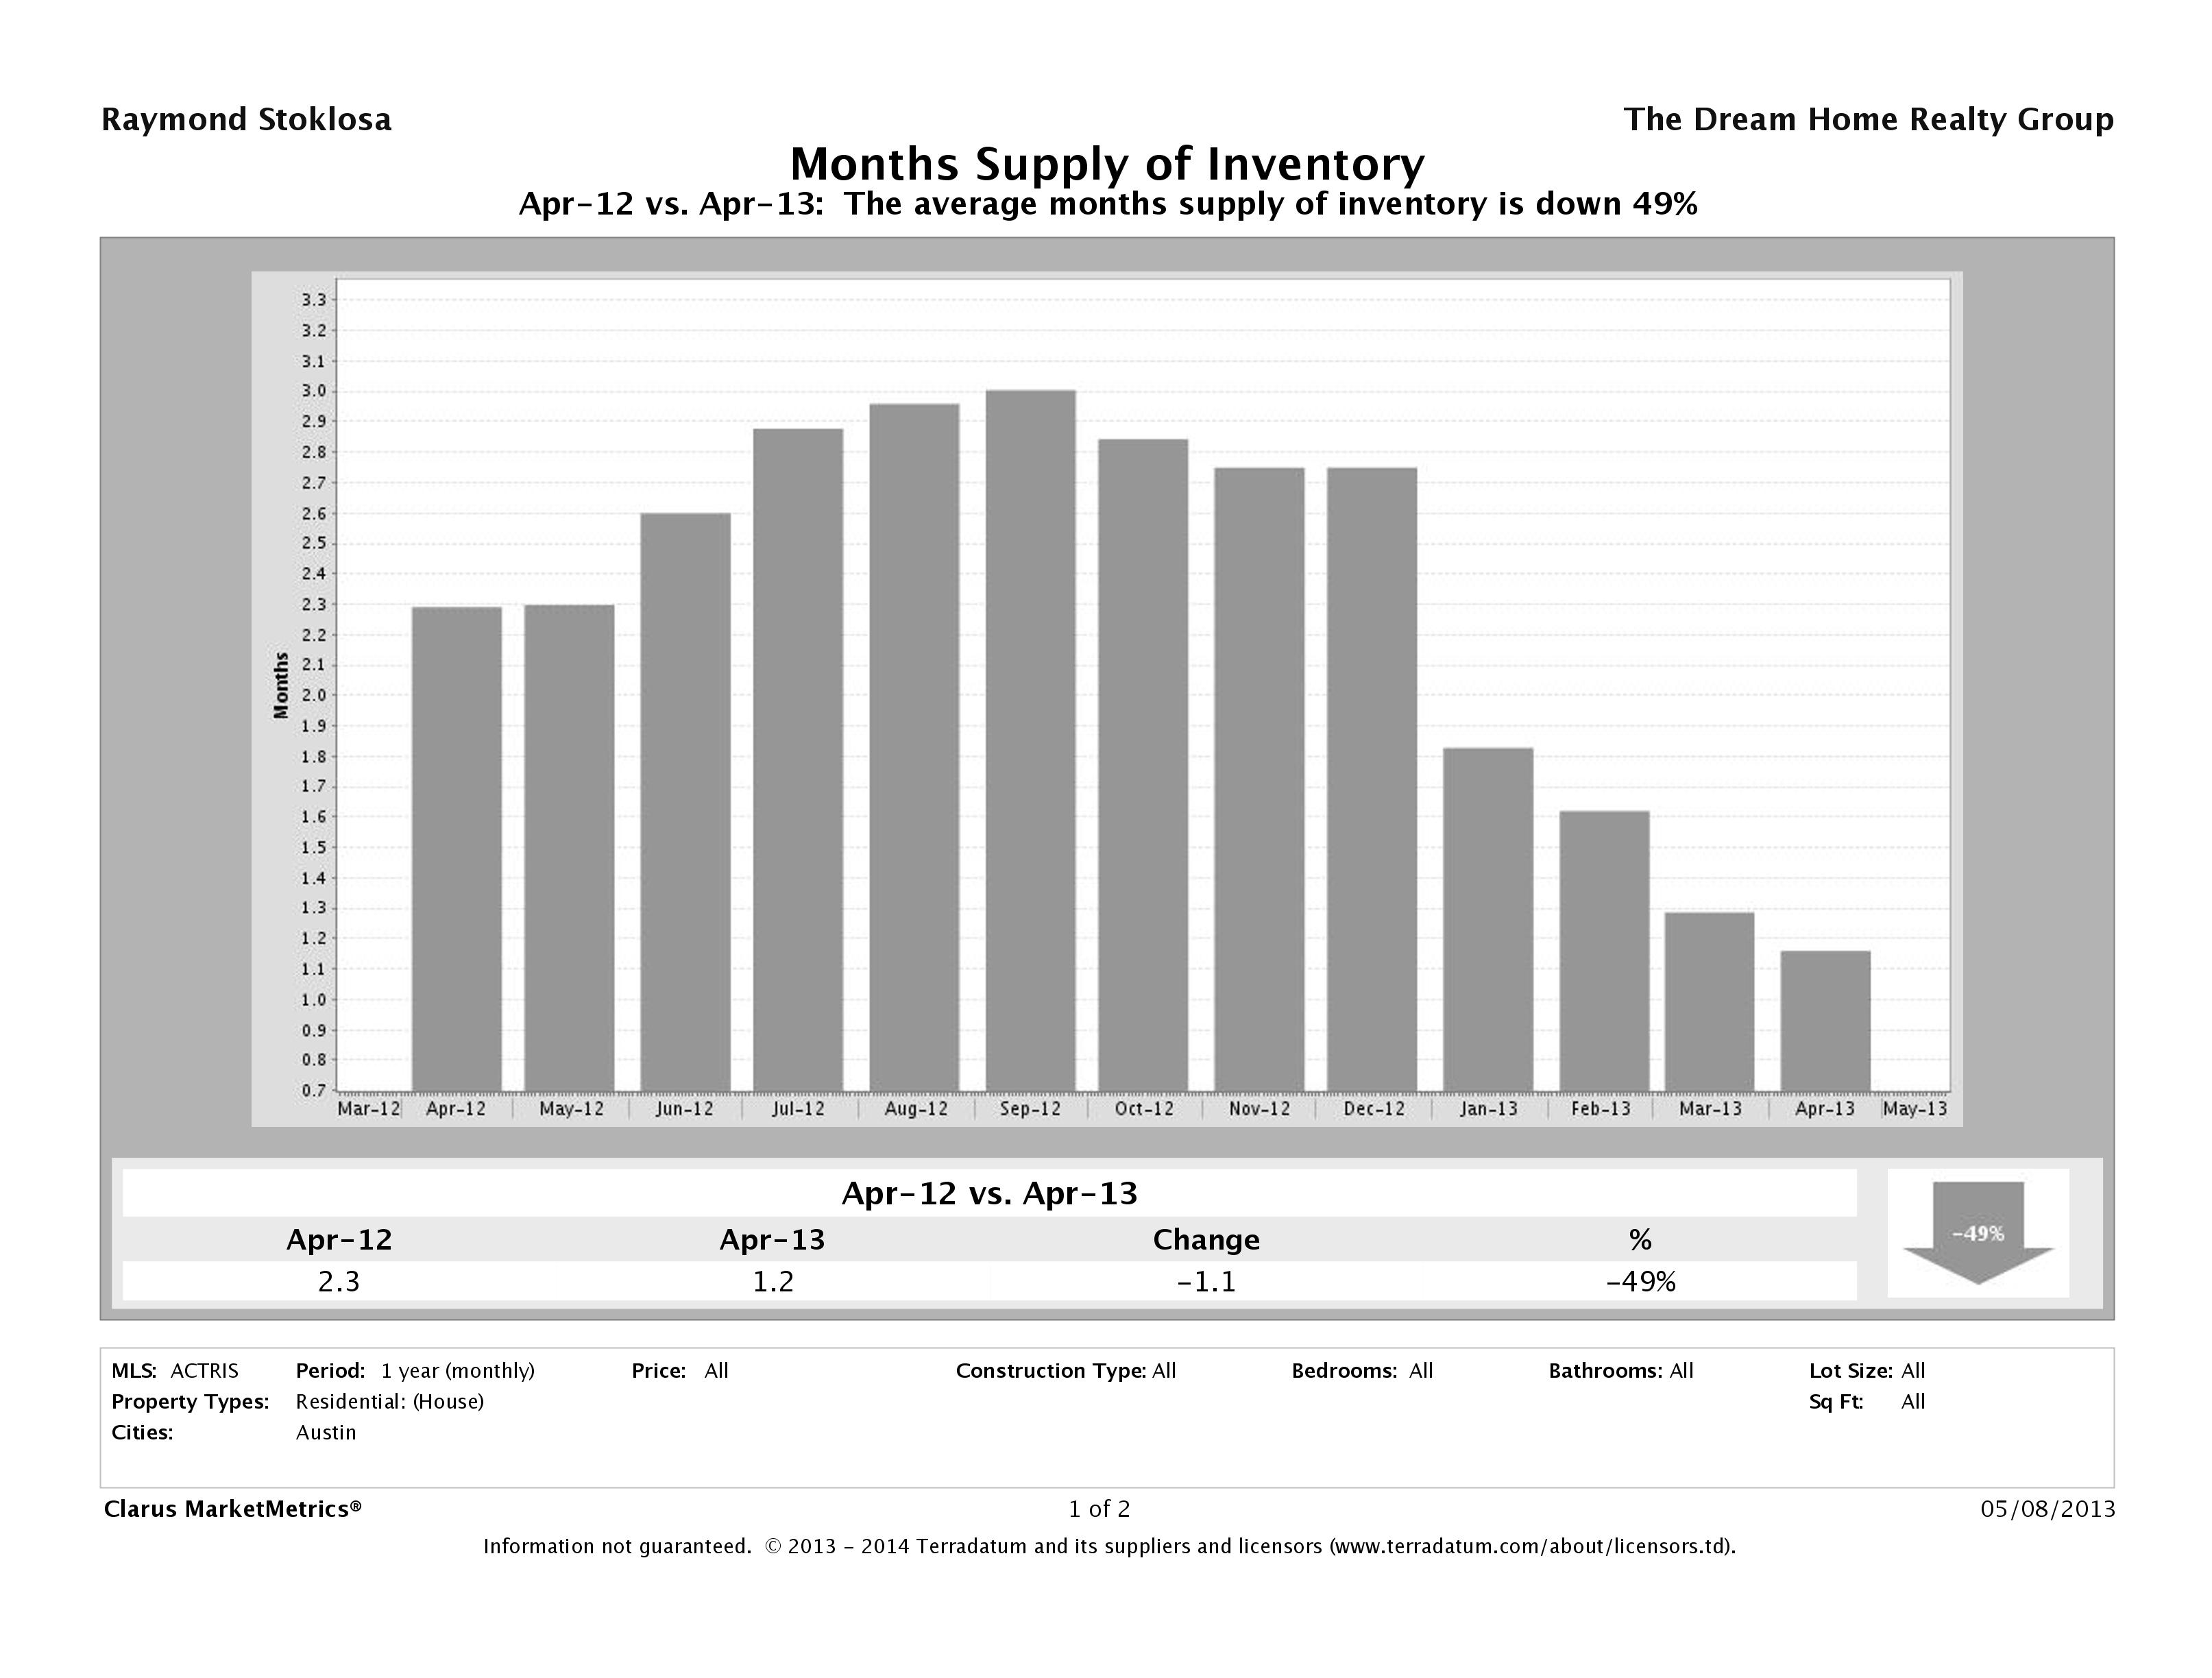
Austin Housing Inventory Down 48%
As it’s been for past several months, the biggest news in the Austin housing market comes by way of inventory. In April 2013, we saw a 49% decrease in months supply of inventory from already very low March 2013 numbers to just over 1 month inventory city wide. In the more desirable Austin neighborhoods, we are seeing an even smaller amount of inventory available. April 2012 saw 2.25 months of inventory, which is indicative of a strong sellers market. This month’s 1 month inventory surpassed last year’s low, making it an even more extreme sellers market.
What does this mean to buyers? If you’re in the market to buy, be proactive, especially if you’re looking in one of the more desirable neighborhoods. Homes that are priced right are selling within a matter of hours. Buyers can’t afford to wait a week to look at a home. Making home buying a priority will ensure you don’t miss out on a great house.
What does this mean to sellers? If you’re thinking about selling, now is the time to do it. We haven’t seen this extreme a seller’s market in Austin in years. Interest rates are incredibly low and buyers are starting to get eager to buy something before they go back up.
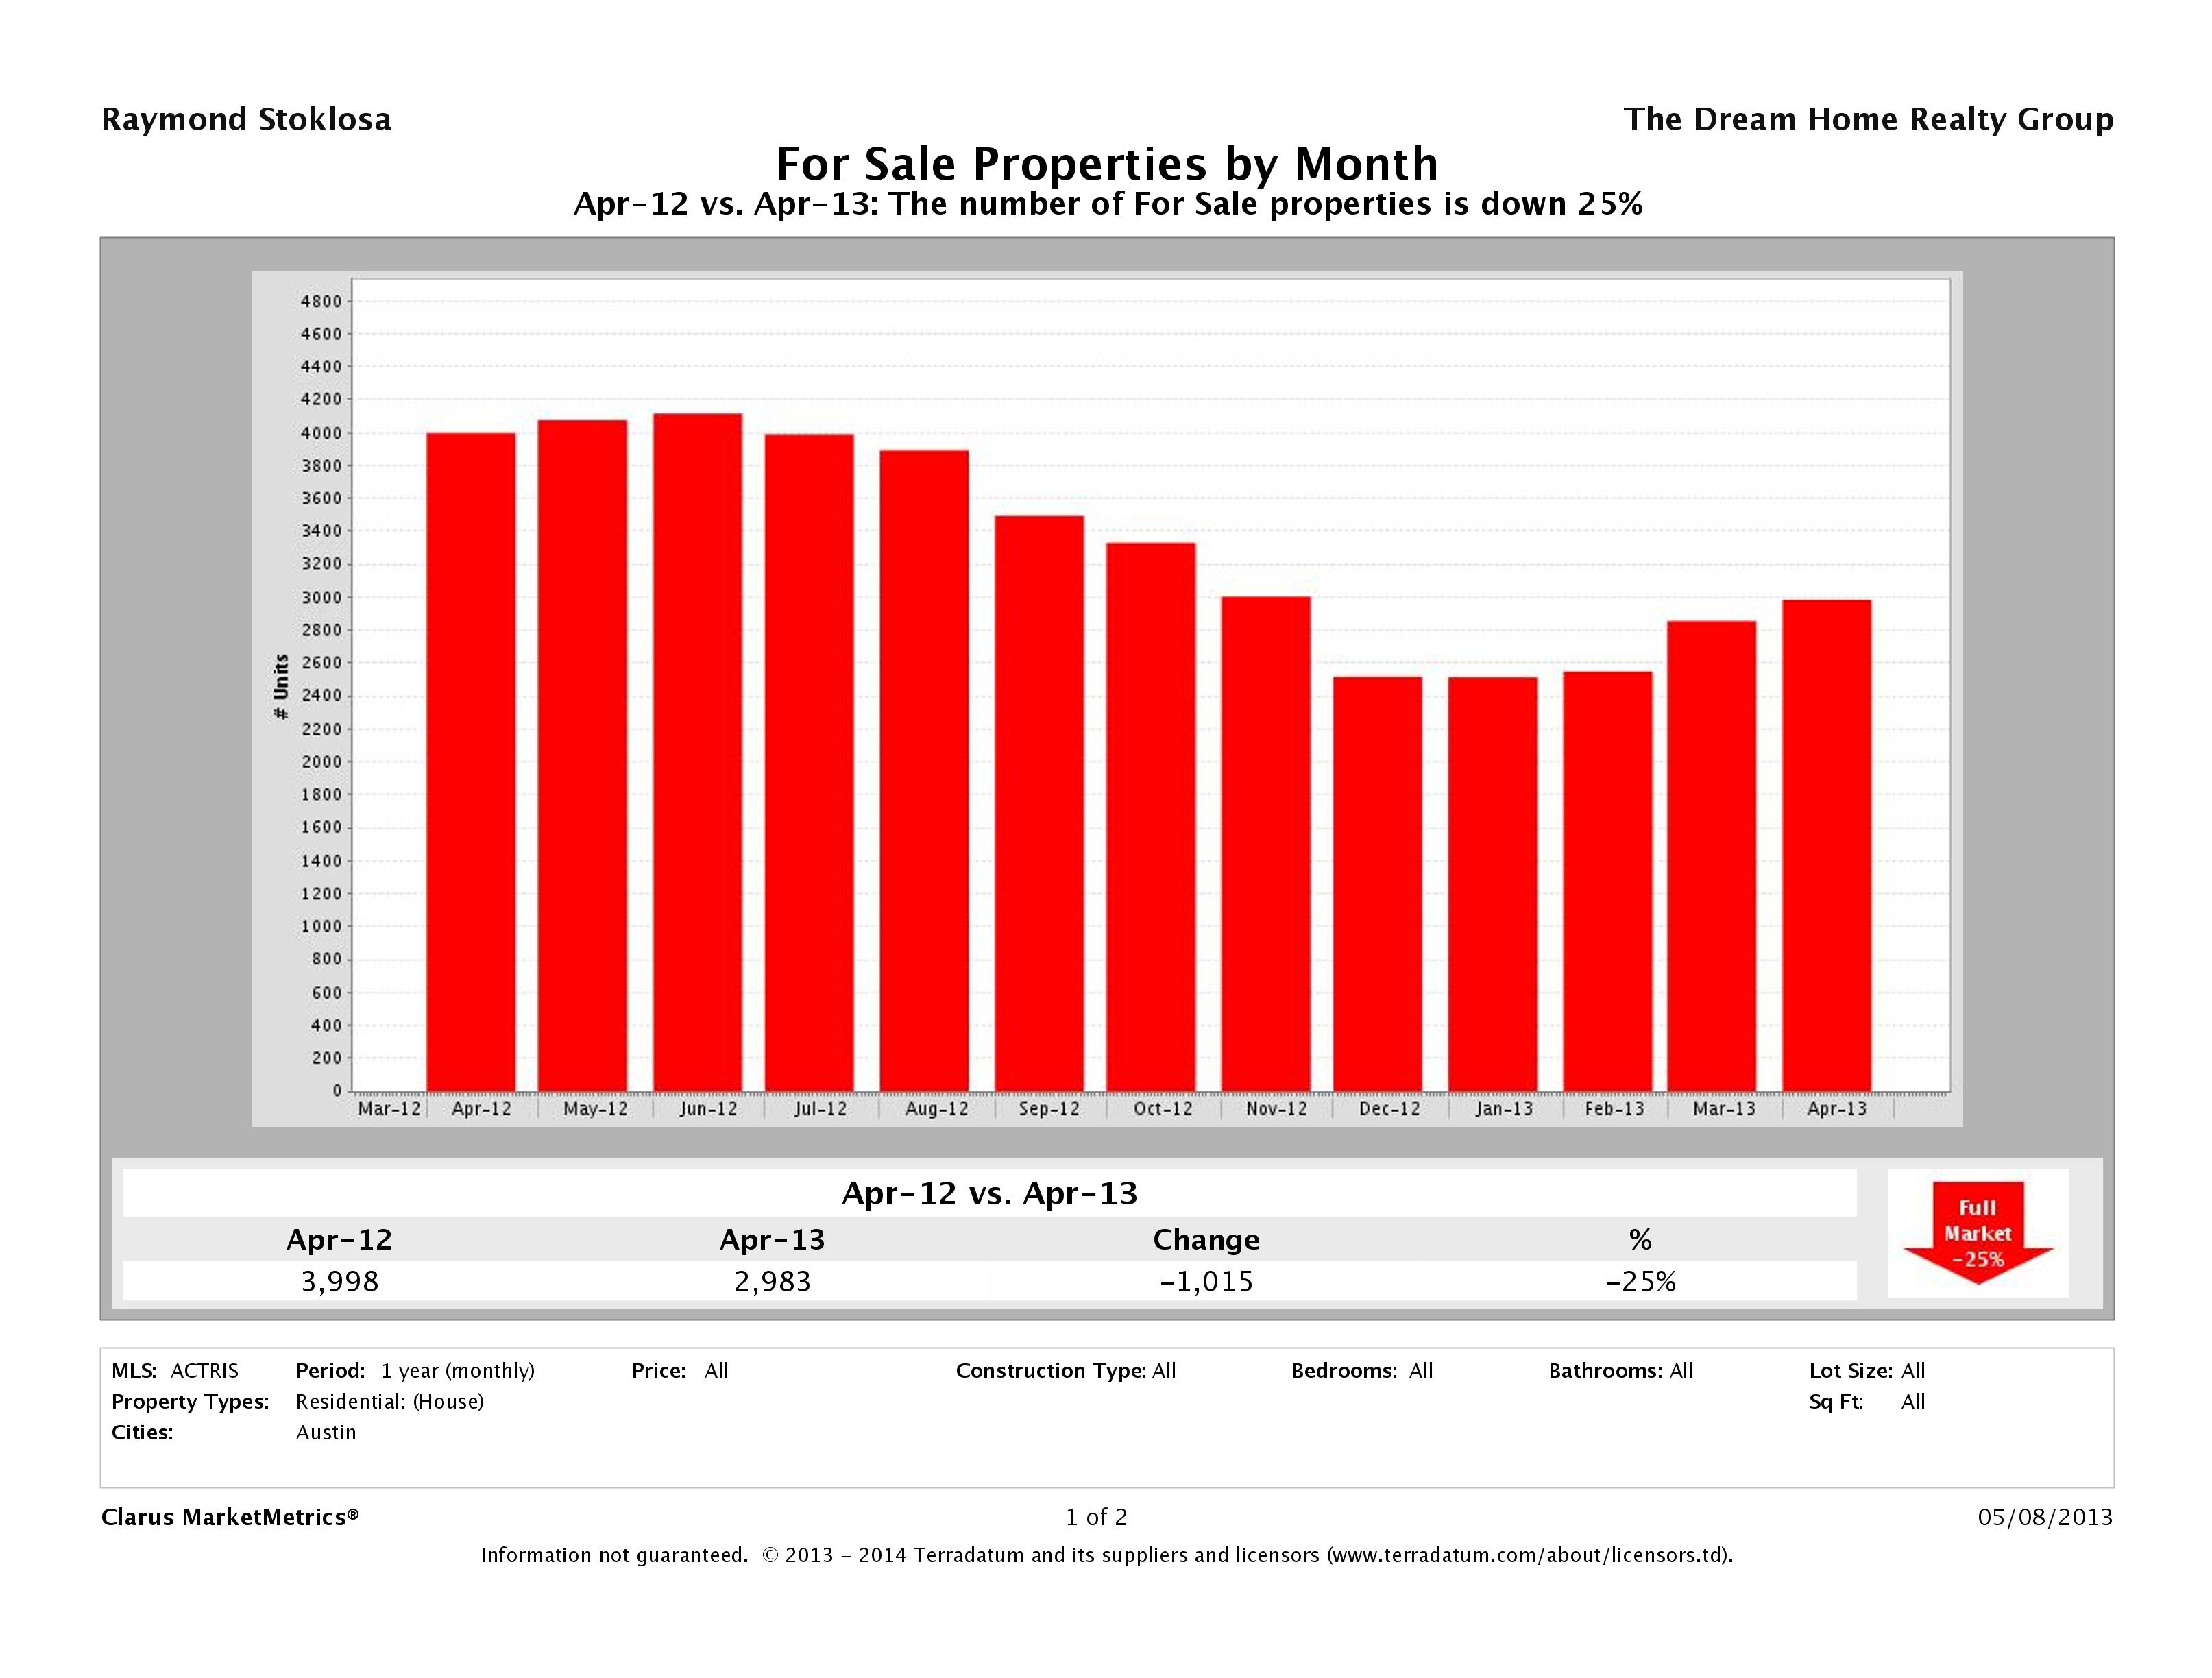
25% Fewer Homes on the Market than April 2012
In April 2013, we had 2,983 homes listed for sale in Austin, compared to 3,998 in April 2012. As you can see below in the properties listed for sale numbers (which are up in year over year numbers), we have less properties for sale, but that’s not because we have fewer homes being listed. We actually have 2% more homes being listed than we had last year at this time. This gives a good indication of the number of buyers out there waiting because even with increased number of new listings coming on to the market, we’re still seeing record low inventory that continues to create new records every month.
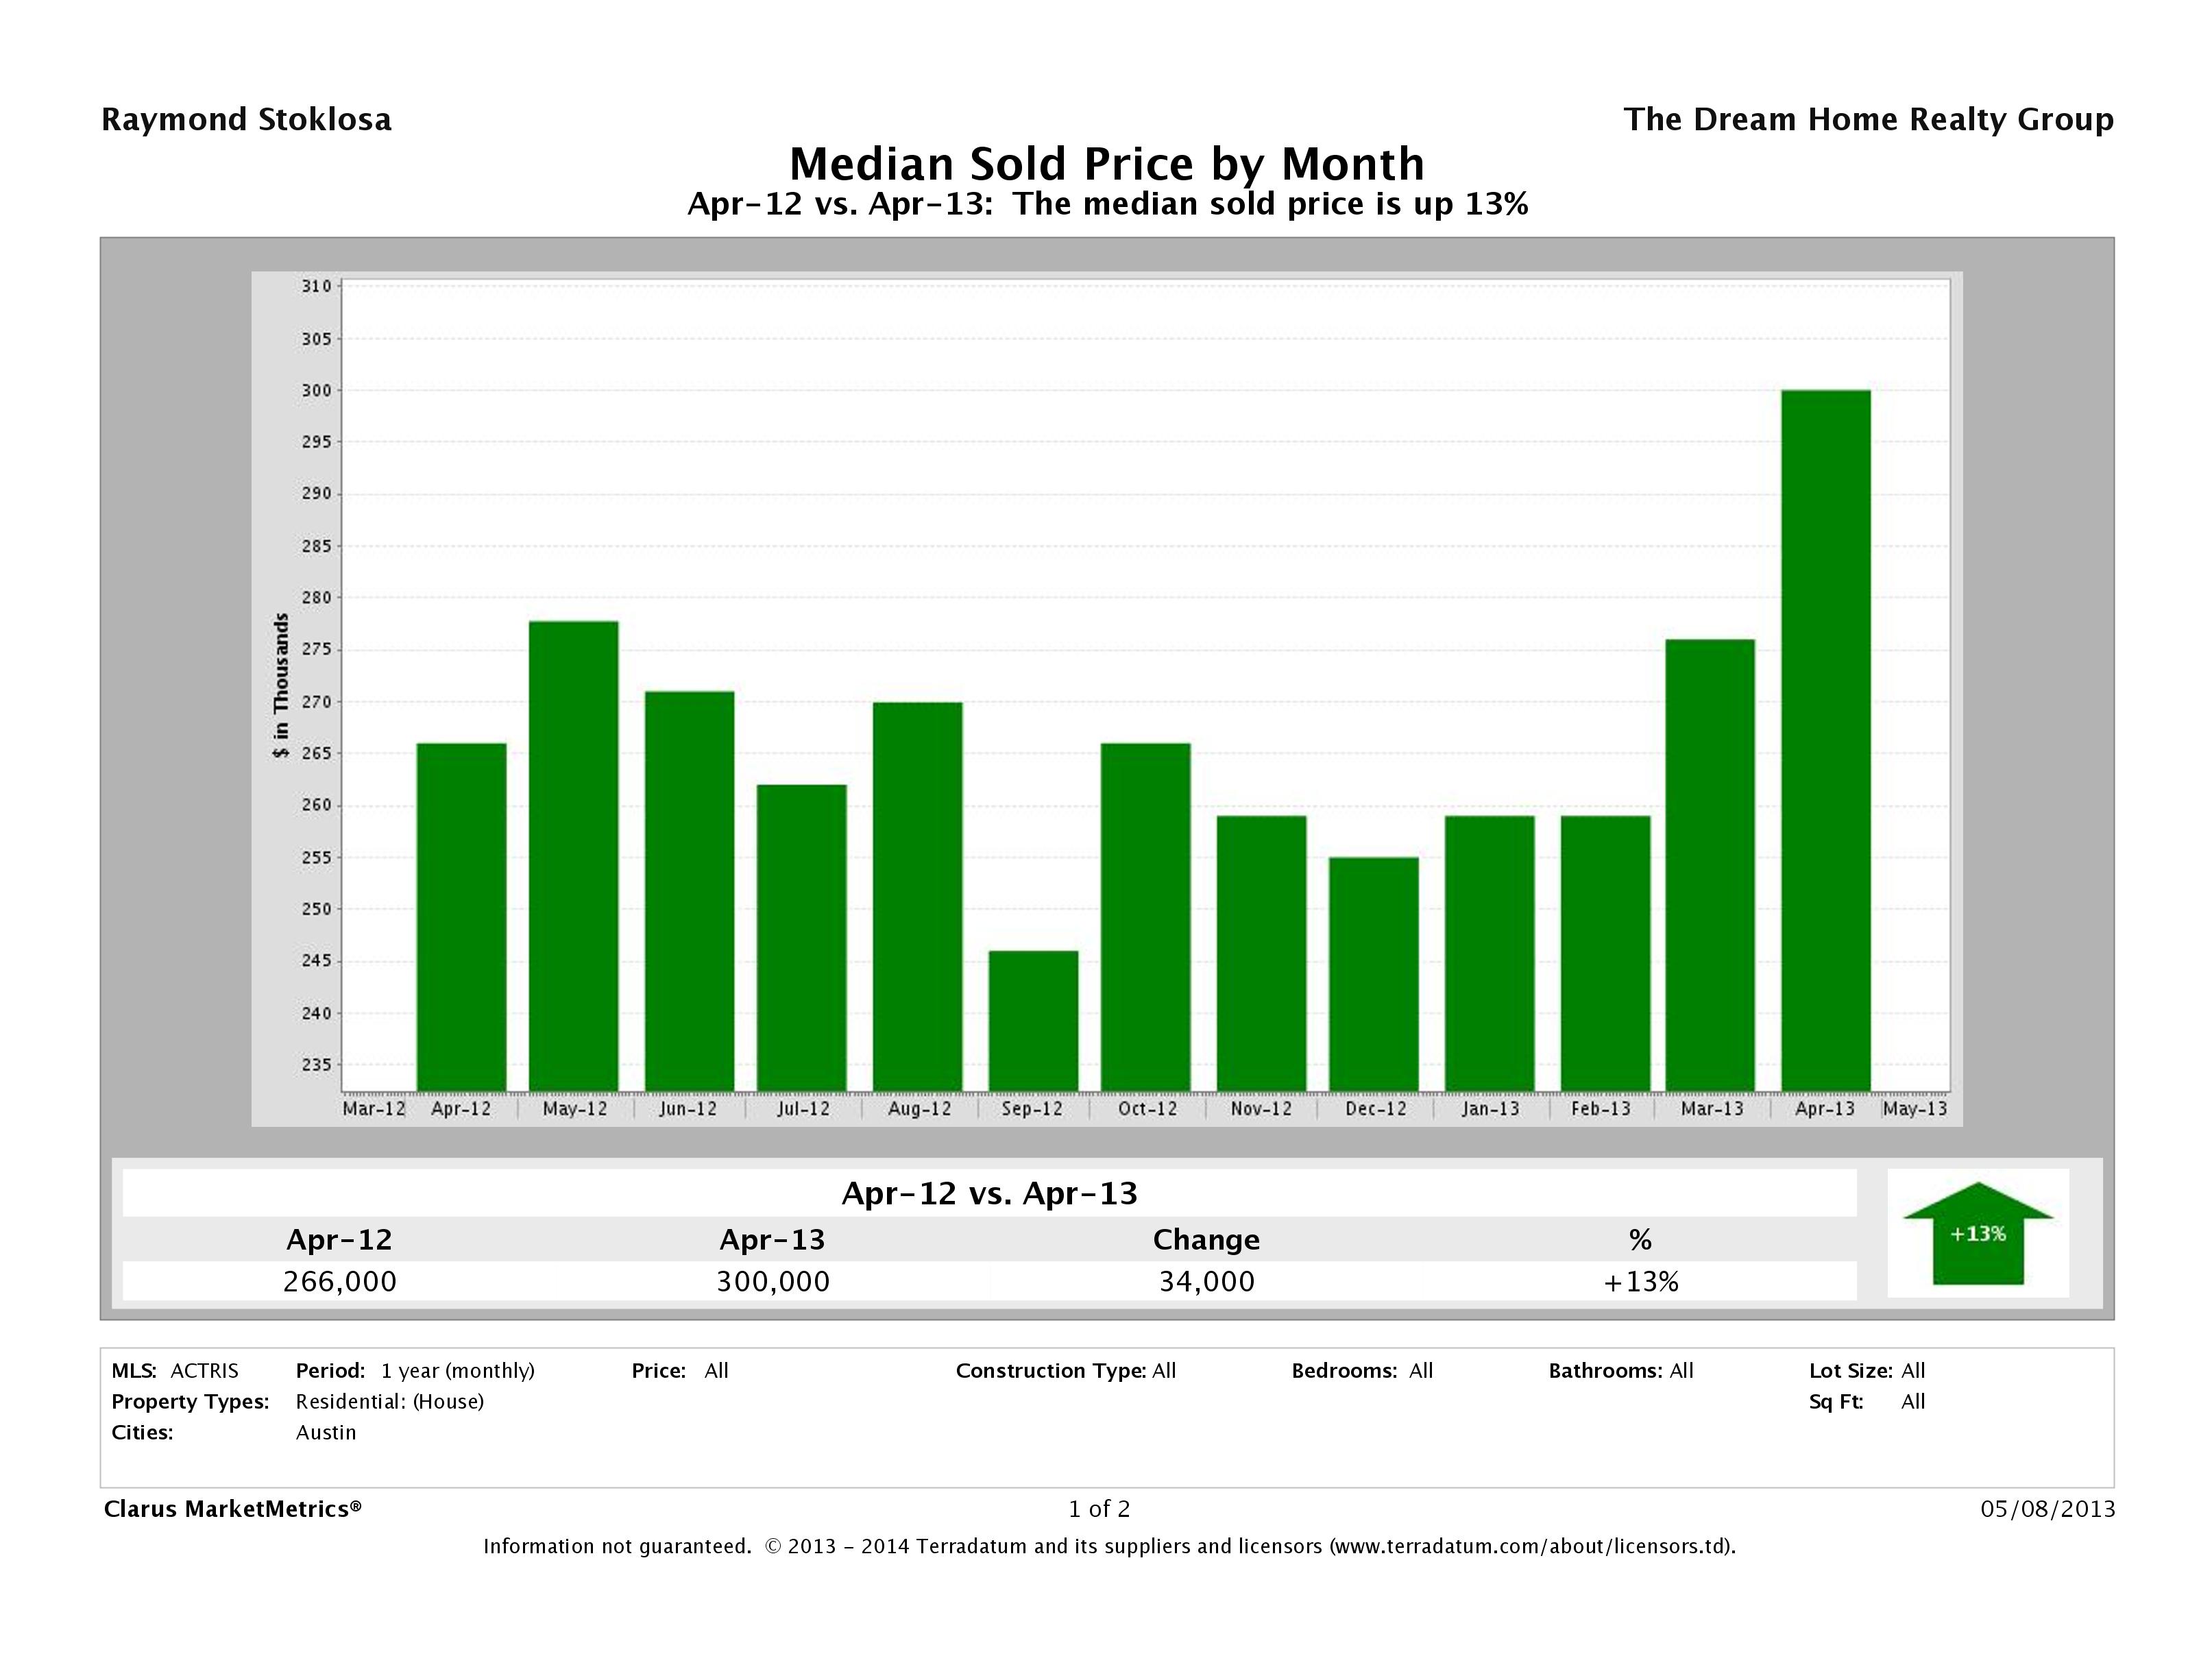
Austin Median Home Price Up 13%
This month, we saw a 13% increase in the median home sale price of a home in Austin. In April 2013, the median home price was $300,000 compared to $266,000 in April 2012. Median home price helps us see the distribution of homes being sold and does not really give us an indication of the increase or decrease in a particular home’s market value. To analyze market value, we’d have to take an in depth look at a neighborhood. If you’re looking for something like that, please email us at info@AustinRealEstateHomesBlog.com.
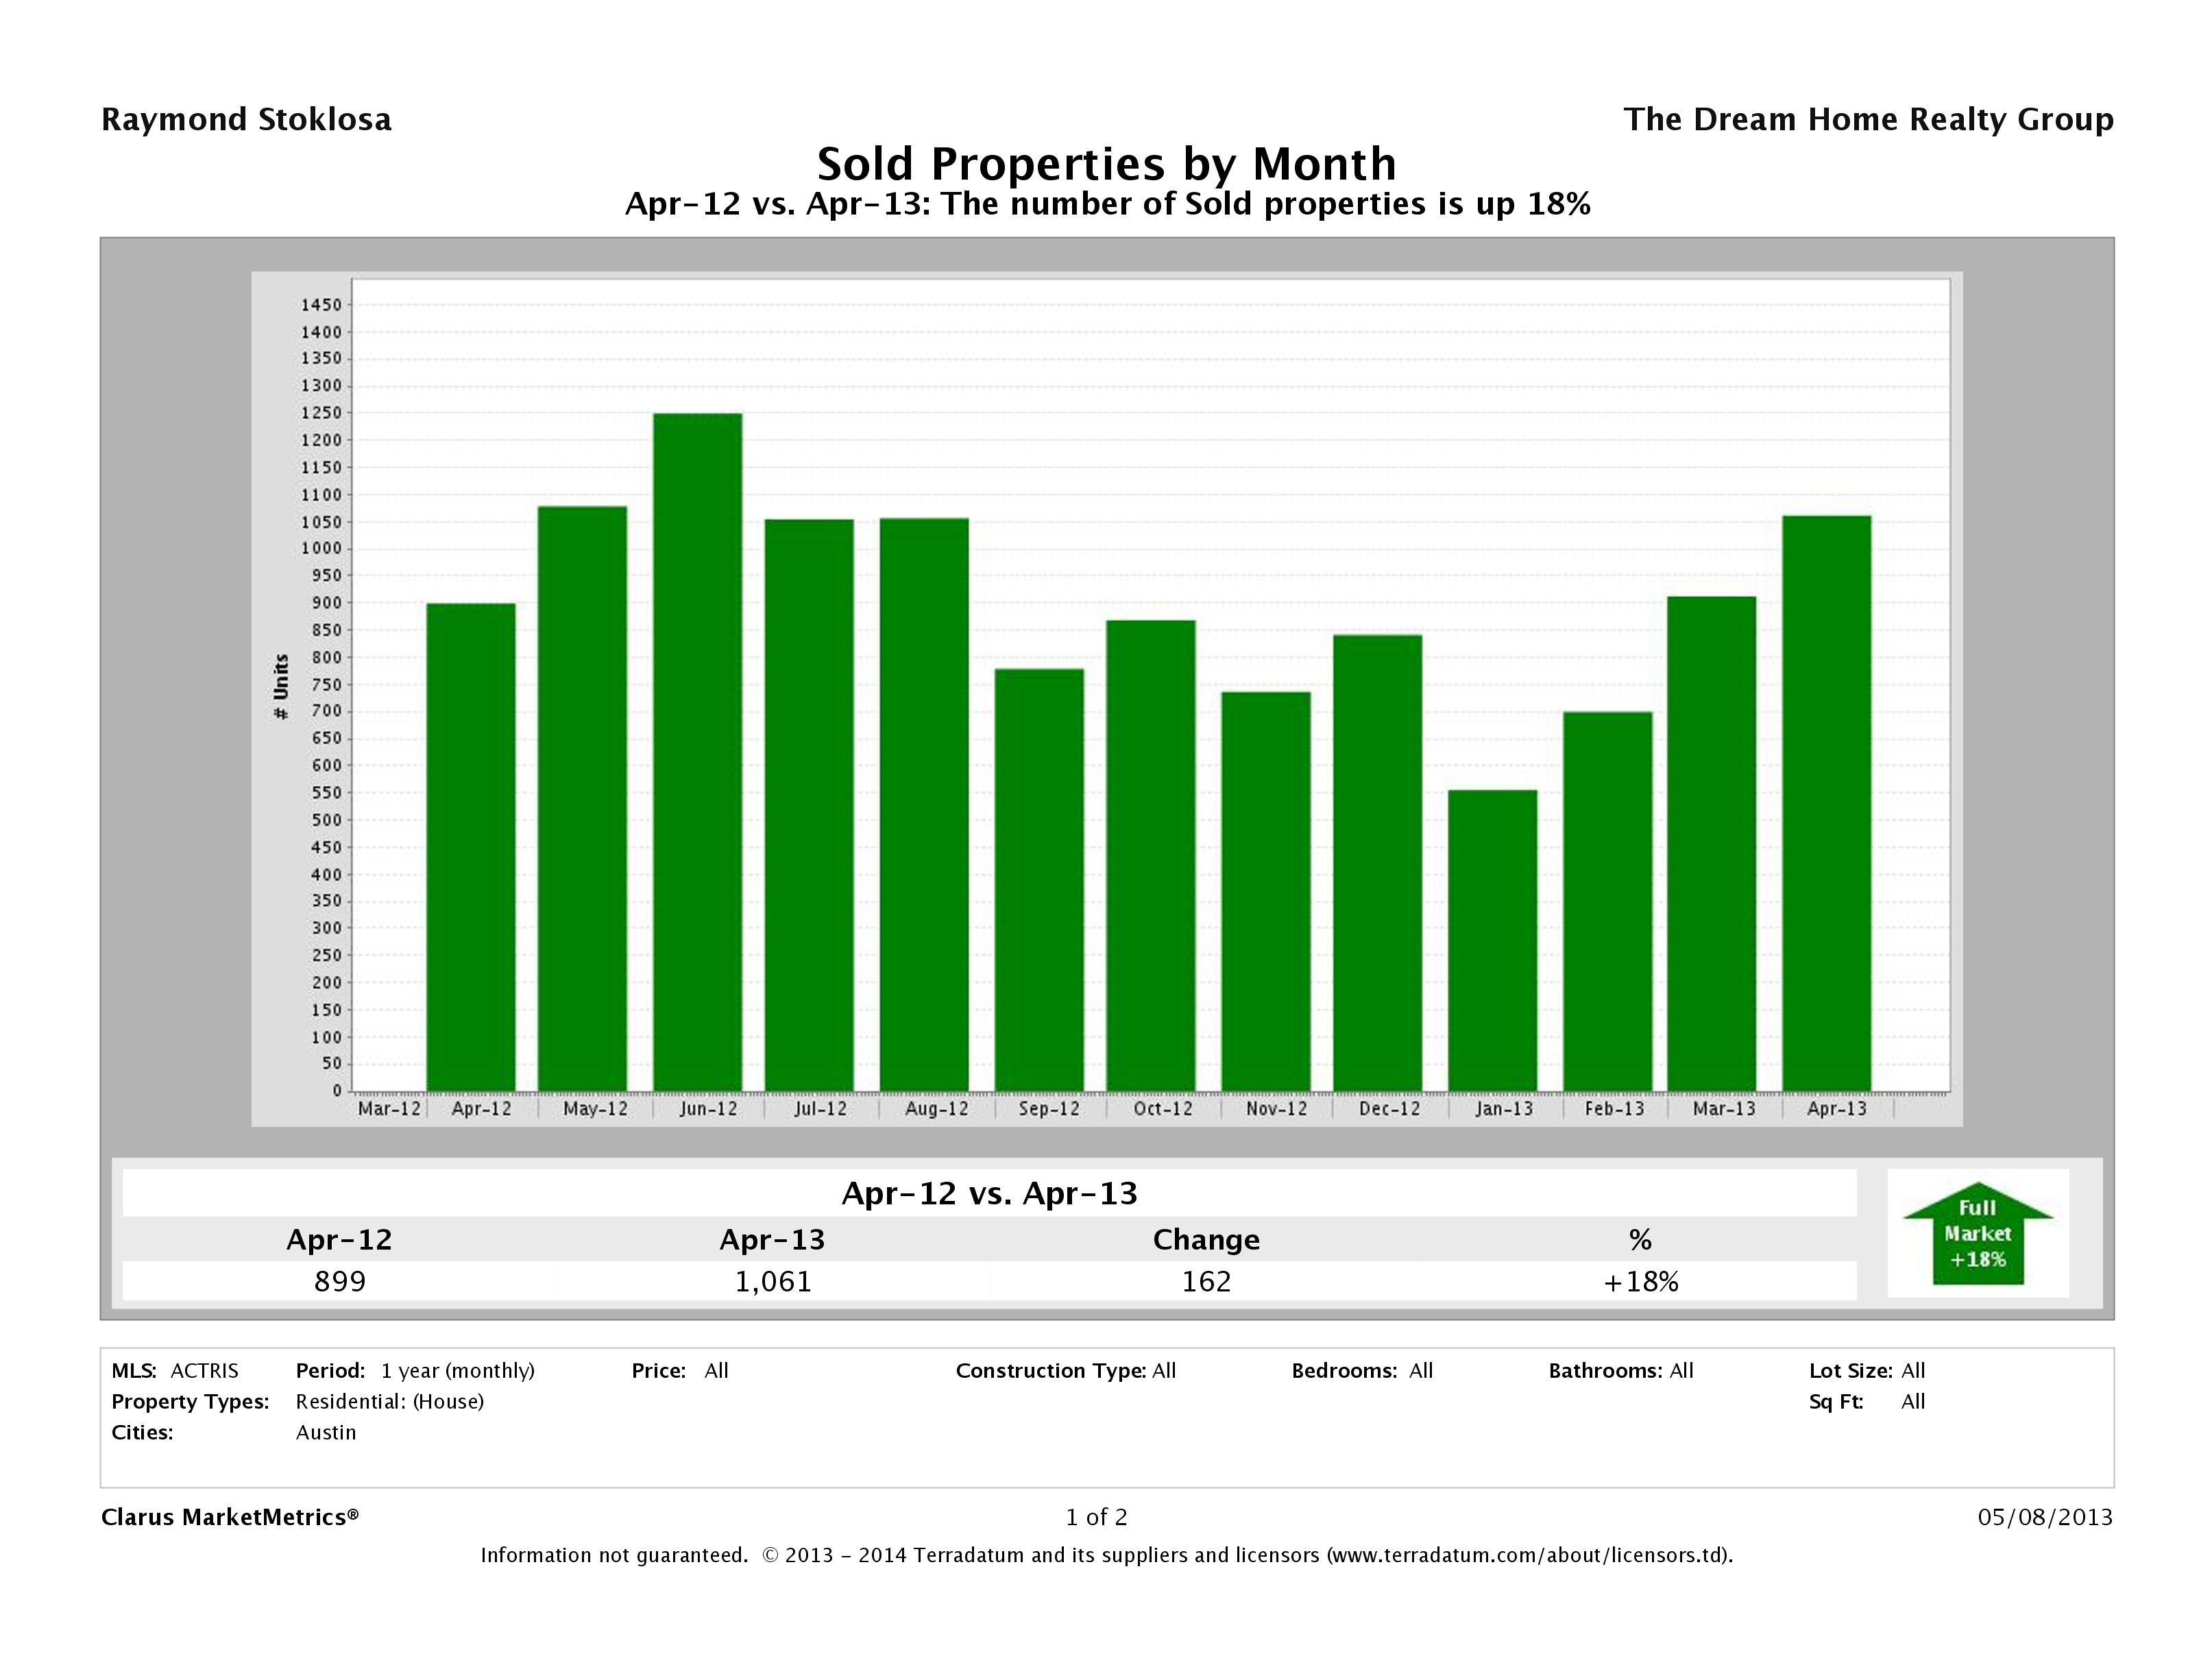
Number of Sold Homes in Austin Up 18%
In April 2013, Austin saw a 15% increase in the number of homes sold from April 2012 to April 2013 numbers. In April 2013, we saw 1,061 homes sell in Austin compared to 899 in April 2012. Last Spring showed strong numbers, but this Spring continues to outpace last year’s market in record numbers.
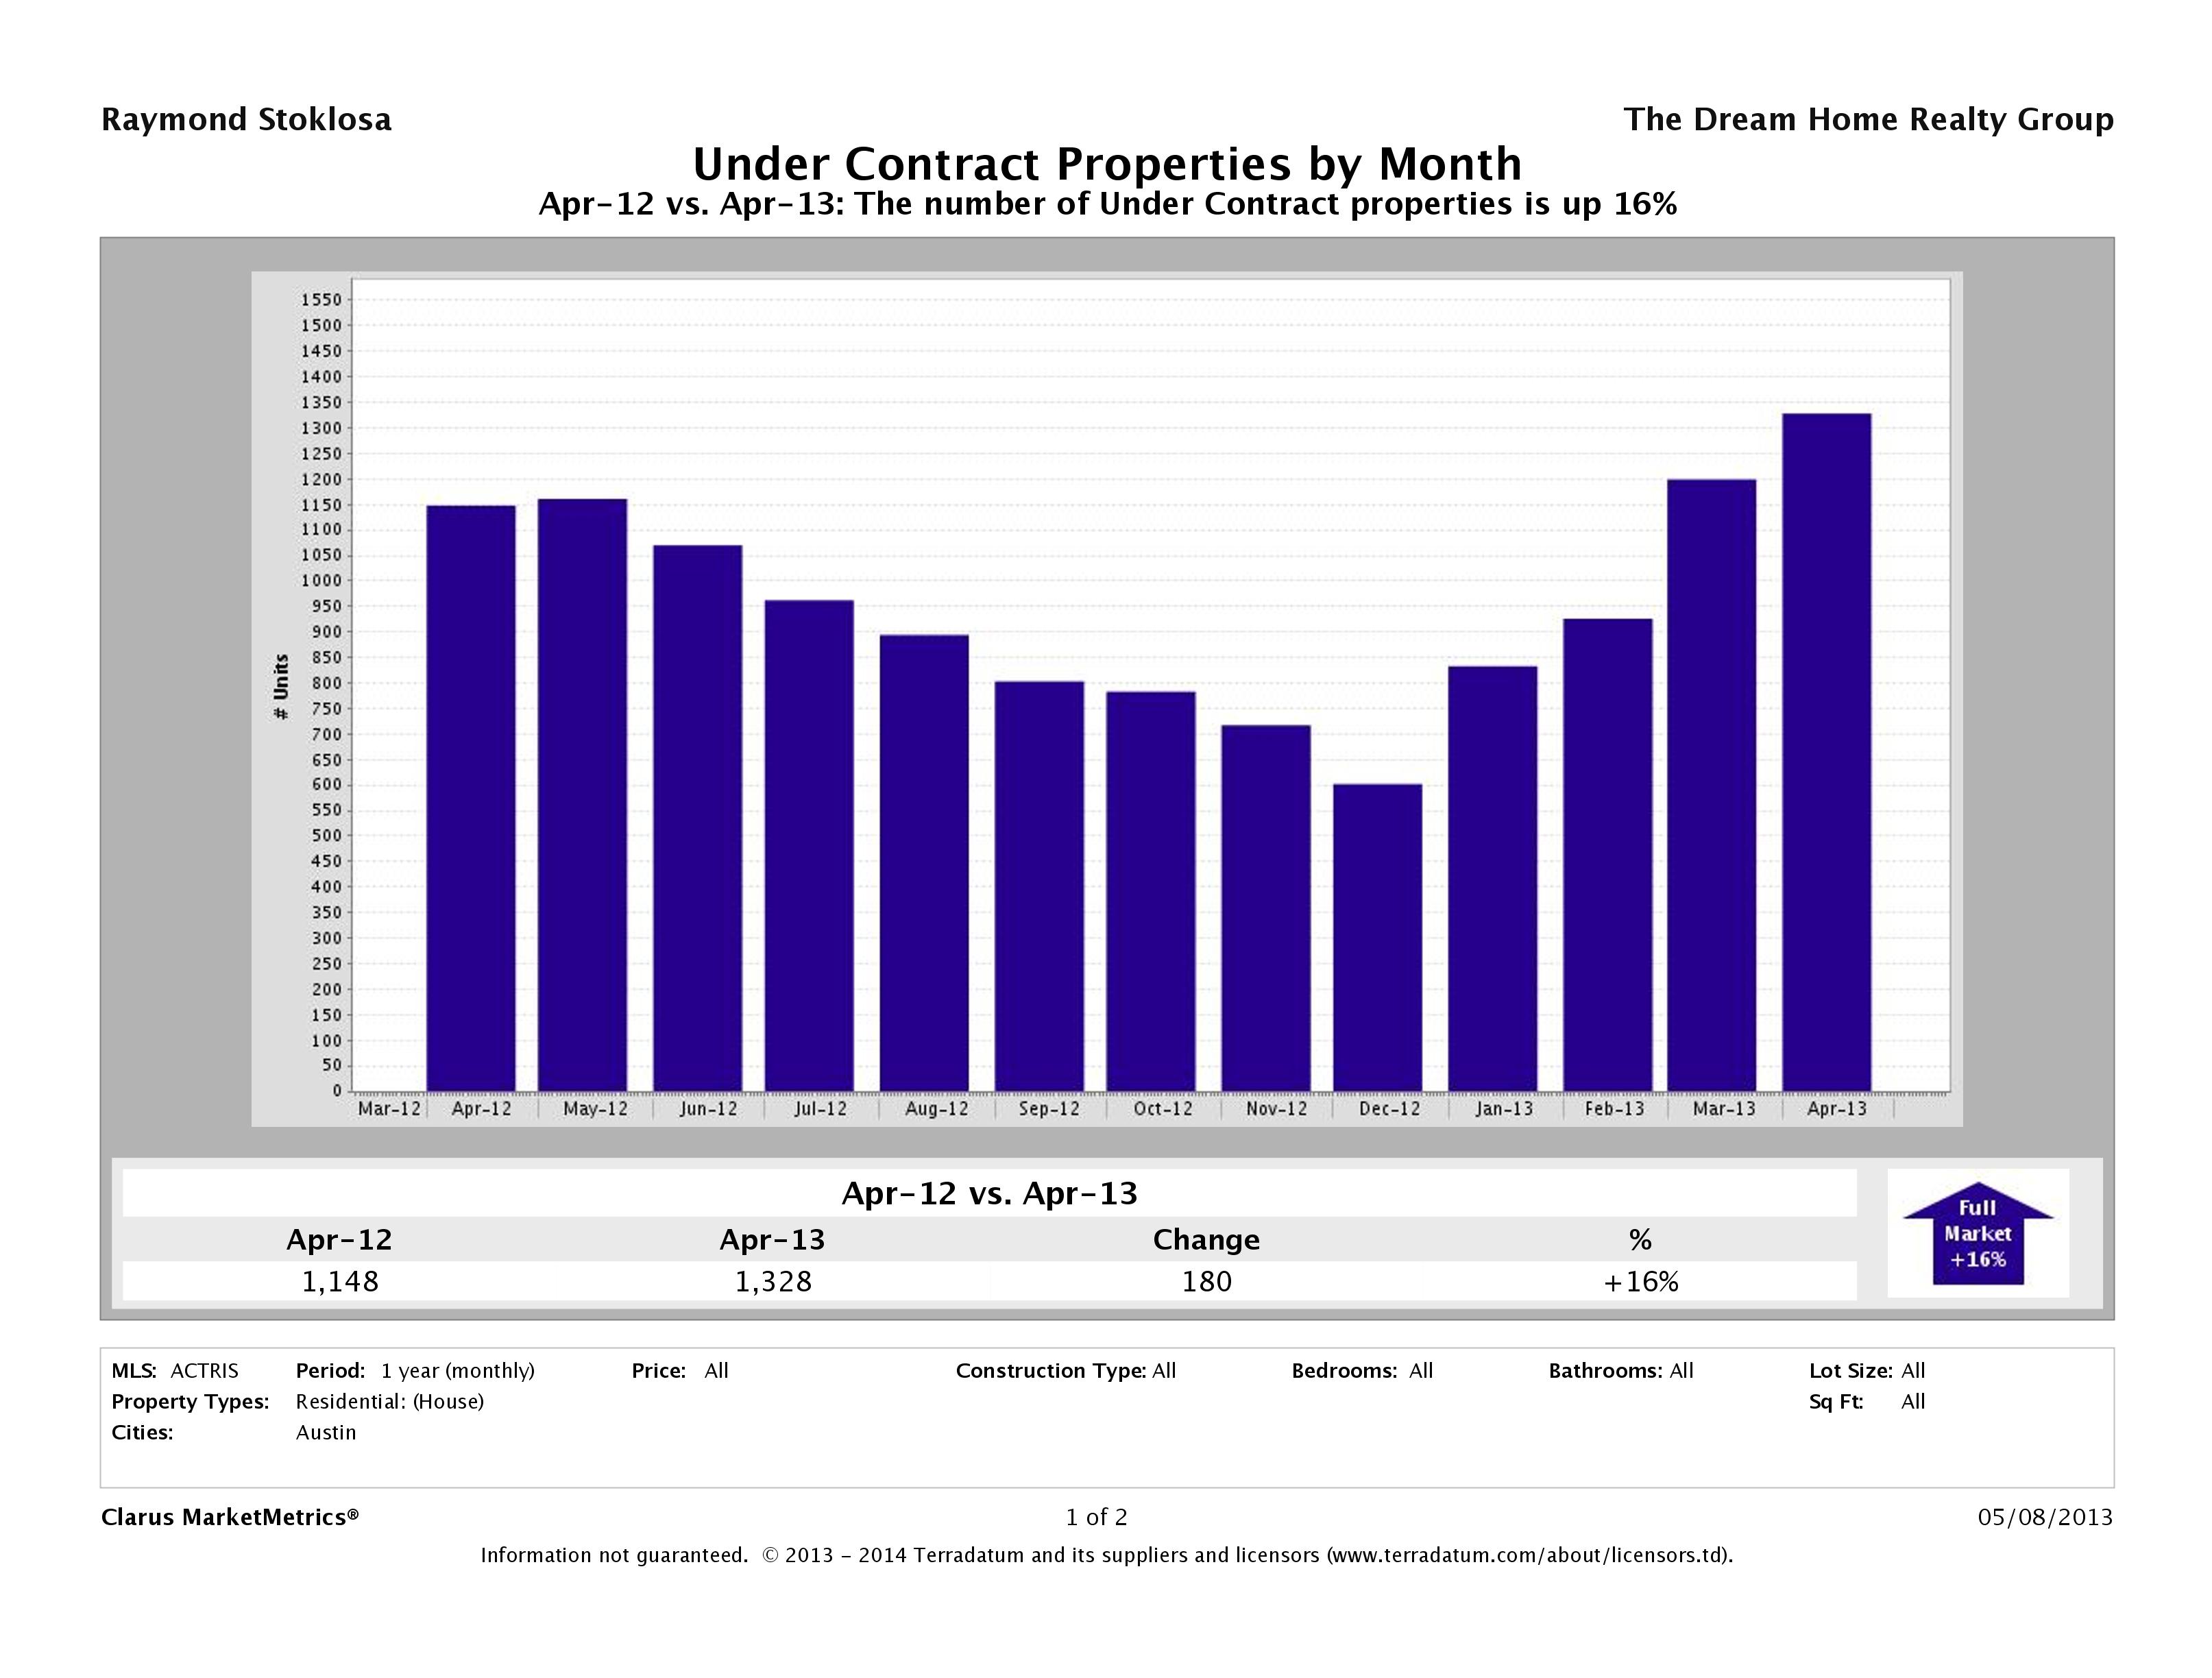
31% More Austin Homes Under Contract
In April 2013, there were 1,328 homes that went pending compared to 1,148 in April 2012 marking a 16% increase. We’ve started out strong in 2013 with the number of homes selling going up steadily each month. Based upon what we’re seeing out there in the market, it looks like May 2013 numbers will also increase.
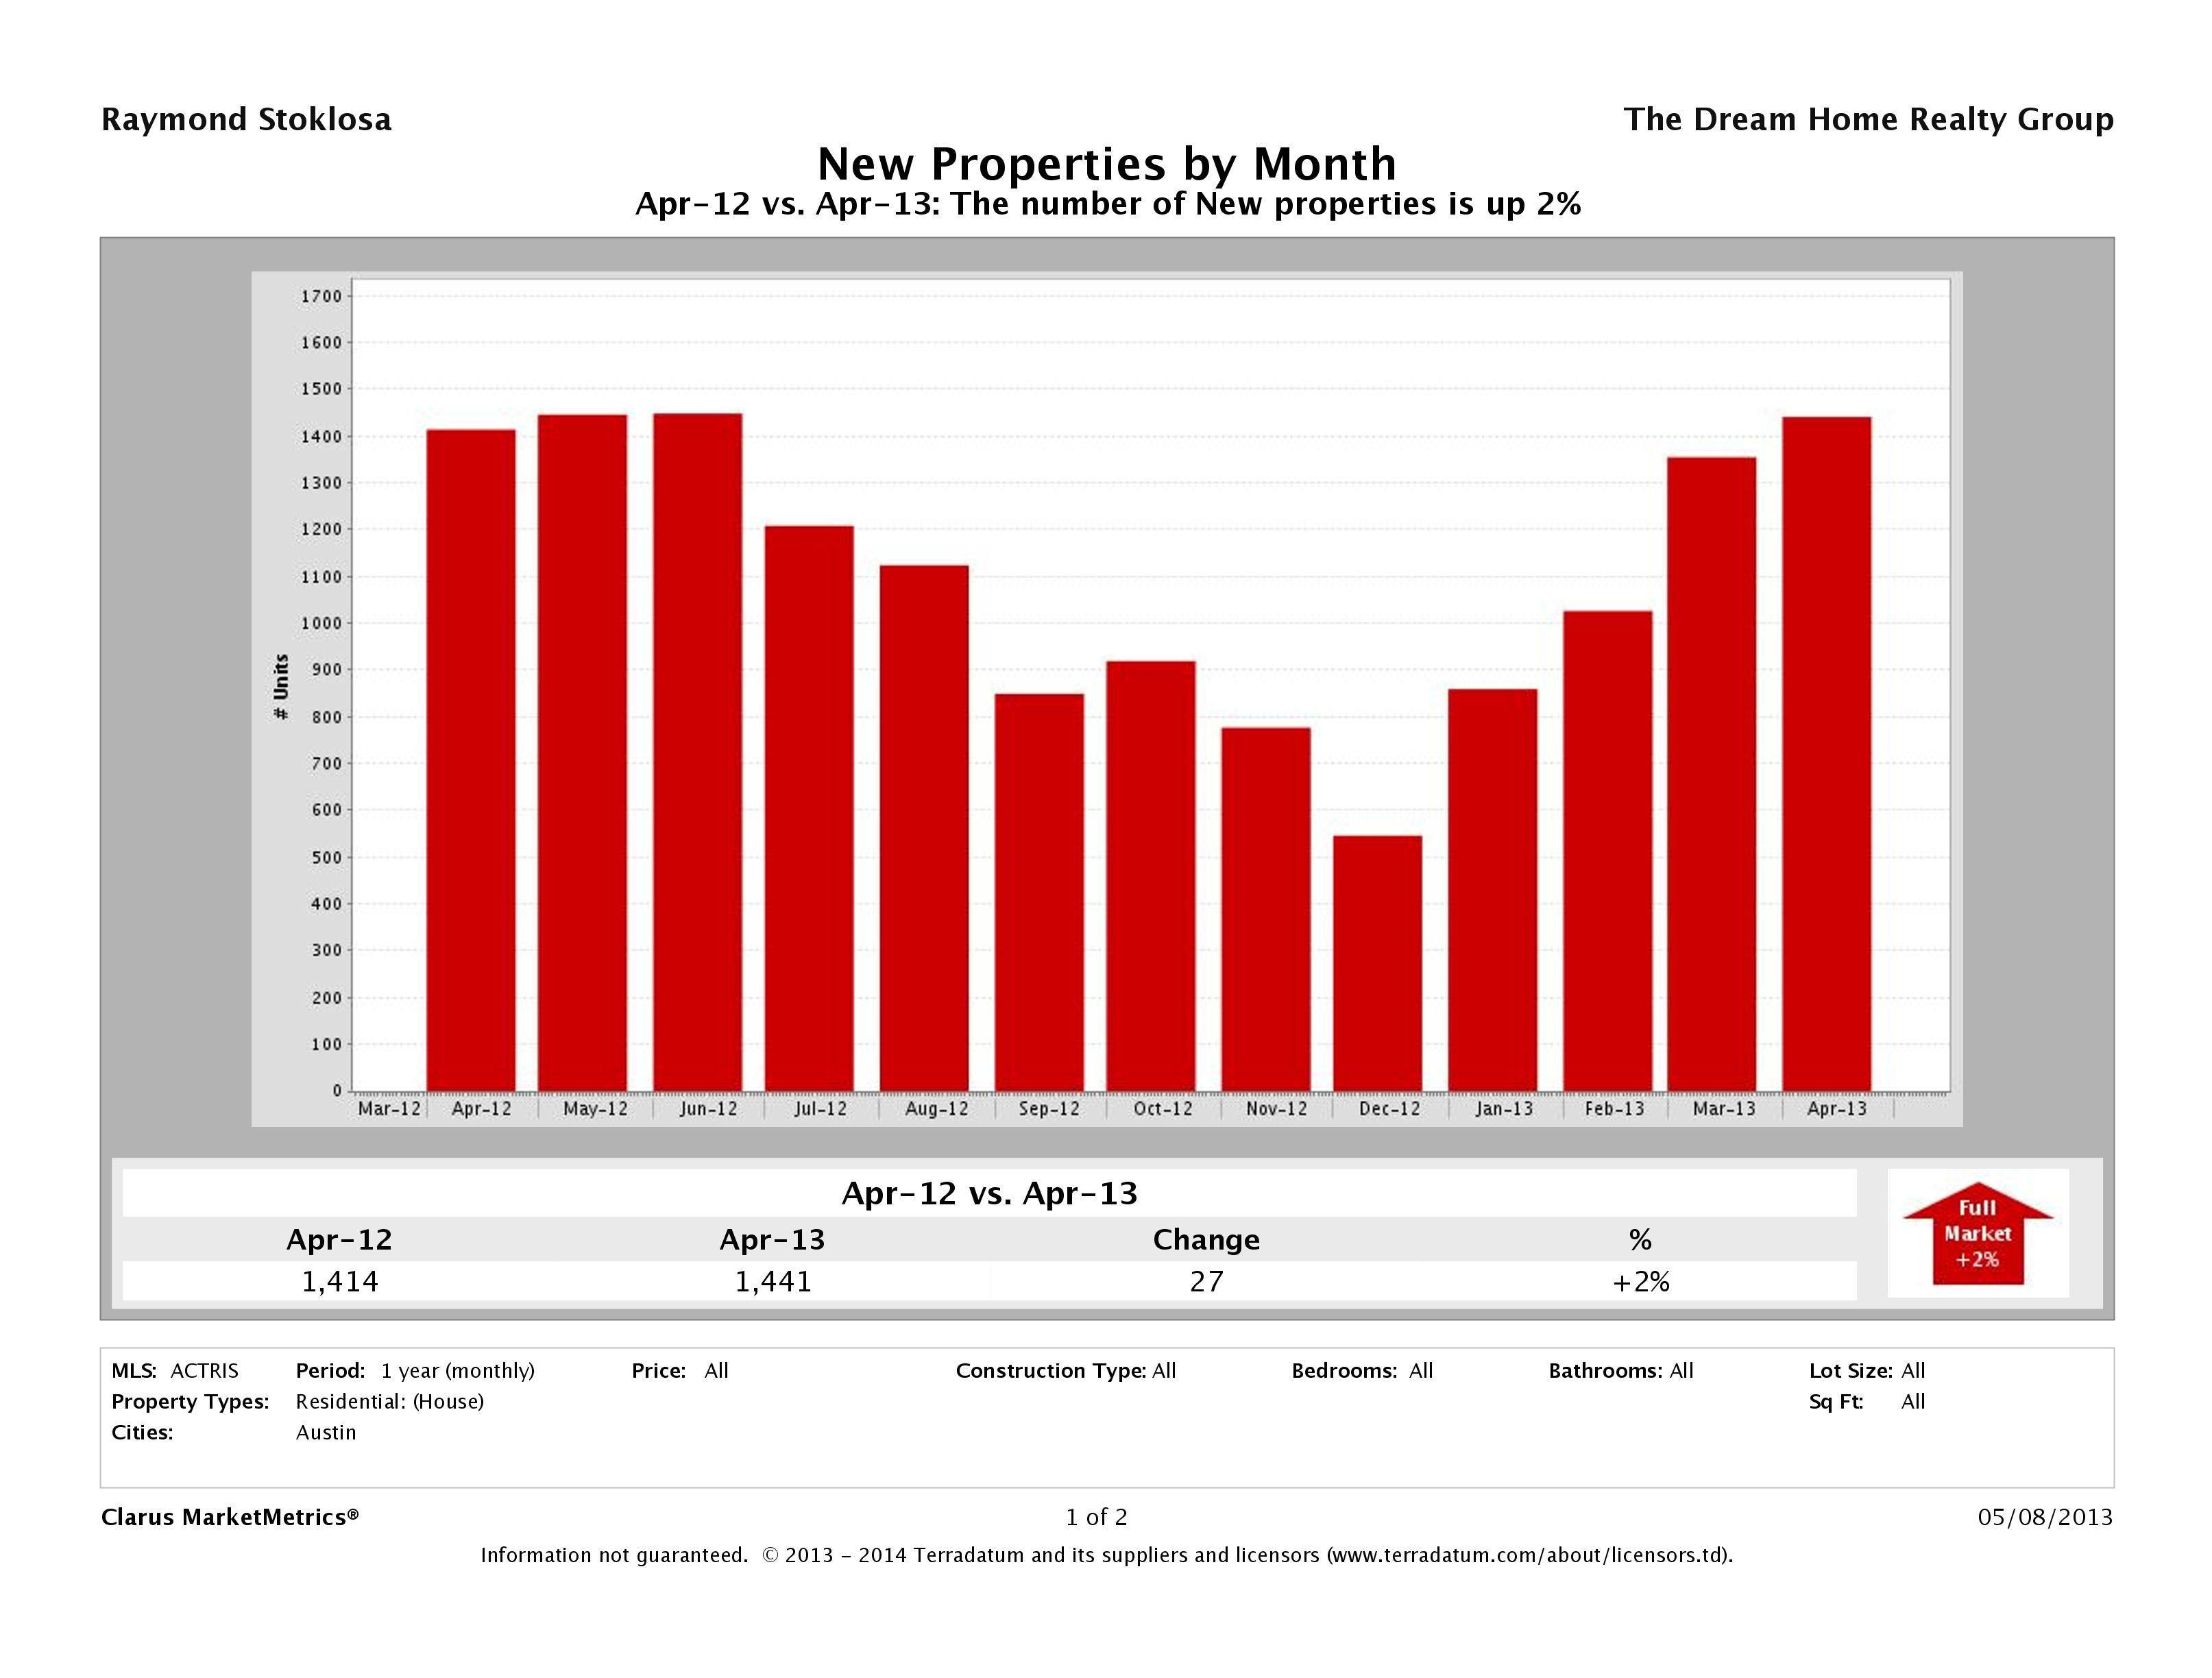
Number of Homes Listed for Sale Up 2%
In April 2013, we saw a 2% increase in the number of homes being introduced to the market than in April 2012. In April 2013, there were 1,441 homes listed for sale in Austin compared to 1,414 in April 2012. This is another indicator of just how many buyers are out there. With only a slight increase in the number of homes that are being listed for sale, we saw a remarkable increase in the number of homes sold meaning even the less desirable homes are selling. If you need to sell, strike while the iron is hot. Buyers are competitive and are out in full force. Take advantage of market conditions to get the highest possible price for your home.
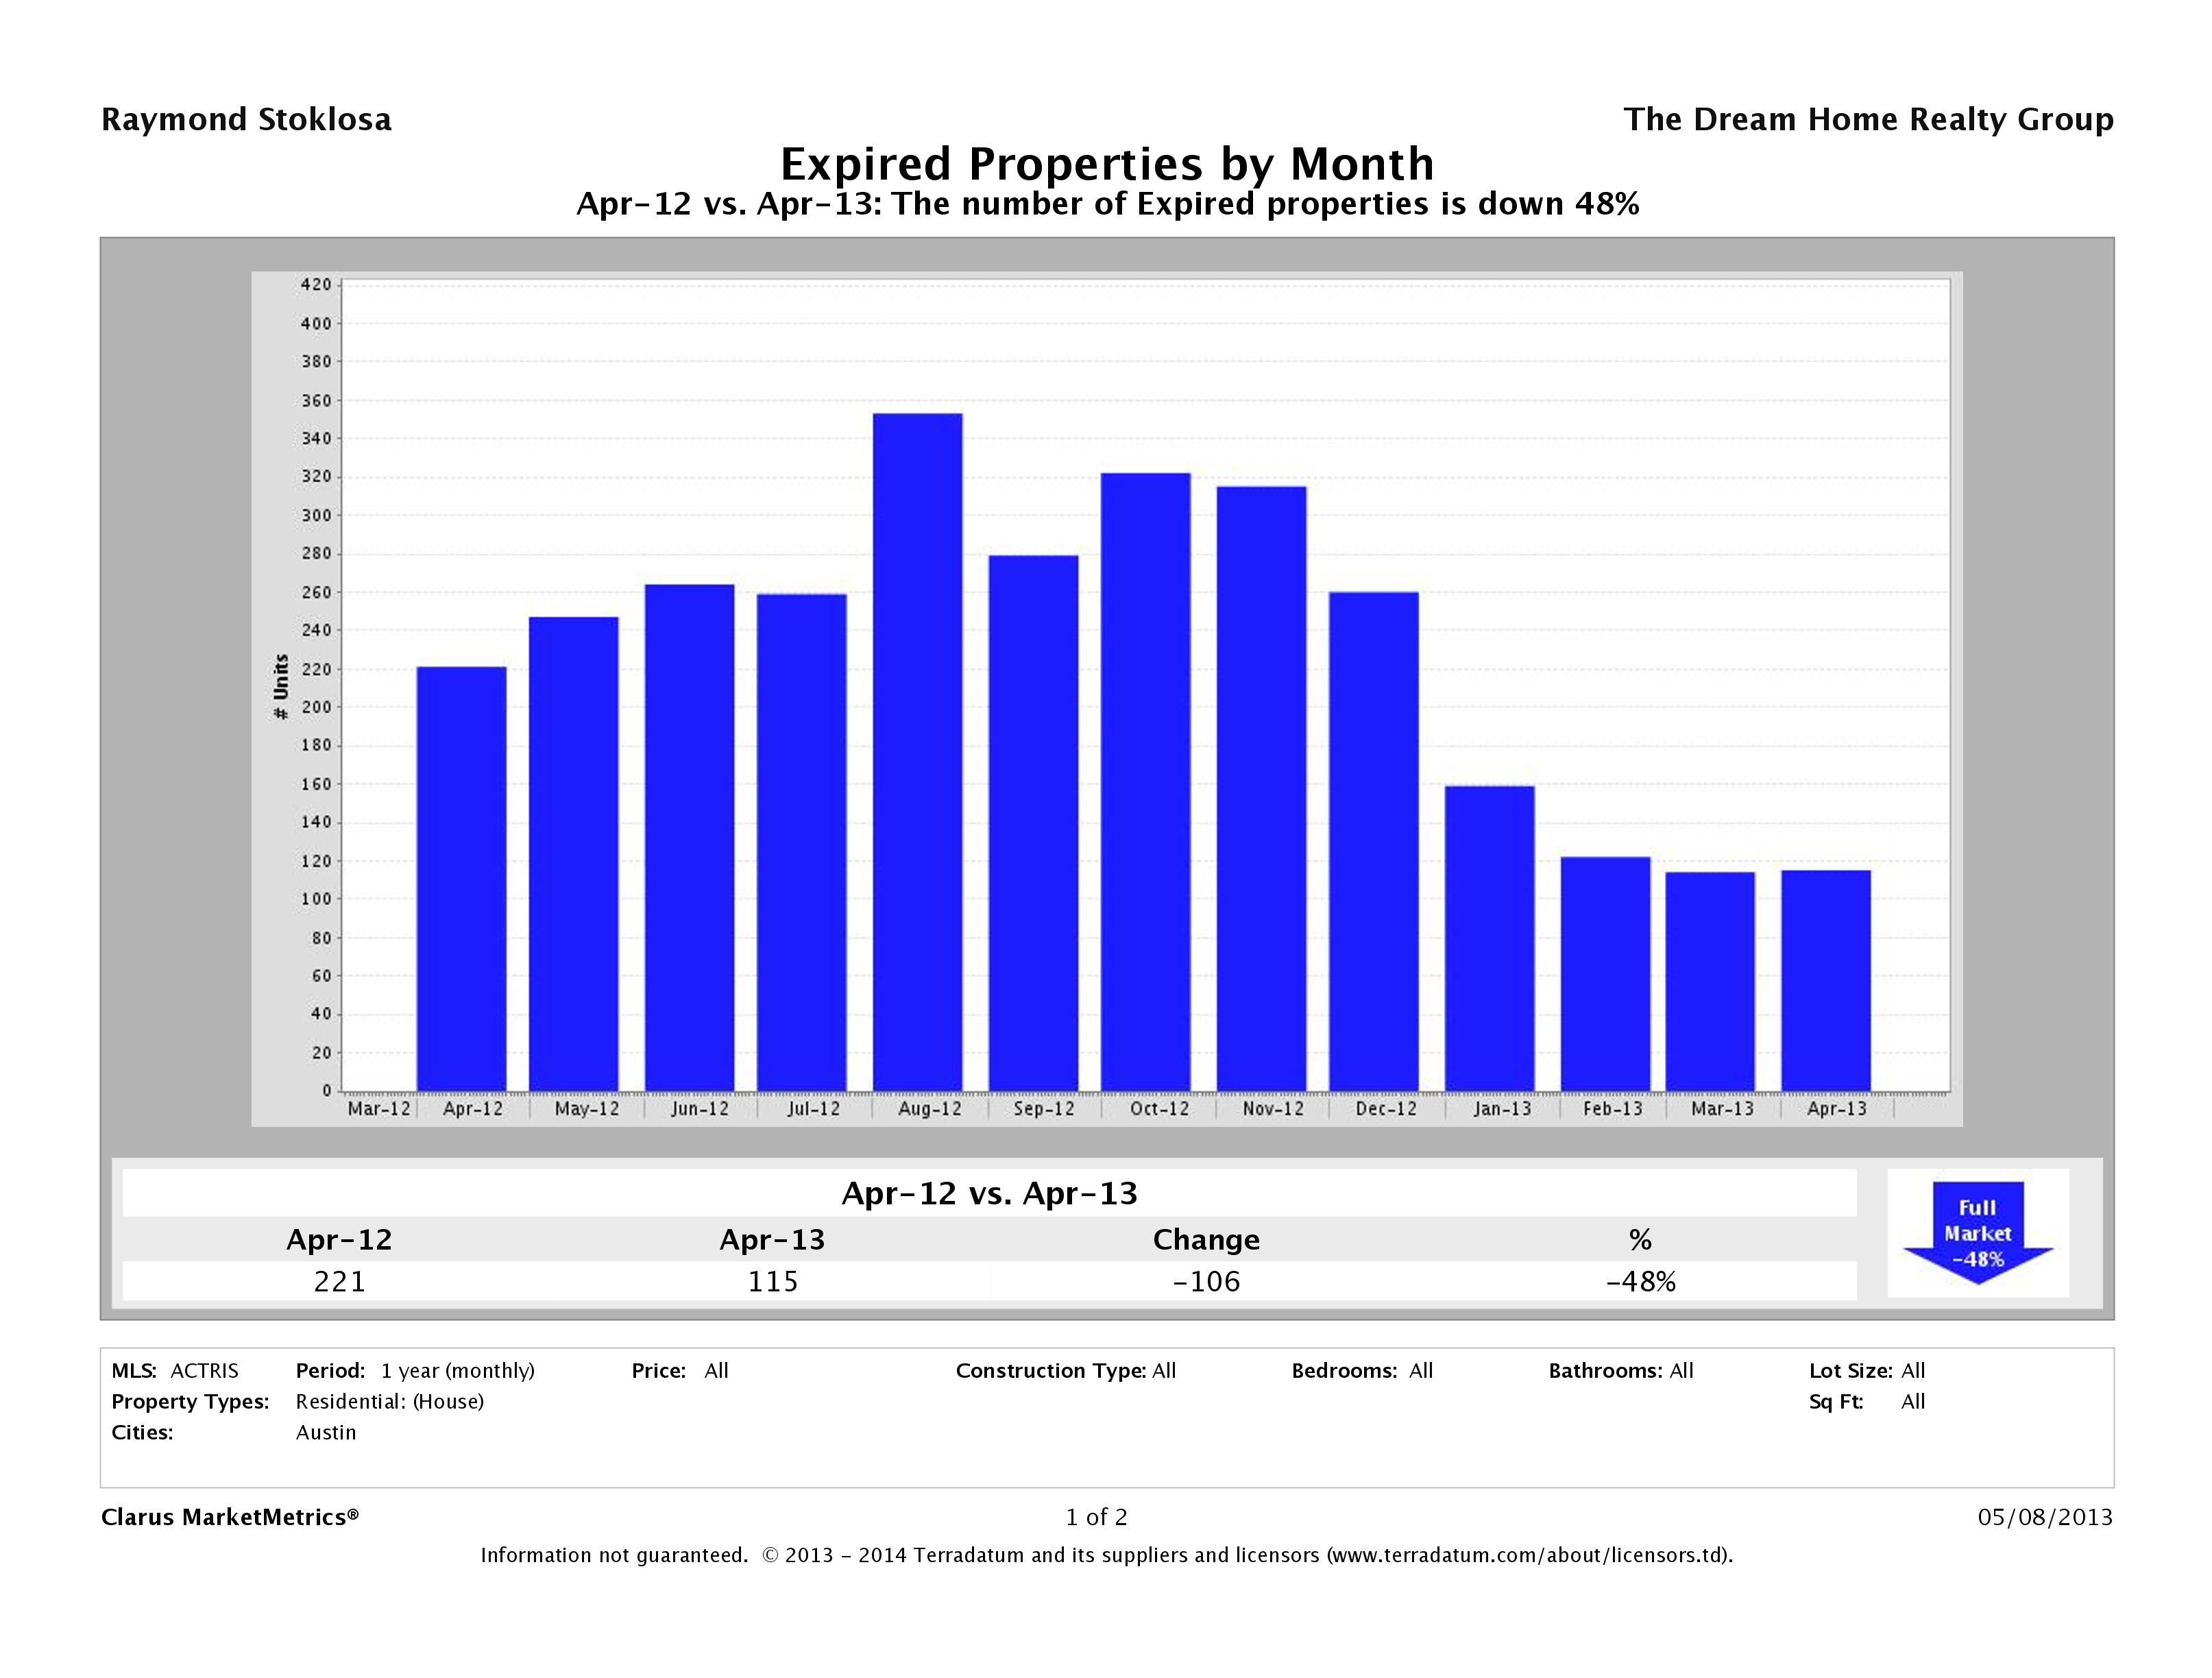
Number of Homes Taken Off the Market Down 48%
With such low inventory levels, homes that might not necessarily have been sold in a normal market are selling causing a significant 48% decrease in the number of homes that were taken off the market in year over year numbers. In April 2012, 221 homes were taken off the market and in April 2013, 115 were taken off the market. Sellers seem more realistic in their pricing and buyers seem more willing to shell out the cash needed to get into the homes they want. If demand continues to stay strong, I would expect the number of homes taken off the market to continue to decrease compared to last year’s figures.
Did your home expire? Check out our Austin Home Not Selling resources page to find out why.
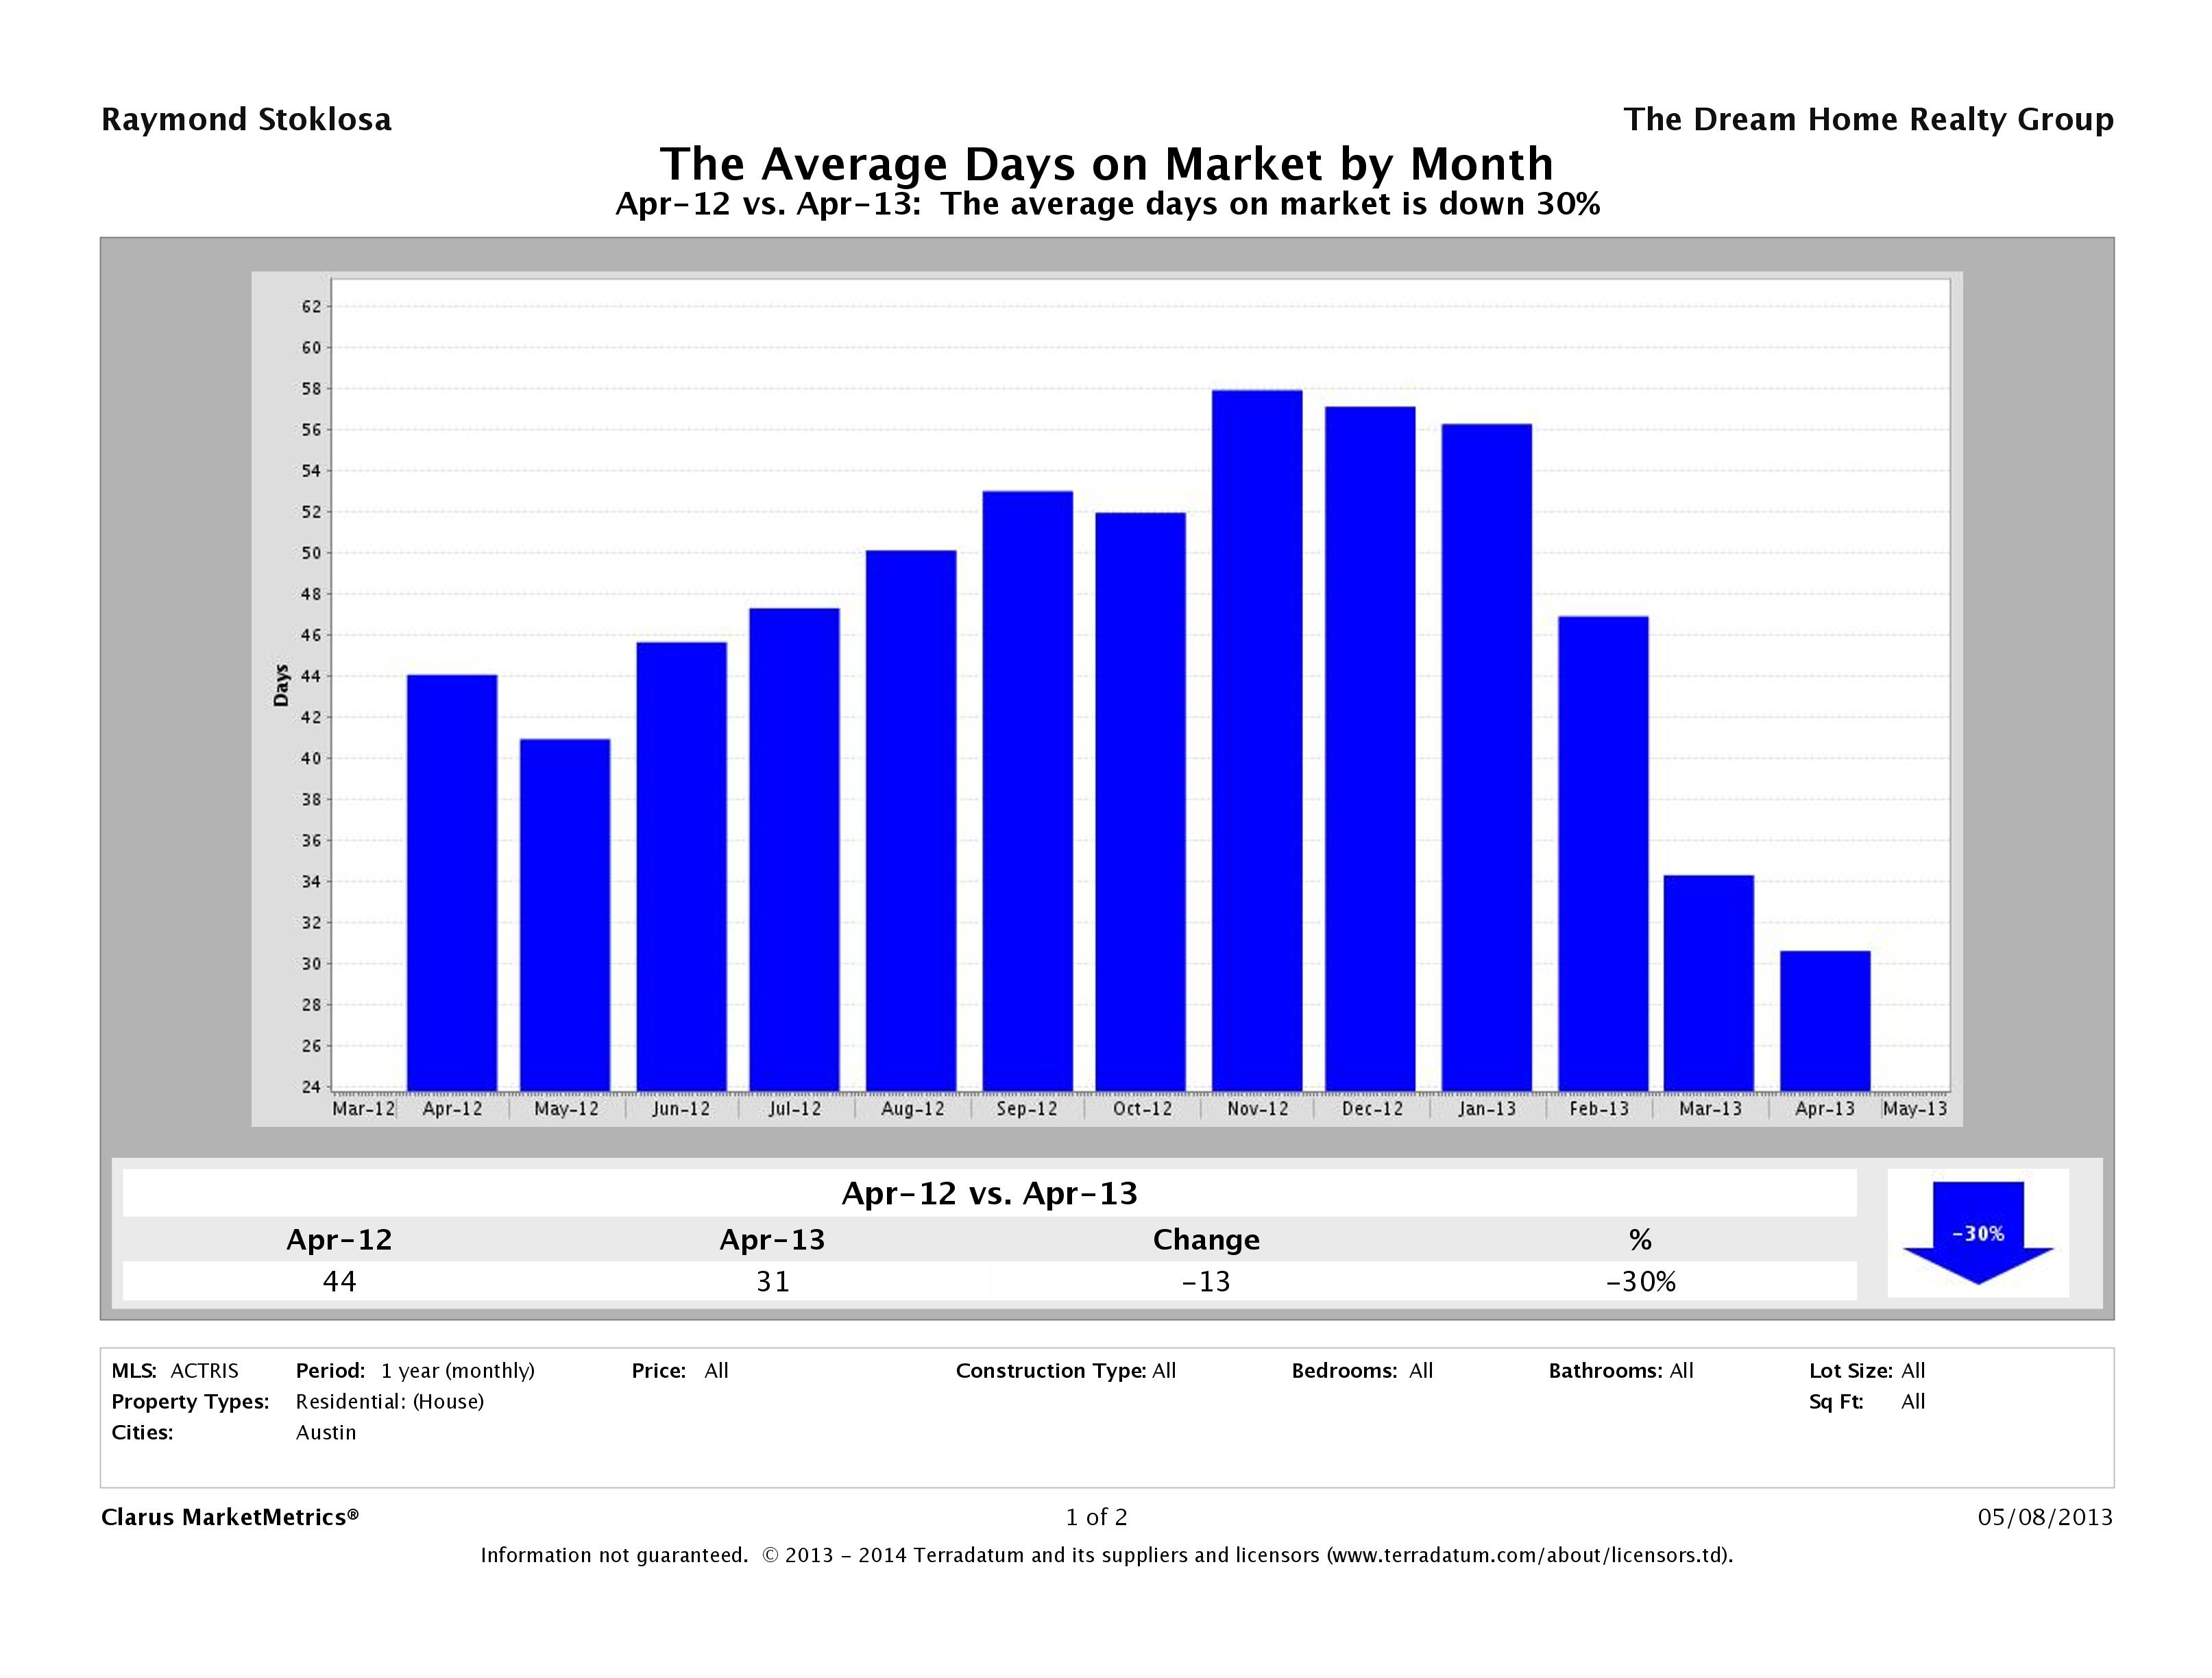
Time to Sell Home in Austin Down 30%
In April 2012, it took, on average, 44 days to sell a home in Austin while in April 2013, it is taking around 31 days. A normal market is considered 90 days, so 31 days is incredibly fast. Remember, this figure takes into account all of Austin. In the more desirable neighborhoods, we’re seeing this number go way down – some averaging just a few days and others even just a few hours.
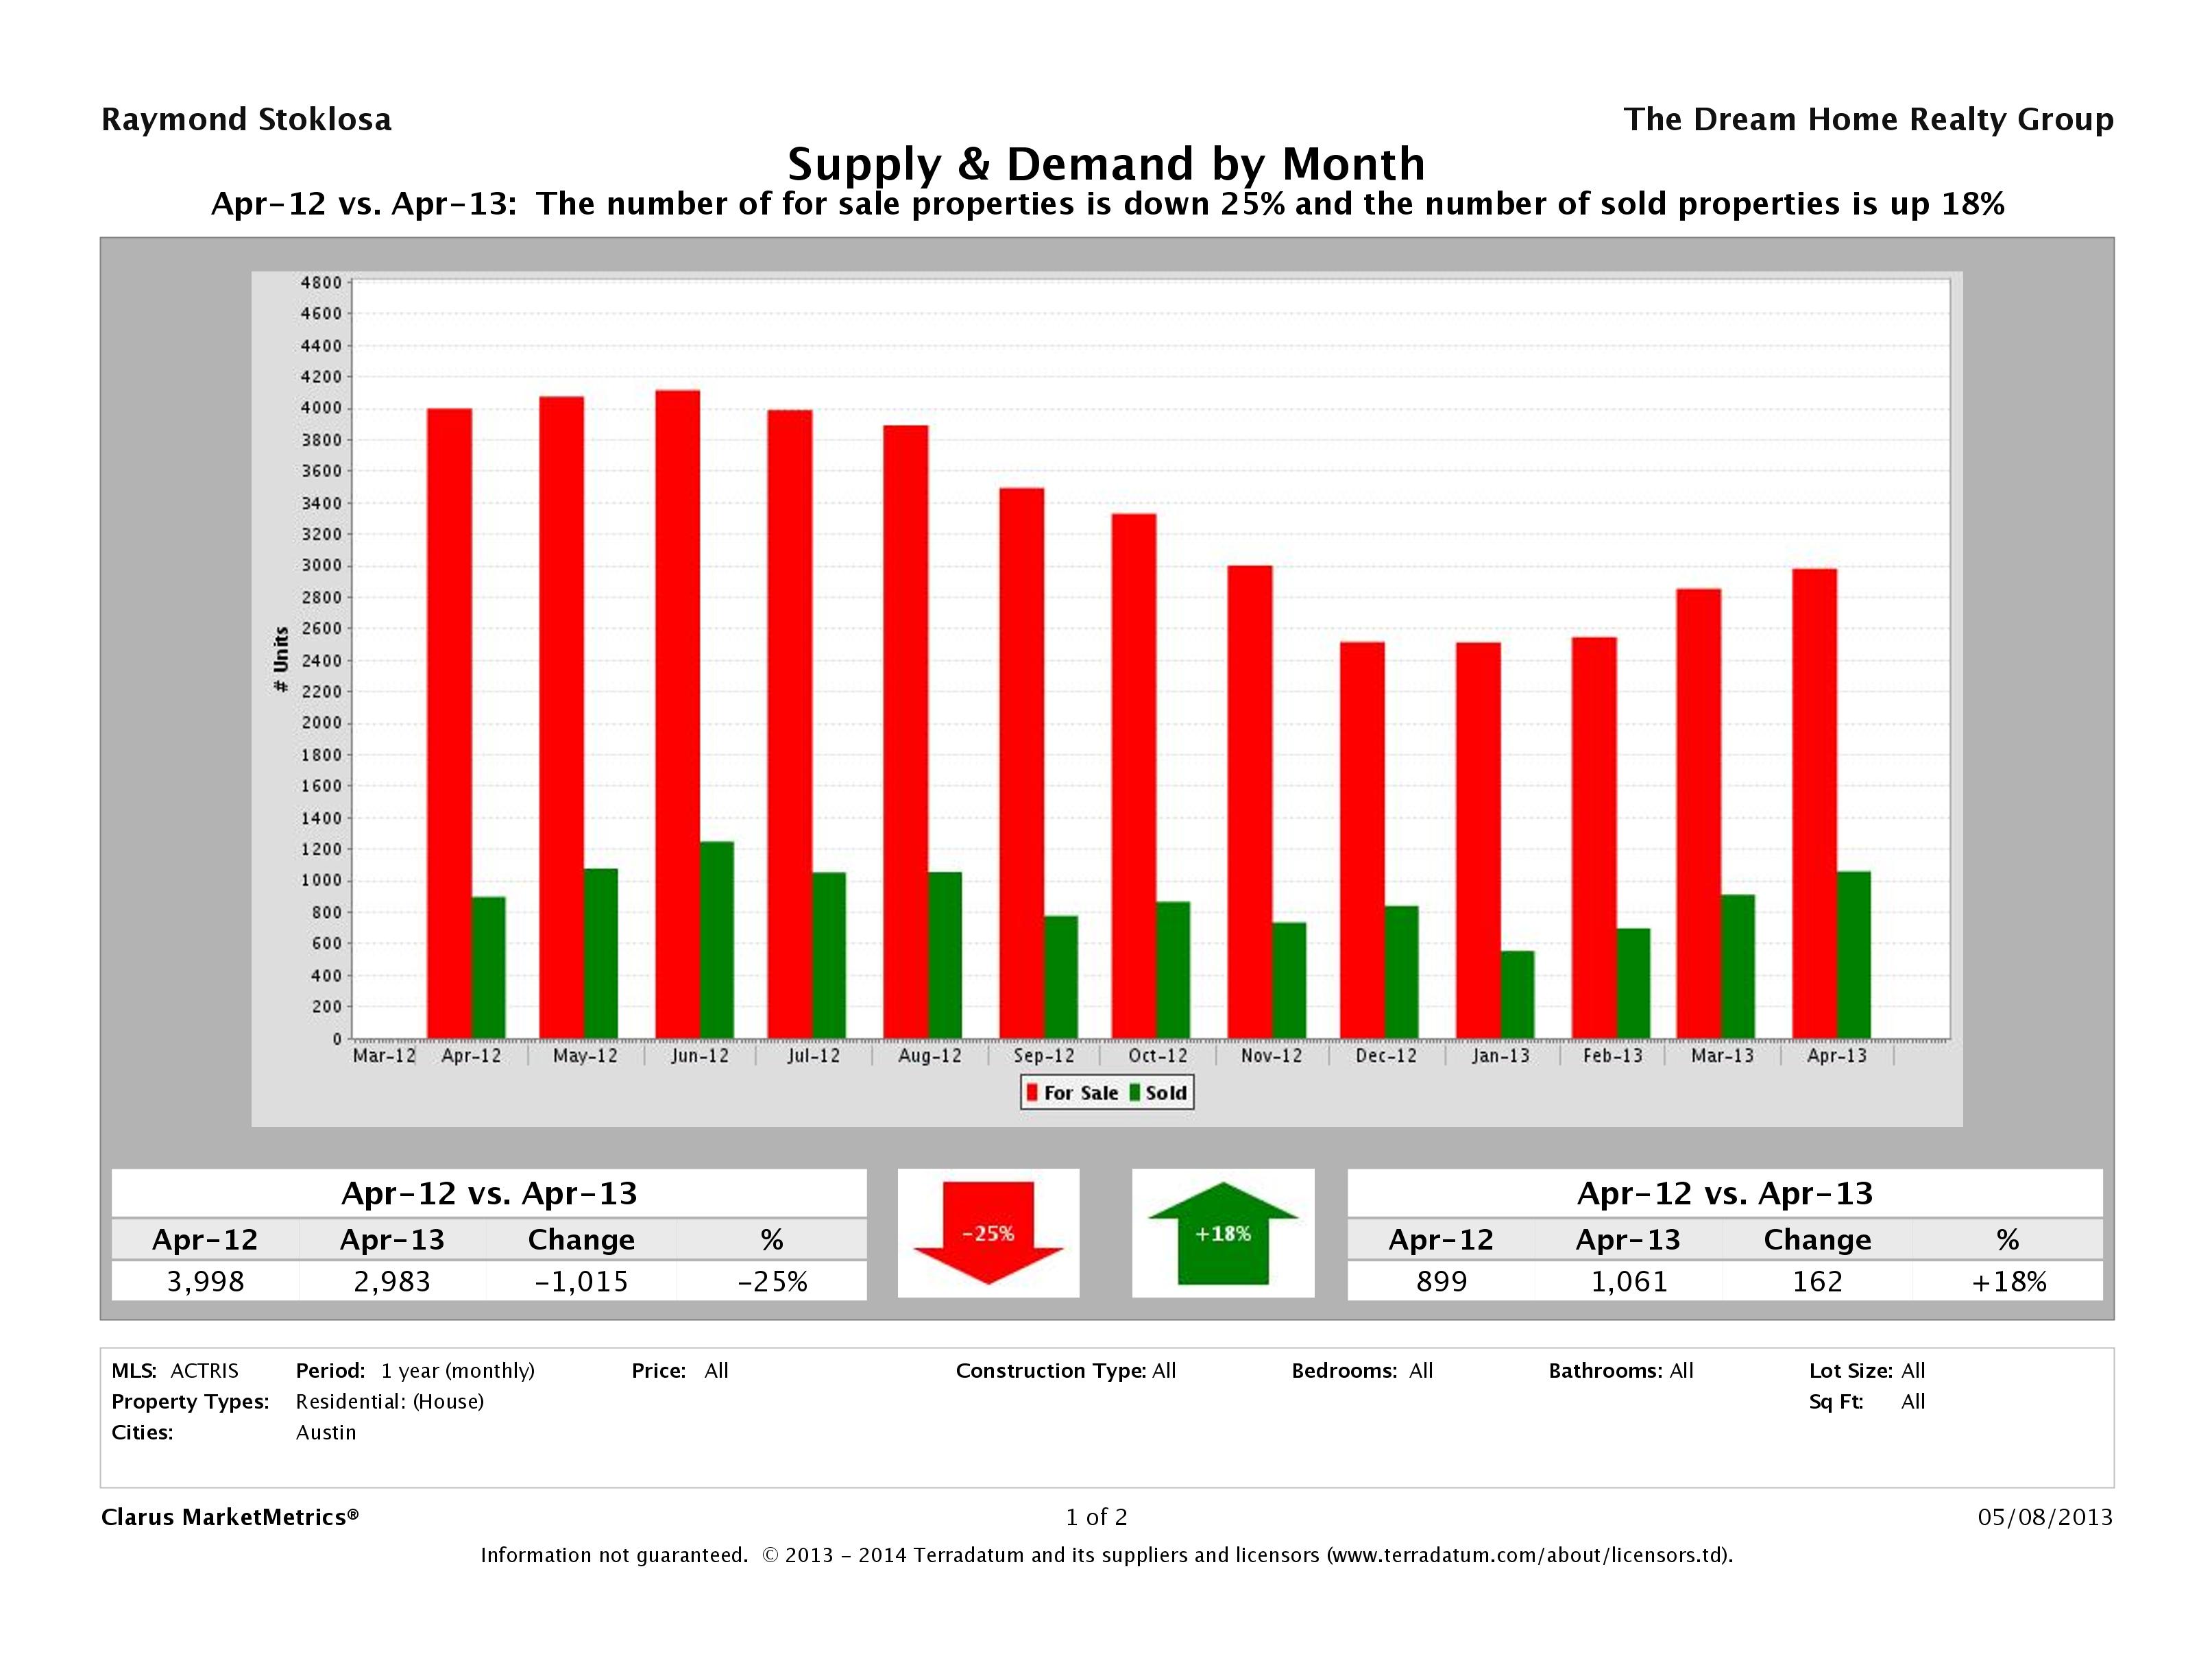
Supply is Down 25% and Demand is Up 18%
This month we’ve seen a 25% decrease in supply (number of properties for sale) and a 18% increase in demand (number of sold properties). Yet another indicator more residents are deciding to stay put while others continue to move to Austin in record numbers.
Median for Sale Up 20% vs Median Sold Price Up 13%
This chart compares the Median for Sale Price vs the Median Sold Price to show their relationship. In Austin, we saw a 20% increase in the median for sale price and a 13% increase in the median sold price of a single family home in year over year numbers. Sellers appear to be more successful at getting buyers to come up to their price, even though they are setting higher list prices, an indication of the strength of the market.
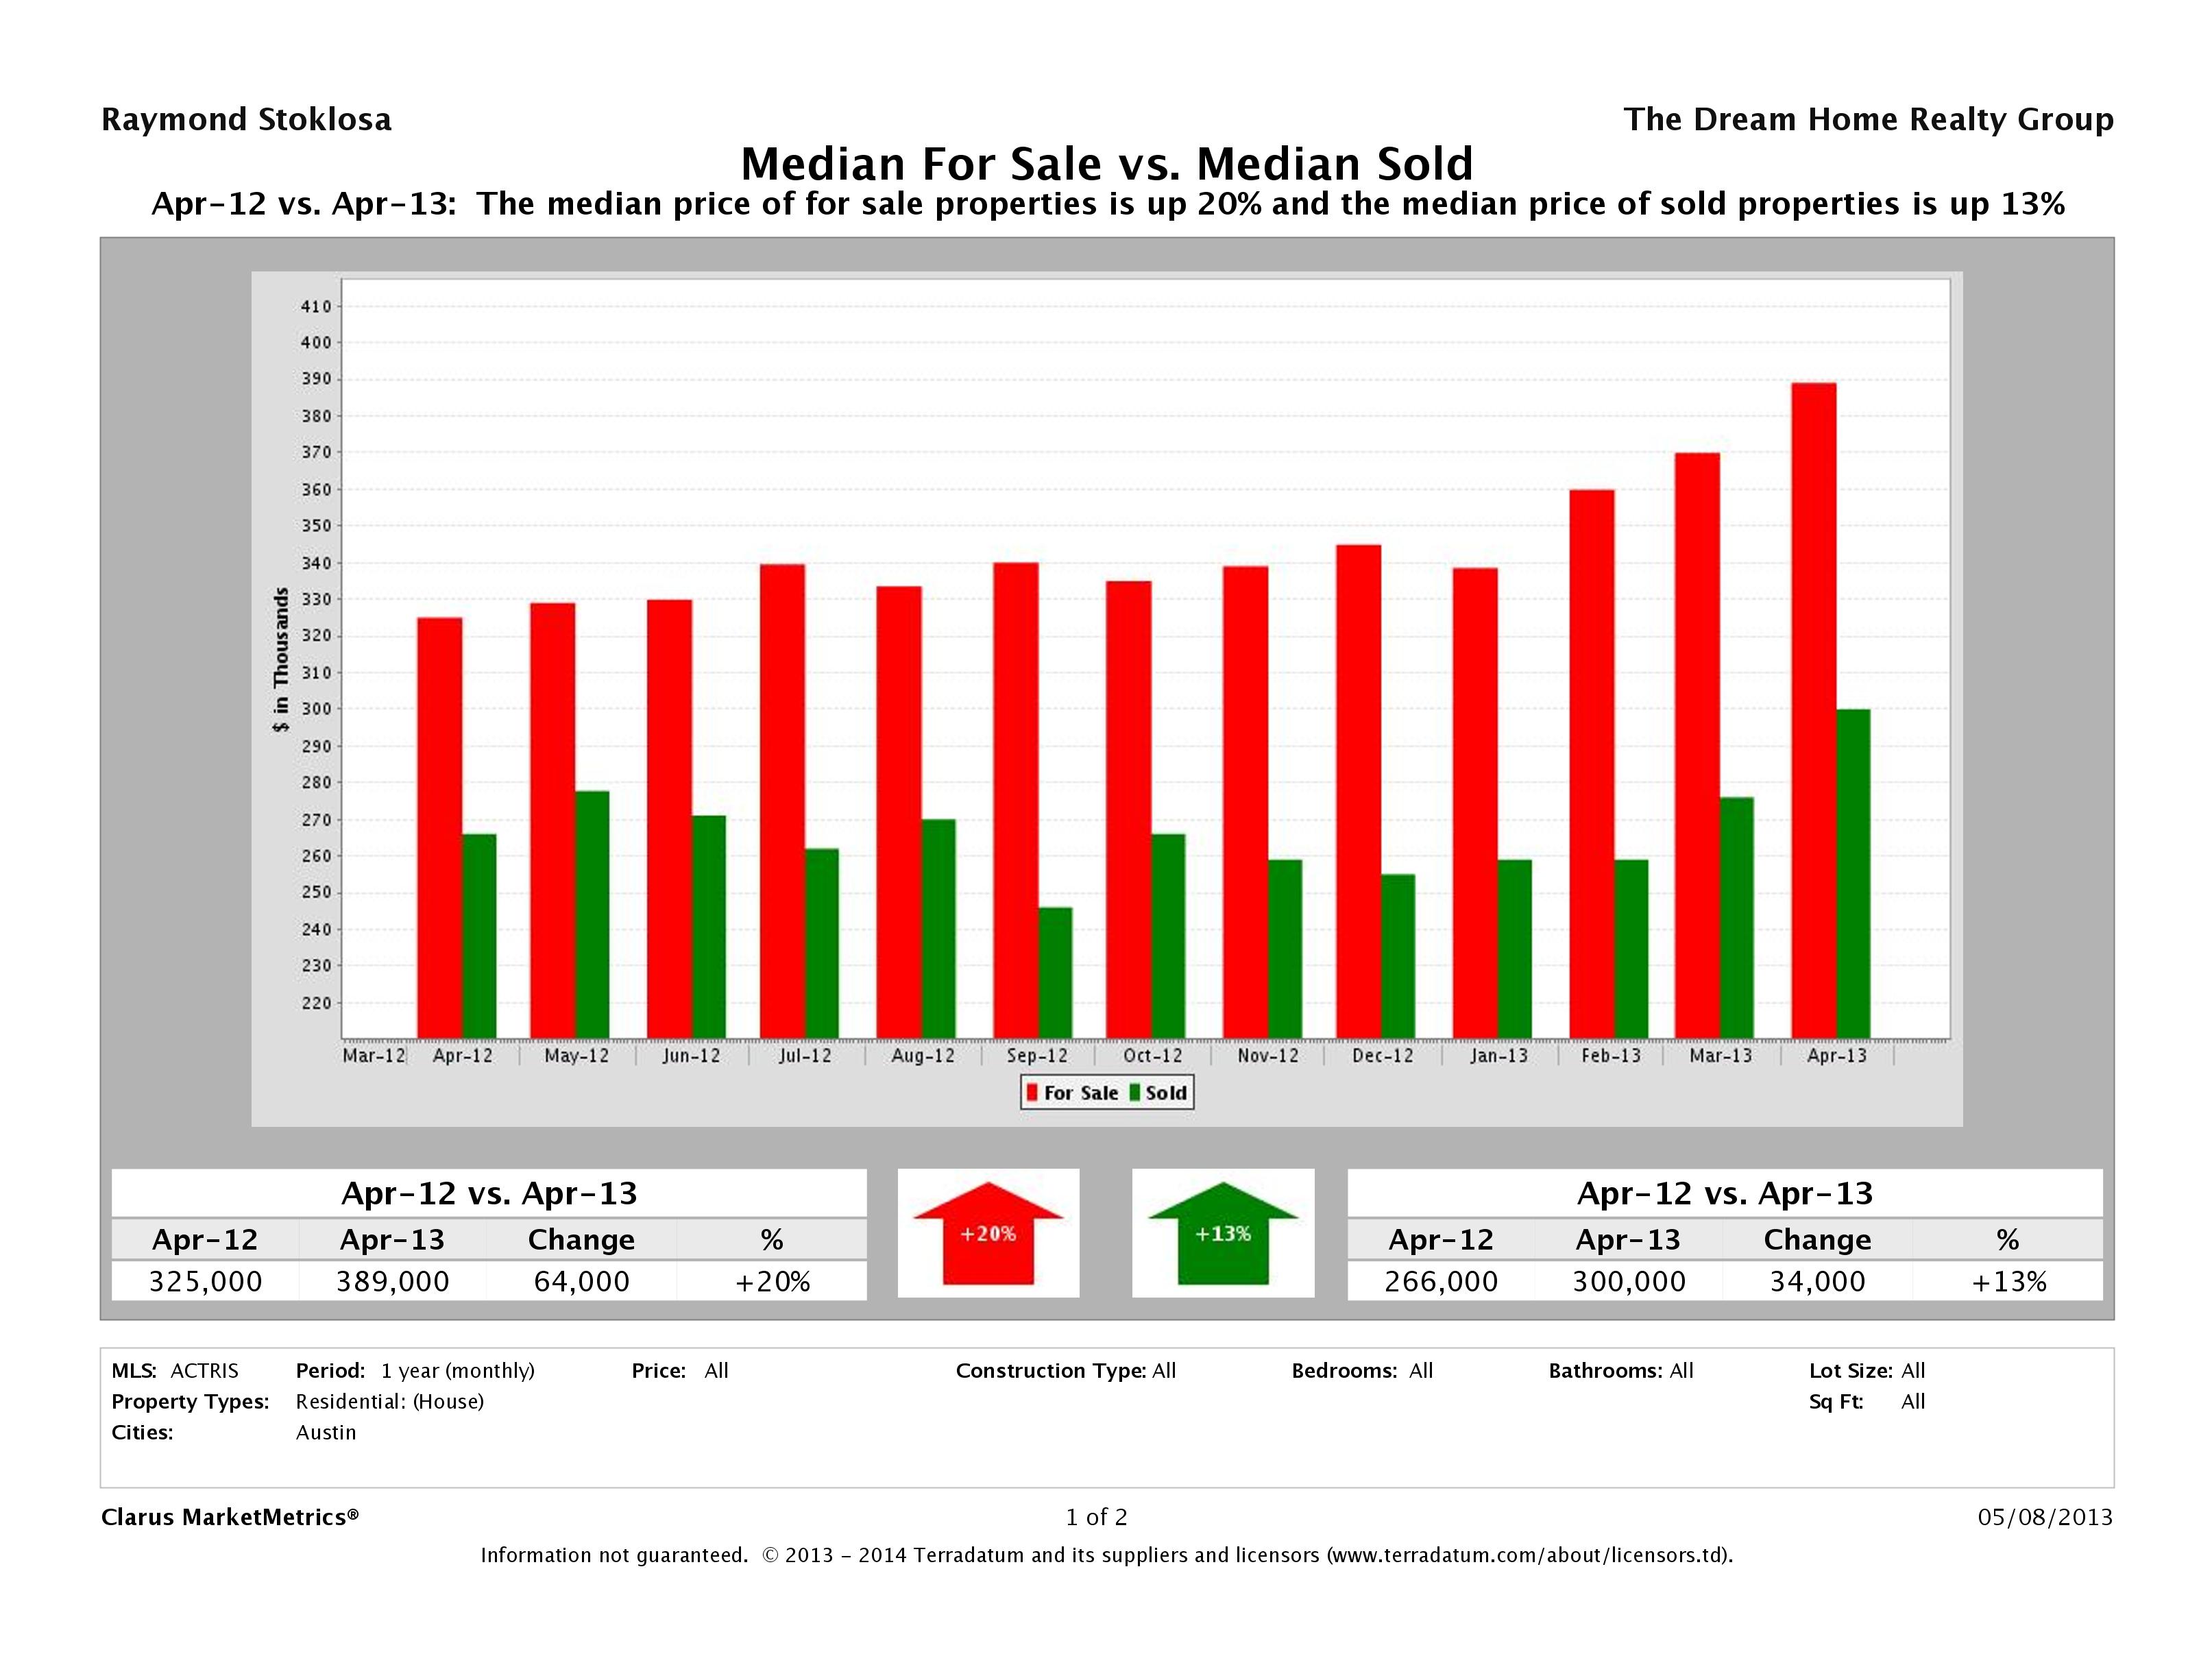
Source: Clarus Market Metrics, ACTRIS Sold Data
April 2013 Real Estate Price Report – Strictly Numbers
For those of you who prefer to see the actual hard numbers, we’ve included the figures for April 2013 Austin home sales below. The most expensive home that sold in April 2013 was $5,860,000 and the least expensive home sold for $54,000. Homes range in size from 480 sqft-12,553 sqft with an average size of 2,389 sqft. The average price per square foot was $164.78 with the lowest being $20.77/sqft and the highest being $702.64/sqft. It took, on average, 36 days to sell a home in Austin and sellers received, on average, 99.75% of their list prices.
| Beds | Baths | SqFt | Listing Price | LP/SqFt | Selling Price | SP/SqFt | SP/LP | SP/OLP | DOM | |
|---|---|---|---|---|---|---|---|---|---|---|
| High | 6 | 6 | 12,553 | $6,950,000 | $849.26 | $5,860,000 | $702.64 | 166.7% | 1036.7% | 675 |
| Low | 1 | 1 | 480 | $50,000 | $20.77 | $54,000 | $20.77 | 80.19% | 9.7% | 0 |
| Average | 3 | 2 | 2,389 | $423,606 | $166.88 | $413,497 | $164.78 | 99.2% | 99.75% | 36 |
| Median | 3 | 2 | 2,117 | $299,498 | $138.35 | $300,000 | $137.06 | 99.52% | 99.4% | 8 |
| Search Criteria | |||
|---|---|---|---|
| Status | Sold | Sold Date | April 2013 |
| Property Type | Single Family Homes | Number Sold | 1,066 |
| Source: | ABoR Sales Data | Area | Austin |
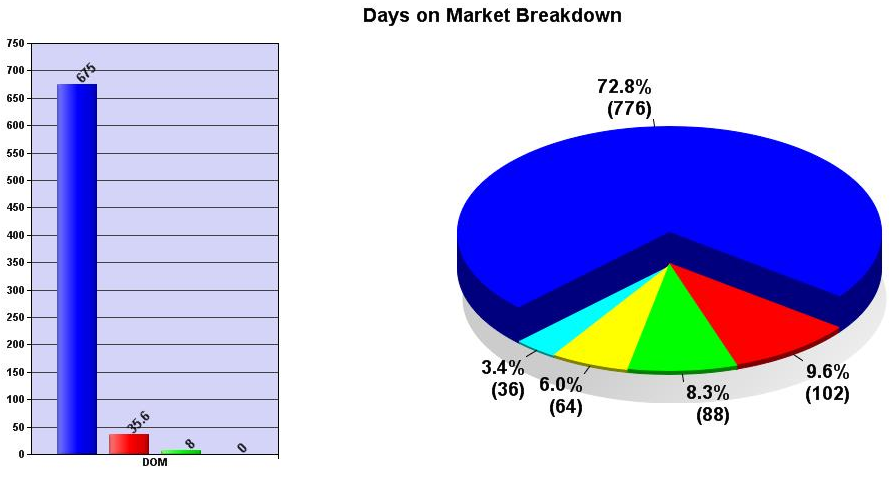
April 2013 Days on Market Report
The overwhelming majority (72.8%) of the 1,066 homes that sold in Austin in April 2013 (776) sold in less than 30 days and received, on average, 100.22% of their list prices. As homes stayed on the market for longer, sellers received less than their list prices with homes that have been for sale for 120 days or more receiving, on average, 95.29% of their list prices. The lesson here? Homes that are priced right from the beginning sell quickly and for list price, or even a little bit more.
| 0-30 Days | 31-60 Days | 61-90 Days | 91-120 Days | 120+ Days | |
|---|---|---|---|---|---|
| No. of Listings | 776 | 102 | 64 | 36 | 88 |
| Breakdown % | 72.8% | 9.57% | 6% | 3.38% | 8.26% |
| Avg % SP/LP | 100.22% | 97.28% | 96.58% | 96.69% | 95.29% |
April 2013 Price Analysis Report
The majority of the homes that sold in Austin in April 2013 were priced below $500,000, which is to be expected. You’ll also see that the lower priced homes sold faster than the higher priced homes, which is due largely in part to the increased market for homes below $500k.
| Price Range | Quantity | Average DOM |
|---|---|---|
| $149,999 or under | 85 | 27 |
| $150,000 – $199,999 | 165 | 23 |
| $200,000 – $249,999 | 162 | 20 |
| $250,000 – $299,999 | 119 | 21 |
| $300,000 – $349,999 | 99 | 37 |
| $350,000 – $399,999 | 107 | 43 |
| $400,000 – $449,999 | 80 | 33 |
| $450,000 – $499,999 | 47 | 58 |
| $500,000 – $549,999 | 27 | 37 |
| $550,000 – $599,999 | 16 | 30 |
| $600,000 – $699,999 | 37 | 59 |
| $700,000 – $799,999 | 19 | 44 |
| $800,000 – $899,999 | 27 | 49 |
| $900,000 – $999,999 | 9 | 71 |
| $1,000,000 or over | 67 | 92 |
| Total | 1,066 | 36 |
April 2013 Summary Price Report
Below you’ll find a breakdown of the sales prices of homes in Austin. The average price of a home that sold in April 2013 was $413,497 and the median price was $300,000.
| Summary | List Price | Sale Price |
|---|---|---|
| High | $6,950,000 | $5,860,000 |
| Low | $50,000 | $54,000 |
| Average | $423,606 | $413,497 |
| Median | $299,498 | $300,000 |
Time to Buy? Sell?
As we always say, the best time to buy or sell a home is when you need to buy or sell. If you have a house to sell, selling when its a buyers market may hurt you on the selling end, but you’ll make it up on the buying end. If you’re trying to get into the market for the first time, the only way you’ll know that we’ve “hit bottom” is when its in the rear view mirror. Work with professionals who can help you analyze your financial and lifestyle to determine if now is the right time to buy or sell.
Looking strictly at the numbers, it appears the recommendation for this month is (again)…it’s time to sell. With inventory at record lows, a home that’s priced right will have no problem finding a buyer. Buyers again came out in record numbers yet again in April 2013 with a 16% increase in the number of contracts received by sellers in year over year numbers. As we head into May 2013, buyers who have been waiting for more inventory will continue their searches. Get your home on the market now and be moved into your new home by June! If you’re looking to sell, we can help you get top dollar for your home in the shortest time. For more info about the best home selling program in Austin, visit Sell My Austin Home.
If you’re a buyer, that doesn’t mean sit on the fence and wait. Interest rates are at all time lows, which could mean the difference in hundreds of dollars to your payment. As more and more inventory gets snatched up, you’ll find less and less available. Waiting until the market slows down could mean you could afford less home if interests rates go up. And, as buyers continue to snatch up everything, market values will go up as well. If you’re looking to get into the market, the best time to find a great deal is any time you can. For more info about our Home Buyer Representation Program, check out Austin Buyer Brokers.
Questions About the Austin Real Estate Price Report?
Do you have questions about this Austin Real Estate Price Report? Call us at (512) 827-8323 or email us at info@11OaksRealty.com and we’ll help you in any way we can. If you’re looking to buy or sell Austin real estate, don’t forget to check out our Buyer Resources and our Seller Resources for more tips.


Leave a Reply