The Dream Home Realty Group is proud to present their July 2012 Austin Real Estate Price Report measuring activity in the Austin single family home market.
Austin Housing Inventory Continues to Decline to Historically Low Levels
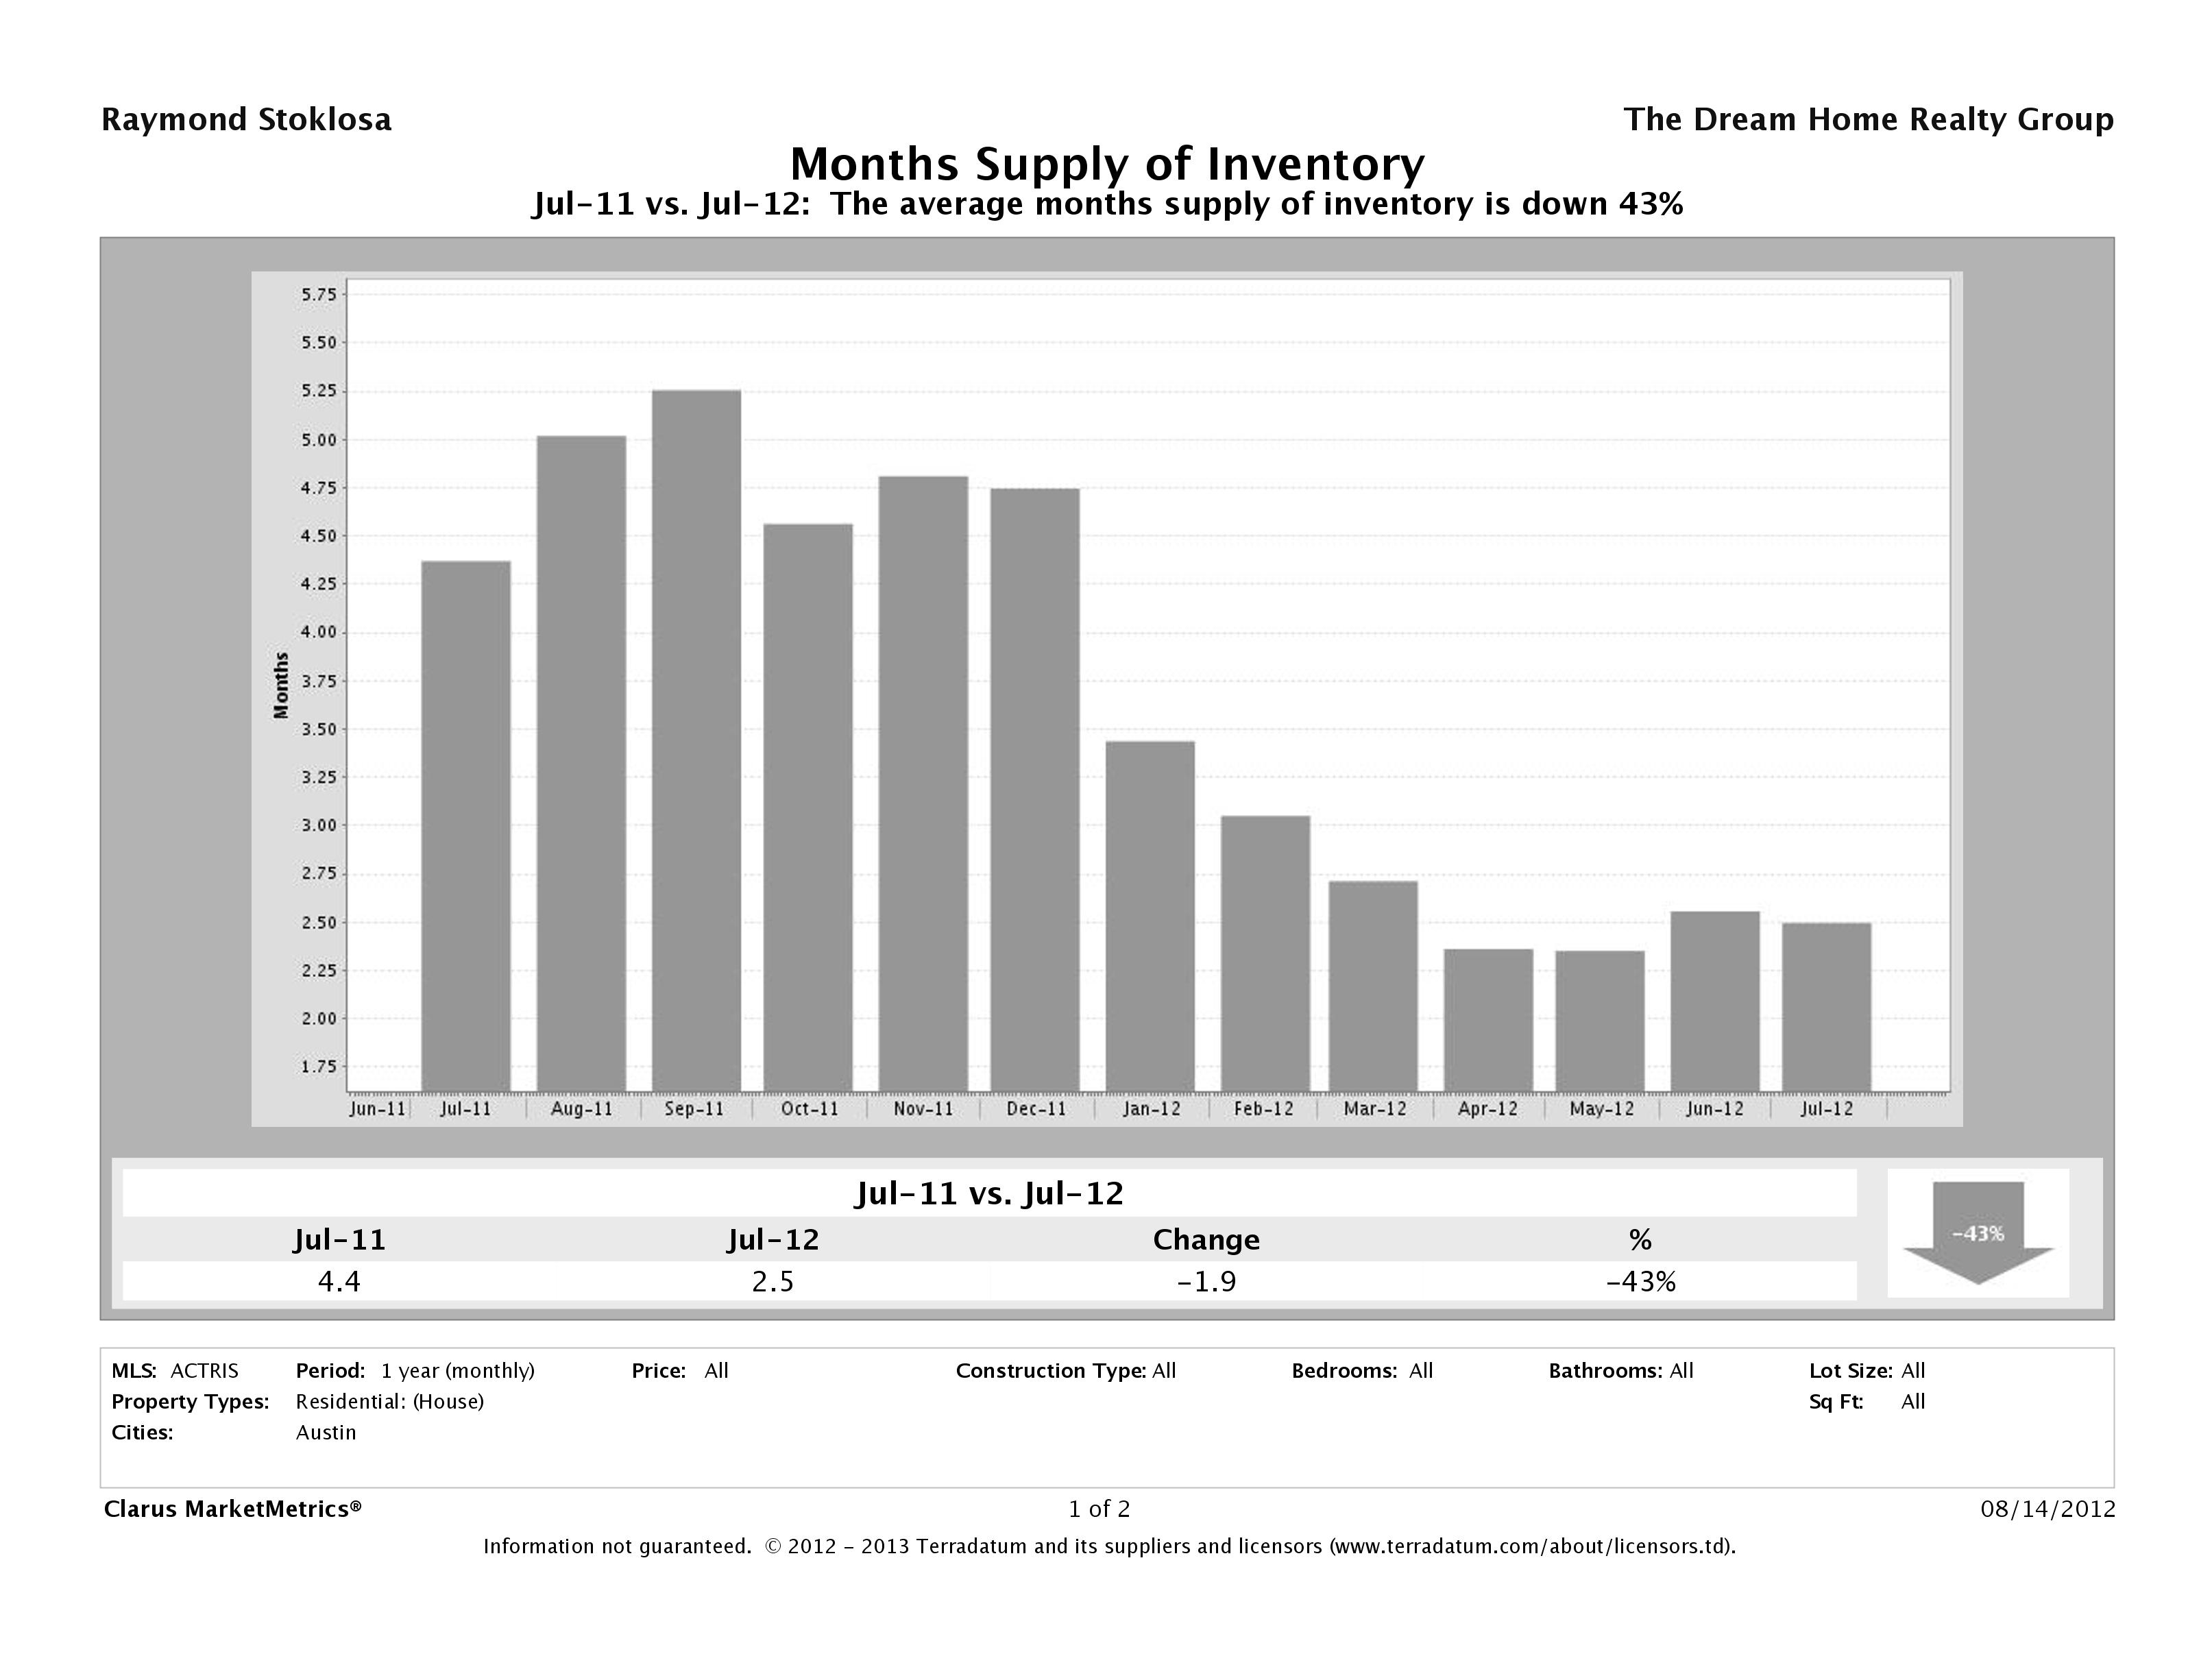
The biggest story in July 2012 numbers is in months supply of inventory. In July 2012, we saw a 43% decrease in months supply of inventory from already historically low July 2011 numbers to 2.5 months of inventory. July 2012 numbers mark the lowest inventory we’ve seen in Austin in over three and a half years. As we come to the end of the peak Summer buying season it will be interesting to see if these numbers increase or if they continue to dip.
What does this mean to sellers? If you are thinking of selling, do it now while buyers have fewer choices. Positioning your home as one of the best values on the market will help you sell your home quickly.
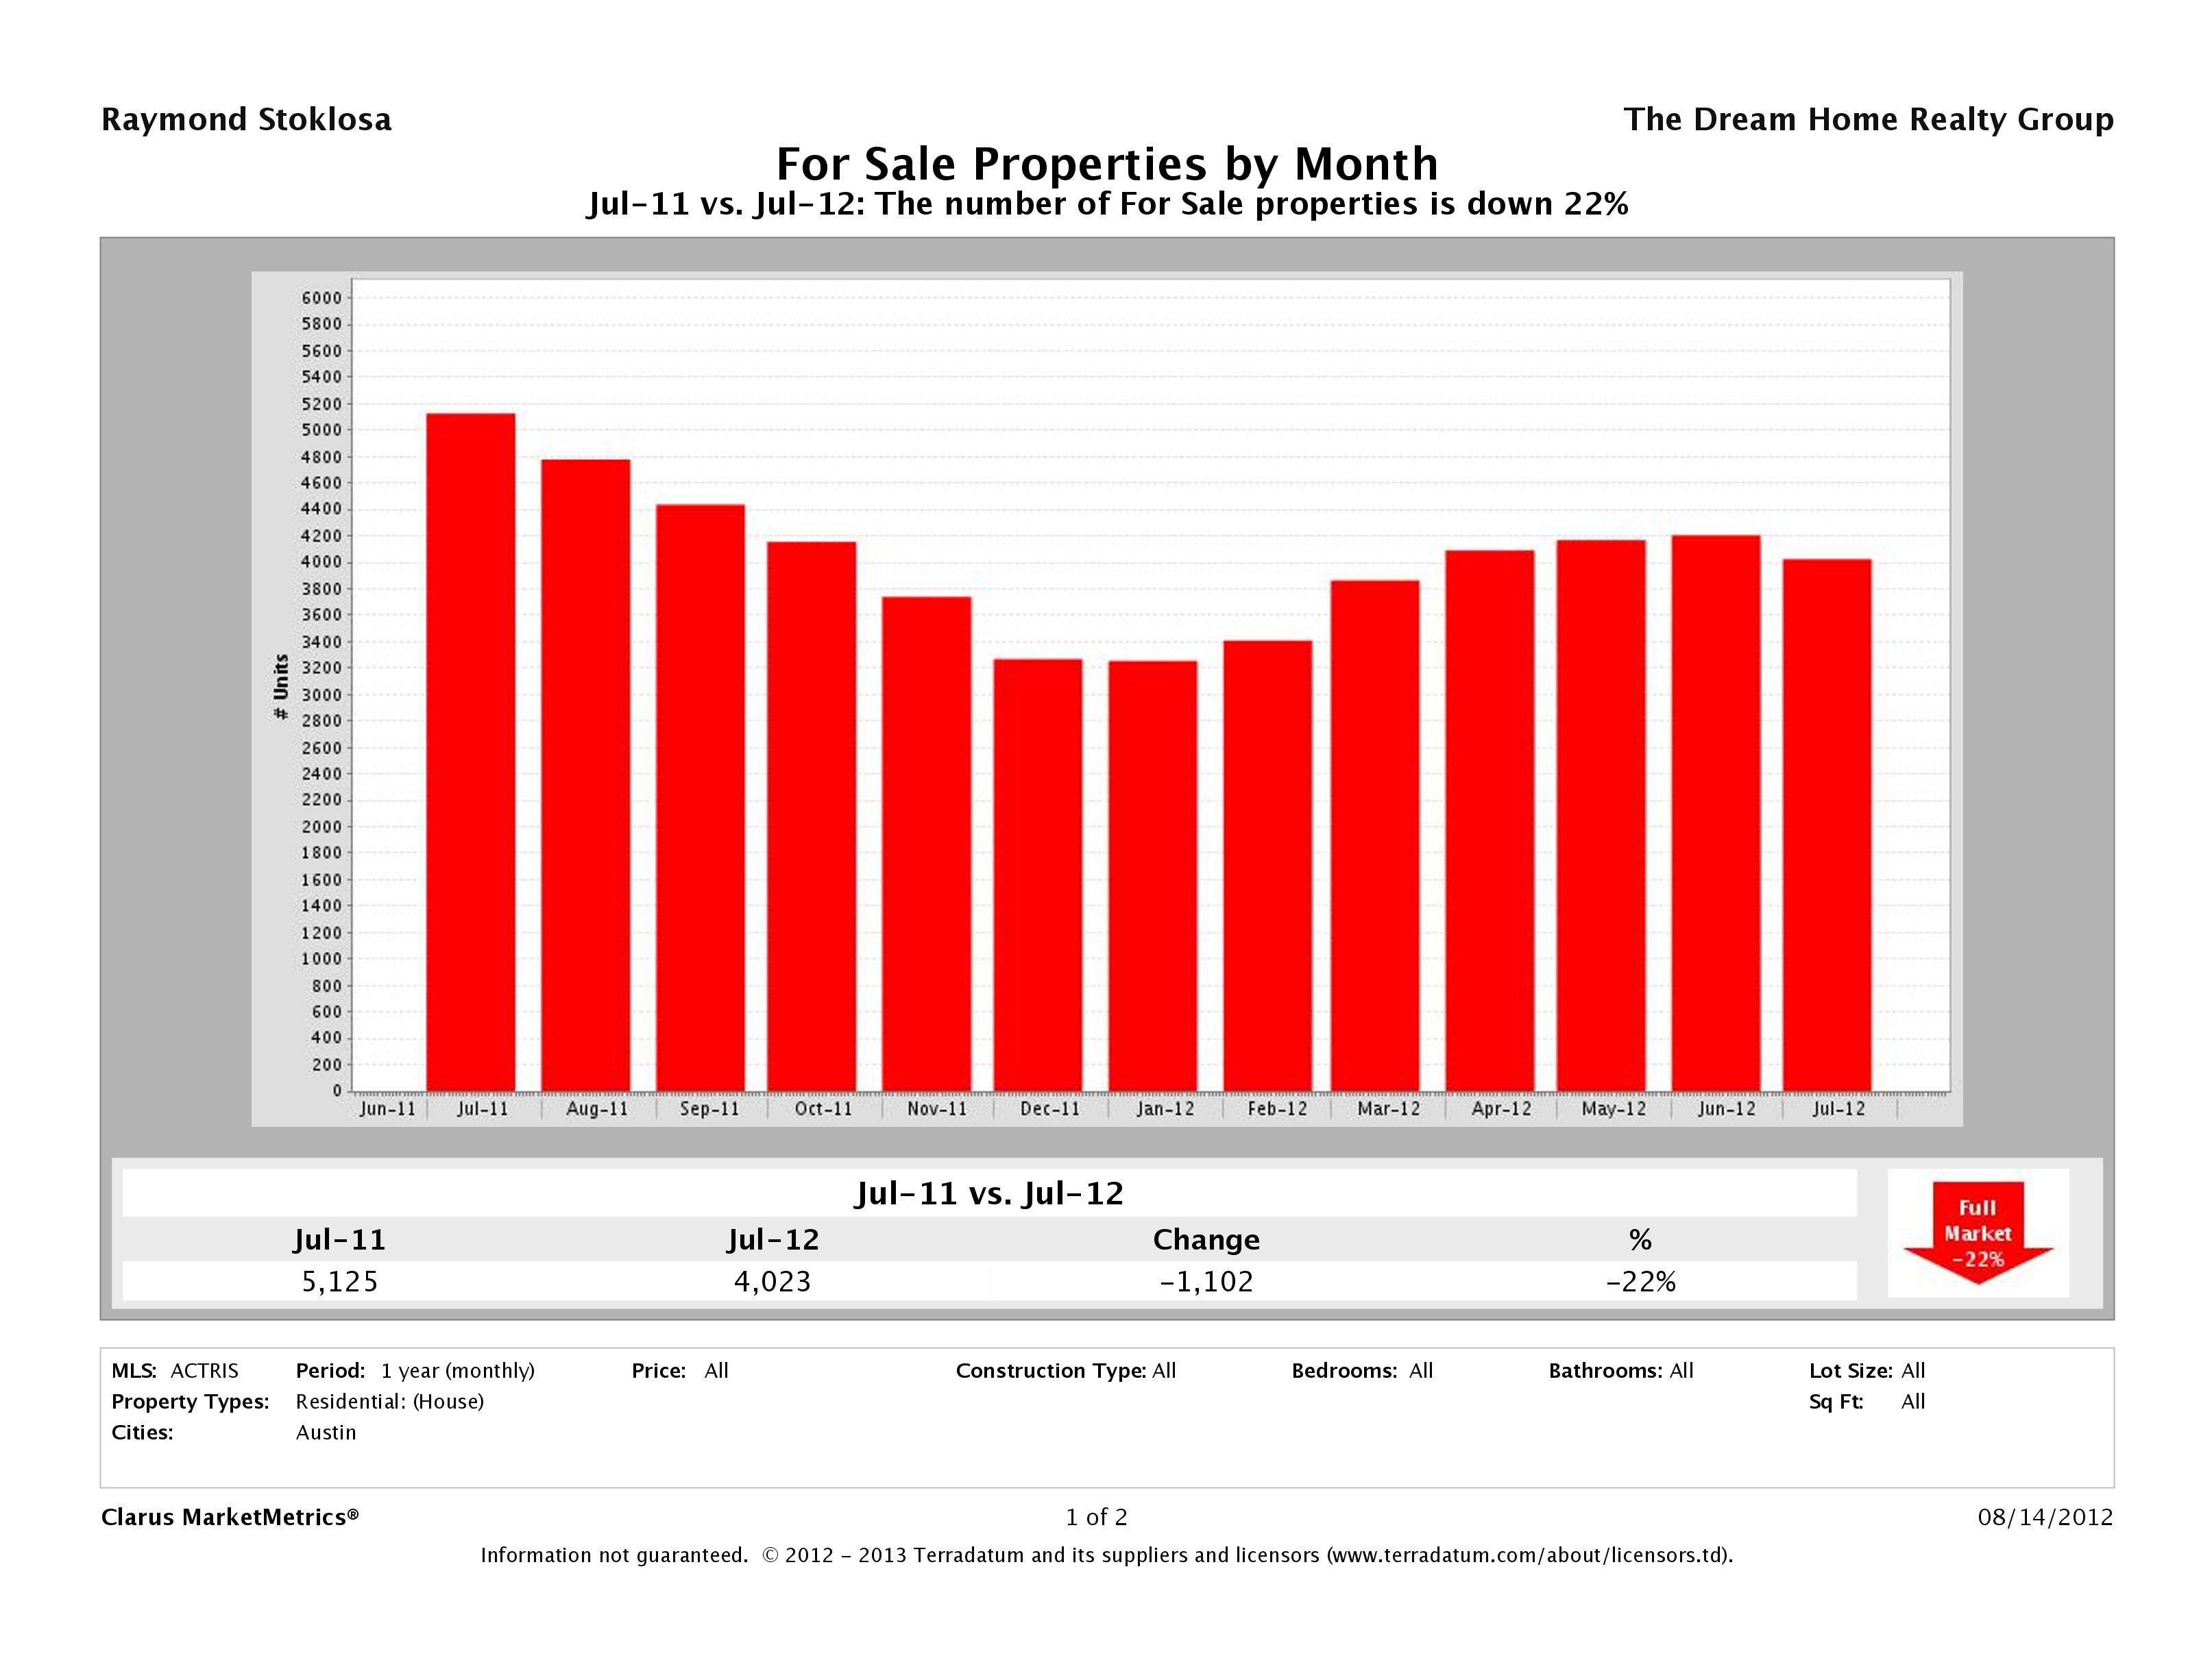
22% Fewer Homes on the Market than July 2011
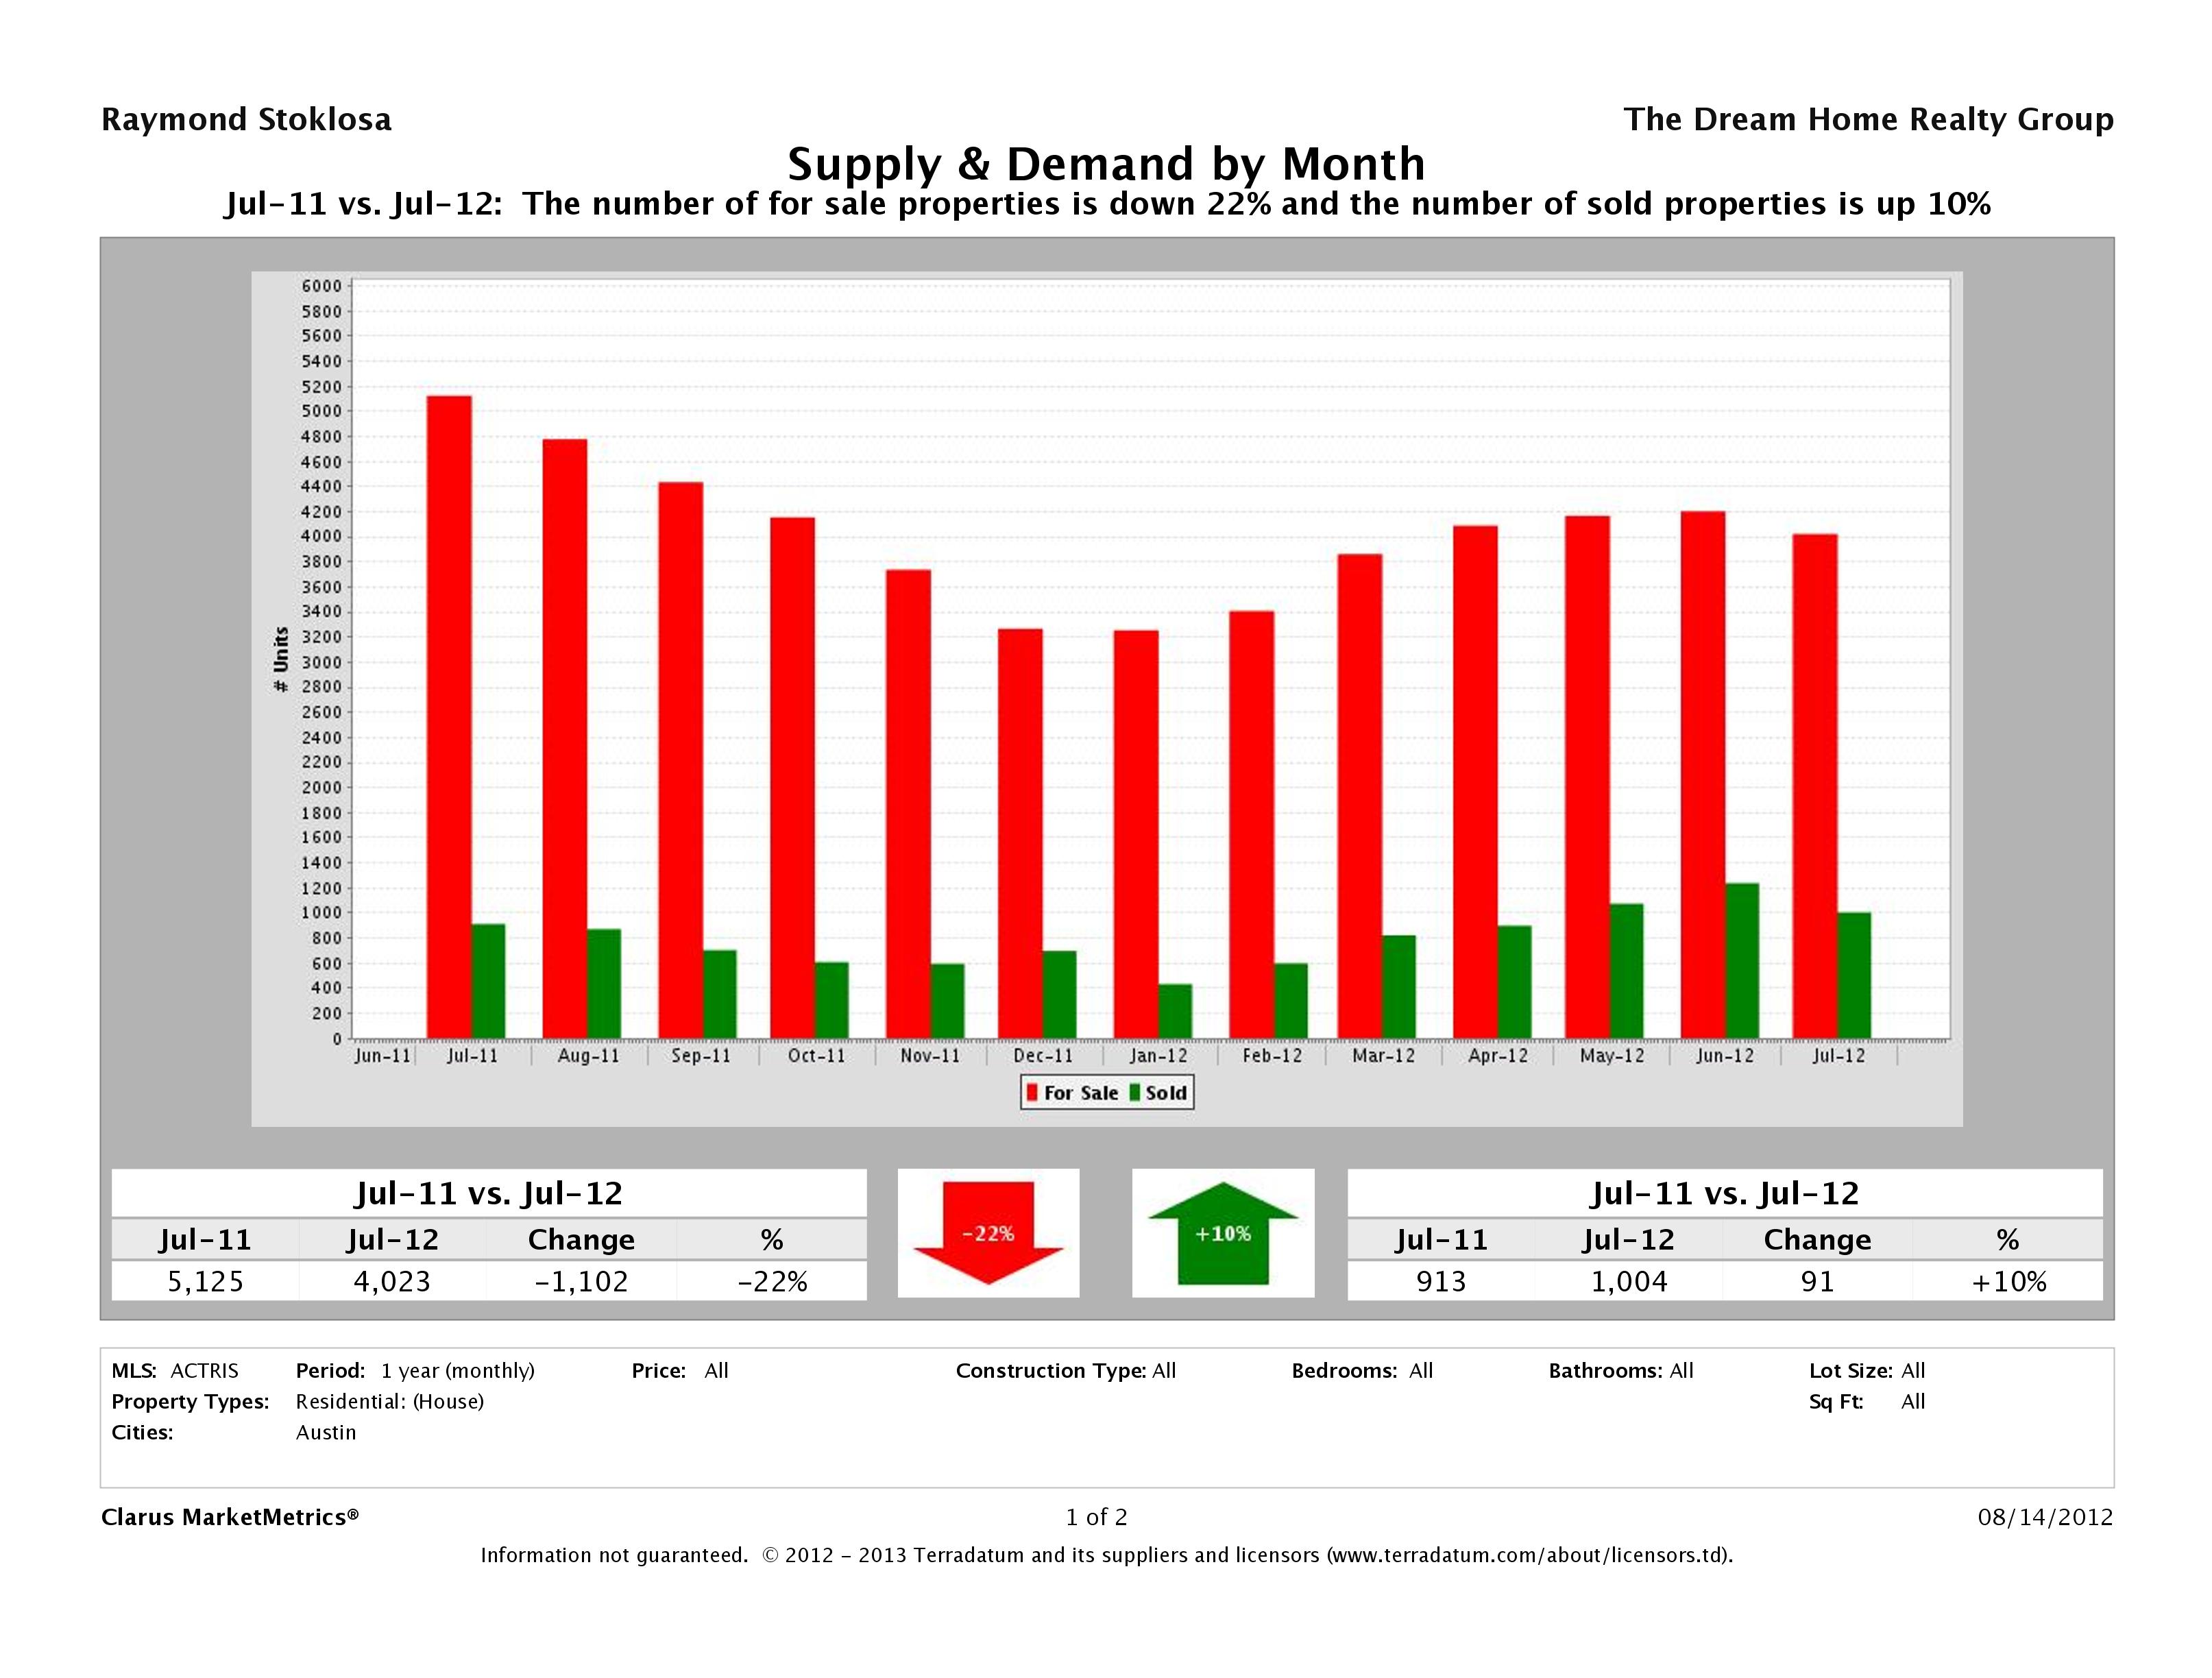
In July 2012, we had 4,023 homes listed for sale in Austin, compared to 5,125 this time last year. Buyers continue to snatch up inventory quickly and with record numbers of people moving to Central Texas, there aren’t enough homes to meet the demand. If you’re thinking of selling, think about doing so sooner rather than later to take advantage.
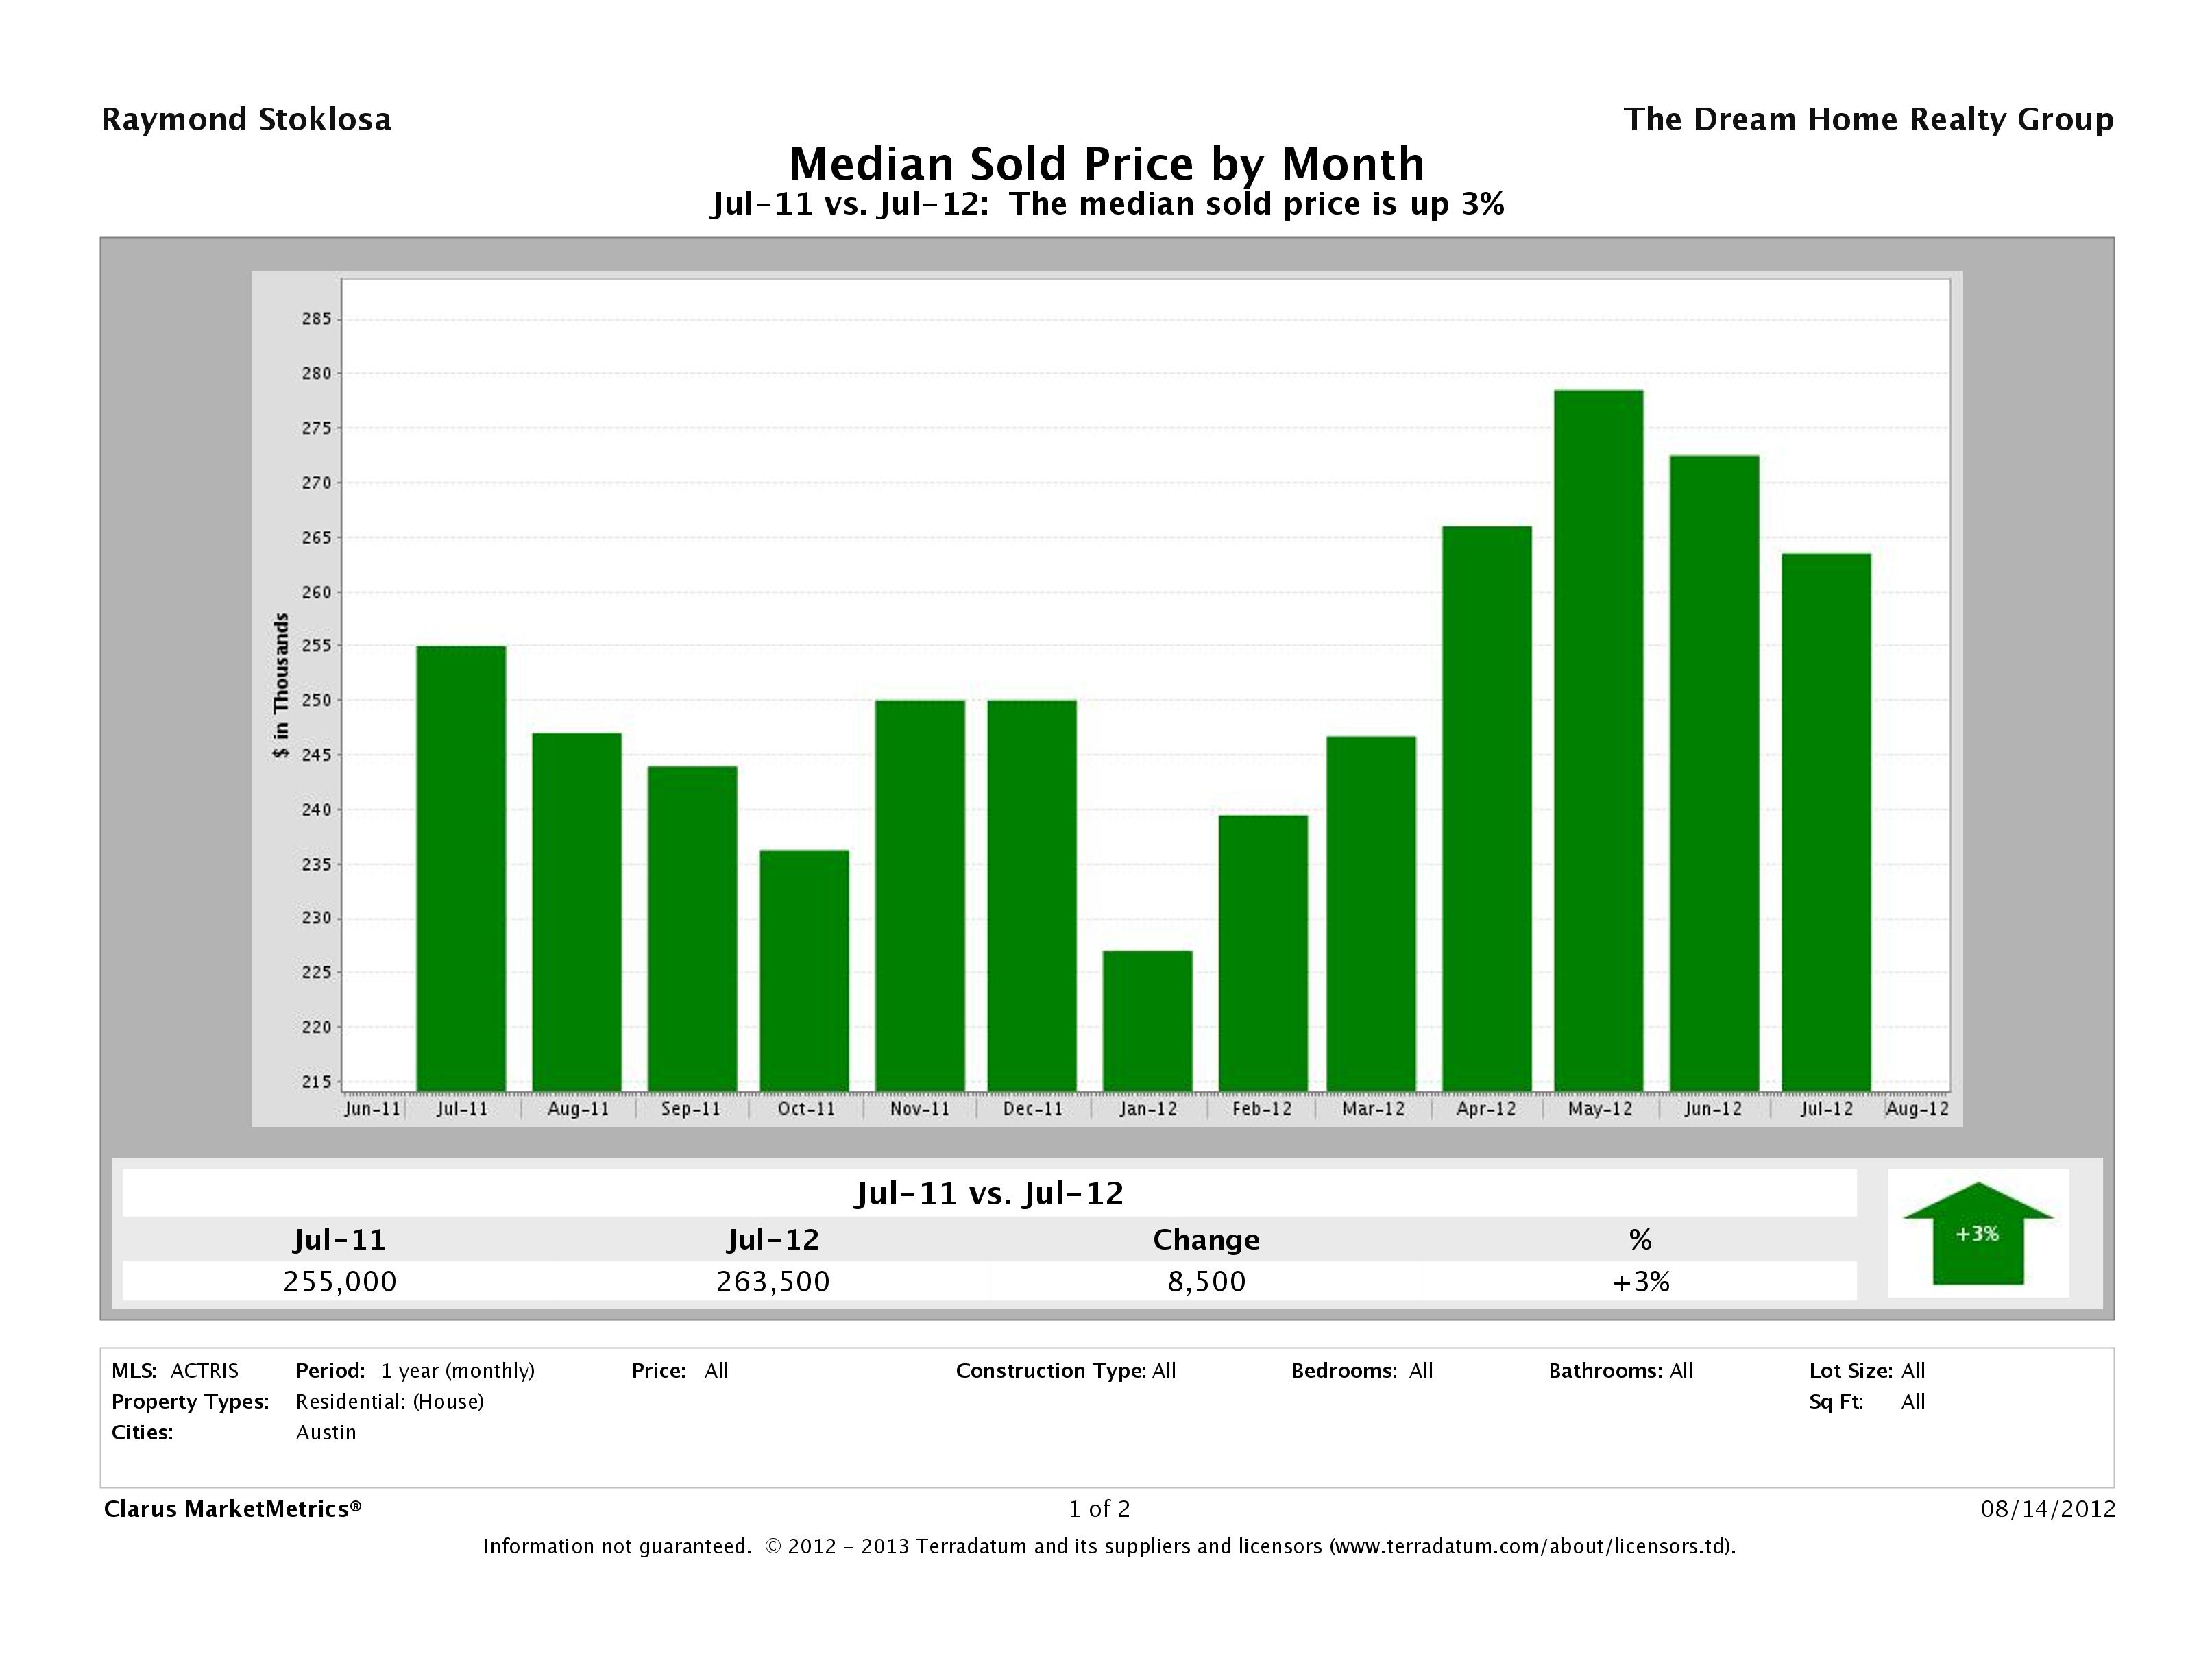
Austin Median Home Price Up 3%
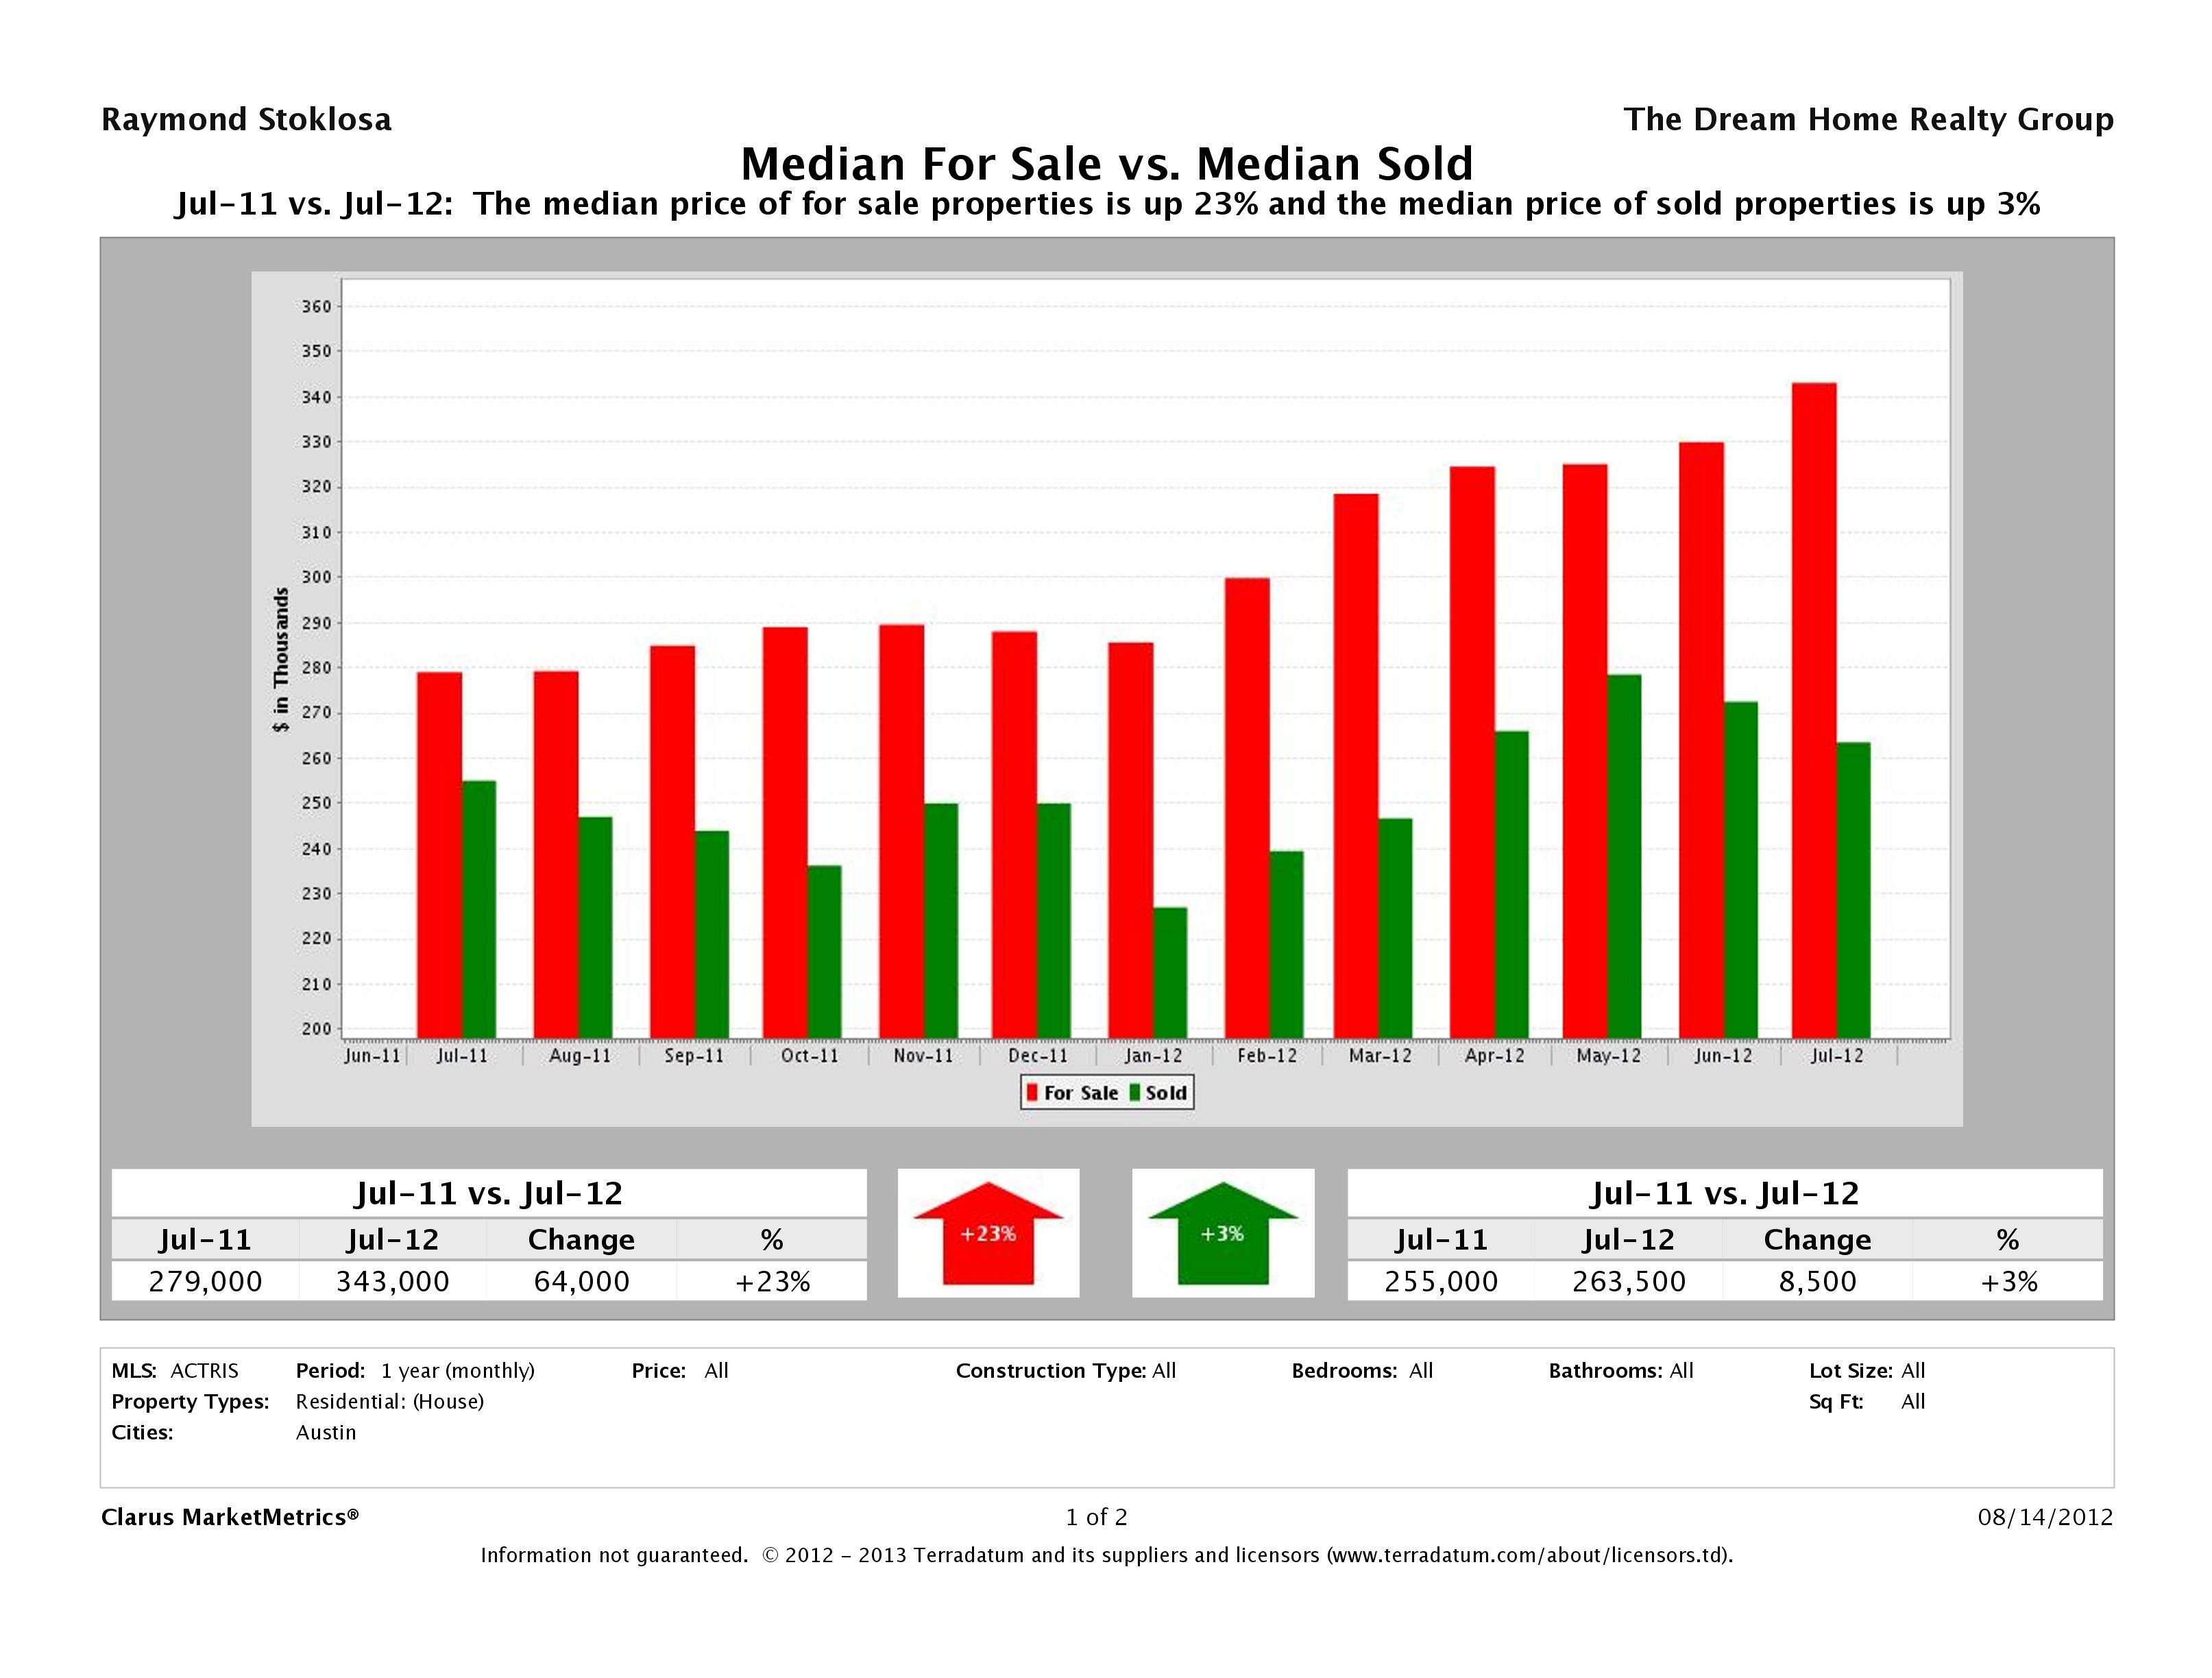
This month, we saw a 3% increase in the median home price in Austin with an $8,500 increase in year over year numbers. The median home price in July 2011 was $255,000 vs $263,500 in July 2012. With the decreased inventory and no inventory to replace what has been snatched up, it is only logical prices would go up.
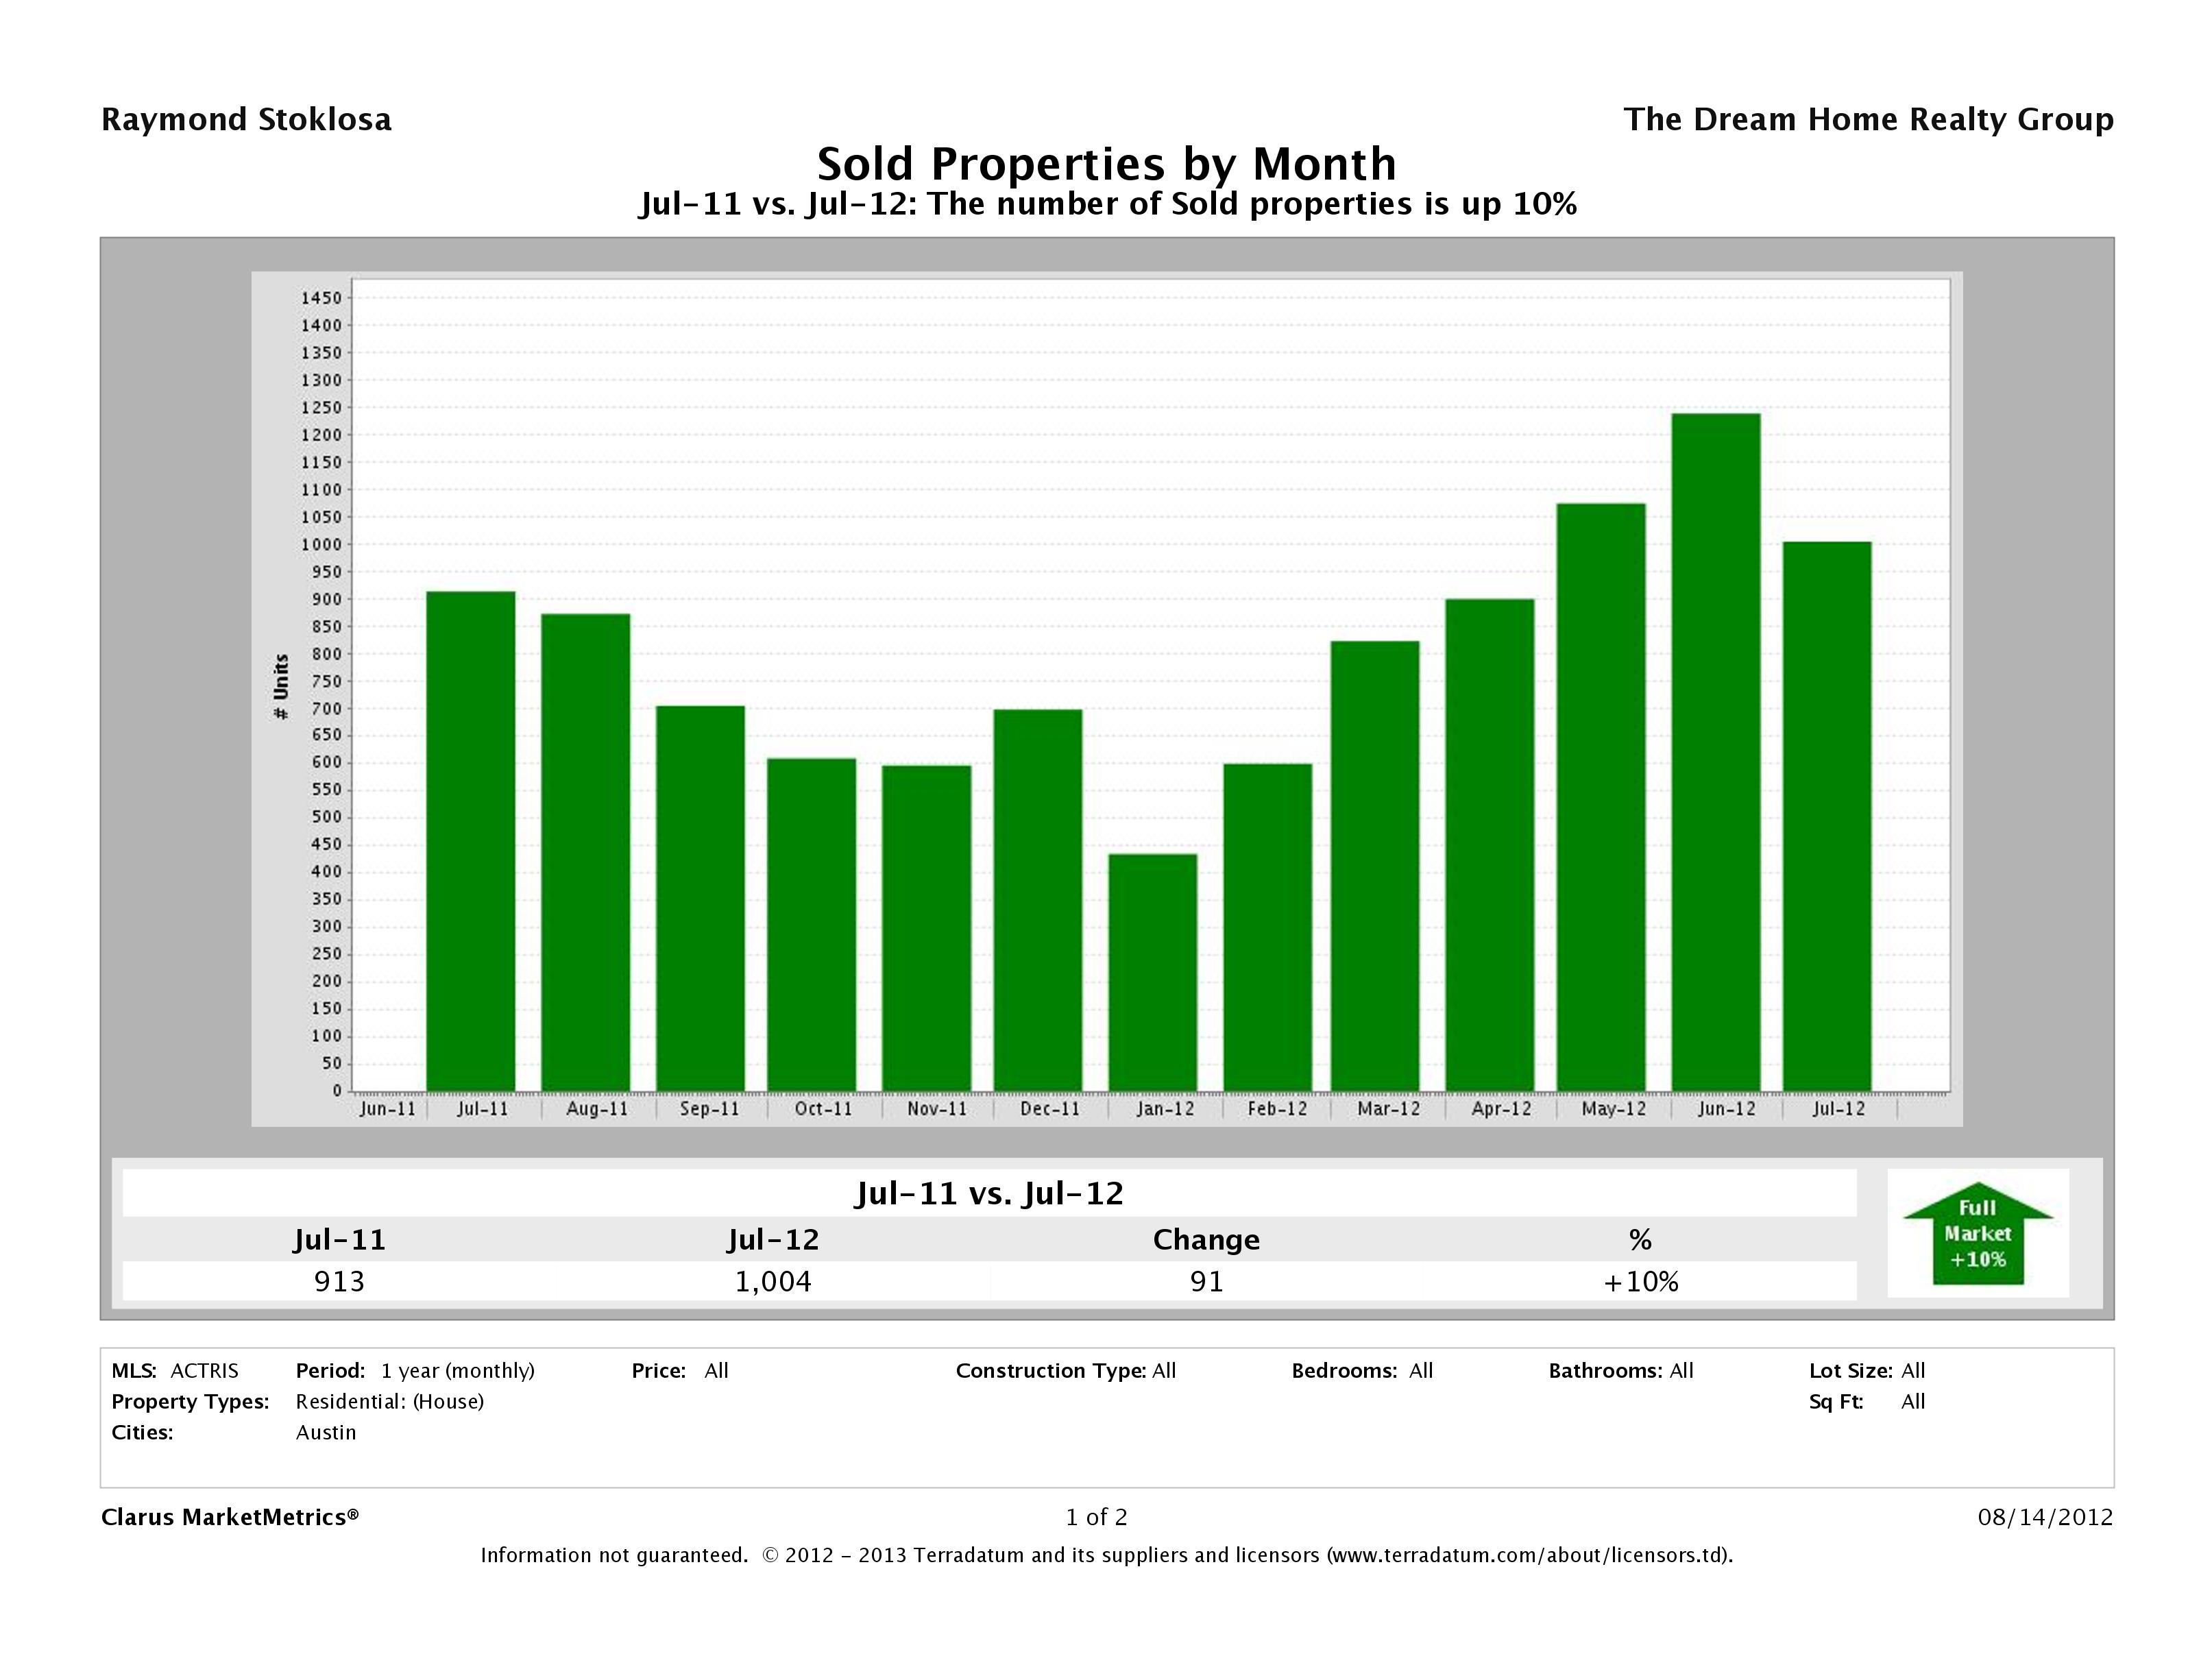
Number of Sold Homes in Austin Up 10%
In July 2012, we saw a 10% increase in the number of homes sold from July 2011 numbers. In July 2012, we saw 1,004 homes sell in Austin compared to 913 in July 2011. This is continued proof that more and more people are relocating to Austin and buying homes.
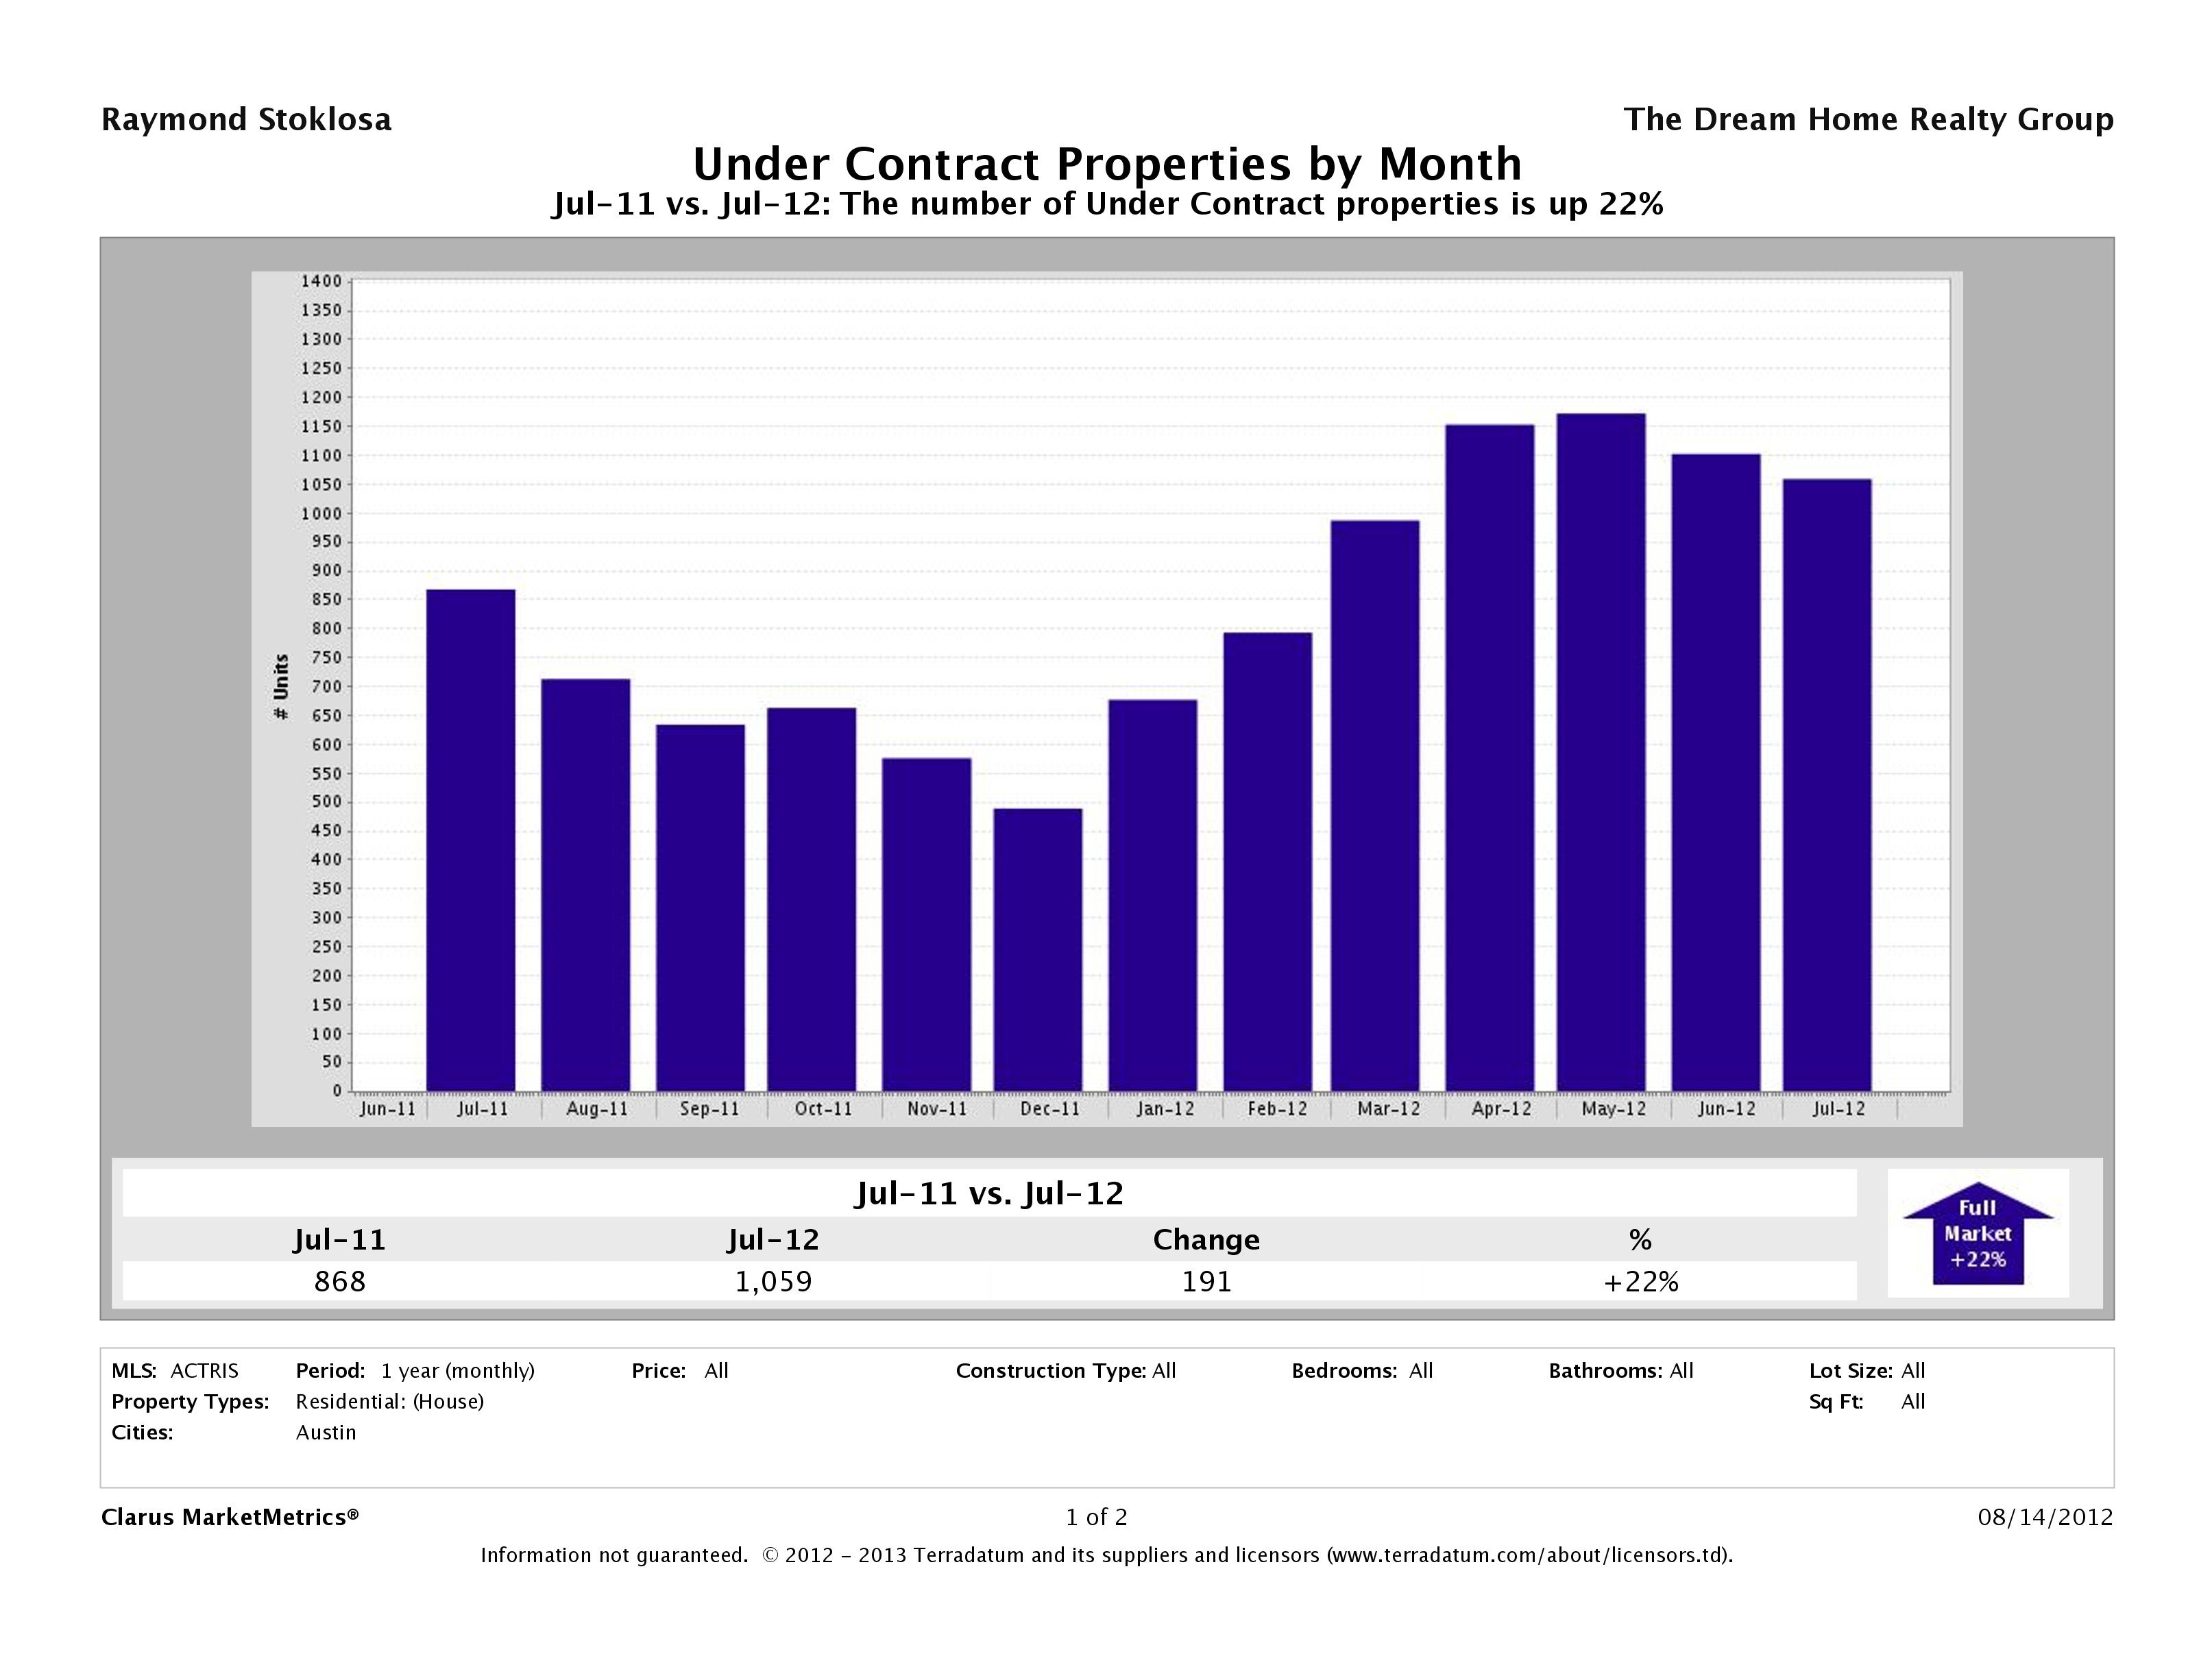
22% More Austin Homes Under Contract
In July 2012, there were 1,059 homes that went pending compared to just 868 in July 2011 marking a 22% increase. This trend has been steadily inreasing throughout the busy Spring/Summer buying months with the expected small drop off as we entered mid Summer. It will be interesting to see what figures August brings.
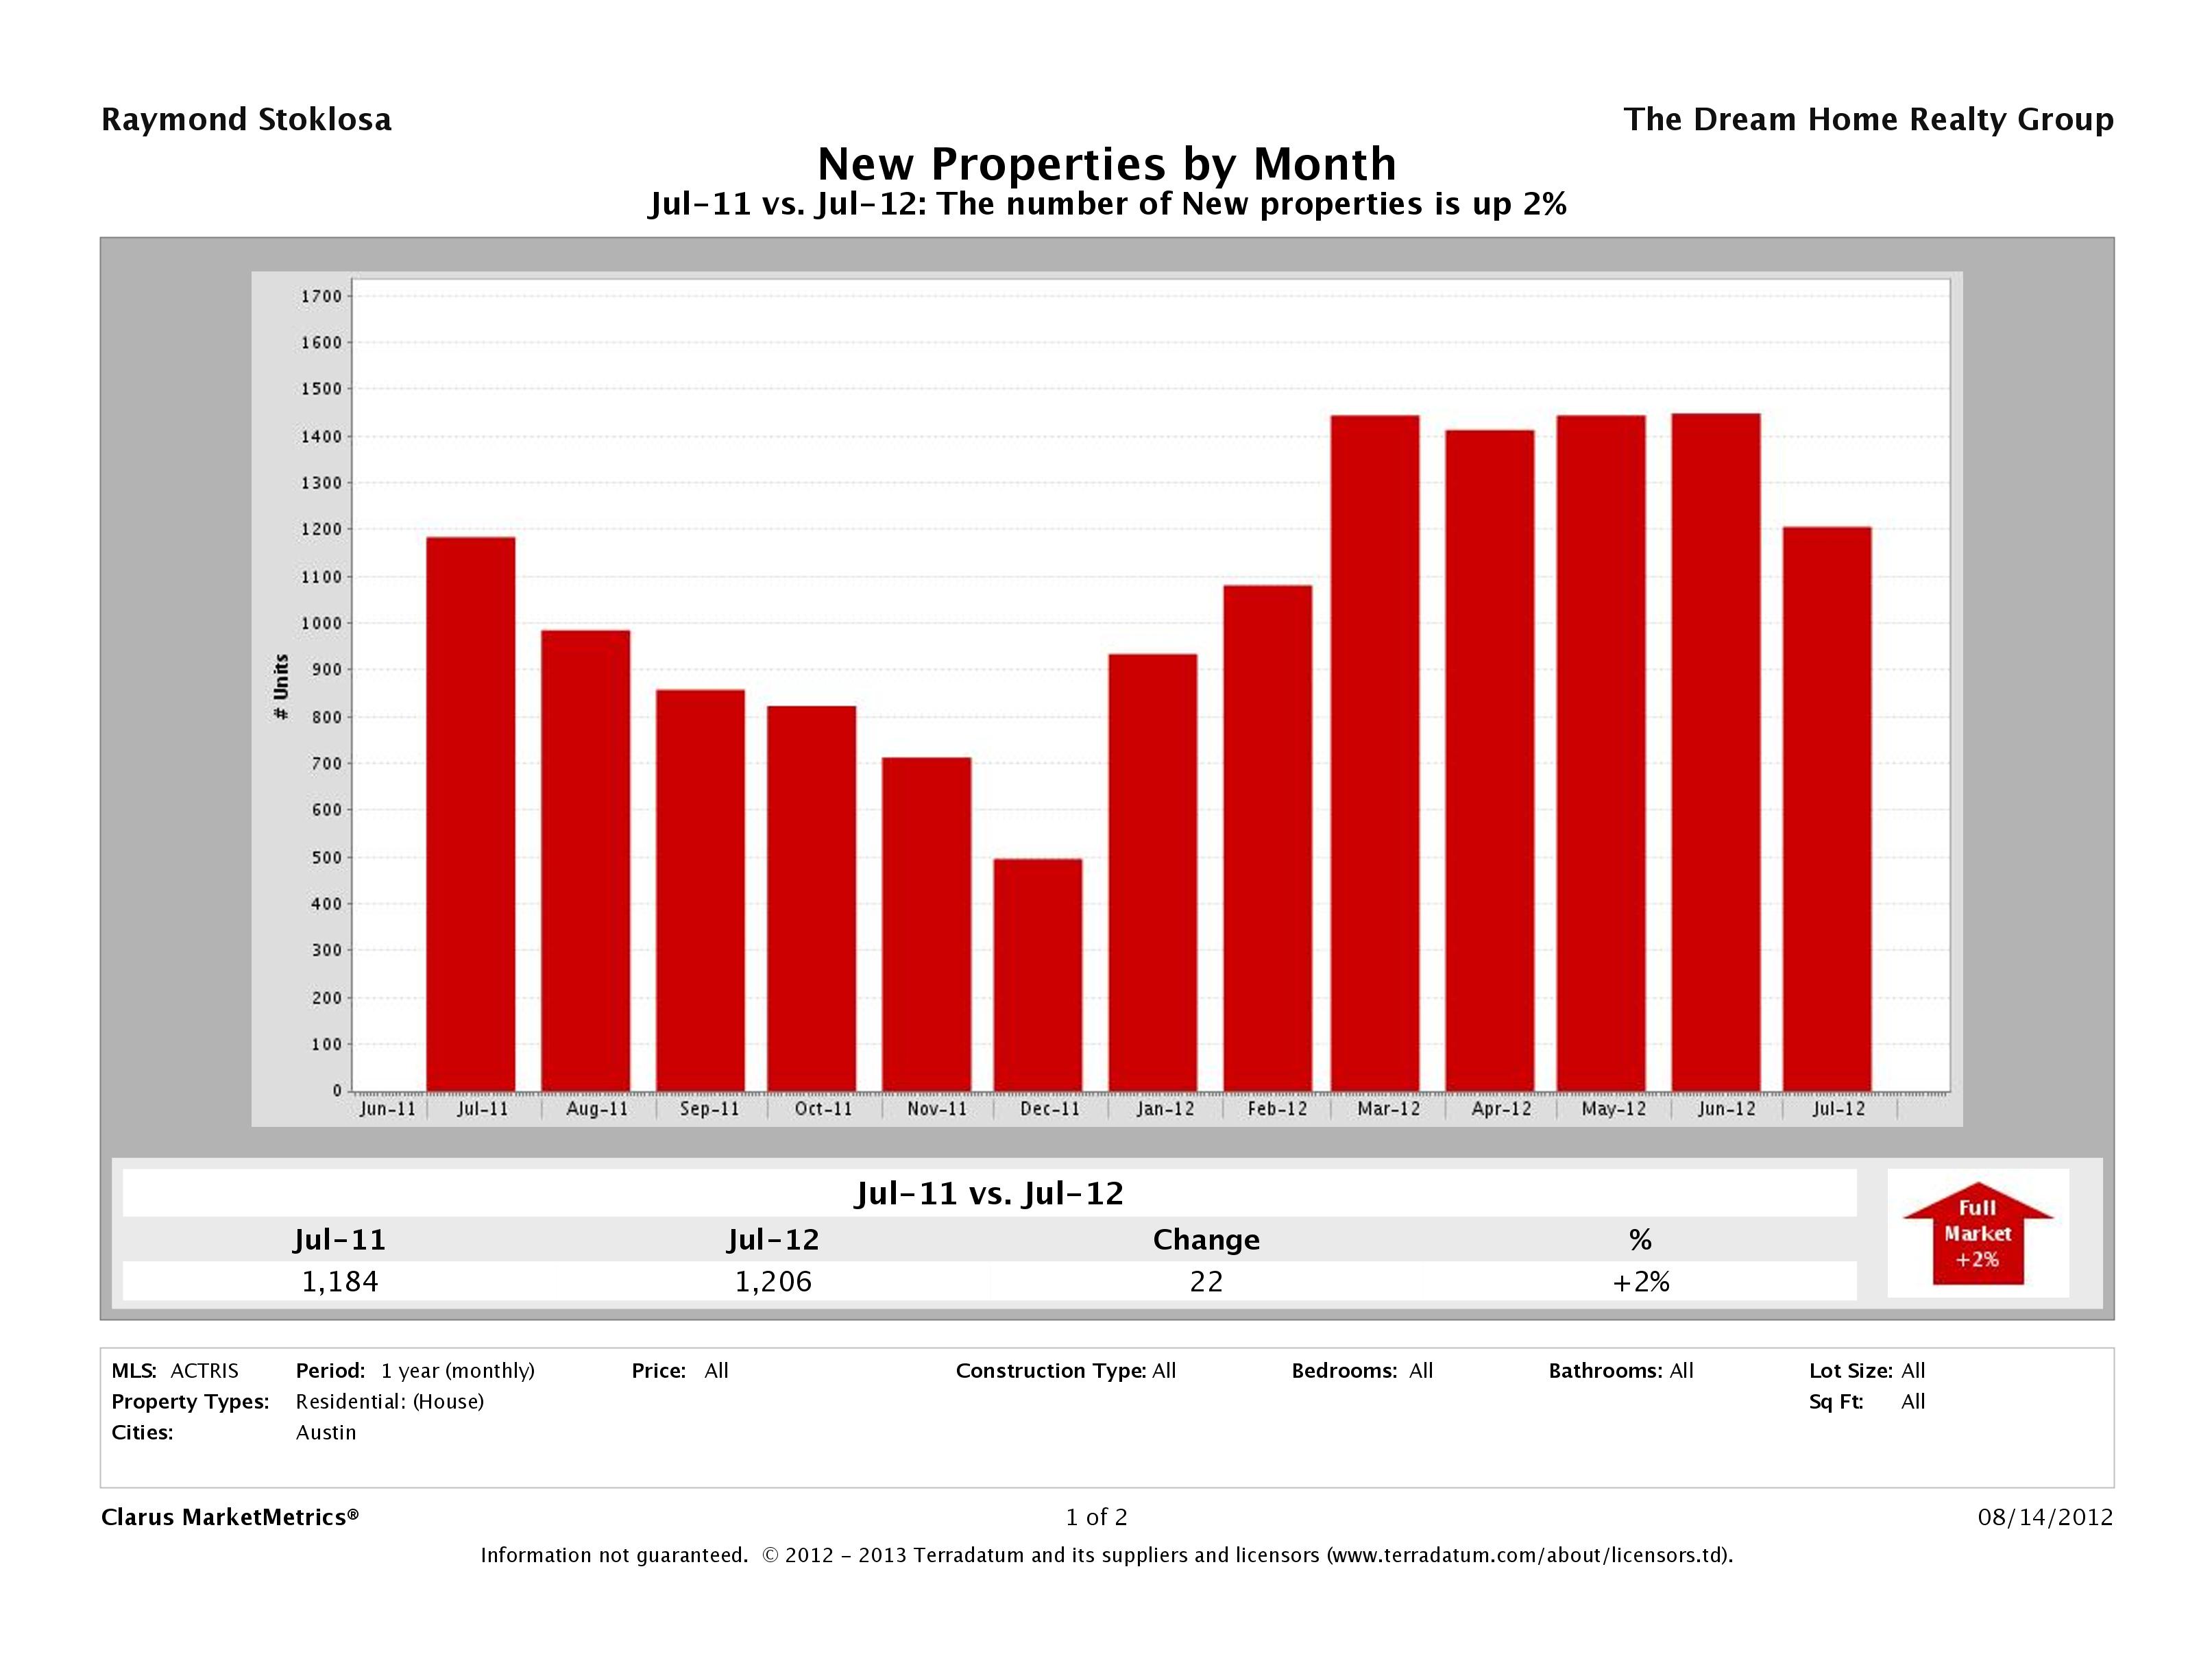
Number of Homes Listed for Sale Up 2%
In July 2012, we saw an increase of 2% more homes being introduced to the market than in July 2011. In July 2012, there were 1,206 homes listed for sale in Austin compared to 1,184 in July 2011. Even though we saw a small increase from last year’s numbers, demand continues to outpace supply for Austin homes.
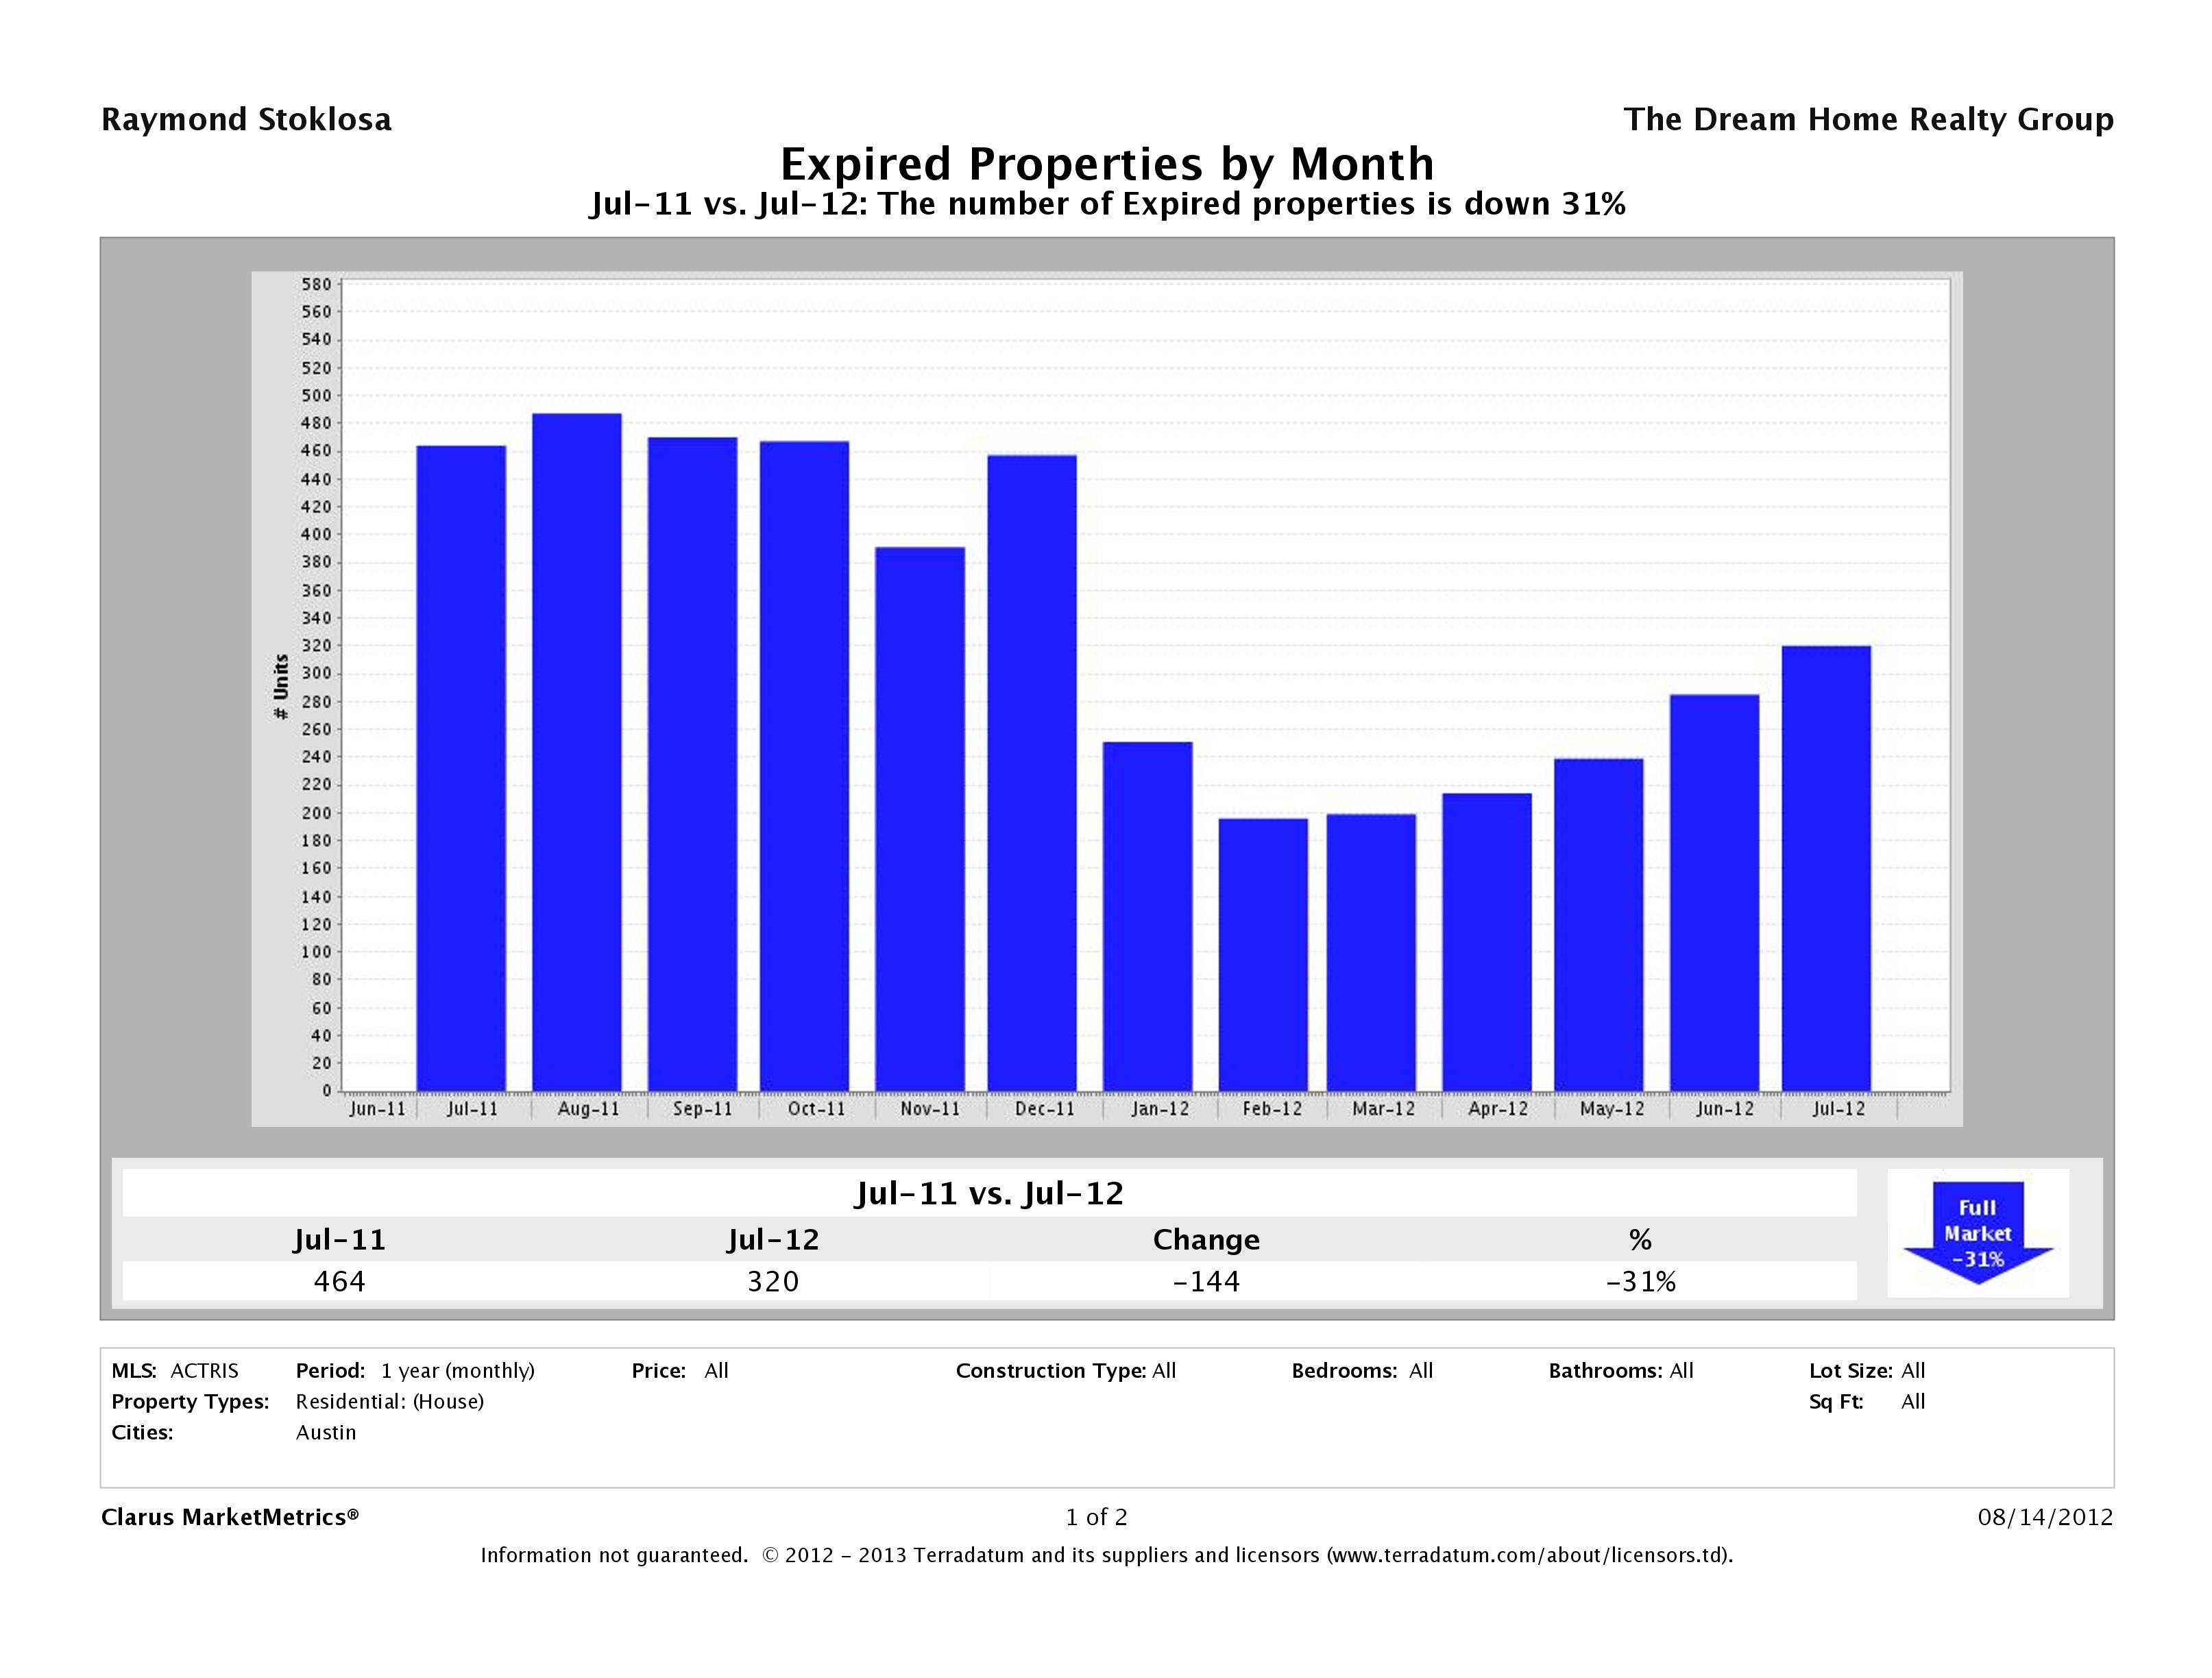
Number of Homes Taken Off the Market Down 31%
With such low inventory levels, homes that might not necessarily have been sold in a normal market are selling causing a 31% decrease in the number of homes that were taken off the market in year over year numbers. In July 2011, 464 homes were taken off the market and in July 2012, 320 were taken off the market.
Did your home expire? Check out our Austin Home Not Selling resources page to find out why.
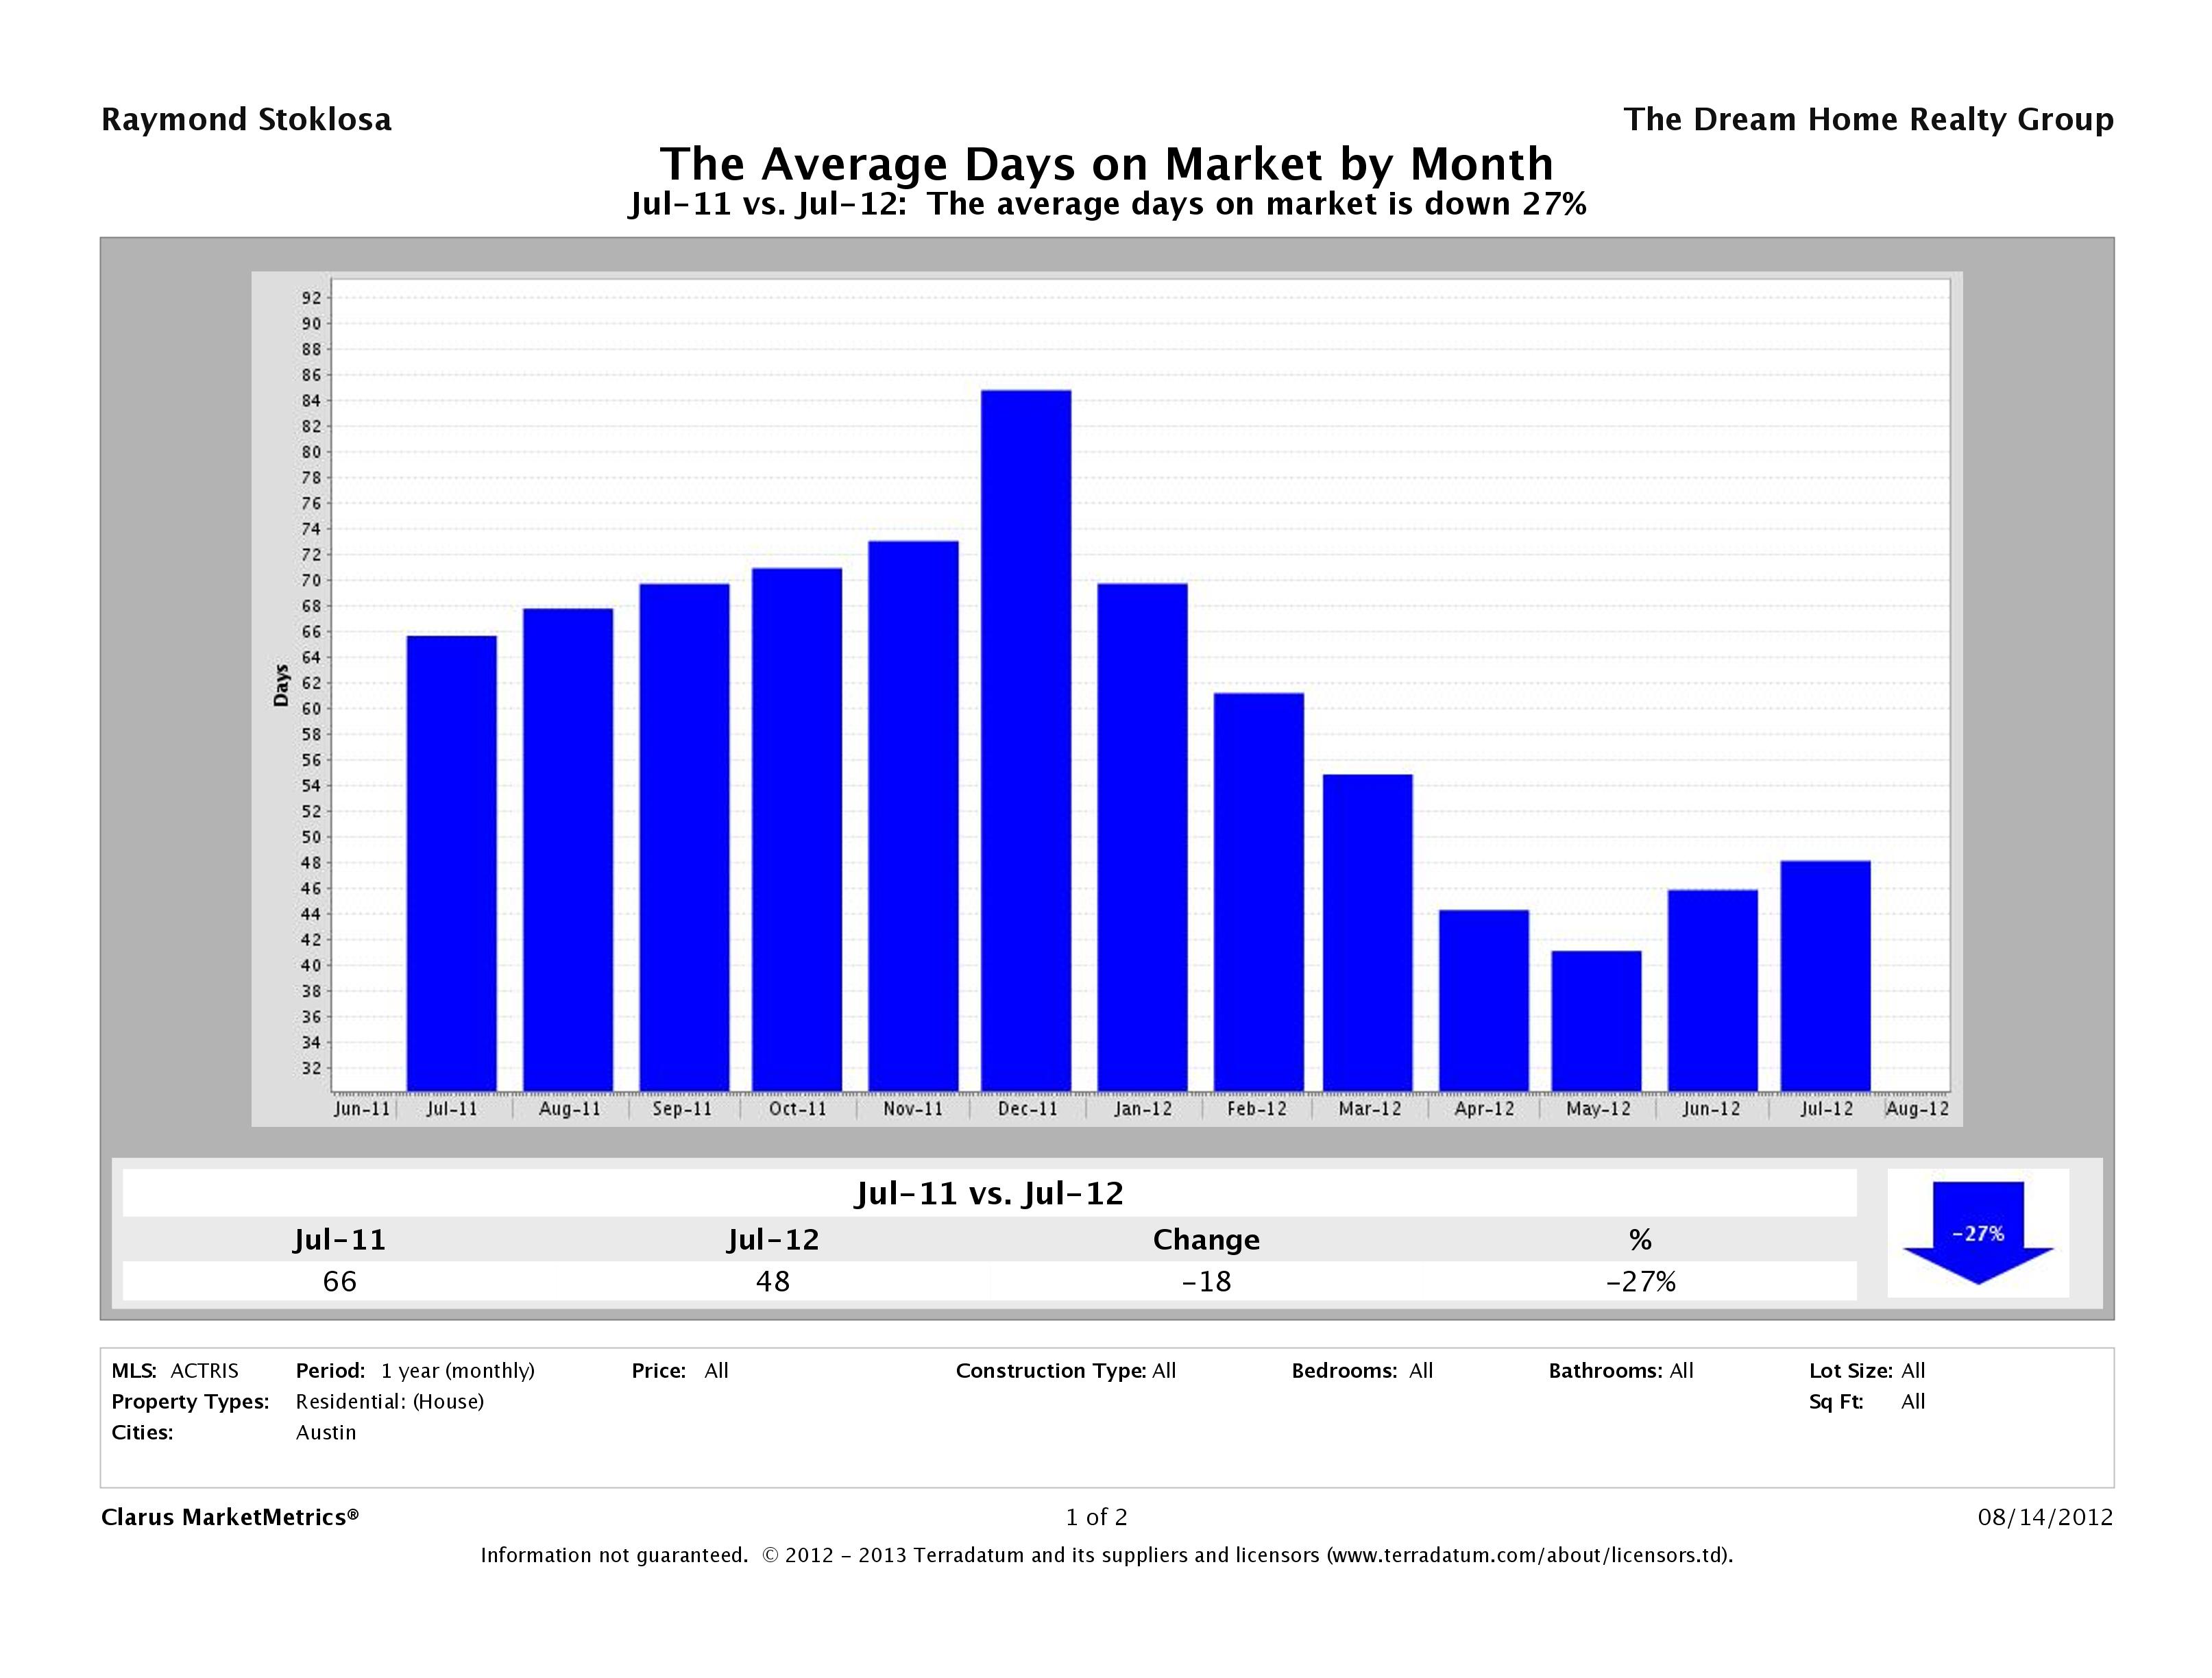
Time to Sell Home in Austin Down 27%
In July 2011, it took, on average, 66 days to sell a home in Austin while in July 2012, it is taking around 48 days. A normal market is considered 90 days, so 48 days is nothing.
Supply is Down 22% and Demand is Up 10%
This month we’ve seen a 22% decrease in supply (number of properties for sale) and a 10% increase in demand (number of sold properties). More evidence more people are moving to Austin than are moving out.
Median for Sale Up 23% vs Median Sold Price Up 3%
This chart compares the Median for Sale Price vs the Median Sold Price to show their relationship. In Austin, we saw a 23% decrease in the median for sale price of a single family home in year over year numbers. The median sold price was also up 3%, increasing by $8,500 in year over year numbers. It seems sellers are asking more for their homes and are getting it.
Source: Clarus Market Metrics, ACTRIS Sold Data
July 2012 Real Estate Price Report – Strictly Numbers
For those of you who prefer to see the actual hard numbers, we’ve included the figures for July 2012 Austin home sales below. The most expensive home that sold in July 2012 was $7,750,000 and the least expensive home sold for $36,500. Homes range in size from 480sqft-10,158sqft with an average size of 2,307sqft. The average price per square foot was $149.31 with the lowest being $24.80/sqft and the highest being $806.45/sqft. It took, on average, 46 days to sell a home in Austin and sellers received, on average, 98.24% of their list prices. The final column (SP/OLP or Sales Price/Original List Price) is skewed because someone must have entered their list price incorrectly. Our system does not allow you to change the price without a record, which is why you see these huge numbers.
| Beds | Baths | SqFt | Listing Price | LP/SqFt | Selling Price | SP/SqFt | SP/LP | SP/OLP | DOM | |
|---|---|---|---|---|---|---|---|---|---|---|
| High | 10 | 7 | 10,158 | $8,900,000 | $926.12 | $7,750,000 | $806.45 | 142.5% | 37500000% | 850 |
| Low | 1 | 1 | 480 | $35,000 | $23.78 | $36,500 | $24.80 | 69.6% | 65.1% | 0 |
| Average | 3 | 2 | 2,307 | $371,979 | $152.50 | $361,377 | $149.31 | 98.24% | 37447.85% | 46 |
| Median | 3 | 2 | 2,069 | $266,750 | $129.22 | $263,500 | $126.98 | 98.5% | 97.7% | 18 |
| Search Criteria | |||
|---|---|---|---|
| Status | Sold | Sold Date | July 2012 |
| Property Type | Single Family Homes | Number Sold | 1,004 |
| Source: | ABoR Sales Data | Area | Austin |
July 2012 Days on Market Report
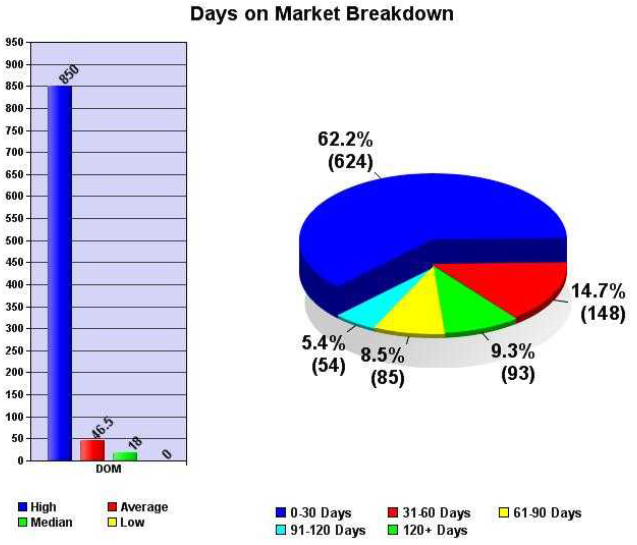
The overwhelming majority (62.15%) of the 1,004 homes that sold in Austin in July 2012 (624) sold in less than 30 days and received, on average, 99.09% of their list prices. As homes stayed on the market for longer, sellers received less than their list prices with homes that have been for sale for 120 days or more receiving, on average, 96.01% of their list prices. The lesson here? Homes that are priced right from the beginning sell quickly and for list price.
| 0-30 Days | 31-60 Days | 61-90 Days | 91-120 Days | 120+ Days | |
|---|---|---|---|---|---|
| No. of Listings | 624 | 148 | 85 | 54 | 93 |
| Breakdown % | 62.15% | 14.74% | 8.47% | 5.38% | 9.26% |
| Avg % SP/LP | 99.08% | 97.52% | 96.7% | 96.77% | 96.01% |
July 2012 Price Analysis Report
The majority of the homes that sold in Austin in July 2012 were priced below $400,000, which is to be expected. You’ll also see that the lower priced homes sold faster than the higher priced homes, which is due largely in part to the increased market for homes below $400k.
| Price Range | Quantity | Average DOM |
|---|---|---|
| $149,999 or under | 130 | 39 |
| $150,000 – $199,999 | 169 | 45 |
| $200,000 – $249,999 | 169 | 38 |
| $250,000 – $299,999 | 107 | 40 |
| $300,000 – $349,999 | 95 | 46 |
| $350,000 – $399,999 | 76 | 36 |
| $400,000 – $449,999 | 62 | 40 |
| $450,000 – $499,999 | 35 | 62 |
| $500,000 – $549,999 | 27 | 67 |
| $550,000 – $599,999 | 28 | 44 |
| $600,000 – $699,999 | 30 | 39 |
| $700,000 – $799,999 | 18 | 134 |
| $800,000 – $899,999 | 13 | 54 |
| $900,000 – $999,999 | 9 | 38 |
| $1,000,000 or over | 36 | 105 |
| Total | 1,004 | 46 |
July 2012 Summary Price Report
Below you’ll find a breakdown of the sales prices of homes in Austin. The average price of a home that sold in July 2012 was $361,377 and the median price was $263,500.
| Summary | List Price | Sale Price |
|---|---|---|
| High | $8,900,000 | $7,750,000 |
| Low | $35,000 | $36,500 |
| Average | $371,979 | $361,377 |
| Median | $266,750 | $263,500 |
Time to Buy? Sell?
As we always say, the best time to buy or sell a home is when you need to buy or sell. If you have a house to sell, selling when its a buyers market may hurt you on the selling end, but you’ll make it up on the buying end. If you’re trying to get into the market for the first time, the only way you’ll know that we’ve “hit bottom” is when its in the rear view mirror. Work with professionals who can help you analyze your financial and lifestyle to determine if now is the right time to buy or sell.
Looking strictly at the numbers, it appears the recommendation for this month is…it’s time to sell. With inventory at its lowest levels we’ve seen in the last 3+ years, dipping even further from last month’s historic low, a home that’s priced right should have no problem finding a buyer. Buyers again came out in record numbers in July 2012. As we head into back to school time, buyers will start to get distracted. If you need to sell, try to get it on the market as soon as possible. For more info about the best home selling program in Austin, visit Sell My Austin Home.
If you’re a buyer, that doesn’t mean sit on the fence. Buyers have negotiated great deals from sellers who need to sell. If you’re looking to get into the market, the best time to find a great deal is any time you can. For more info about our Home Buyer Representation Program, check out Buy a Home in Austin.
Questions About the Austin Real Estate Price Report?
Do you have questions about this Austin Real Estate Price Report? Call us at (512) 827-8323 or email us at info@AustinRealEstateHomesBlog.com and we’ll help you in any way we can. If you’re looking to buy or sell Austin real estate, don’t forget to check out our Buyer Resources and our Seller Resources for more tips.
Leave a Reply