
Eleven Oaks Realty is proud to present their May 2026 Austin Multi Family Real Estate Price Report measuring activity in the Austin multi family market. This report includes all multi family properties (duplex, triplex and quadplex) that sold in May 2026.
May 2026 brought renewed energy to the Austin multi family market, with 25 properties sold, up 25% from April and a striking 127% above the 11 transactions recorded in May 2025. Total sales volume climbed to $13.9 million, more than double last year’s May total of $6.7 million. Median sold price settled at $490,000, down 3.2% year over year from May 2025’s $506,000, reflecting continued downward price pressure even as transaction activity surged.
All data below covers multi family residential properties (duplex, triplex, and quadplex) in the city of Austin. Data is sourced from Realtors Property Resource (RPR) and the Austin Board of REALTORS MLS. Some metrics may vary slightly between sources due to differing methodology; where differences exist, they are noted.
The Austin Multi Family Market is a Buyer's Market
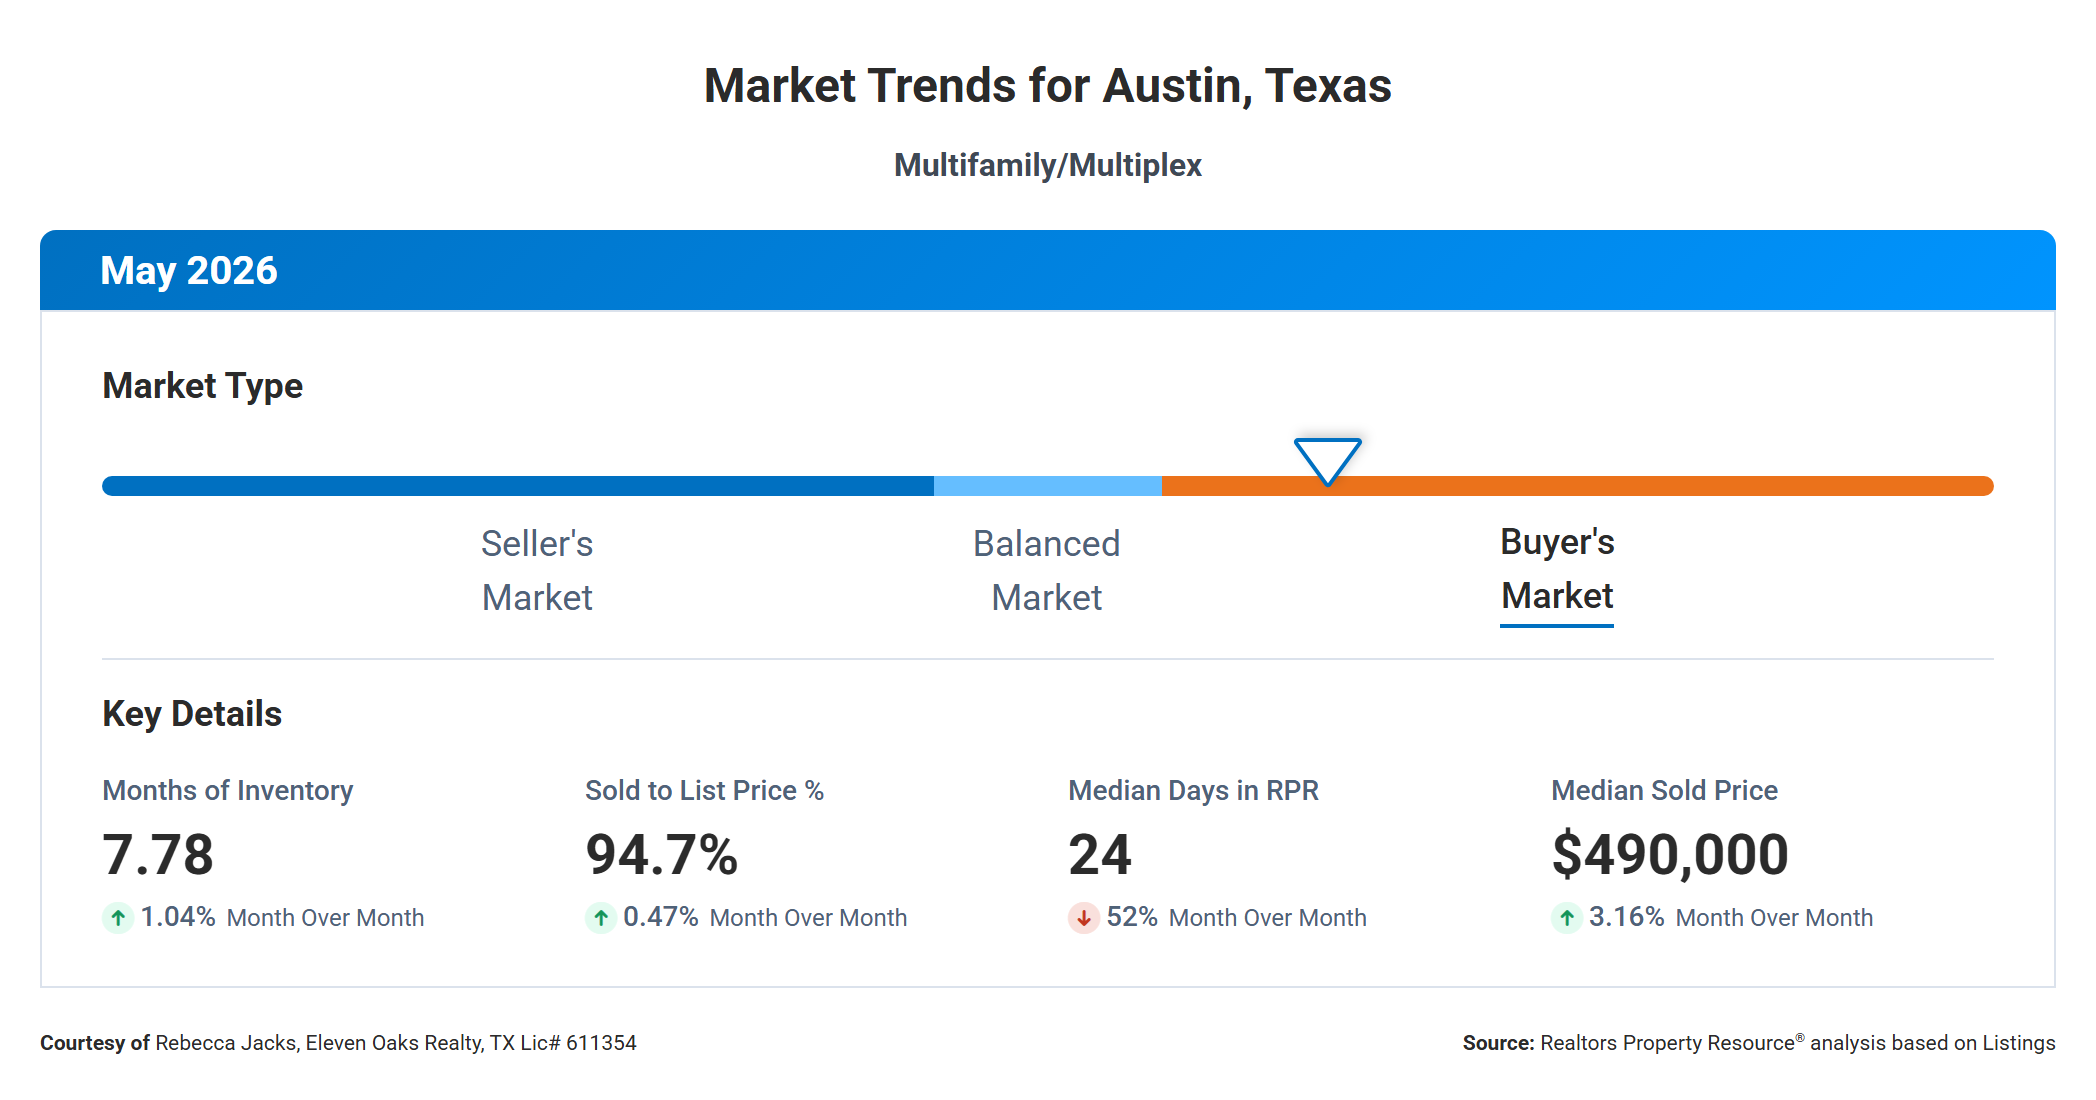
For May 2026, RPR classified the Austin multi family market as a Buyer's Market. With 7.78 months of inventory on hand, conditions favor buyers who have time to compare options and room to negotiate. A balanced market sits at roughly four to six months of supply; anything above six points toward buyer-friendly conditions, and at 7.78, buyers hold a meaningful edge.
The four key metrics on the Market Trends dashboard reinforce this reading. Months of inventory edged up 1% from April's 7.7, holding the market firmly in buyer's territory. Sold to list price came in at 94.7%, a small 0.5% gain from the prior month but still well below the 96-97% range Austin multi family saw in 2024 and early 2025. Median days in RPR dropped sharply, falling 52% month over month to 24 days, suggesting the properties that did sell moved quickly once they connected with the right buyer. Median sold price rose 3.2% to $490,000, snapping back from April's softer $475,000.
Taken together, these signals describe a market with ample inventory, modest pricing pressure, and a clear split between well-priced properties that sell decisively and overpriced ones that sit. For buyers, the data points to real opportunity. For sellers, it underscores how much pricing discipline matters in a market where buyers have choices.
Median Sold Price Down 3.2% Year Over Year
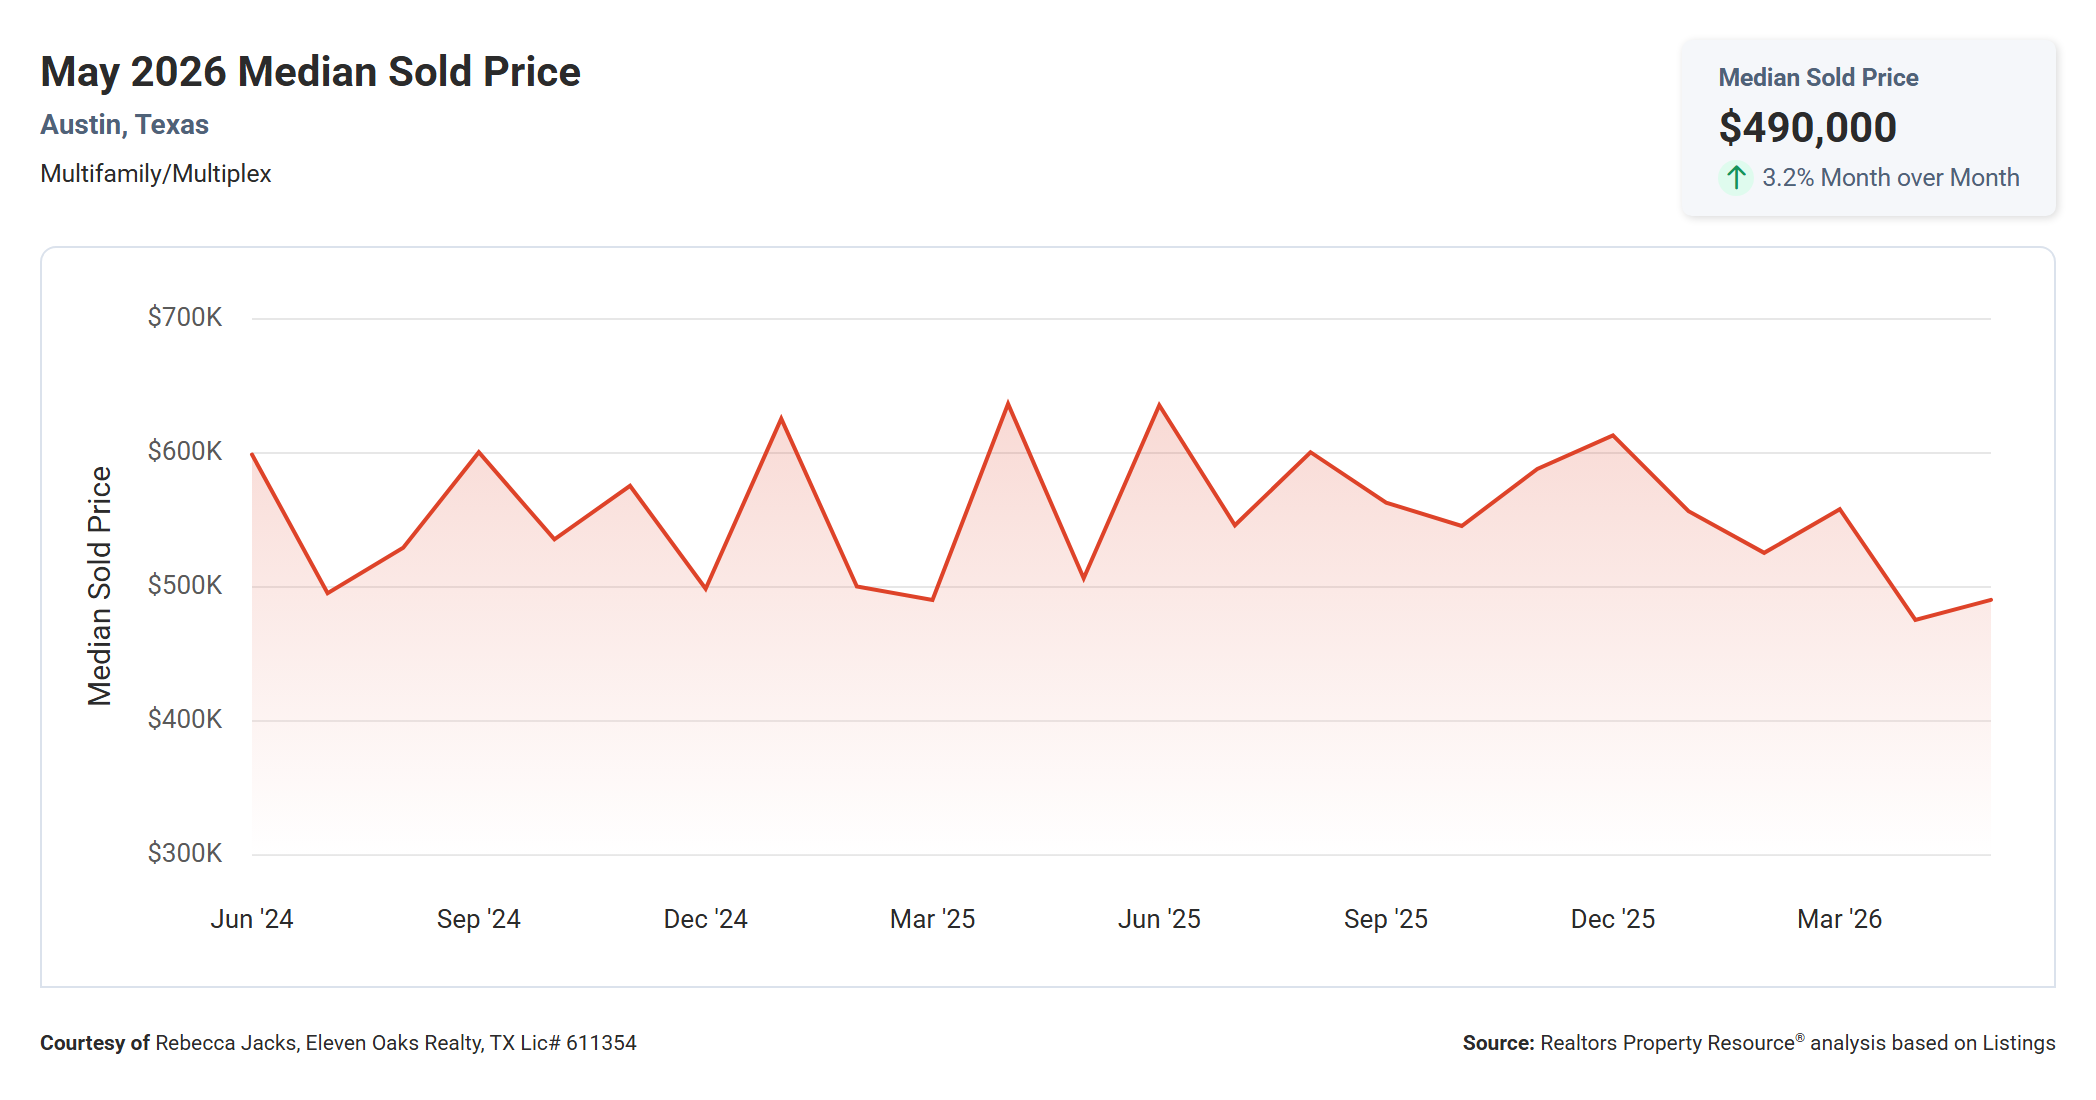
The median sold price for Austin multi family properties in May 2026 was $490,000, up 3.2% from April's $475,000 but down 3.2% from May 2025's $506,000.
The two-year chart tells a clear story of elevated prices followed by a gradual step down. Through 2024 and into mid-2025, the median oscillated between $490,000 and $640,000, with notable peaks in summer and year-end. Since that mid-2025 peak, the trend has tracked lower, with May 2026's $490,000 representing one of the lowest readings in the two-year window. The month-over-month recovery from $475,000 offers a small positive signal, but the broader trajectory remains soft.
For buyers, this means the entry price for a median Austin multi family property today is $16,000 less than a year ago. For sellers, the data is a reminder that listing at 2025 peak prices is unlikely to produce results in today's environment. Properties priced in line with where the market actually is in May 2026 have been closing; those anchored to last year's optimism are not.
Number of Sold Properties Up 127.3% Year Over Year
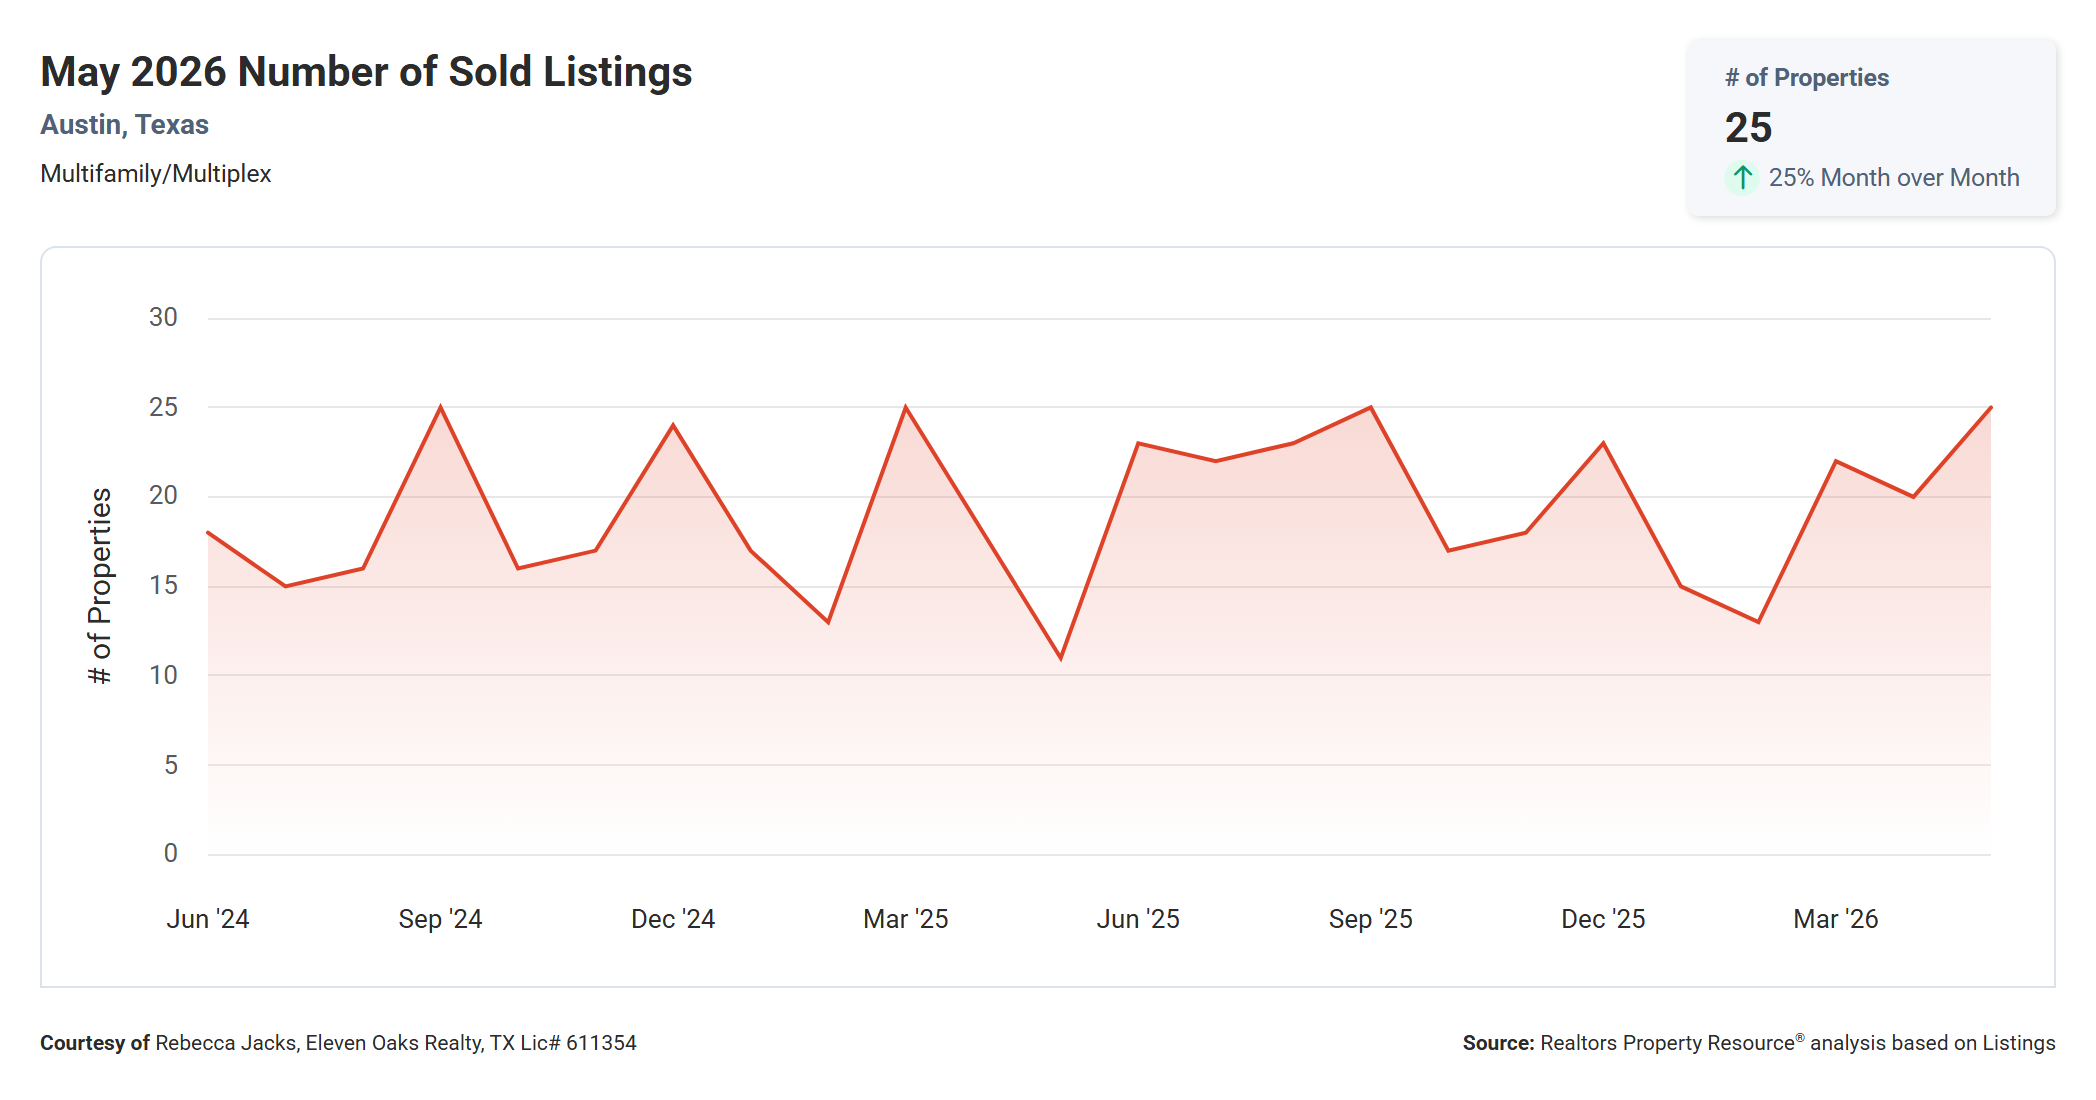
Austin multi family recorded 25 closed sales in May 2026, up 25% from April's 20 and up 127.3% from May 2025's 11 transactions. As with any percentage calculated on a thin sample, this figure should be read in context: May 2025 saw only 11 closings, one of the lower monthly counts in the two-year window, so this year's 25 represents a real rebound even if the percentage overstates the magnitude of the shift.
Looking at the broader two-year trend, transaction counts have generally run in the 15 to 25 range, with occasional dips to 11 and peaks near 25. May 2026 sits at the high end of that range, which is genuinely encouraging for the health of the market. Higher transaction volume benefits everyone: more closed sales provide better comparable data, improve price discovery, and signal that buyers and sellers are finding common ground on price.
A sustained move into the 25-plus range would be a meaningful positive sign for Austin's multi family investment market. One month does not establish a trend, but May's activity is a step in the right direction.
Average Sold to List Price Down 1.8% Year Over Year
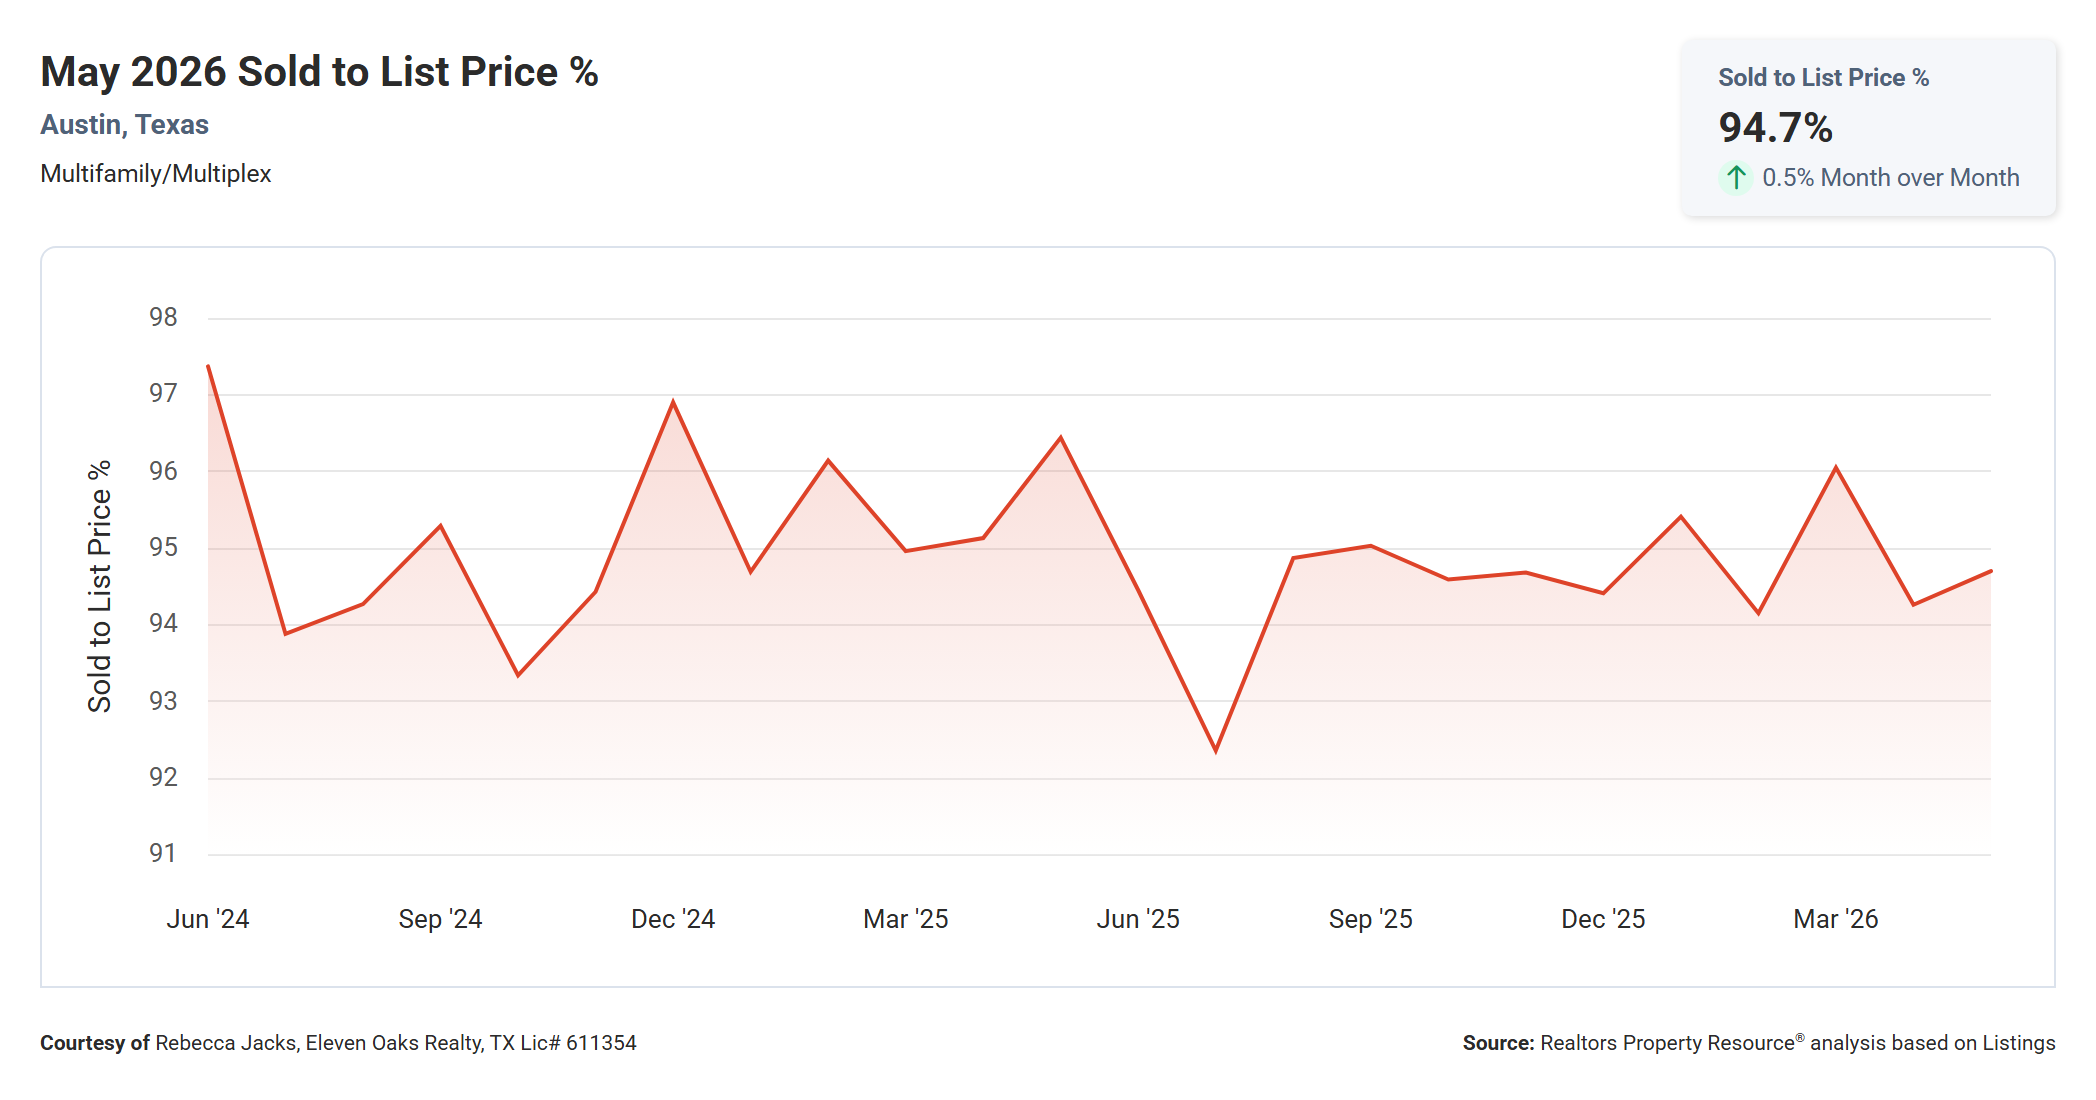
The average sold to list price percentage for Austin multi family properties in May 2026 was 94.7%, up 0.5% from April's 94.26% but down 1.8% from May 2025's 96.44%.
The two-year chart shows a market that has drifted from the high-94% to 97% range in 2024 to a range closer to 93% to 96% over the past year. The current reading of 94.7% sits at the lower end of this newer, more buyer-favorable range. A sold-to-list ratio in the mid-94s means buyers are, on average, purchasing multi family properties at about a 5.3% discount from the final list price.
Keep in mind that sold-to-list price measures discount from the most recent list price, not the original. The MLS data in the By the Numbers section below shows an average CP/OLP% of 91.56%, meaning sellers received only 91.56% of their original asking prices on average. The gap between 94.7% (final list) and 91.56% (original list) tells you that many sellers reduced their price at least once before going under contract. That is useful information for both buyers thinking about how much room remains after a price cut and sellers considering whether to hold firm or reset.
Median Time to Sell Down 35.1% Year Over Year
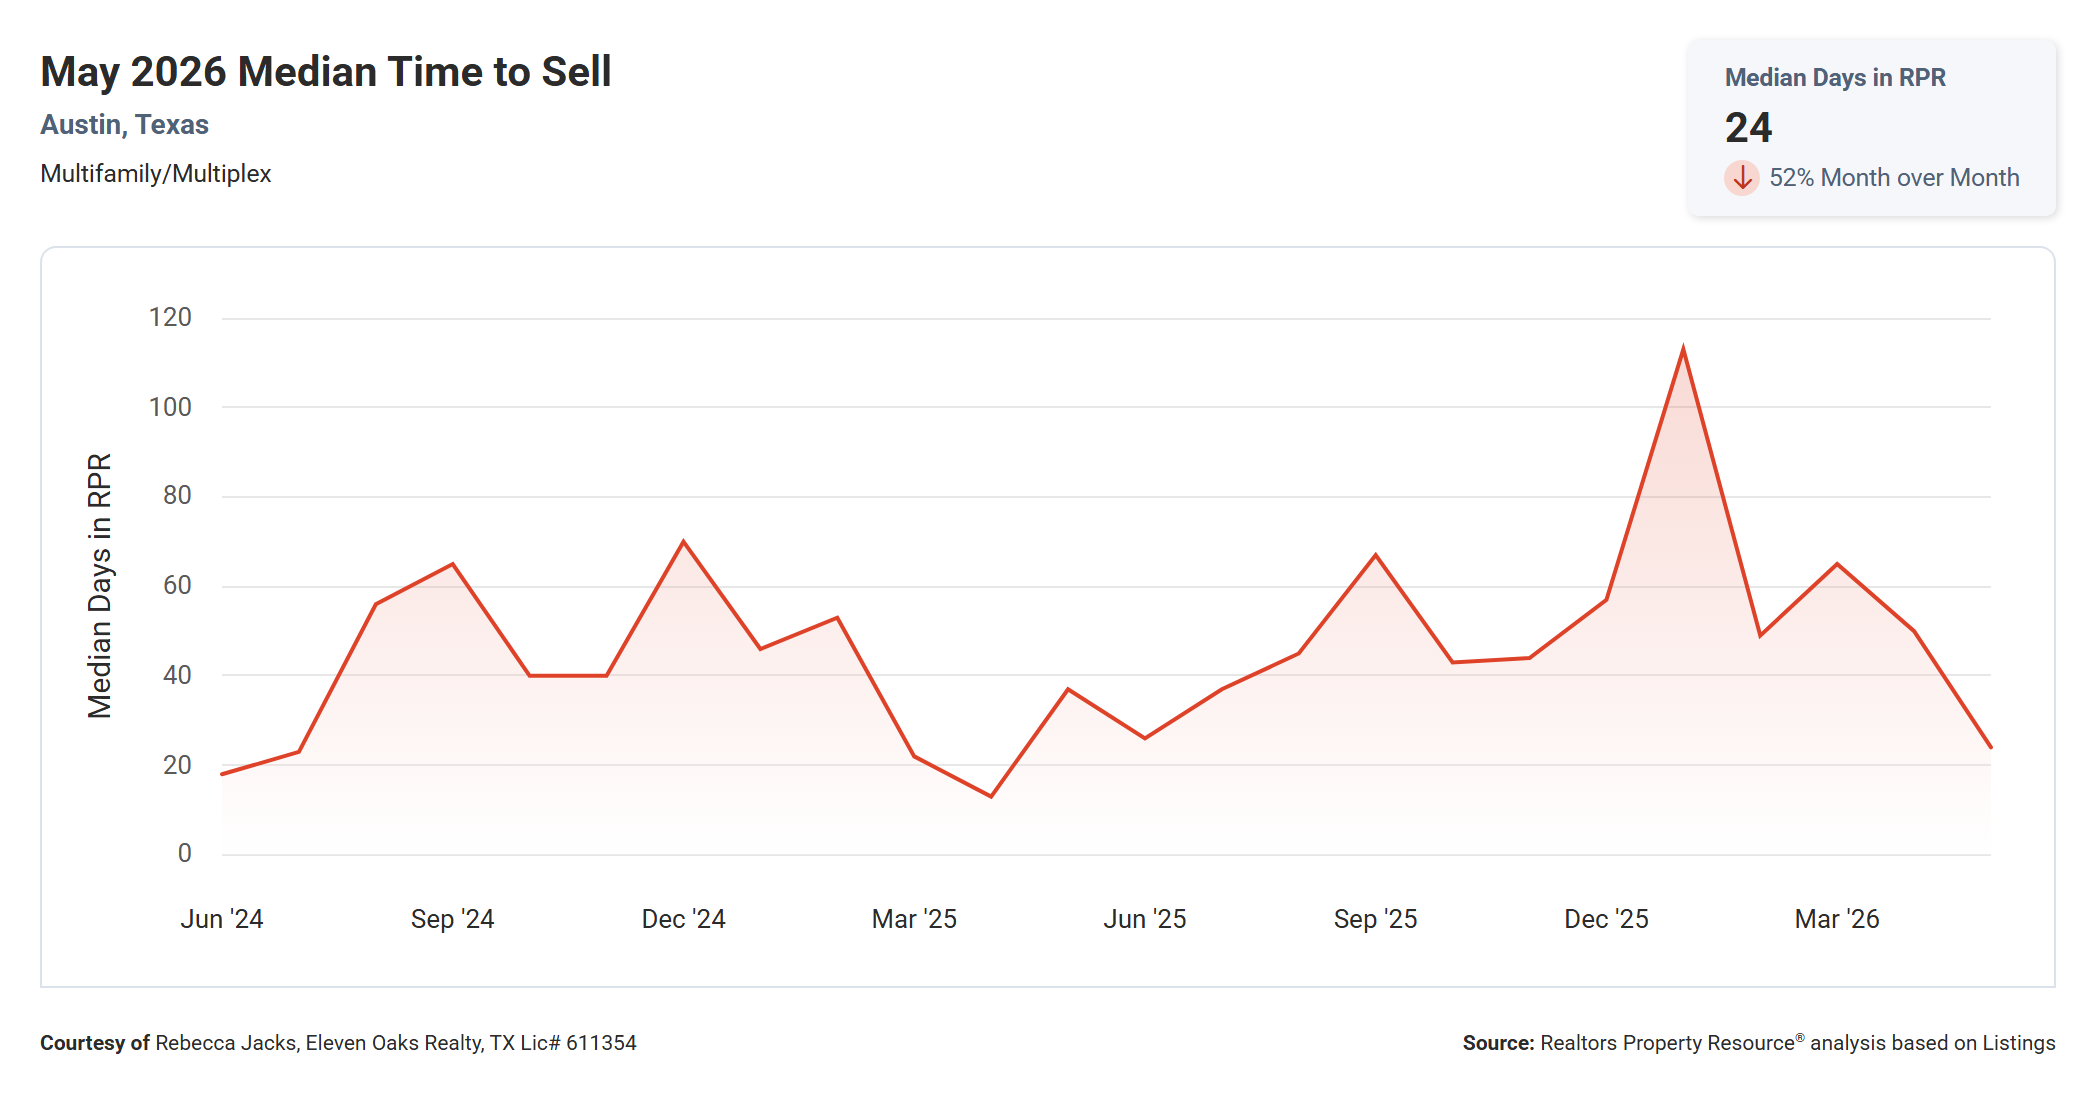
The median time to sell a multi family property in Austin in May 2026 was 24 days, down 52% from April's 50 days and down 35.1% from May 2025's 37 days.
The two-year chart for days on market has been one of the more volatile in this dataset, and that volatility reflects the thin nature of the market. With only 25 transactions in May, a handful of unusually fast or slow closings can move the median significantly. The prior month's spike to 50 days was followed by a sharp snap back to 24, which is consistent with the kind of monthly noise common in a market with this few transactions. Stepping back, the range over two years has been roughly 15 to 115 days, making the median an unreliable metric for short-term trend reading in multi family.
What the 24-day median does suggest is that the properties that sold in May moved relatively quickly once they were priced correctly and connected with motivated buyers. In a Buyer's Market with nearly 8 months of supply, a well-priced multi family property can still attract attention. The key word is "well-priced," as the data throughout this report consistently reinforces.
Median Price Per Square Foot Down 11.0% Year Over Year
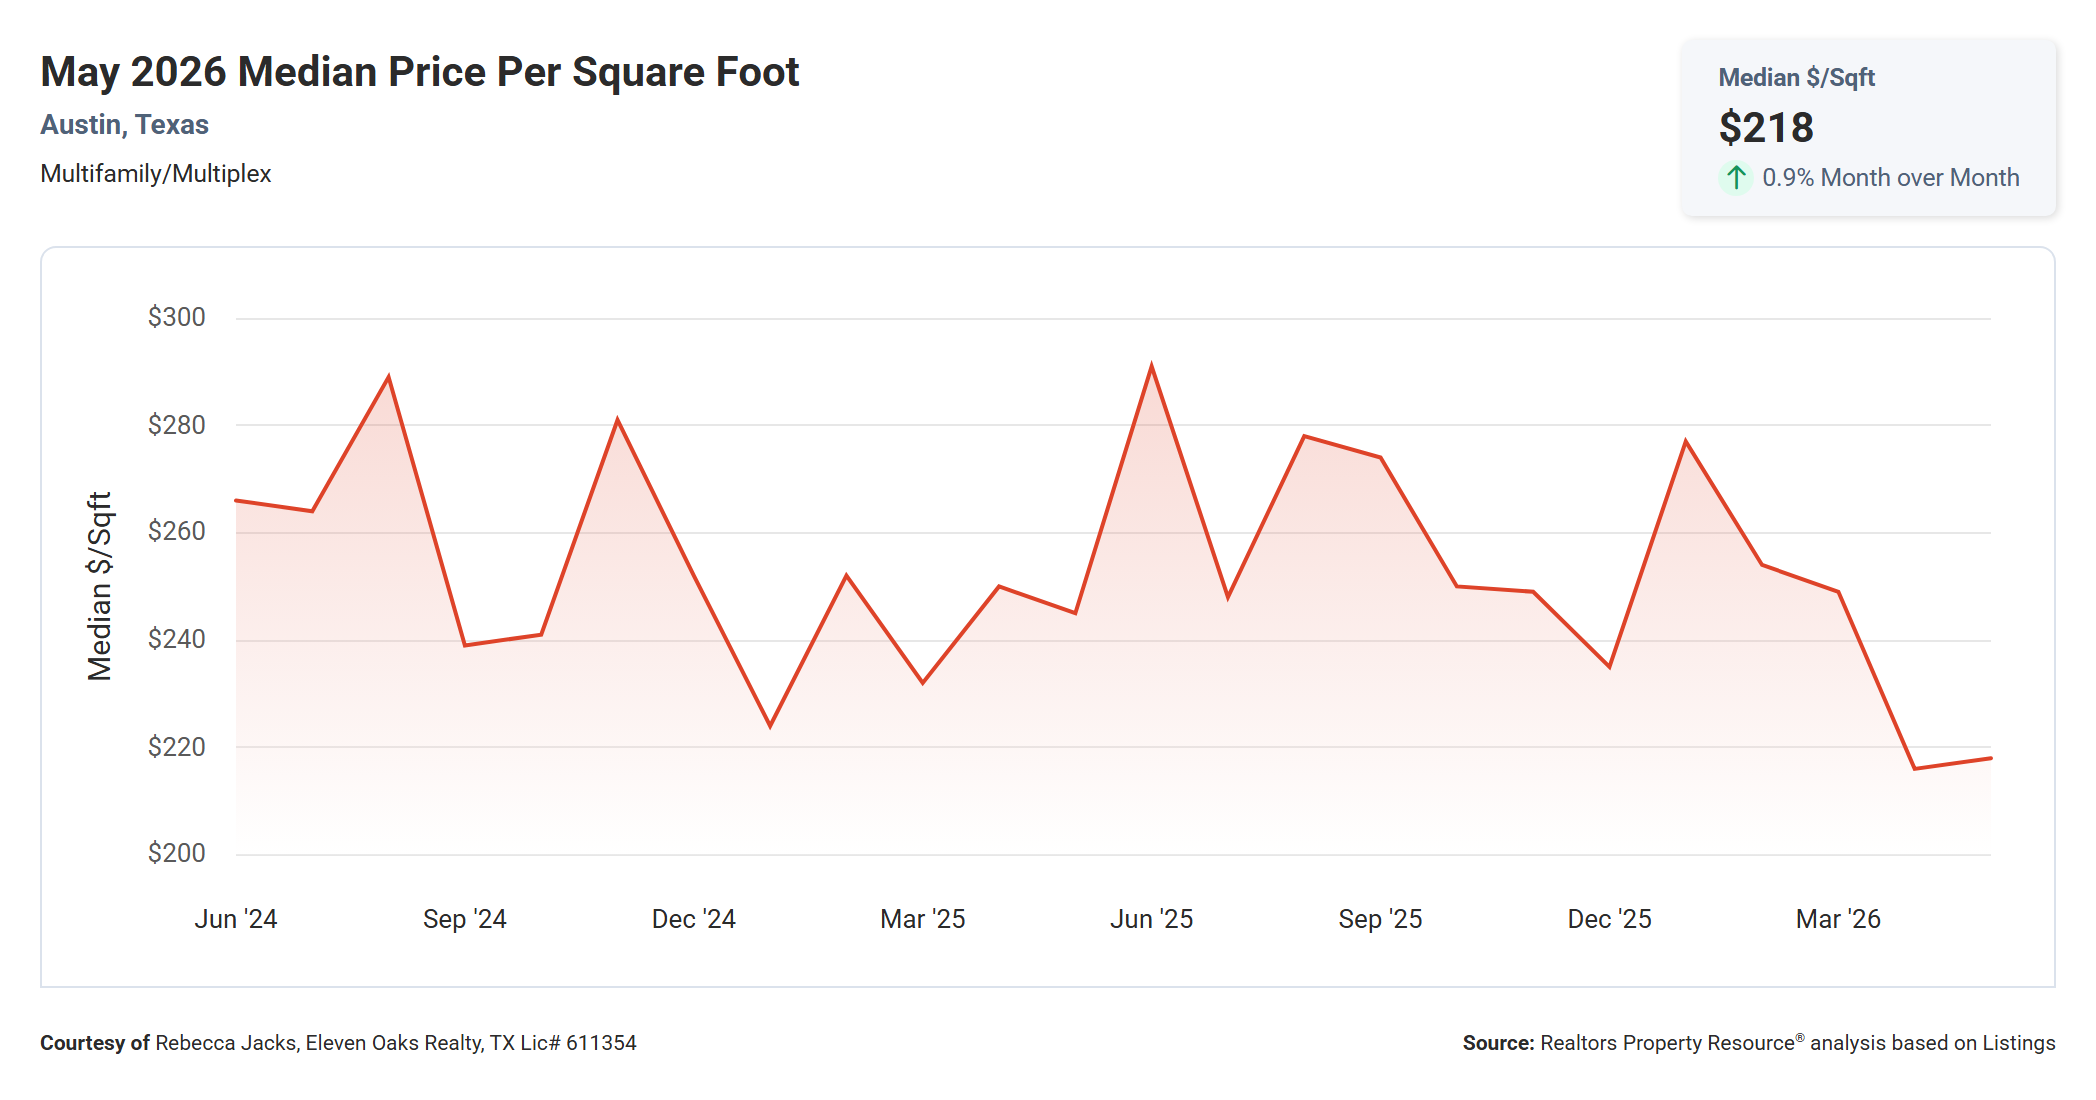
The median price per square foot for Austin multi family properties in May 2026 was $218, up 0.9% from April's $216 but down 11.0% from May 2025's $245.
The two-year chart shows a sustained downward trend in price per square foot that is more consistent than the median sold price chart, which can be skewed by property mix. In mid-2024, the median per square foot regularly reached $260 to $290. By early 2025, readings were trending in the $230 to $250 range. May 2026's $218 is among the lowest readings in the full two-year window, reinforcing that per-square-foot value in Austin multi family has meaningfully compressed over the past year.
For investors running underwriting on Austin multi family acquisitions, this is an important anchor. At $218 per square foot, buyers are getting meaningfully more space per dollar than they were 12 months ago. For sellers, the $27 per square foot decline from a year ago translates to roughly $55,000 less on a 2,000-square-foot property, a significant pricing recalibration that needs to be reflected in current expectations.
Total Sales Volume Up 107.8% Year Over Year
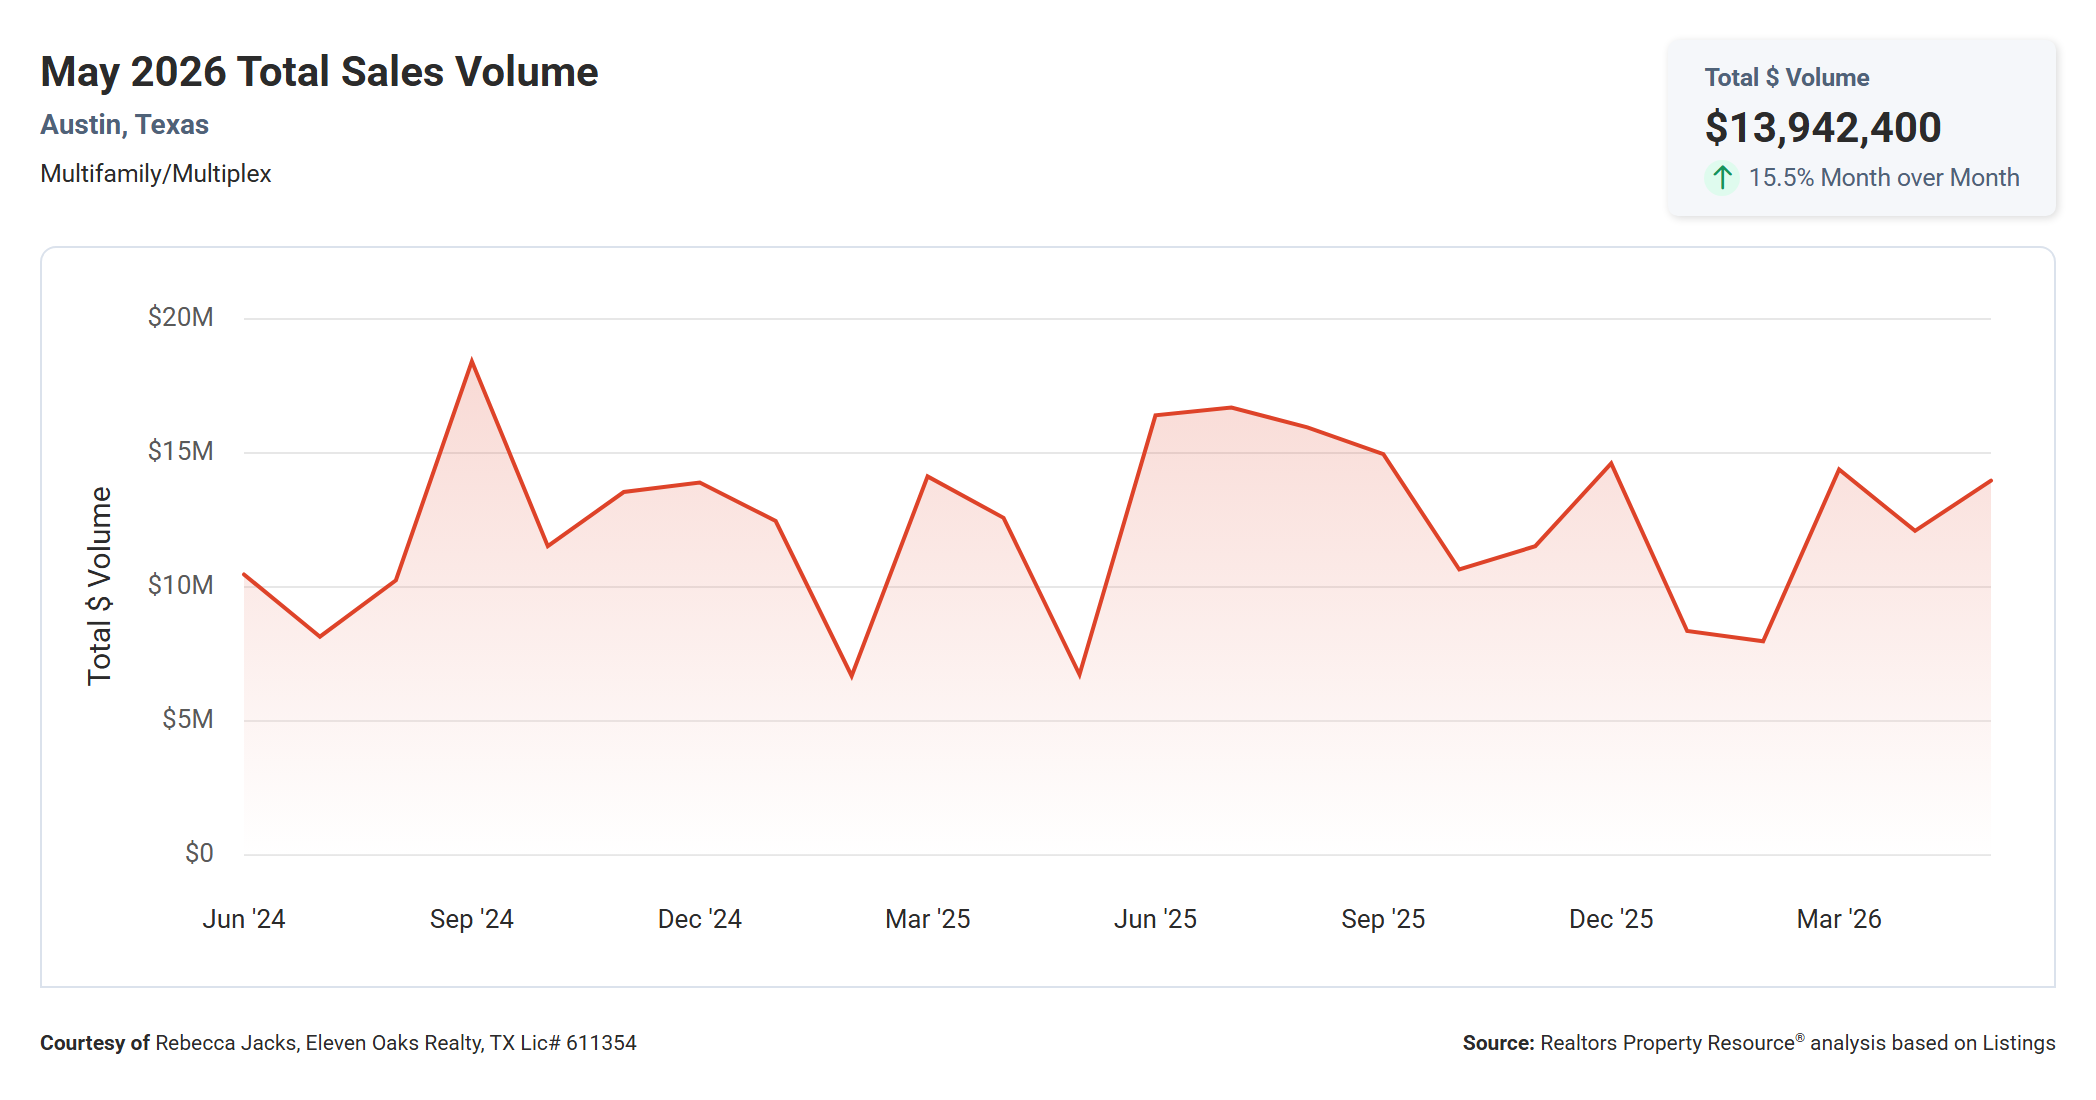
Total sales volume for Austin multi family properties in May 2026 was $13,942,400, up 15.5% from April's $12,070,000 and up 107.8% from May 2025's $6,710,000. As with the sold property count, the year-over-year gain is amplified by a weak comparison base: May 2025's 11 closings at a $506,000 median produced an unusually low volume figure.
More transactions at similar price points naturally produce a much larger total, and in a small market, one or two high-value closings can swing the monthly total by millions. May 2026 included at least one sale above $1.2 million, which lifted the average meaningfully above the median. Total sales volume should always be read alongside transaction count in multi family, since the two together give a more accurate picture than either alone.
The two-year trend has been choppy, ranging from under $7 million in slow months to nearly $19 million at the peak. May 2026's $13.9 million sits in the middle of that range and is consistent with a market operating at a moderate pace. Sustained volume above $12 million per month would indicate a healthy transaction environment for Austin multi family.
Months Supply of Inventory Down 20.4% Year Over Year
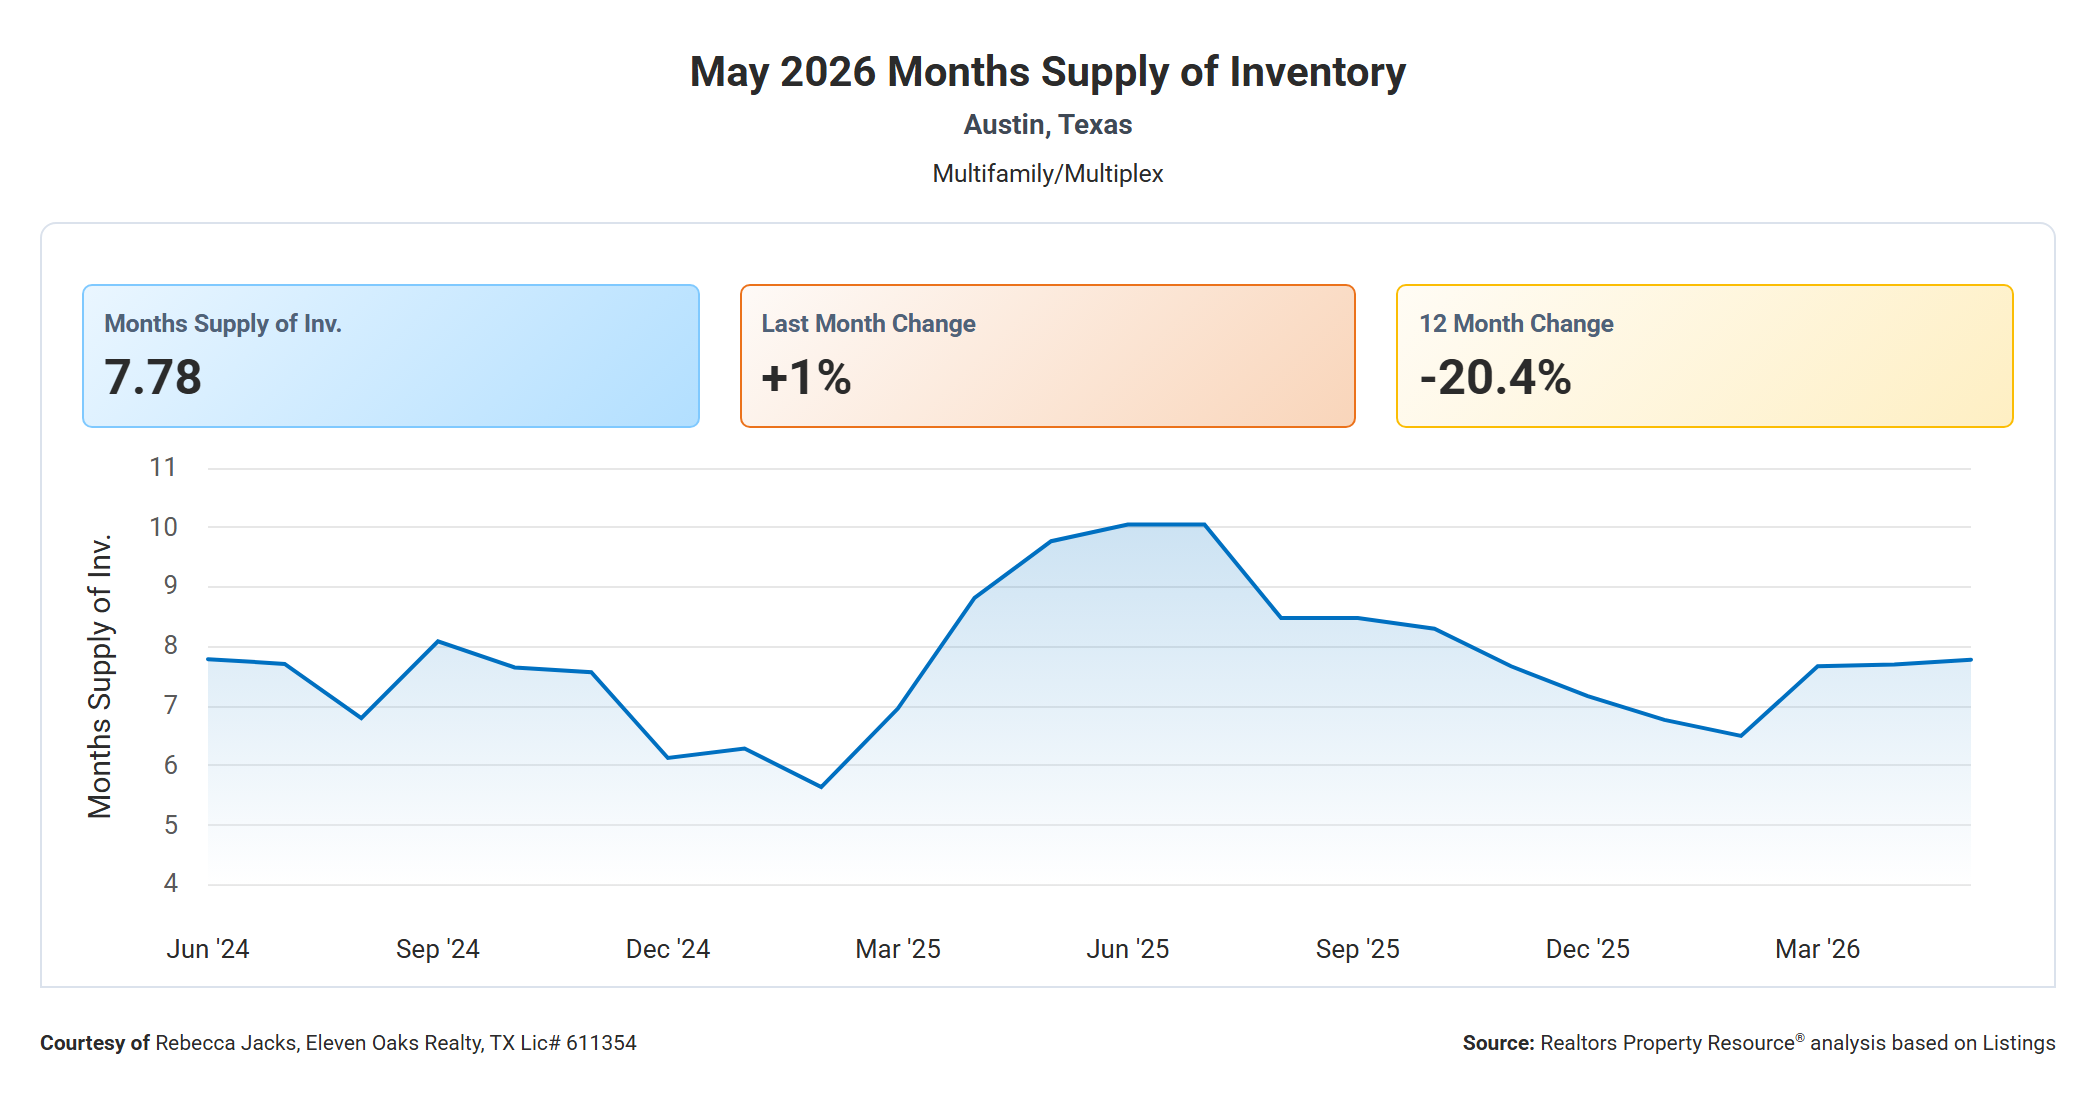
Months supply of inventory for Austin multi family properties in May 2026 was 7.78, up 1% from April's 7.7 and down 20.4% from May 2025's 9.77 months.
This is one of the more meaningful data points in the report. The year-over-year drop from 9.77 to 7.78 months of supply tells you the inventory glut of mid-2025 has partially unwound. At the peak in 2025, Austin multi family was carrying close to 10 months of supply, giving buyers enormous leverage. Today's 7.78 is still firmly in Buyer's Market territory, but it represents a real step toward a more balanced market.
For buyers, 7.78 months of supply still provides time to be selective. You are not competing in a sprint; you have the ability to evaluate multiple options, conduct thorough due diligence, and negotiate. For sellers, the improvement from 9.77 to 7.78 is encouraging, but conditions still favor buyers, and pricing aggressively in hopes of recapturing 2025 highs will likely result in a longer, more frustrating sales process. The trend is moving in the right direction for sellers, but patience and realistic pricing remain the formula for a successful close.
New Pending Listings Essentially Flat Year Over Year
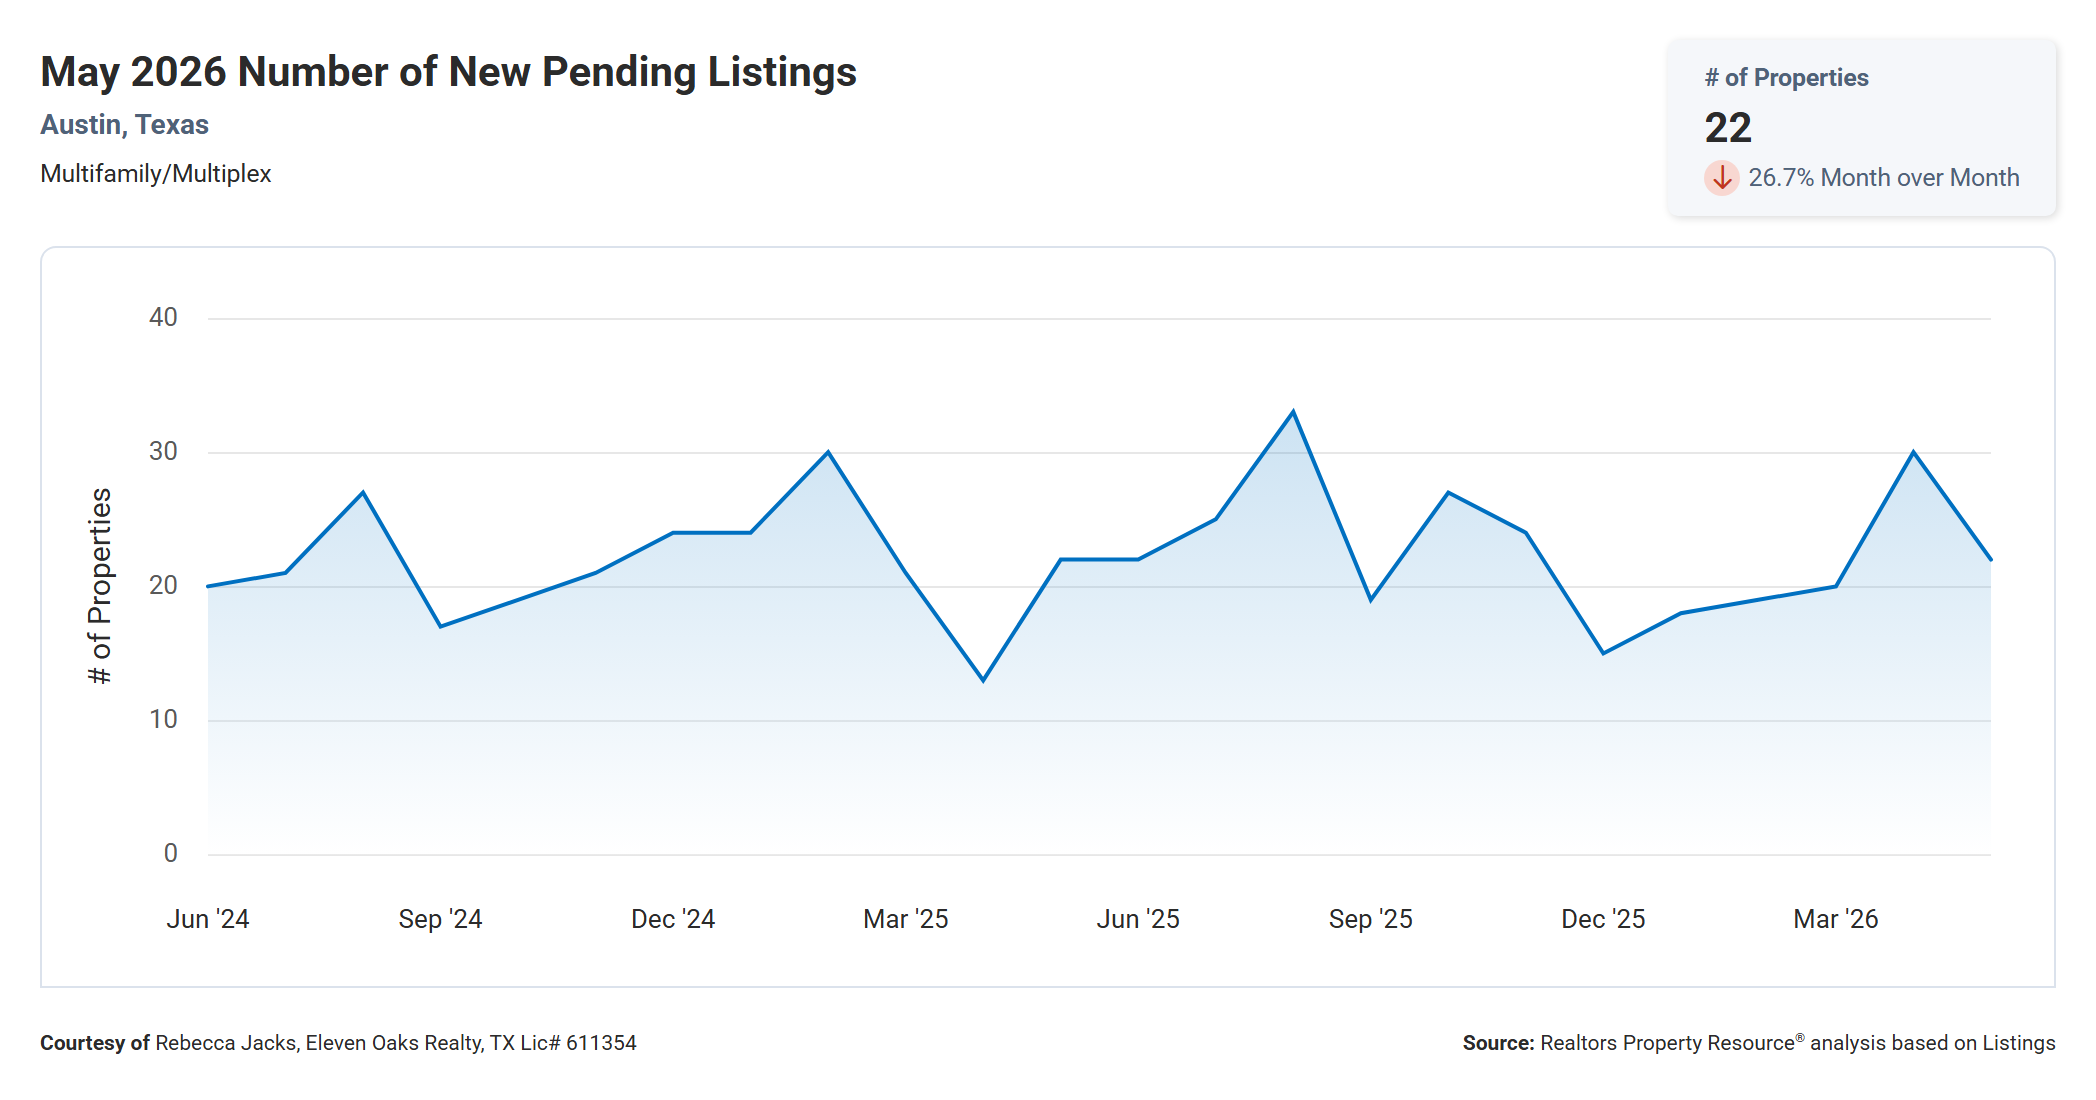
New pending listings for Austin multi family properties in May 2026 were 22, down 26.7% from April's 30 but essentially flat compared to May 2025's 22.
The month-over-month drop of 26.7% stands out, but context helps: April's 30 pending listings was an unusually high reading relative to the broader two-year range. May's 22 is more consistent with the typical range of 19 to 27 that has characterized this metric over the past year. Looking at the two-year chart, pending activity has generally tracked between 15 and 33, with the current reading sitting in the middle of that range.
The year-over-year flat reading on pending listings, combined with the 127% increase in actual closings, may suggest some inventory that had been sitting in pending status from prior months finally cleared in May. Multi family contracts can take longer to close than typical residential transactions due to due diligence complexity, lender requirements for investment properties, and occasional re-trades. When pending counts hold steady while closings surge, it often signals that previously pending deals are getting to the finish line.
Median Active List Price Down 3.2% Year Over Year
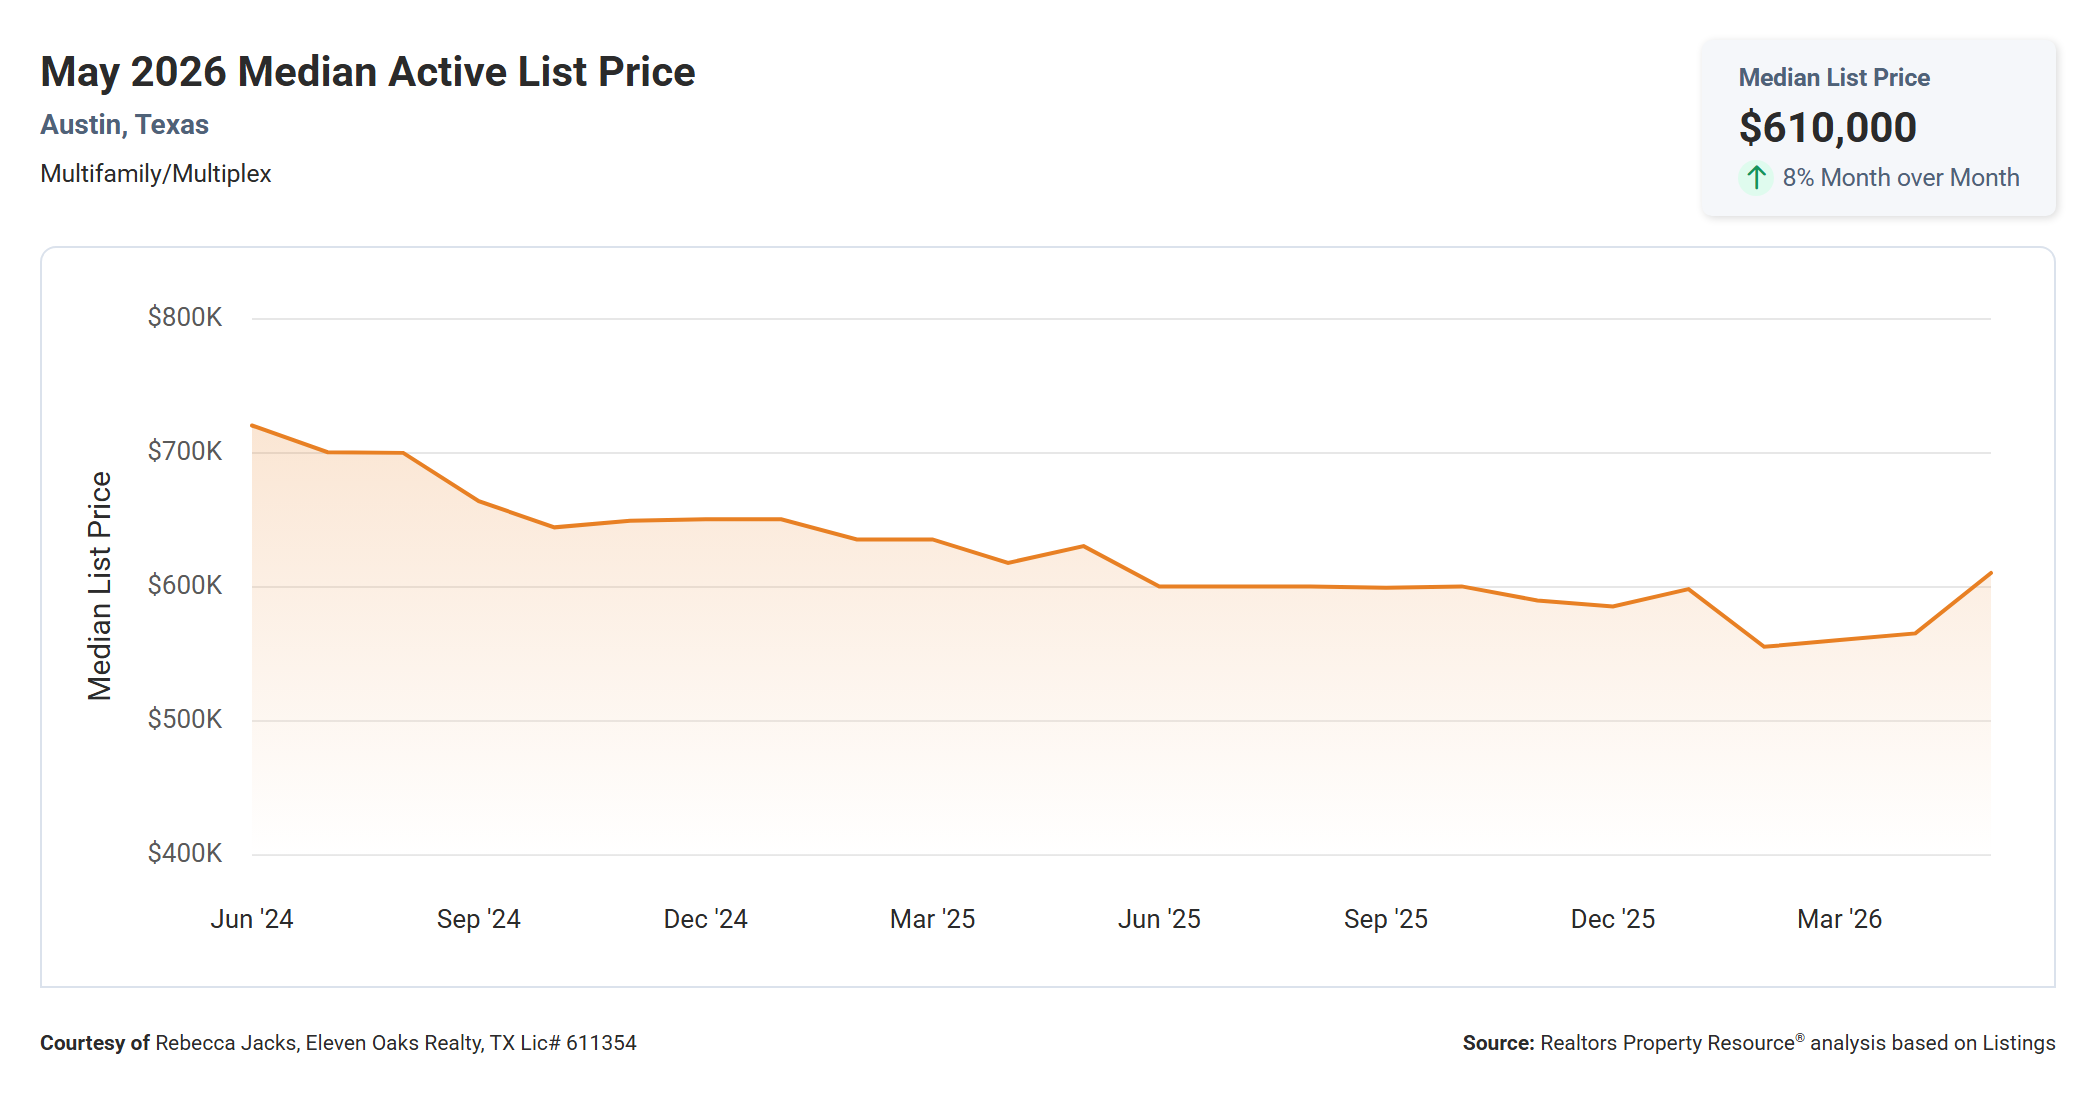
The median active list price for Austin multi family properties in May 2026 was $610,000, up 8% from April's $565,000 but down 3.2% from May 2025's $630,000.
The 8% month-over-month jump in asking prices warrants attention. A meaningful increase in median list price over a single month typically means either higher-priced properties entered the market or lower-priced properties were removed or sold. In a thin market like Austin multi family, a handful of newly listed properties in the $700,000 to $900,000 range is enough to shift the median. This should not be read as seller pricing power returning; it is more likely a shift in the composition of what is currently listed.
The two-year chart on active list price tells a story of steady decline. The median list price was consistently above $700,000 in mid-2024 and has trended down to its current level, which sits $120,000 below where it started. Today's $610,000 active list price running $120,000 above the $490,000 median sold price suggests that asking prices still run ahead of where buyers are willing to close. That gap is likely to compress further if sales continue at recent pace.
New Listings Down 23% Year Over Year
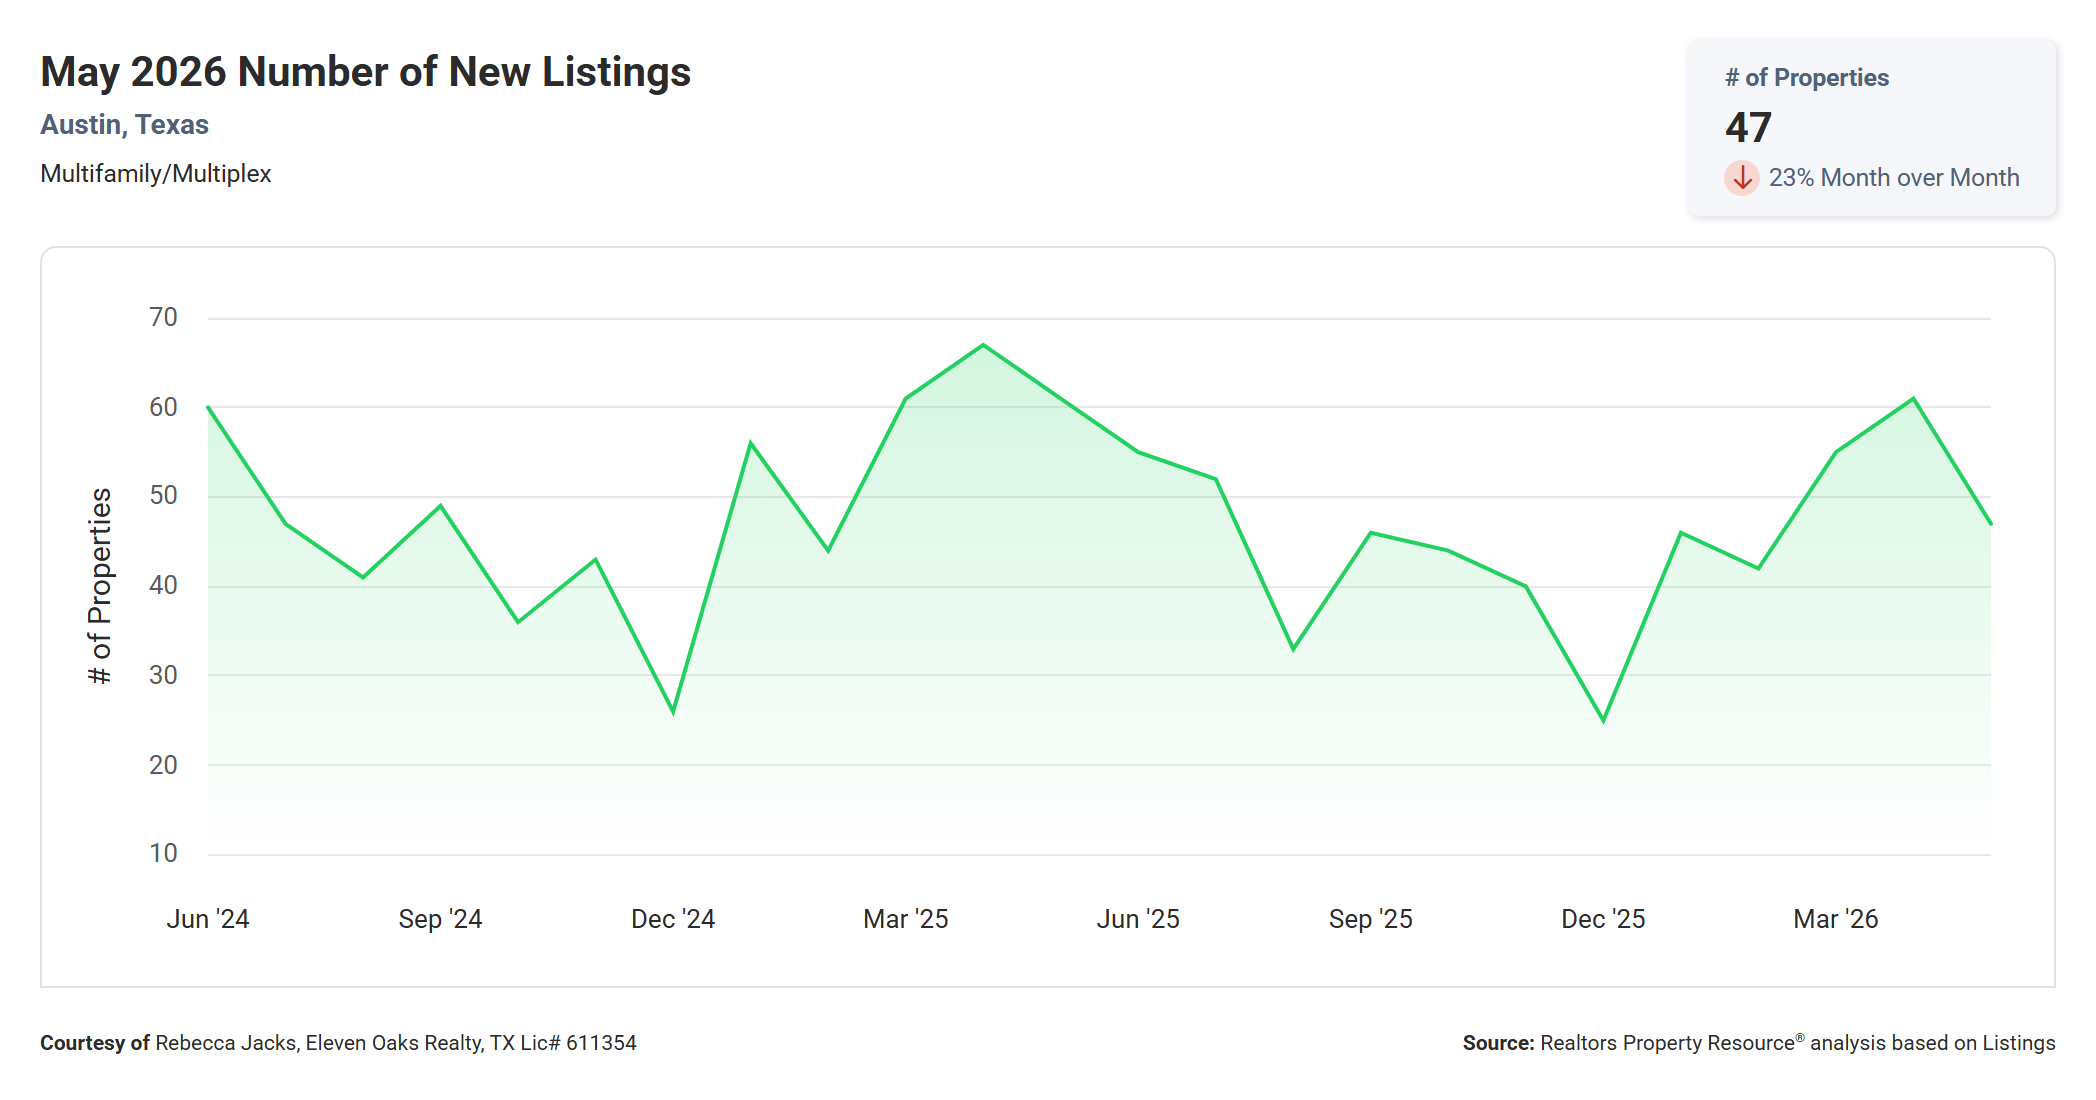
New listings for Austin multi family properties in May 2026 were 47, down 23% from April's 61 and down 23% from May 2025's 61.
The 23% year-over-year decline in new supply entering the market is a notable signal. Fewer sellers bringing properties to market can over time help reduce the overall inventory build-up, which is part of why months of supply has come down from the 9.77 peak in May 2025. The two-year chart shows that new listings peaked in spring 2025, reaching 67 in April 2025, and have since pulled back. May 2026's 47 is at the lower end of the recent range.
For buyers, fewer new listings entering the market means the pipeline of fresh options will be somewhat more limited than it was a year ago. Monitoring the market regularly is worthwhile, as new multi family properties are not coming to market at the pace they were in 2024 and 2025. For sellers considering whether to list, reduced competition from new supply is a relative positive, but it does not override the broader buyer-favorable conditions created by 7.78 months of total inventory.
Active Listings Down 16.7% Year Over Year
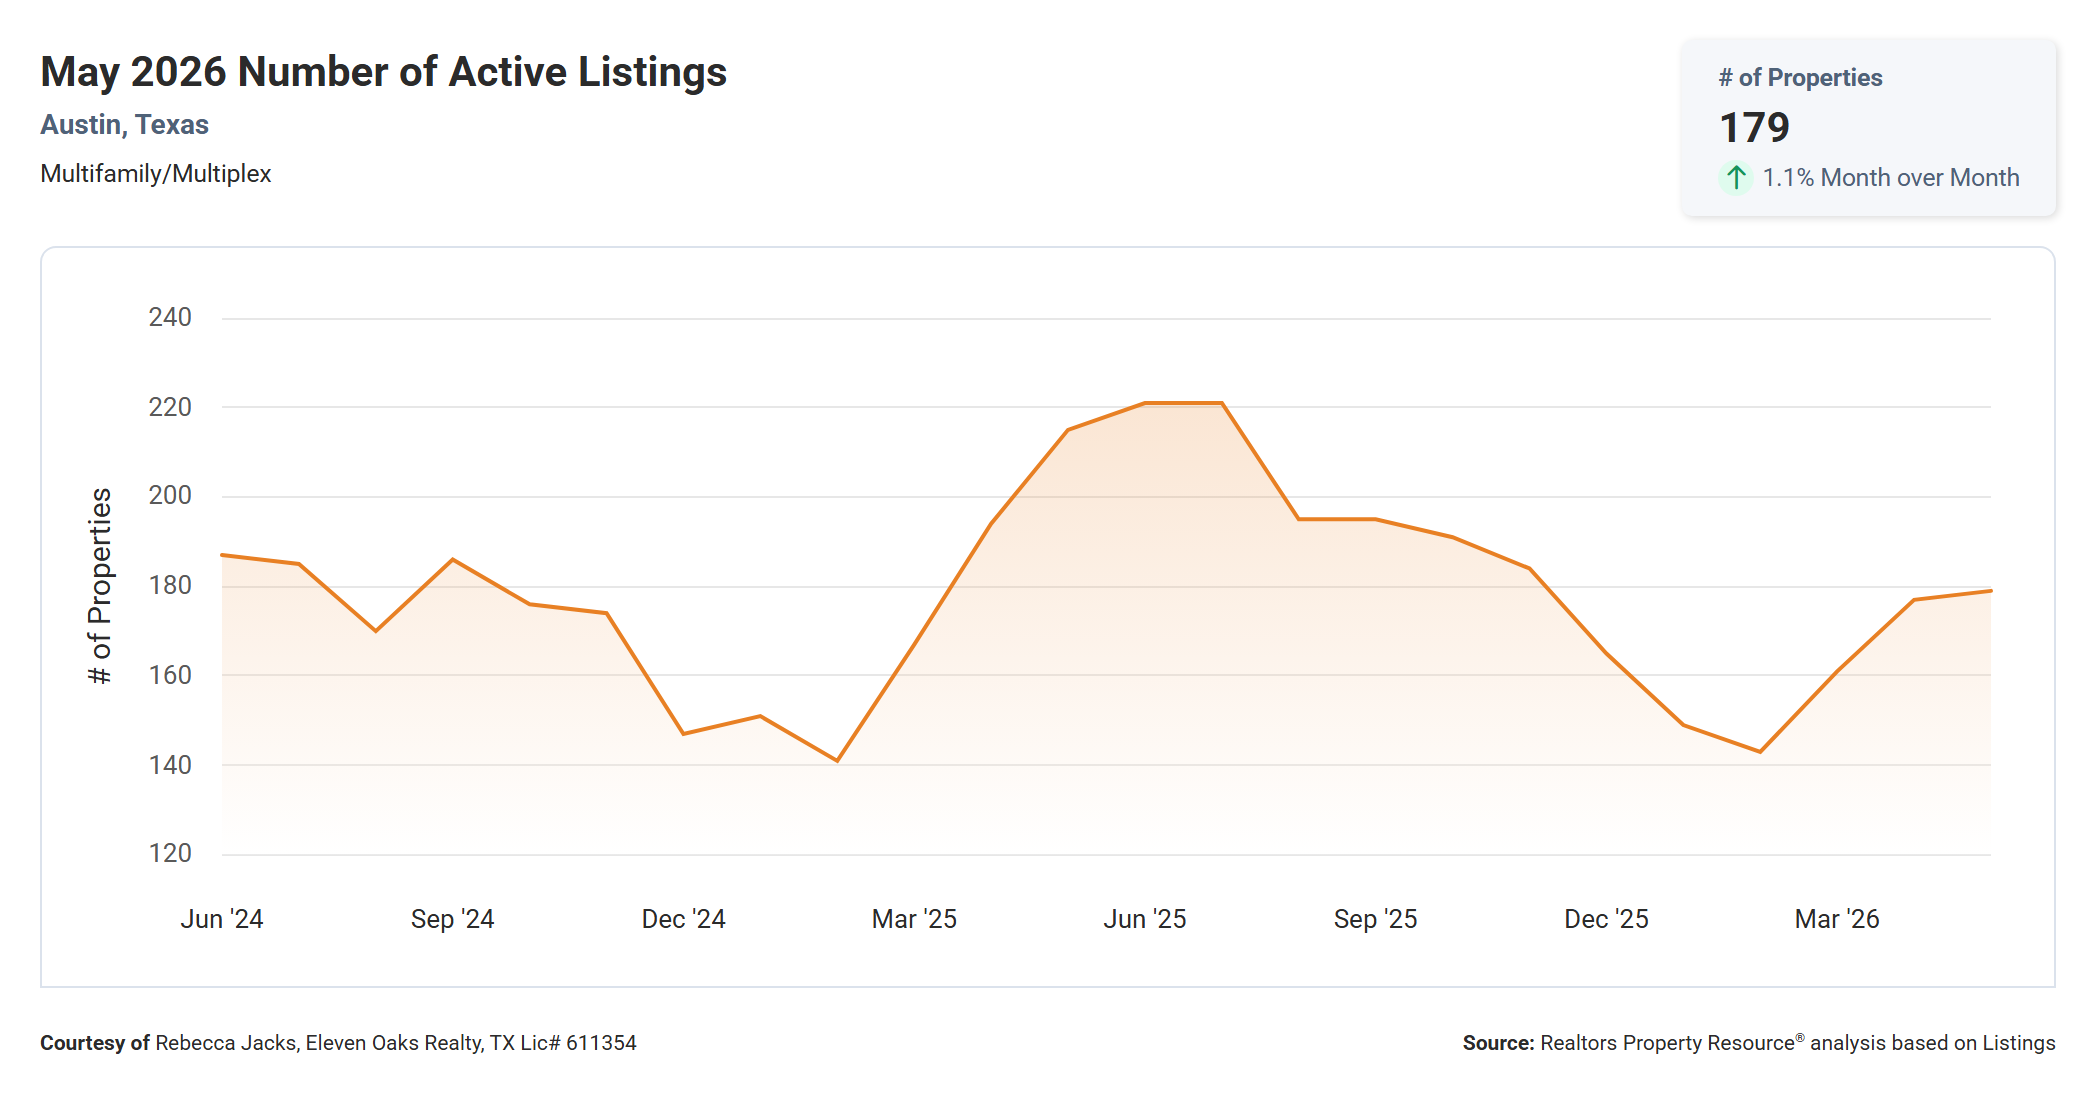
Active listings for Austin multi family properties in May 2026 were 179, up 1.1% from April's 177 and down 16.7% from May 2025's 215.
The year-over-year decline from 215 to 179 active listings marks one of the clearest positive trends in this report for sellers. The market has absorbed or expired a meaningful number of listings since May 2025, reducing the total pool of competition buyers can choose from. The two-year chart shows active listings peaked around 220 in mid-2025 and have since tracked lower, with May 2026 approaching levels not seen since the beginning of the two-year window.
The modest 1.1% month-over-month increase from 177 to 179 is essentially flat, suggesting supply is neither growing nor contracting meaningfully in the near term. Watching whether this trend continues downward through the summer will be important: sustained declines in active listings combined with stable or rising transaction counts would be a genuine sign that the supply-demand balance is improving for sellers.
May 2026 Austin Multi Family Real Estate by the Numbers
The table below is pulled directly from the Austin Board of REALTORS MLS statistics for May 2026 and covers 27 closed multi family transactions (duplex, triplex, and quadplex) in the city of Austin.
| Min | Max | Avg | Median | |
|---|---|---|---|---|
| Sq Ft | 1,718 | 3,968 | 2,439 | 2,053 |
| Lot Sq Ft | 7,144 | 31,755 | 11,036 | 8,729 |
| Acres | 0.164 | 0.729 | 0.253 | 0.200 |
| List Price | $320,000 | $1,249,000 | $574,678 | $499,900 |
| LP/Sq Ft | $113.41 | $488.51 | $247.14 | $224.06 |
| Close Price | $220,000 | $1,240,000 | $548,543 | $490,000 |
| CP/Sq Ft | $98.29 | $474.14 | $236.25 | $212.47 |
| CP/LP% | 69.00% | 102.00% | 94.70% | 97.00% |
| CP/OLP% | 63.00% | 102.00% | 91.56% | 94.00% |
| ADOM | 2 | 454 | 82 | 29 |
The most expensive multi family property that sold in May 2026 sold for $1,240,000 and the least expensive sold for $220,000. Properties ranged in size from 1,718 to 3,968 square feet with an average size of 2,439 square feet. The average price per square foot was $236.25 with the lowest being $98.29 per square foot and the highest being $474.14 per square foot. It took, on average, 82 days to sell a multi family property in Austin and sellers received, on average, 91.56% of their original list prices.
The $58,543 gap between the average close price ($548,543) and the median close price ($490,000) deserves a closer look. In a 27-transaction market, one or two high-value sales have an outsized effect on the average. May 2026 included at least one sale above $1.2 million, which pulled the average well above the median. The median is the more reliable figure for understanding the typical transaction, but the average matters for investors evaluating the upper end of the market.
The CP/OLP% average of 91.56% is the most important pricing signal in this section for sellers. Sellers in May 2026 received, on average, just 91.56 cents on every dollar of their original asking price. The 94.70% CP/LP% tells you sellers recovered some ground after reducing their list price, but the original pricing was off enough that an average 8.44% reduction was required before buyers were willing to engage. The ADOM range tells the same story in sharper terms: the fastest transaction in May closed in 2 days and the slowest took 454. That gap almost certainly comes down to pricing.
What This Means for Multi Family Buyers
Austin multi family prices are down 3.2% year over year, which in dollar terms means the median property costs $16,000 less than it did in May 2025. The price per square foot decline is even more significant, falling $27 per square foot from $245 to $218 over the past year. For a property around 2,000 square feet, that translates to roughly $54,000 more value for the same price compared to a year ago. Buyers entering the market today are benefiting from a pricing reset that is real and measurable.
The negotiation landscape remains buyer-friendly. With 7.78 months of supply on the market, 179 active listings to evaluate, and an average CP/OLP% of 91.56%, buyers have both options and room to negotiate. The sold-to-list ratio of 94.7% suggests the typical deal is closing at roughly a 5% discount from the final list price. Properties that have already had a price cut may have less room remaining, but freshly listed properties at or above the current median ask of $610,000 are likely to see negotiation toward the $490,000 to $550,000 range based on recent closing data.
Multi family buyers in Austin are typically investors looking at income-producing properties. In that context, the lower purchase prices today relative to 2024 and 2025 can improve cap rates and return on equity, assuming rents hold or recover. The same downward price pressure that creates opportunity on the buy side also reflects what has happened to the rental market, so investors should underwrite conservatively on both the purchase price and the rent projection.
Looking at the near-term data, the trend in active listings (-16.7% YoY) and new listings (-23% YoY) suggests the market is gradually tightening on the supply side. If this continues, the buyer advantage may shrink over the next six to twelve months. Buyers who are financially ready today and willing to invest the due diligence time are operating in a window that may not stay as wide.
What This Means for Multi Family Sellers
The good news for sellers is that transaction activity has improved significantly. May 2026's 25 closed sales is the highest count in recent months and well above the 11 transactions that characterized the market a year ago. More buyers closing means more market liquidity, and liquidity makes it easier to price a property with confidence and find a qualified buyer.
Competition among sellers remains meaningful. With 179 active listings and 47 new listings entering the market in May alone, buyers have no shortage of options to compare your property against. At the current pace of 25 sales per month, absorbing 179 listings would take roughly seven months, which explains precisely why RPR classified this as a Buyer's Market.
The CP/OLP% data is the most important pricing signal in this report for sellers. The sellers who received 91.56% of their original asking price are the ones who eventually closed. A property priced at market reality can sell quickly and cleanly; one priced at aspirational 2025 levels can sit for more than a year before either closing at a much lower price or expiring. The ADOM maximum of 454 days in May's dataset is a concrete illustration of what overpricing costs.
The downward trend in active listings from 215 to 179 over the past year and the decline in new supply entering the market are both favorable signals looking ahead. If buyer demand holds at May's level while new supply stays constrained, the inventory advantage buyers currently enjoy will gradually erode. The sellers who will benefit most from this shift are the ones who list at the right price, sell in the current market, and move on rather than waiting for a recovery that may be measured in quarters rather than months.
Market Summary and Outlook
May 2026 delivered one of the more encouraging multi family months Austin has seen in over a year. Transaction count jumped 25% from April and more than doubled from May 2025, total sales volume crossed $13.9 million, and median days on market fell sharply to 24. At the same time, median sold price slipped 3.2% year over year to $490,000 and price per square foot hit one of its lowest readings in two years. It was a month where activity improved while prices continued their reset, which is a reasonable description of what a market looks like as it finds a new equilibrium.
The year-over-year comparisons in this report require careful reading because May 2025 was a particularly thin month with only 11 closings. The 127% jump in sold properties and 108% jump in total volume are accurate but reflect a weak comparison base as much as they reflect genuine strength. The metrics less affected by that comparison, such as median sold price (-3.2%), price per square foot (-11%), active listings (-16.7%), and months of supply (-20.4%), give a cleaner read on where the market stands. Those figures collectively describe a market that has more supply than demand and is repricing to find balance.
The key variable for the coming months is whether transaction volume can sustain at or above 20 to 25 sales per month while new listings continue to moderate. May's combination of 47 new listings and 25 closings means the market absorbed more than half of new supply, which is a healthier ratio than much of 2025. If that pattern holds through summer, months of supply could continue declining from 7.78 toward the six-month balanced market threshold. That outcome is not guaranteed, but the data points in that direction.
Austin's multi family market has real long-term underpinnings. The metro area's population growth, job base, and housing shortage at the single-family level all create sustained demand for rental housing. The current period of elevated inventory and compressed prices is best understood as a correction from the overheated conditions of 2021 to 2023 rather than a structural decline. For patient investors with a three-to-five year horizon, the combination of lower prices, more negotiating room, and improving supply dynamics makes today's market worth serious attention.
Action Items for Multi Family Buyers
- Use the 7.78 months of supply as your negotiating baseline: with nearly eight months of inventory, asking for a 5% to 8% discount from the list price is well-supported by current market data, and you should enter negotiations with that expectation set.
- Pay close attention to the original list price history before making an offer: the 8.44% average gap between original list price and final close price means a property that has already been reduced may have less room to negotiate, while a fresh listing at or above $610,000 likely has more.
- Run your underwriting at $218 per square foot on the purchase side and stress-test your assumptions at $200 per square foot to account for further softening, since the two-year trend in price per square foot has been consistently downward.
- Target properties that have been on market for 30 to 90 days: the median ADOM is 29 and the average is 82, meaning properties in that window are at the point where sellers are motivated but not yet in a distressed situation, which tends to produce the most efficient negotiations.
- Get pre-approved and complete as much due diligence preparation as possible now, because the trend in active listings and new supply suggests the buyer advantage may begin to shrink over the next several months as supply and demand move closer to balance.
- Watch the pending-to-closed ratio each month: May's 22 new pending listings against 25 closings suggests some older pending contracts are clearing; if new pending counts begin rising consistently above 25, it will be a signal that buyer demand is picking up and your window for patient negotiation is narrowing.
Action Items for Multi Family Sellers
- Price at or near the $490,000 to $499,900 range if you want to be in the zone where the market is actually clearing, since the median sold price is $490,000 and the median list price of $499,900 suggests properties at this threshold are moving.
- Treat the CP/OLP% average of 91.56% as a ceiling test for your pricing: if your ask is more than 8% above what you would accept at closing, you are likely to accumulate days on market and ultimately close at a lower price than if you had listed correctly from the start.
- Prepare for a 29-to-82-day timeline: the median time to sell is 29 days but the average is 82, so plan your transition accordingly and do not assume a fast sale is guaranteed even in a well-priced situation.
- Monitor new listing activity each week: with only 47 new listings entering the market in May, down 23% from a year ago, reduced competition is one of the few current advantages sellers have, and staying aware of new competition in your price range will help you adjust quickly if that changes.
- Invest in professional photography and detailed disclosure documentation upfront: with buyers comparing 179 active listings and having the luxury of time, presentation and transparency are meaningful differentiators that can help your property move faster than the competition.
- Consider listing before summer ends if your situation allows: the trend toward lower active inventory and improving transaction volume suggests conditions may tighten through late 2026, but waiting on a recovery that is not yet confirmed carries real cost in carrying expenses and opportunity cost.
Final Word on the Market
May 2026 rewards buyers who have done their homework and have financing ready. The combination of 7.78 months of supply, a median sold price 3.2% below last year, and an average CP/OLP% of 91.56% creates a clear framework: you have options, you have time, and you have real negotiating leverage. Use it thoughtfully rather than aggressively, because the best deals in a Buyer's Market go to buyers who are prepared and credible, not just those who anchor on the lowest possible number.
For sellers, the honest read is that the market is improving but not yet in your favor. Transaction activity is up, supply is down from its peak, and May's 25 closings is a real positive sign. However, 7.78 months of inventory means you are selling into a market with meaningful competition, and buyers know it. Pricing correctly from day one is the single highest-leverage decision a seller can make in this environment.
The data is clear about what May 2026 looks like for Austin multi family. Whether it is a good time to buy or sell depends entirely on your specific situation, your financial goals, and your time horizon. The numbers provide the framework; your personal circumstances provide the context that turns data into a decision.
Questions About the May 2026 Austin Multi Family Real Estate Price Report?
Have questions about what the May 2026 Austin Multi Family Real Estate Price Report means for your specific situation? We are happy to help. If you are thinking about buying a multi family property in Austin, our Buyers page has resources to help you understand the process and get started. If you are thinking about selling, our Sellers page walks through what to expect in today's market.
Reach out to Rebecca Jacks and the team at Eleven Oaks Realty. Call or text (512) 827-8323 or email info@11OaksRealty.com. We have been helping buyers and sellers since 1978 and we are here to help you make the best decision for your situation, whatever that looks like.
Data sources: Realtors Property Resource (RPR), Austin Board of REALTORS MLS. All figures are for multi family residential properties (duplex, triplex, and quadplex) in the city of Austin. Reported figures reflect May 1, 2026 through May 31, 2026. Some variation between data sources may exist due to differing methodology and timing of data pulls.




Leave a Reply