
Eleven Oaks Realty is proud to present their June 2026 Austin Multi Family Real Estate Price Report measuring activity in the Austin multi family market. This report includes all multi family properties (duplex, triplex and quadplex) that sold in June 2026.
June 2026 was a challenging month for Austin multi family sellers. The median sold price fell to $455,000, down 7.1% from May and down 28.3% from June 2025, when the median was $635,000. Sales count dropped as well, with only 19 properties changing hands per RPR data (21 per MLS), down 29.6% from May’s 27 closings. Total sales volume came in at just over $10.1 million, a 31.6% decline from the prior month and 38.1% below the same month last year. The one bright spot was buyer activity: 27 new pending contracts were signed in June, the highest monthly count since late 2025 and up 22.7% from June a year ago.
All data below covers multi family residential properties (duplex, triplex, and quadplex) in the city of Austin. Data is sourced from Realtors Property Resource (RPR) and the Austin Board of REALTORS MLS. Some metrics may vary slightly between sources due to differing methodology; where differences exist, they are noted.
The Austin Multi Family Market is a Buyer's Market
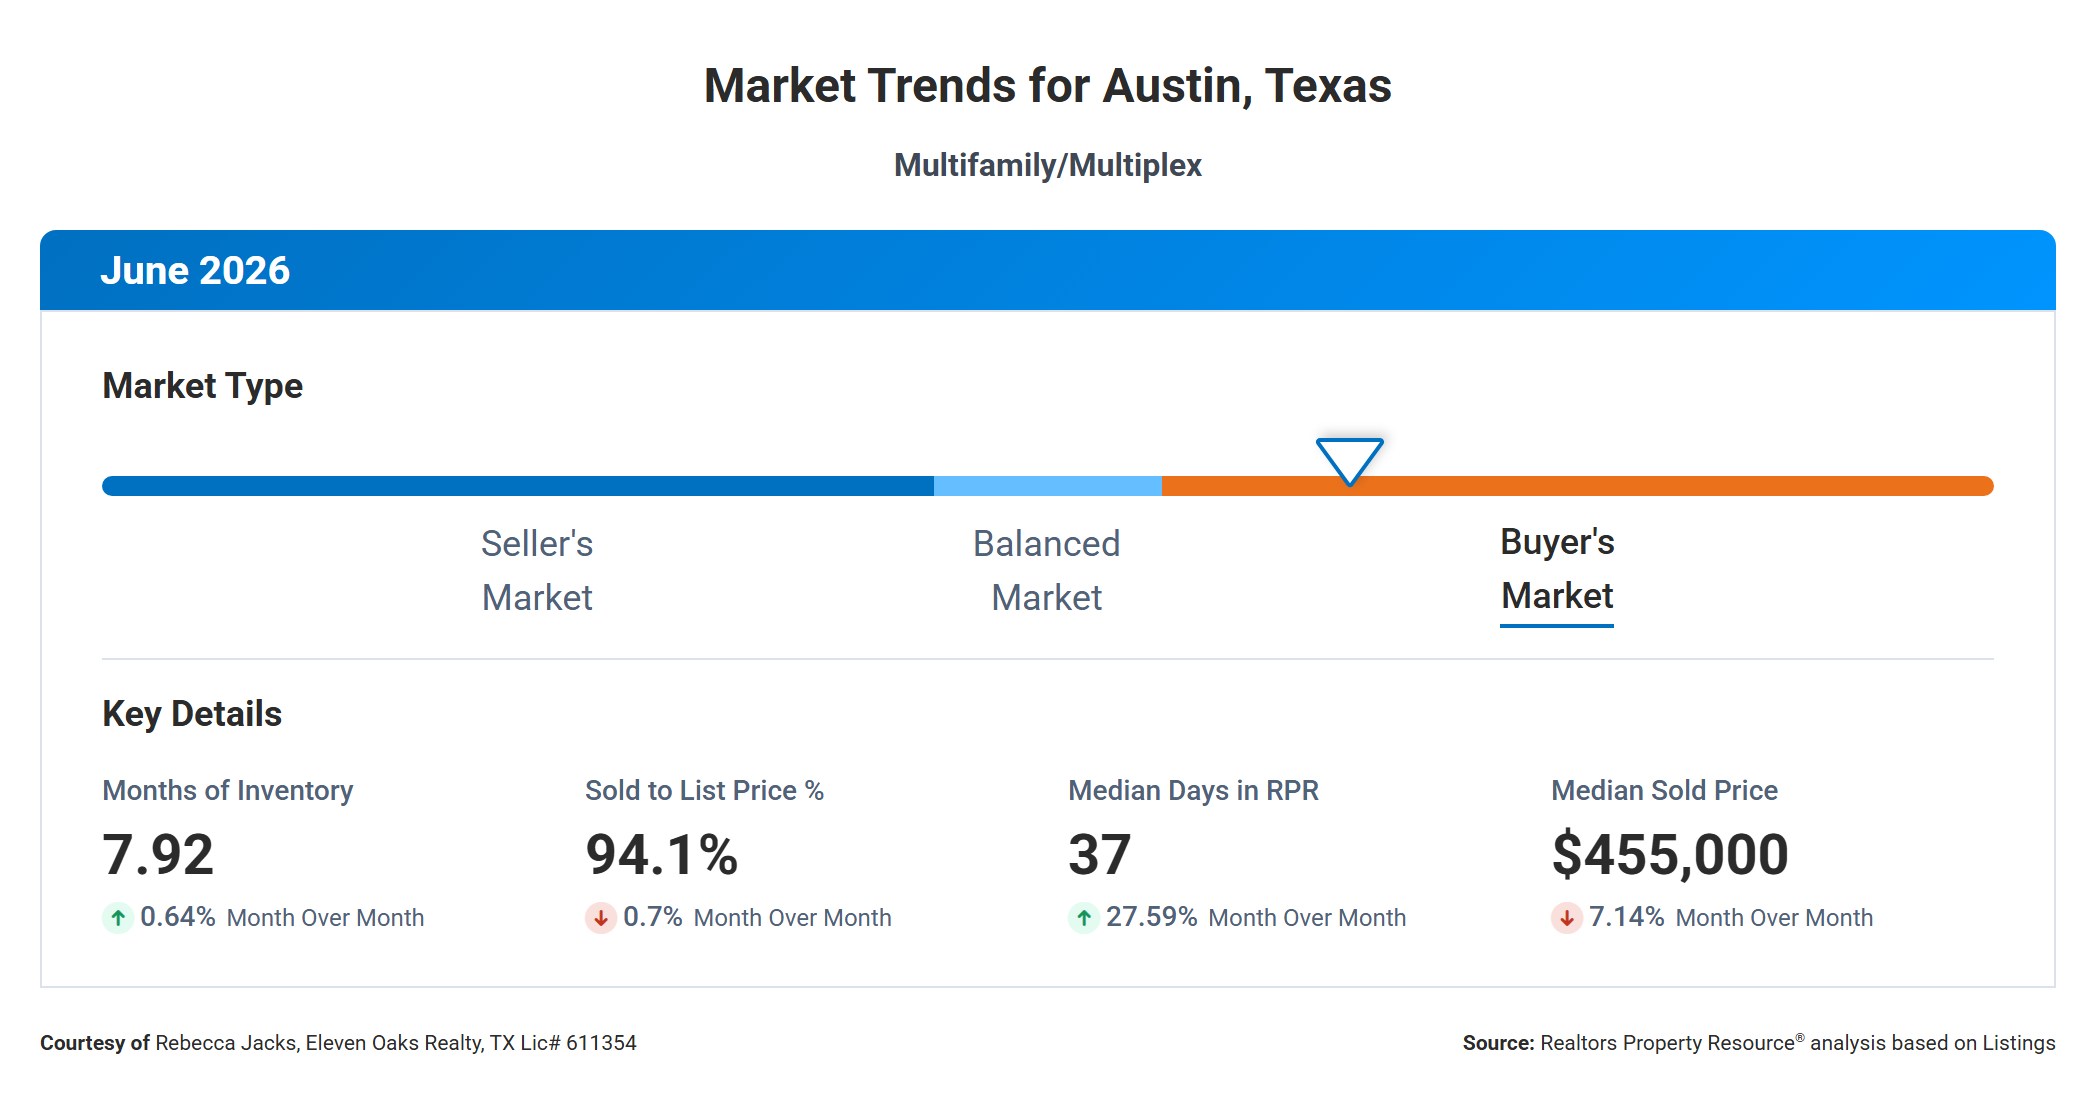
The Austin multi family market remained in Buyer's Market territory in June 2026, with 7.92 months of inventory on hand, up a slight 0.64% from May. In the multi family space, 6 months of inventory marks the conventional line between a balanced market and a buyer's market, and at 7.92 months, buyers still hold the upper hand in negotiations. That said, the year-over-year comparison tells an improving story for sellers: inventory stood at 10.05 months in June 2025, so the market has absorbed meaningful supply over the past 12 months even as it remains firmly in buyer's territory.
The four key metrics from the RPR Market Trends dashboard paint a mixed picture for June. Months of inventory edged up just 0.64% from May, indicating supply pressure has not meaningfully eased on a month-over-month basis. The sold-to-list price ratio came in at 94.1%, down 0.7% from last month, meaning buyers continued to purchase below asking price on average. Median days in RPR jumped to 37 days, a 27.59% increase from May's 29 days, signaling that properties are taking longer to go under contract. The median sold price of $455,000 fell 7.14% from May, extending a downward trend that has now persisted for much of the past year.
Taken together, these signals confirm that multi family buyers in Austin have meaningful leverage. Sellers who price with the current market in mind are still transacting, as evidenced by the 27 new pending contracts in June. Properties that come in above market value are sitting, requiring price reductions, and in some cases seeing the ADOM tick into weeks before an offer materializes. The data is clear: price to where the market is, not where it was.
Median Sold Price Down 28.3% Year Over Year
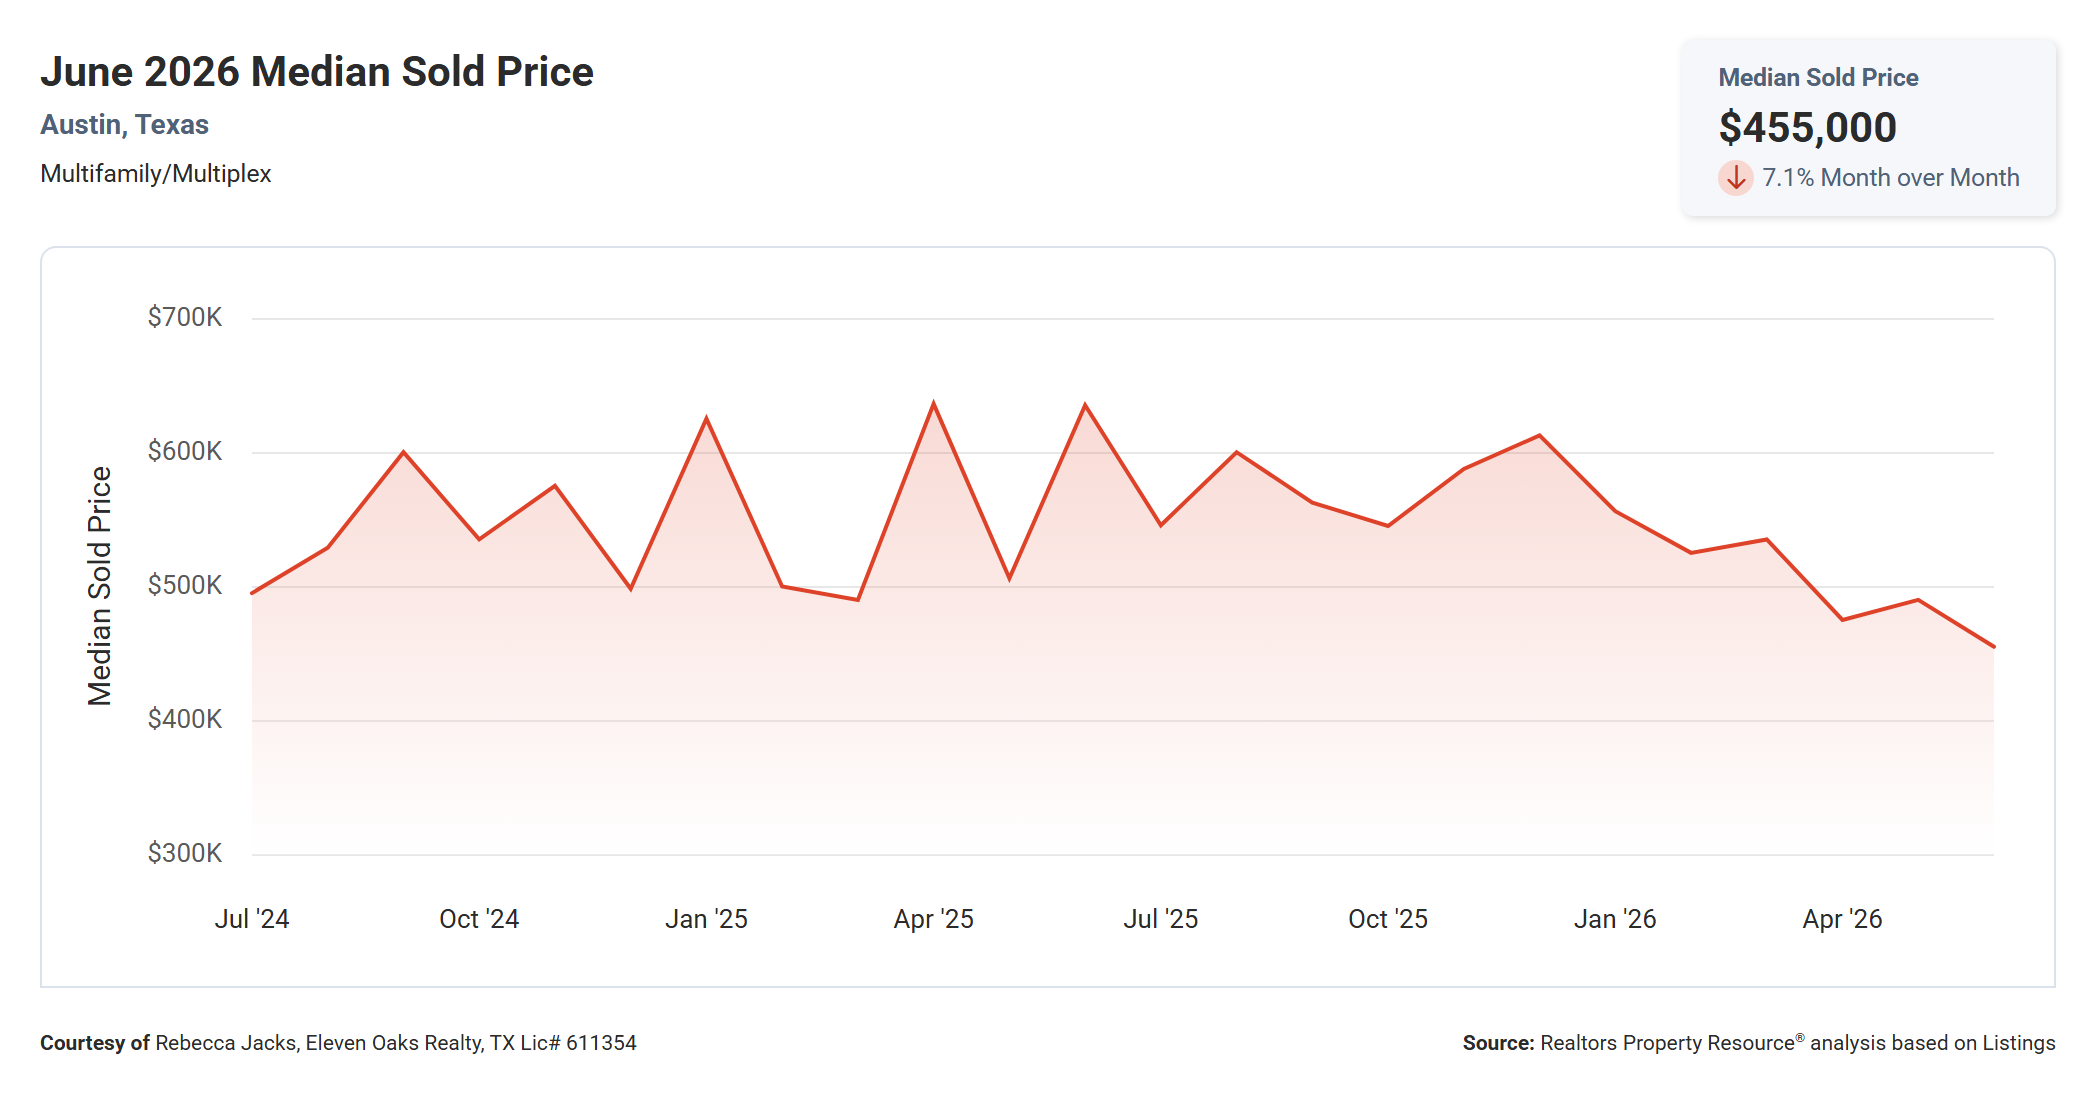
The median sold price for Austin multi family properties in June 2026 was $455,000, down 7.1% from May's $490,000 and down 28.3% from June 2025's $635,000. That year-over-year decline of $180,000 is significant by any measure. Because multi family transaction volumes are relatively thin (fewer than 25 properties closing per month in most months), a small number of lower-priced sales in a given month can move the median meaningfully in either direction, so the overall trend line is more instructive than any single month's reading.
Looking at the two-year chart, median sold prices for Austin multi family properties have been on a broadly declining trajectory since a peak near $640,000 in mid-2025. The trend has moved lower in a jagged but consistent pattern, and June 2026 marks one of the lower monthly readings in recent memory. The $455,000 level approaches the range last seen in early to mid-2025, before the brief spike in the summer of that year.
For buyers, this trajectory represents a genuine entry opportunity at prices considerably below the 2025 highs. For sellers, the data makes clear that pricing at or above last year's comps will not be supported by current buyer behavior. The market is telling you what it will pay, and the gap between asking price and closed price has widened considerably, as addressed in detail in a separate section below.
Number of Sold Properties Down 17.4% Year Over Year
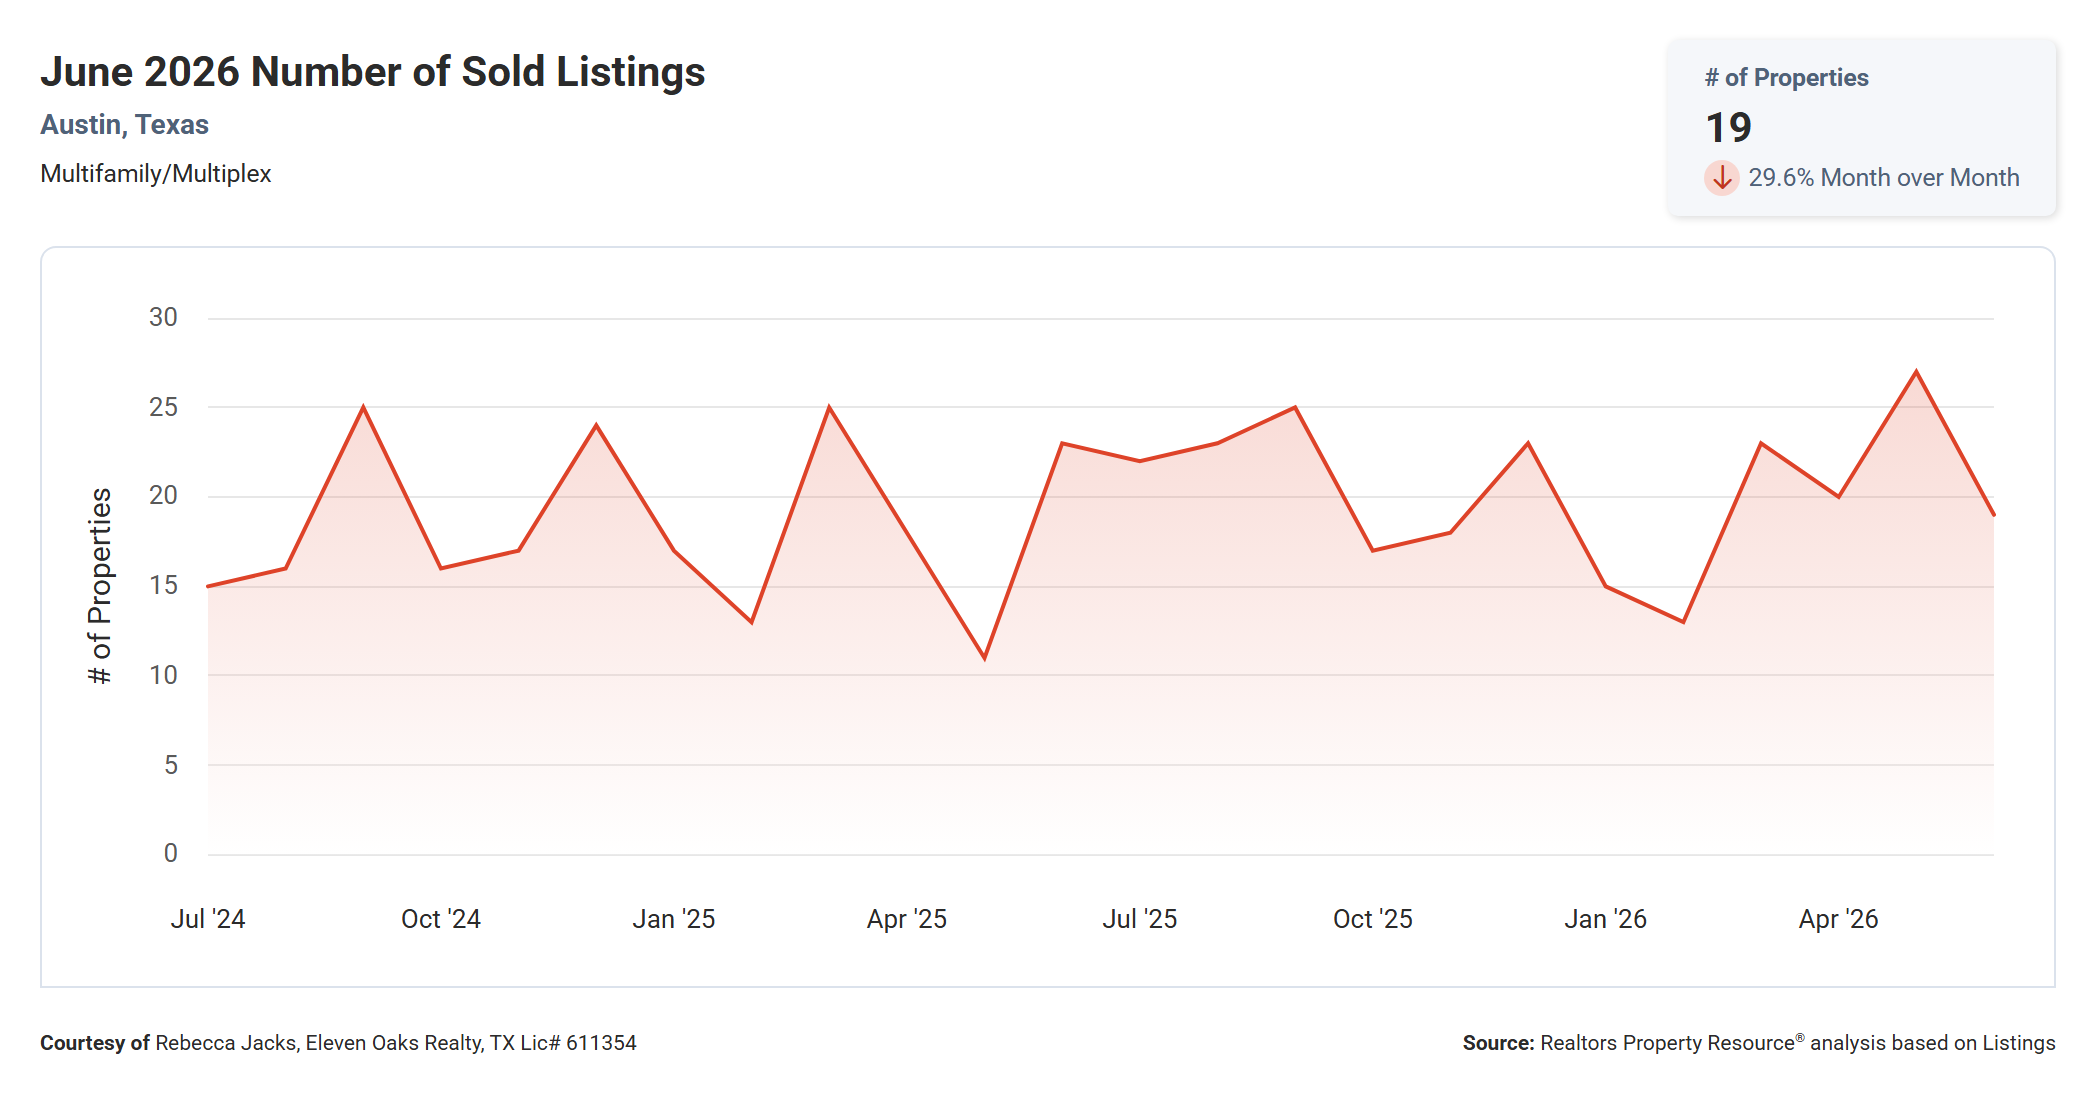
The number of multi family properties that sold in Austin in June 2026 was 19 per RPR data, down 29.6% from May's 27 closings and down 17.4% from the 23 closings recorded in June 2025. The MLS statistics sheet, using a slightly different methodology, recorded 21 closed transactions for the same period. Both sources confirm June was a slow month for closings.
The chart shows monthly sales volume in the Austin multi family market has historically ranged between roughly 11 and 27 properties, with the market tending toward more activity in summer months. June 2026's reading of 19 falls below the seasonal trend, which typically sees stronger closing numbers this time of year. The consecutive peak in May 2026 at 27 followed immediately by this drop reinforces that multi family transaction counts can swing sharply from month to month, even without a fundamental shift in underlying market conditions.
With fewer sales closing, less price discovery is happening each month, which makes each individual transaction carry more weight in determining the market's direction. If you are evaluating the market using recent comps, the thin transaction volume means you should use a 60 to 90-day window of closed sales rather than relying on a single month's data, and you should be aware that one or two outlier transactions can skew the averages considerably.
Average Sold to List Price Essentially Unchanged Year Over Year
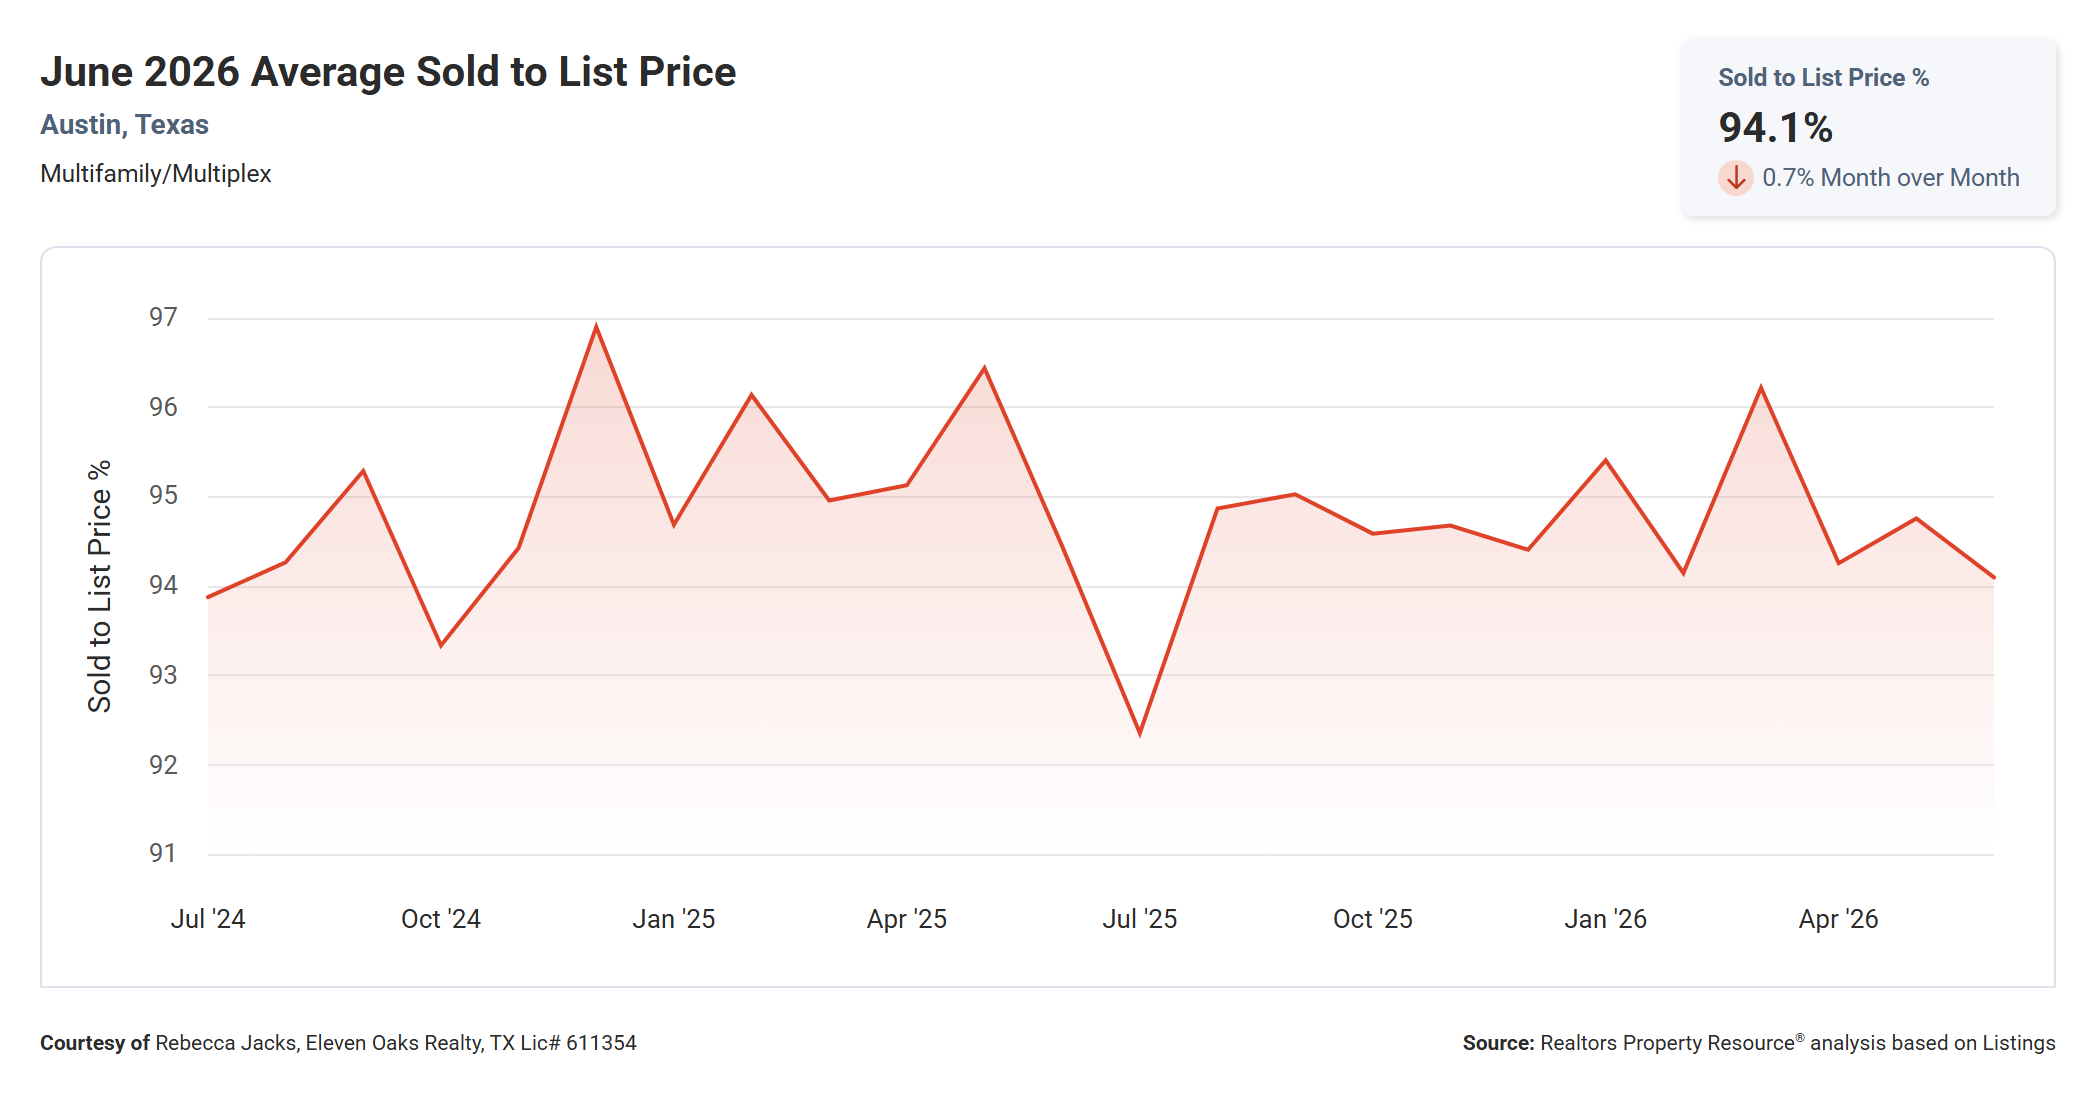
The average sold-to-list price ratio for Austin multi family properties in June 2026 was 94.1%, down 0.7% from May's 94.76% and essentially flat compared to June 2025's 94.45%. While the year-over-year change is negligible, the absolute level tells an important story: buyers are paying approximately 94 cents for every dollar of the final list price on average.
The two-year chart shows the sold-to-list ratio has generally held in the 93 to 97% range, with a brief dip below 93% in mid-2025 and a recovery attempt through the fall and winter. The current reading at 94.1% sits near the lower end of recent norms, indicating sellers are not capturing their full asking price and buyers have consistent room to negotiate. The high reading in late 2024 near 97% appears to have been a temporary peak rather than a new baseline.
For sellers, this ratio is one of the clearest signals about where to price. If the market is consistently settling at 94 cents on the dollar relative to the final list price, properties that start 10 to 15% above realistic current market value will require meaningful reductions before going under contract. For buyers, the data confirms that offers below list price remain reasonable in the current environment, particularly for properties that have been on the market for 30 days or more.
Median Time to Sell Up 42.3% Year Over Year
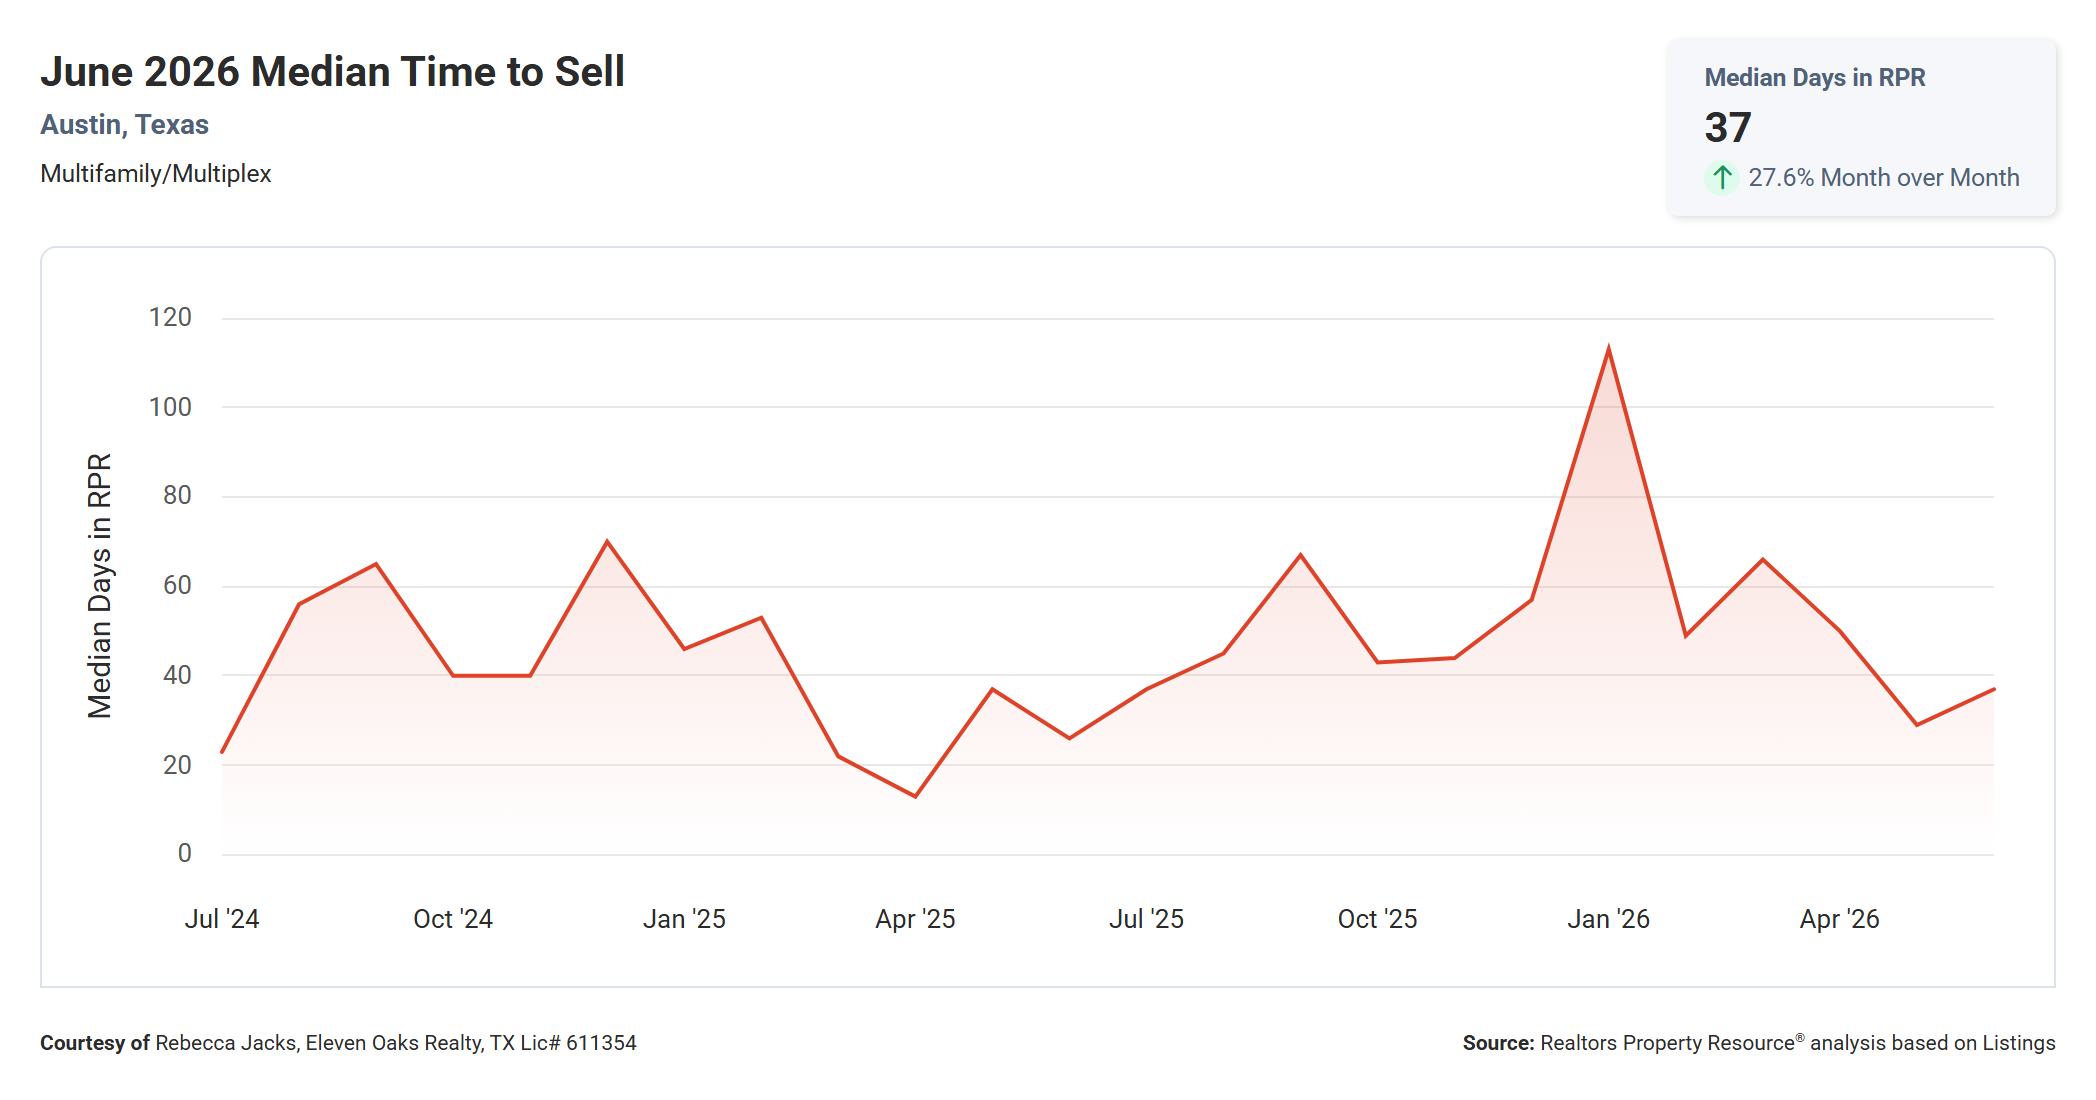
The median time to sell a multi family property in Austin in June 2026 was 37 days, up 27.6% from May's 29 days and up 42.3% from June 2025's 26 days. Percentage changes in median time to sell can swing dramatically in the multi family market from month to month because of the relatively small number of transactions, so the direction of change matters more than the magnitude in any single reading.
That context aside, 37 days is clearly longer than a year ago, and the two-year chart confirms that properties are generally taking longer to sell now than they did in 2025. The chart also shows a dramatic spike to approximately 115 days in January 2026 before a sharp recovery to 29 days by May, with June now ticking back up to 37. The volatility in this metric is a direct reflection of how few transactions make up the monthly calculation.
What this means practically is that buyers can take more time to evaluate a property and negotiate terms without the same urgency that characterized earlier markets. Sellers should expect their properties to be on the market for at least a month and should factor holding costs into their pricing strategy accordingly. An unrealistic asking price in this environment is not just a negotiating inconvenience; it can add weeks of additional carrying costs before a price adjustment brings a qualified buyer to the table.
Median Price Per Square Foot Down 25.4% Year Over Year
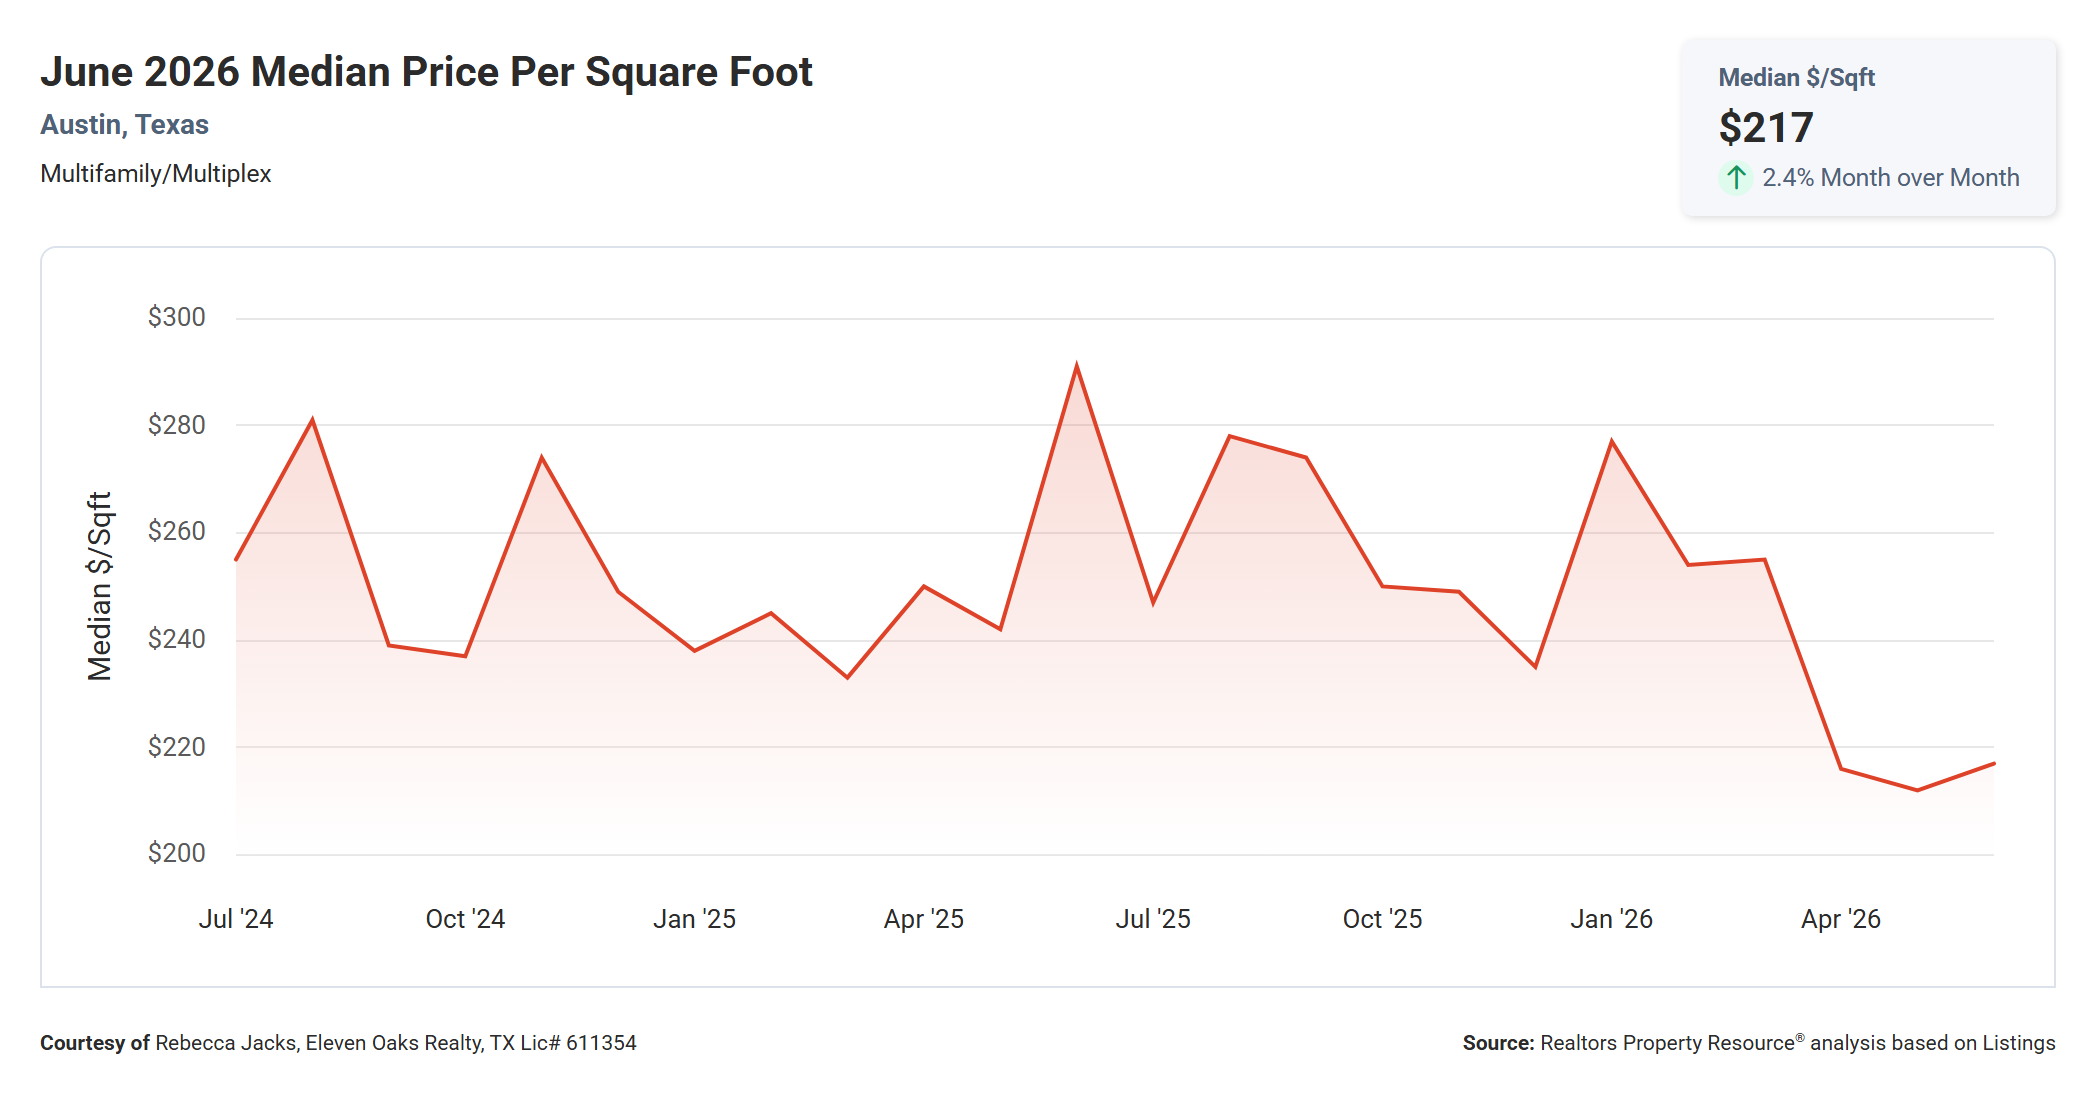
The median price per square foot for Austin multi family properties in June 2026 was $217, up 2.4% from May's $212 but down 25.4% from June 2025's $291 per square foot. The month-over-month uptick is a modest positive, but the year-over-year drop of $74 per square foot tells the larger story: per-unit value has declined substantially over the past 12 months.
The two-year chart shows a clear downward trend that began in earnest around mid-2025, when price per square foot touched approximately $290 before declining steadily. The low point visible on the chart appears to be in the $213 to $215 range in May 2026, with June showing a slight recovery to $217. Whether this represents a floor or a temporary pause in the decline remains to be seen, though the slight sequential improvement is worth monitoring.
For investors evaluating purchase price relative to rental income potential or replacement cost, the price-per-square-foot figure provides a useful benchmark across properties of different sizes. At $217 per square foot, Austin multi family properties are considerably more affordable on this measure than they were 12 months ago, which may attract investors who found 2025 prices difficult to underwrite. The critical question going forward is whether demand at this price level is sufficient to stabilize values or whether continued supply pressure will push prices lower.
Total Sales Volume Down 38.1% Year Over Year
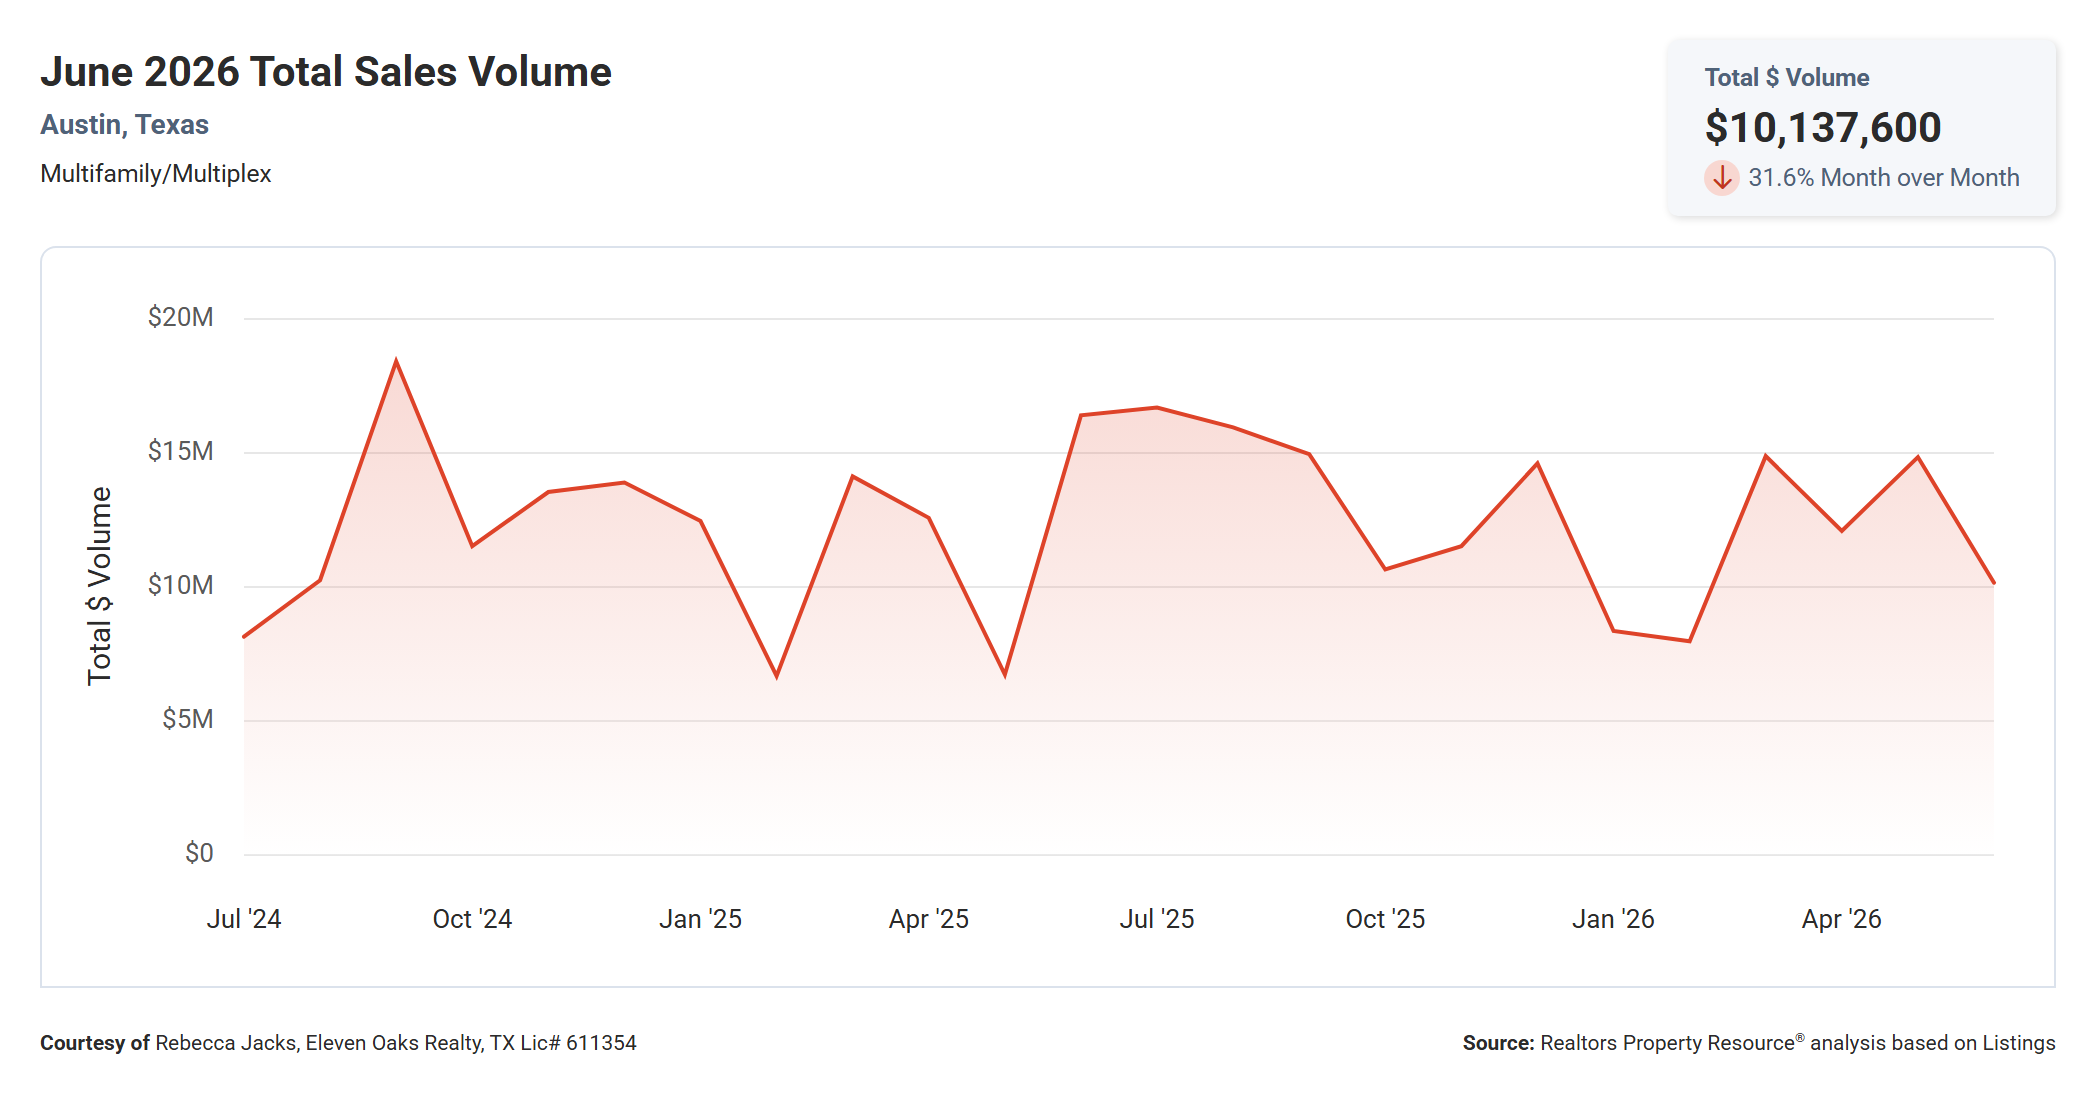
Total sales volume for Austin multi family properties in June 2026 came in at $10,137,600, down 31.6% from May's $14.82 million and down 38.1% from June 2025's $16.37 million. Both the decline in transaction count and the lower median price contributed to this result; fewer sales at lower prices compound the volume decline quickly.
The two-year chart shows that sales volume has historically ranged from approximately $6 million in slow months to as high as $18 million during more active periods. June 2026's reading of just over $10 million falls in the lower half of that range. The most recent peak was May 2026 at $14.82 million, which makes the June pullback more visible in the data.
For anyone tracking the broader health of the Austin multi family investment market, total sales volume is the single metric that combines both price and activity into one figure. A sustained period below $10 to $12 million per month would indicate that the market has entered a slow phase likely to persist until either prices stabilize at a level that attracts more buyers, or sellers reduce their asking prices to close the gap with what the market is actually clearing. At just over $10 million for June, the market is running close to that threshold.
Months Supply of Inventory Down 21.2% Year Over Year
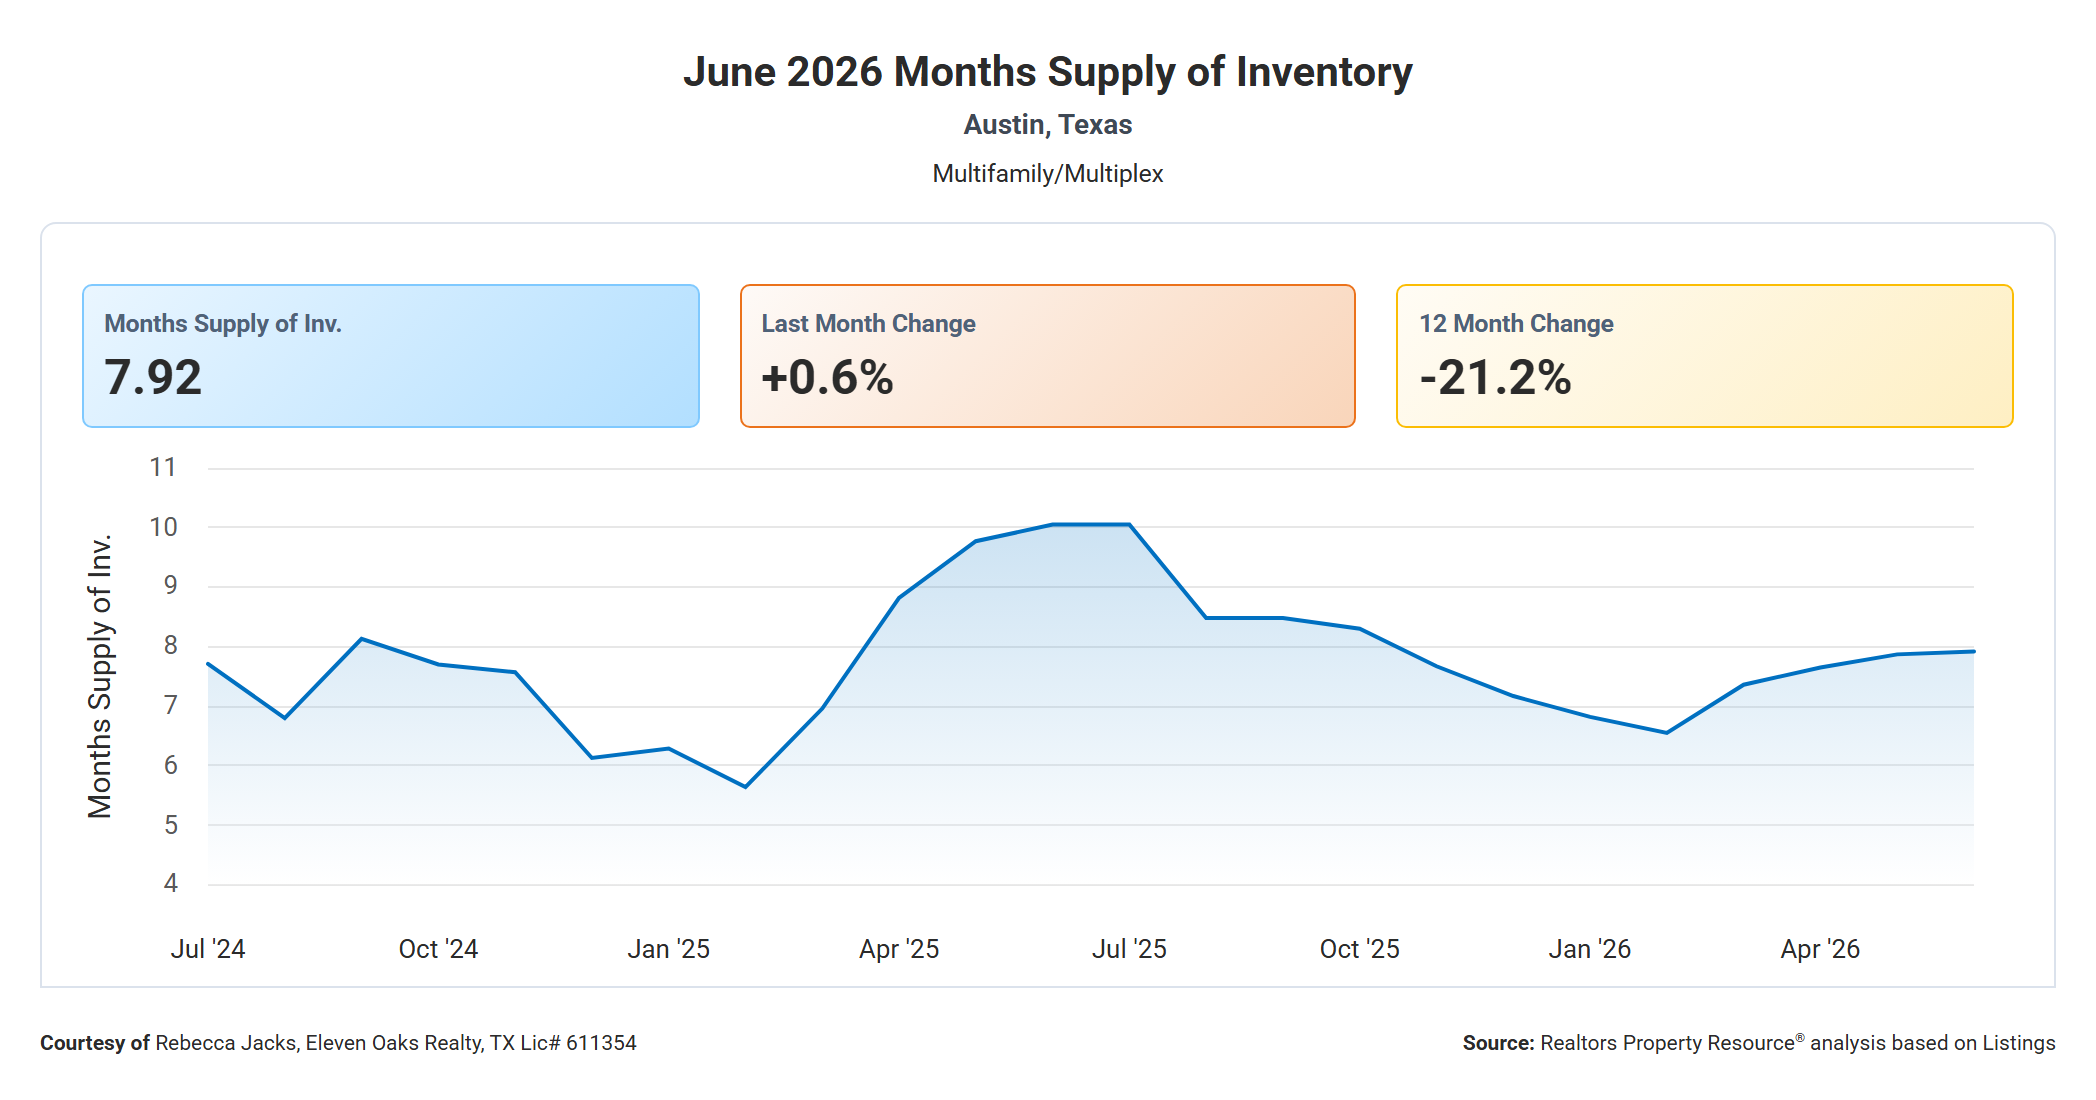
The months supply of inventory for Austin multi family properties in June 2026 was 7.92, up 0.64% from May's 7.87 and down 21.2% from June 2025's 10.05 months. Despite the slight uptick from last month, the year-over-year improvement is meaningful: the market carried significantly more excess inventory a year ago than it does today.
The chart tells a clear story about the past two years. The multi family market went through a significant inventory buildup in mid-2025, peaking at just over 10 months of supply before declining through fall and winter of 2025 to 2026. The current reading of 7.92 is above the 6-month balanced market threshold but well below where the market was at its most oversupplied. The trend line has been one of gradual improvement on the supply side.
For buyers, the declining year-over-year inventory reading means the volume of properties to choose from is moderately lower than a year ago, which could eventually translate to less negotiating leverage if the trend continues. For sellers, the data confirms the worst of the supply overhang from 2025 has been absorbed. If inventory continues to trend lower and pending contracts hold strong, the conditions for price stabilization are slowly building, though current price data indicates buyers are not yet feeling urgency to move quickly.
New Pending Listings Up 22.7% Year Over Year
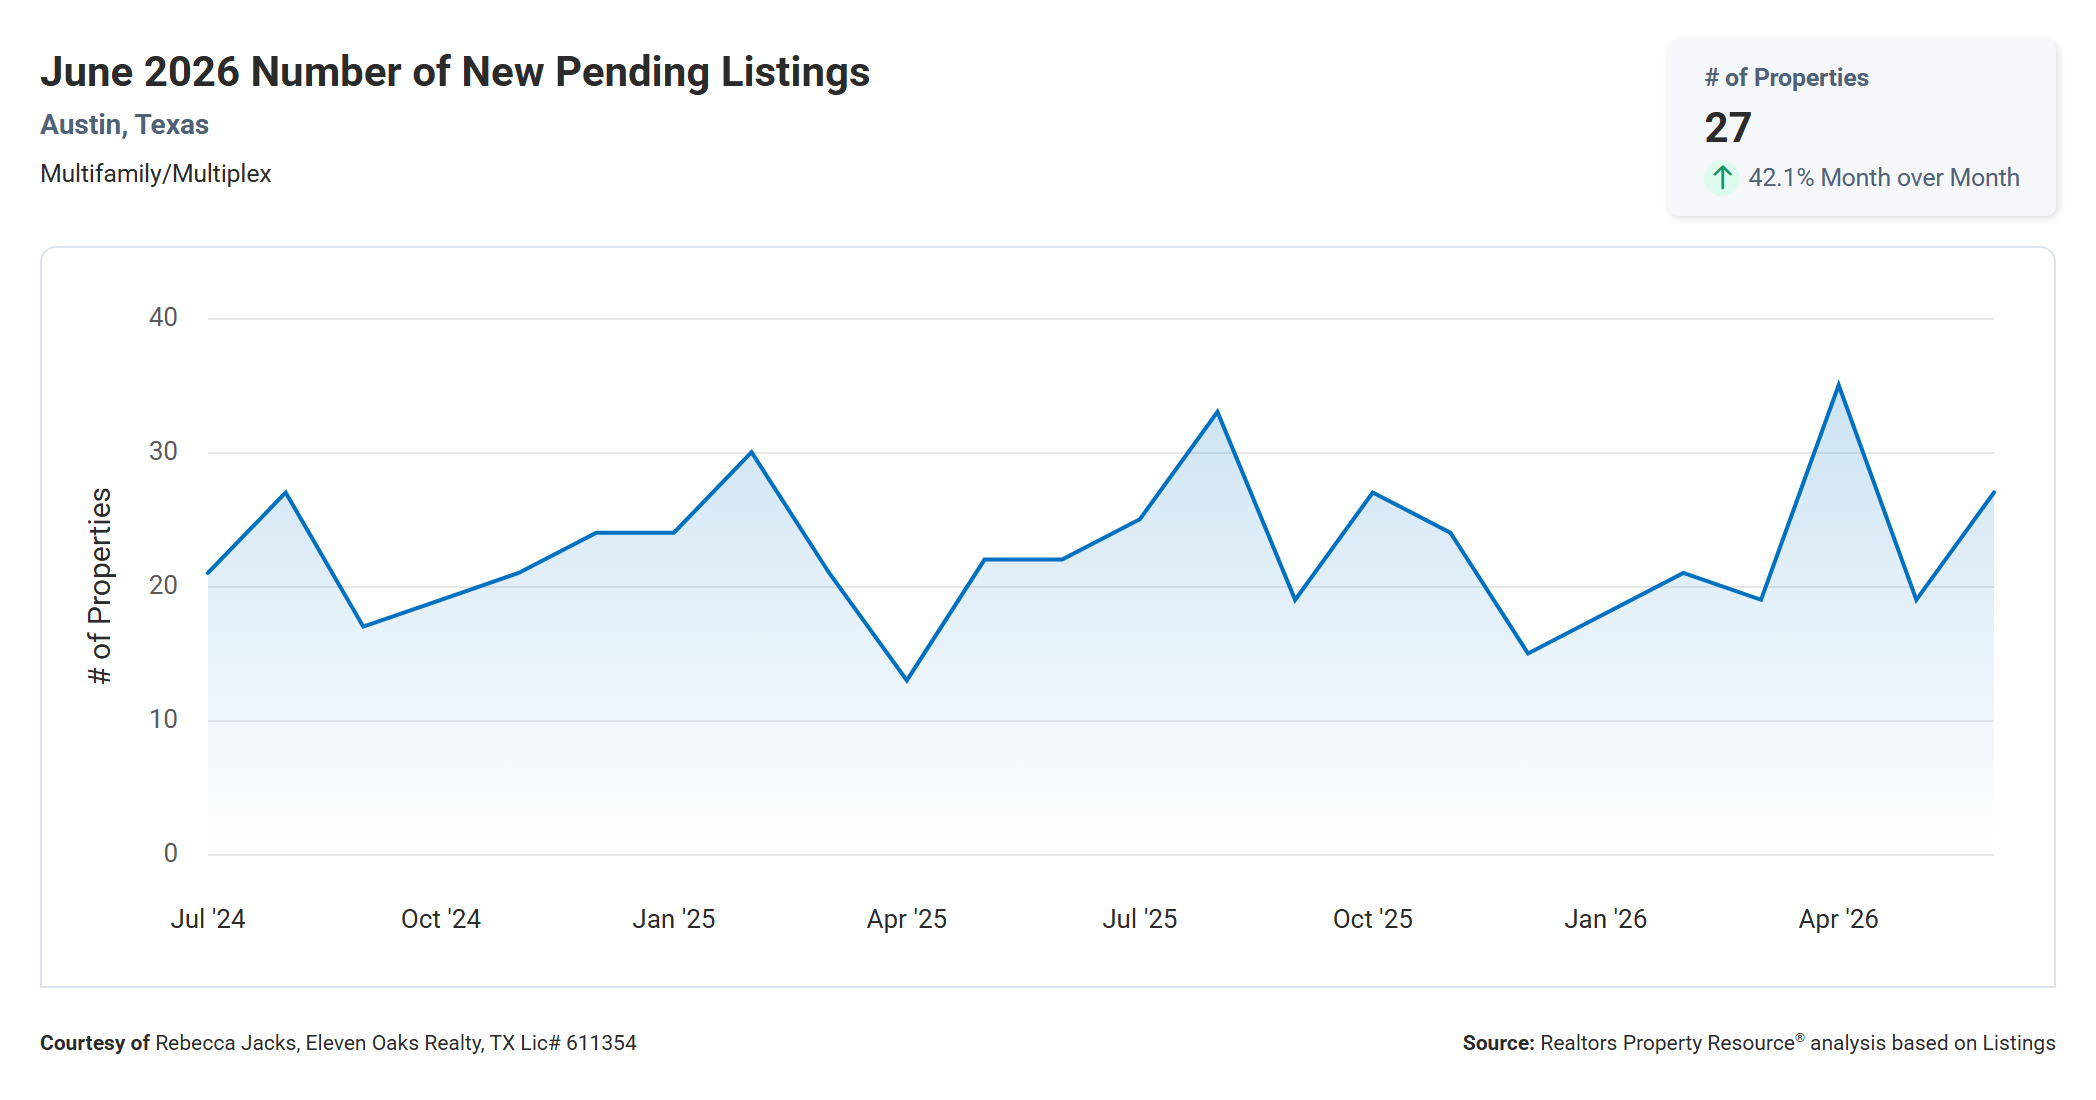
The number of new pending listings for Austin multi family properties in June 2026 was 27, up 42.1% from May's 19 and up 22.7% from June 2025's 22. This is the most encouraging data point in June's report: buyer activity as measured by accepted contracts is running ahead of last year's pace and well above the recent monthly average.
The chart shows new pending listings have generally ranged between 13 and 35 over the past two years, with June 2026's 27 sitting comfortably in the upper portion of that range. The jump from May to June, 8 additional contracts going pending in a single month, is particularly notable. Even accounting for the small transaction counts that can amplify month-to-month swings in this market, the directional signal from June's pending data is positive.
For sellers, this is encouraging news. Buyer demand, while not matching the peaks seen in summer 2025, is picking up from the slower months earlier in 2026. If the June pending contracts convert to closings at a normal rate over the next 30 to 60 days, July's closed-sale count should come in stronger than June's. For buyers, the increase in competition from other pending contracts is a reminder that well-priced properties are attracting interest and that delayed decisions on strong properties carry real risk.
Median Active List Price Up 1.7% Year Over Year
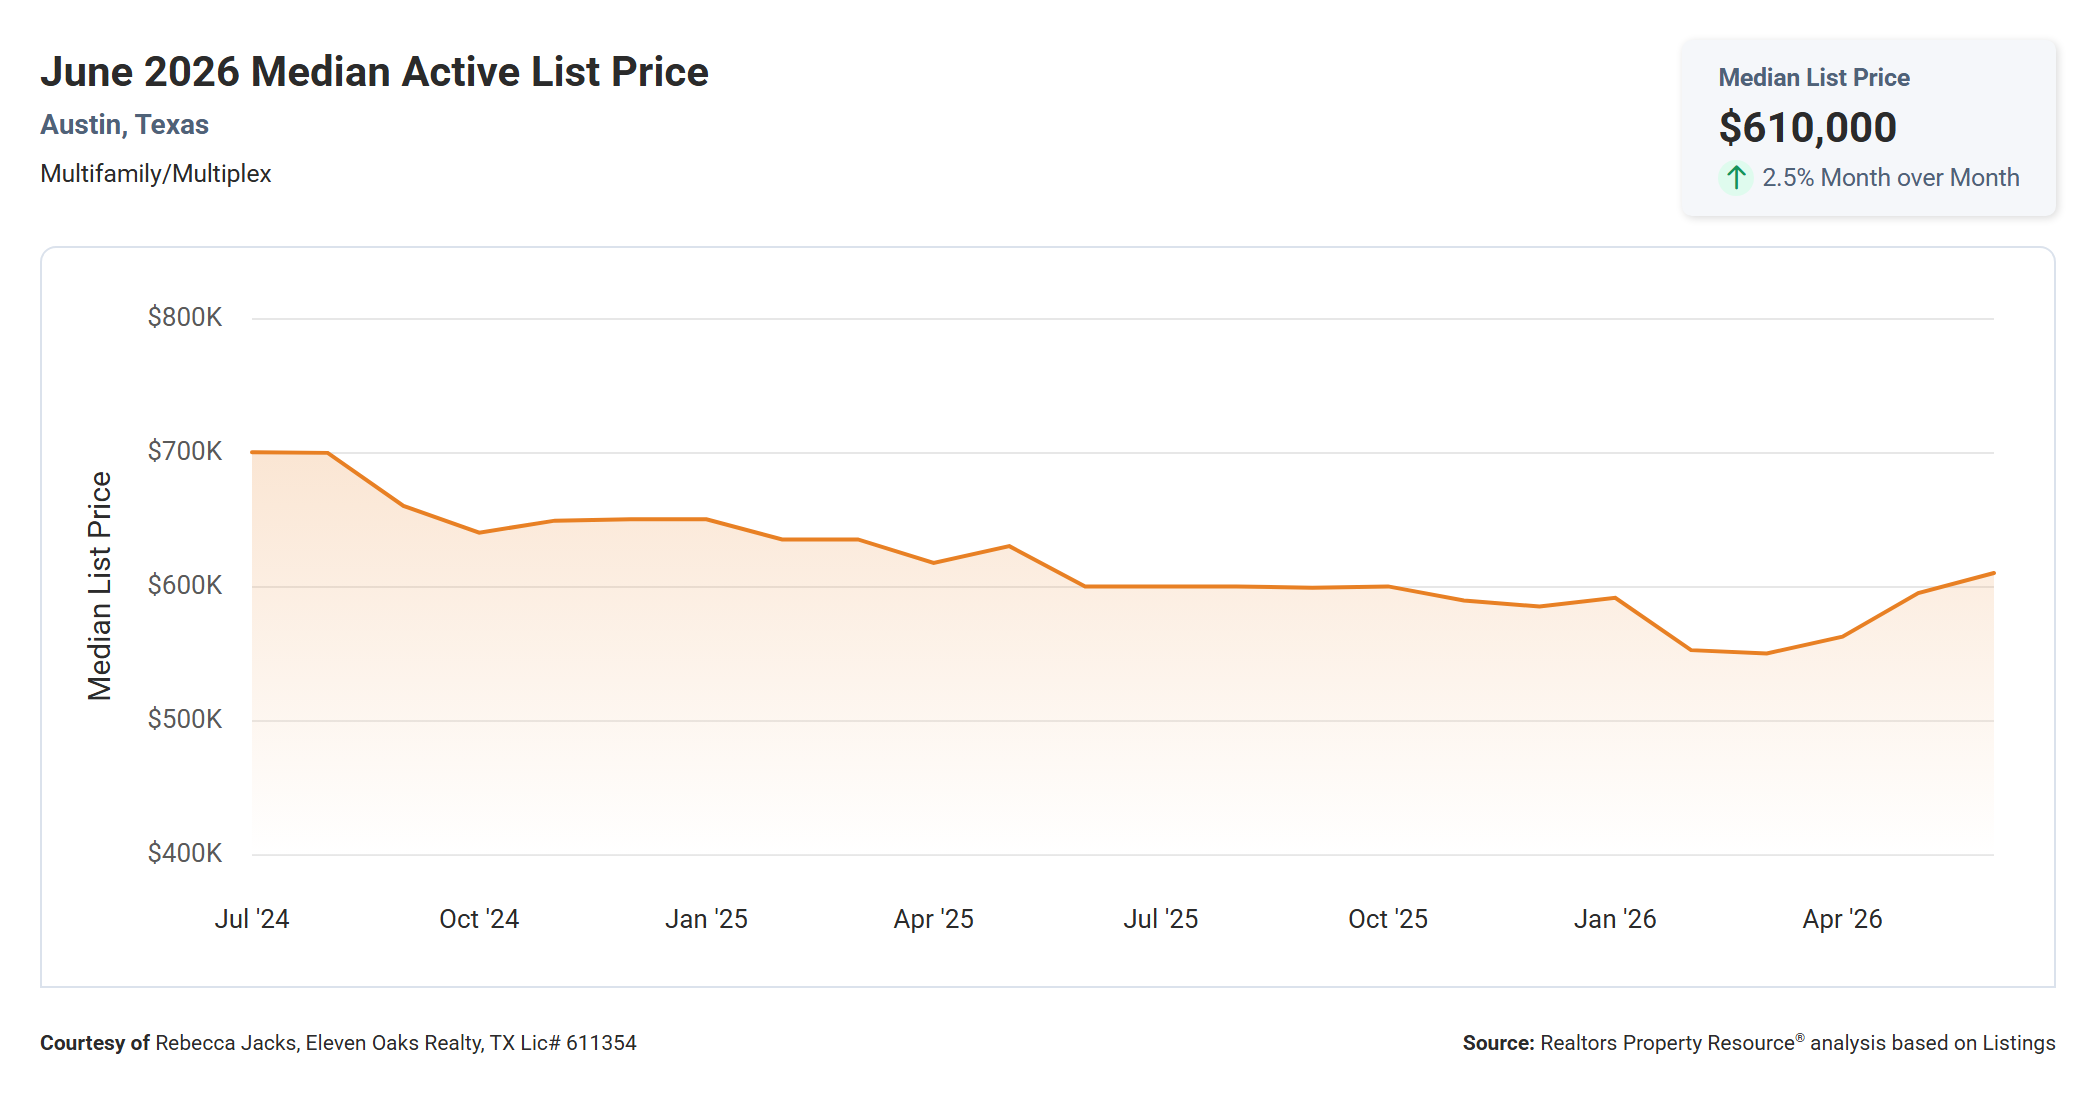
The median active list price for Austin multi family properties in June 2026 was $610,000, up 2.5% from May's $595,000 and up 1.7% from June 2025's $599,900. The fact that list prices have moved up slightly year over year while sold prices have dropped 28.3% over the same period reveals a widening disconnect between what sellers are asking and what buyers are paying. That gap is significant enough to warrant its own section in this report, which you will find below.
The two-year chart shows median list price gradually declined from around $700,000 in mid-2024 to approximately $540,000 to $550,000 in early 2026, before recovering to $610,000 in June. The recent uptick may reflect renewed seller optimism or the entry of higher-priced new listings into the active inventory, but it runs counter to what the sold price data is showing.
For buyers, the current list price environment means you should not anchor to the asking price as a guide to value. The data consistently shows that sellers are listing above where transactions are actually clearing. For sellers, if you are pricing near or above the $610,000 median list price, understand that you are competing against dozens of other properties in similar price territory and that June's median sold price of $455,000 is where buyers have been willing to transact.
New Listings Up 7.3% Year Over Year
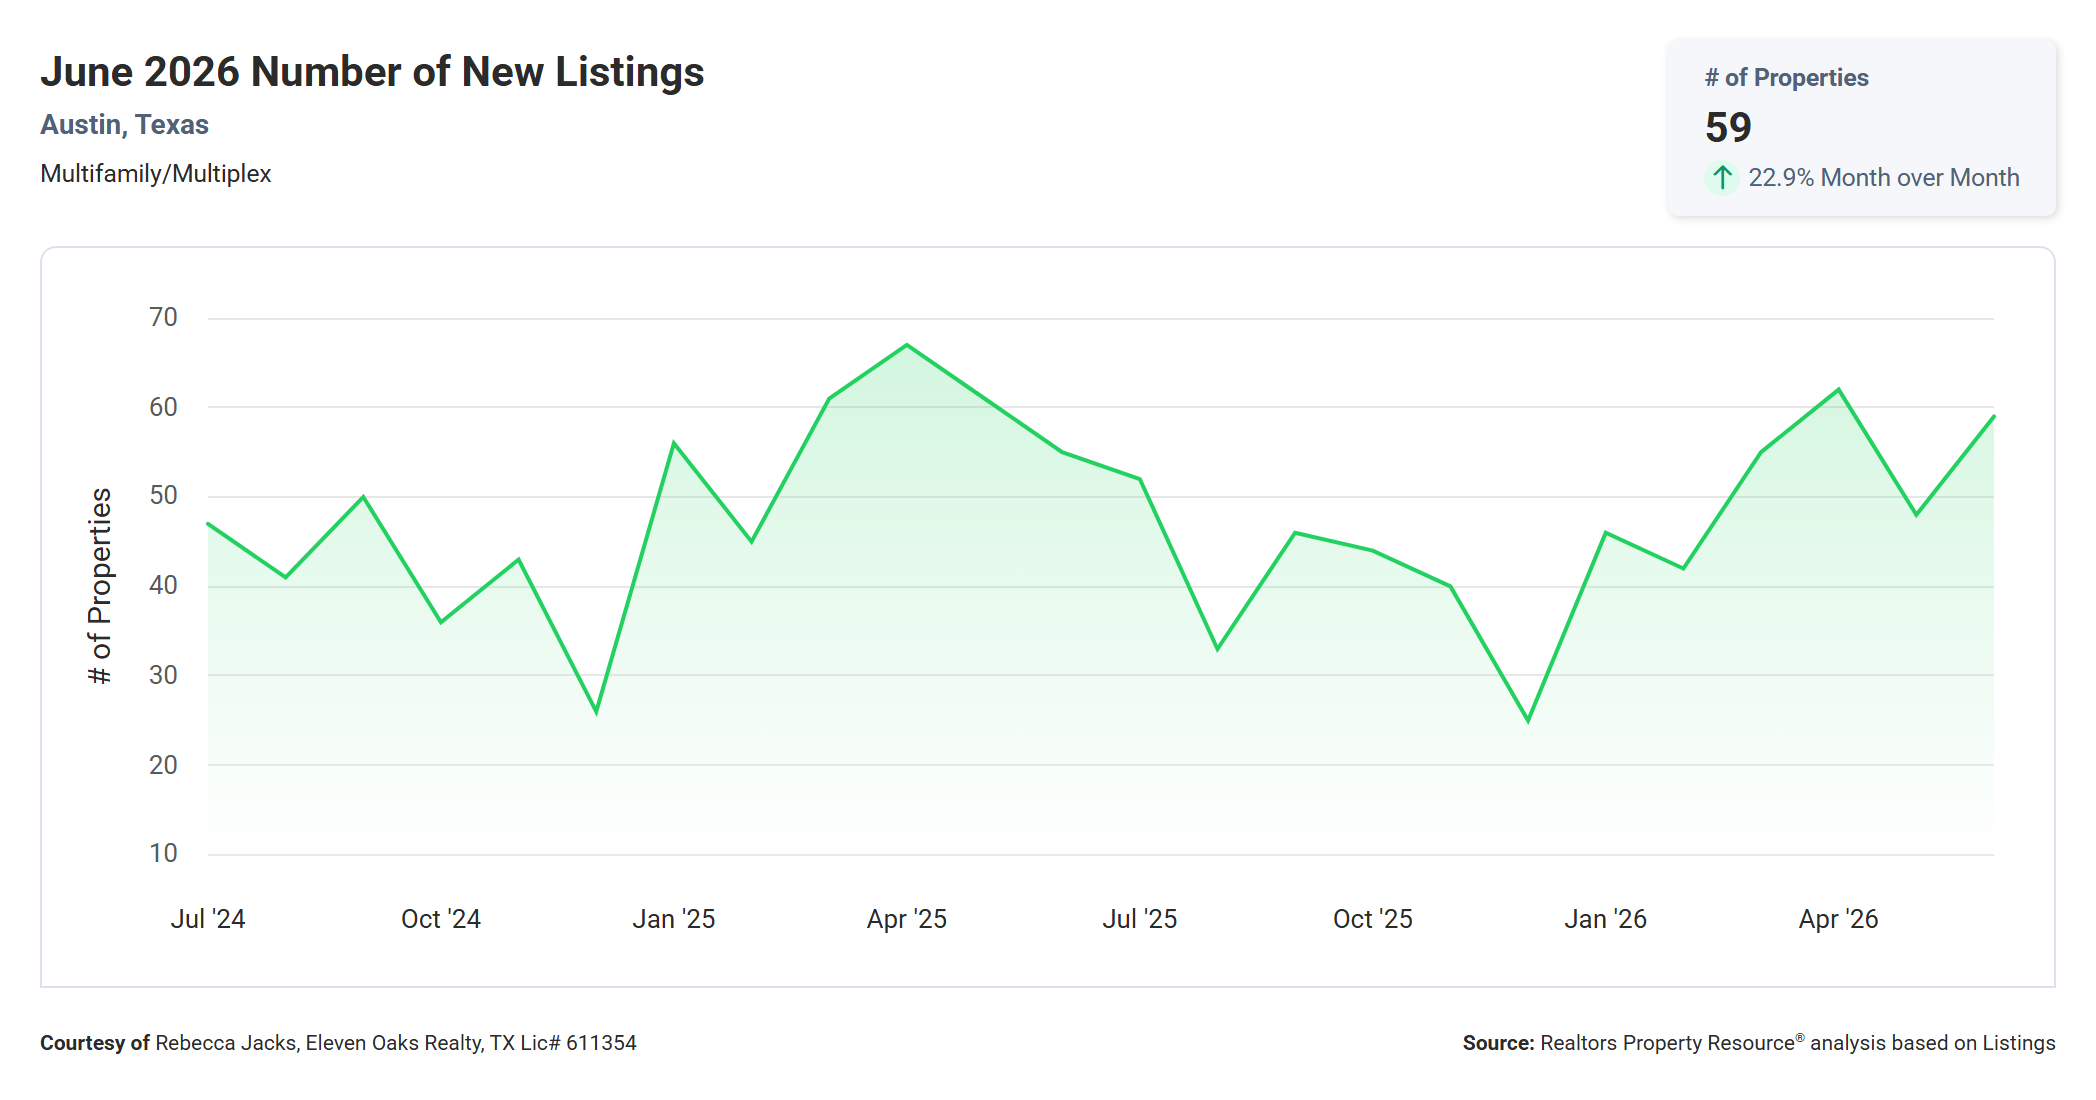
The number of new listings that came onto the market in June 2026 was 59, up 22.9% from May's 48 and up 7.3% from June 2025's 55. Fresh inventory entering the market at an above-year-ago pace means buyers have more options to choose from, and sellers face incrementally more competition with each additional property that comes onto market.
The chart shows new listings have ranged from about 25 to 67 over the past two years, with spring and summer months generally producing higher new listing counts. June 2026's 59 sits near the upper end of the recent range, consistent with seasonal patterns. The month-over-month jump of 11 new listings from May to June represents a meaningful increase in fresh supply entering the market just as the summer season gets underway.
With 59 new listings hitting the market in June against only 19 to 21 closings, significantly more inventory is coming in than going out each month. Until the ratio of new listings to closings narrows considerably, downward pressure on prices is likely to persist. Sellers contemplating a summer or fall listing are entering a market that already carries a backlog of properties competing for a relatively thin pool of buyers.
Active Listings Down 14.0% Year Over Year
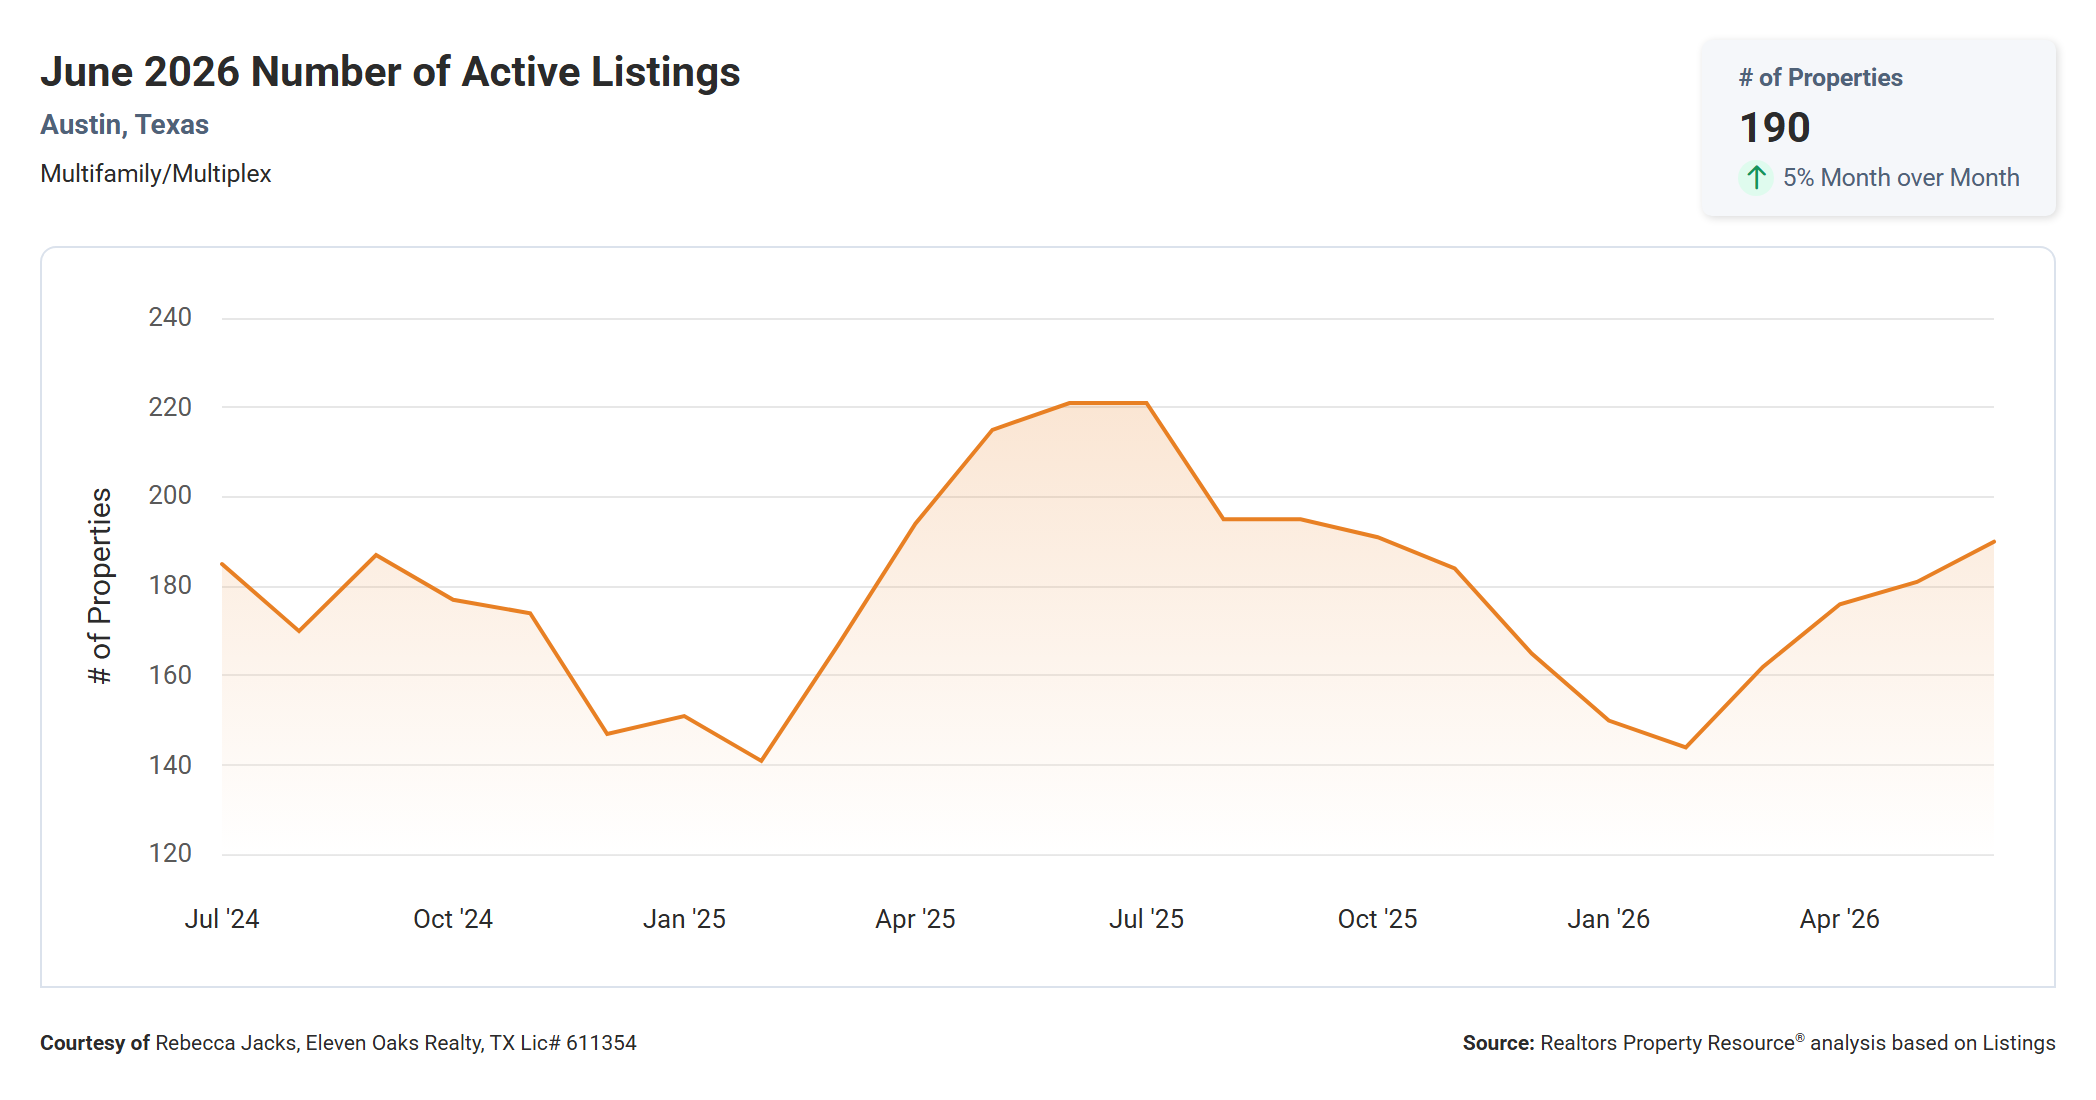
The number of active multi family listings in Austin in June 2026 was 190, up 5% from May's 181 and down 14.0% from June 2025's 221. The year-over-year decline is meaningful: there are 31 fewer properties on the market today than there were a year ago, a notable reduction in overall competition and one of the more positive signals in this month's data for sellers.
The chart shows active listings peaked at around 220 in mid-2025 before declining steadily through the end of 2025 and into early 2026, reaching a low of approximately 143 to 150 in January and February before trending back up. The current 190 sits comfortably above the recent low but well below the mid-2025 highs.
The month-over-month increase from 181 to 190 is consistent with the seasonal pattern of rising new listing counts in late spring and early summer. If new listings continue to outpace closings through the summer, active inventory will keep building. However, the fact that active inventory remains 14% below year-ago levels suggests the worst of the inventory overhang from 2025 has been absorbed. Whether that translates to price stabilization in coming months will depend largely on whether buyer demand can keep pace with new supply, and June's pending contract count gives some reason for cautious optimism on that front.
June 2026 Austin Multi Family Real Estate by the Numbers
The table below is pulled directly from the Austin Board of REALTORS MLS statistics for June 2026 and covers 21 closed multi family transactions (duplex, triplex, and quadplex) in the city of Austin.
| Min | Max | Avg | Median | |
|---|---|---|---|---|
| Sq Ft | 1,515 | 4,560 | 2,350 | 2,116 |
| Lot SF | -- | 49,223 | 10,207 | 7,828 |
| List Price | $355,000 | $1,349,000 | $577,933 | $515,000 |
| LP/Sq Ft | $119.52 | $527.39 | $254.67 | $234.58 |
| Acres | 0.000 | 1.130 | 0.234 | 0.180 |
| Close Price | $300,000 | $1,349,000 | $551,648 | $483,000 |
| CP/Sq Ft | $96.49 | $527.39 | $243.59 | $218.53 |
| CP/LP% | 81.00% | 100.00% | 94.67% | 97.00% |
| CP/OLP% | 71.00% | 104.00% | 90.19% | 94.00% |
| ADOM | 3 | 169 | 50 | 36 |
The most expensive multi family property that sold in June 2026 sold for $1,349,000 and the least expensive sold for $300,000. Properties ranged in size from 1,515 to 4,560 square feet with an average size of 2,350 square feet. The average price per square foot was $243.59 with the lowest being $96.49 per square foot and the highest being $527.39 per square foot. It took, on average, 50 days to sell a multi family property in Austin and sellers received, on average, 90.19% of their original list prices.
The spread between average close price ($551,648) and median close price ($483,000) is notable at approximately $68,600. This gap indicates that one or more higher-priced sales, including the $1,349,000 top transaction, are pulling the average well above where the typical buyer transacted. For the most accurate read on where most multi family properties changed hands in June, the median close price of $483,000 is the more useful figure.
The CP/LP% versus CP/OLP% data tells the price reduction story in clear terms. The median buyer paid 97% of the final list price but only 94% of the original list price, meaning the typical seller had already reduced their asking price before going under contract. At the average level, buyers paid 94.67% of the final list but only 90.19% of the original list price, which means sellers who started above market still did not get what they were asking even after the reduction. For sellers, starting at a realistic price avoids the market time and price reduction cycle that the data shows is affecting the average Austin multi family property right now.
The $155,000 Gap: What the Spread Between List Price and Sold Price Means
One of the most significant figures in June 2026's report is the $155,000 difference between the median active list price ($610,000) and the median sold price ($455,000). That gap represents approximately 25% of the asking price and raises a direct question for anyone with a multi family property on the market or considering listing: are you priced to sell, or priced to sit?
The $610,000 median list price reflects what sellers believe their properties are worth, or at minimum, what they are willing to accept as a starting point. The $455,000 median sold price reflects what buyers have actually been willing to pay. The two figures are $155,000 apart, and in a market where only 19 to 21 properties closed in the entire month, most buyers and sellers are not going to find common ground unless one side adjusts.
This gap has widened considerably from a year ago, when the median sold price was $635,000 and was much closer to the active list price range. Sellers who entered the market with 2025-era pricing expectations are now competing against a buyer pool that has reset its expectations based on what has actually closed. For buyers, this disconnect creates opportunity: properties listed at or near $610,000 that have been sitting without offers are often far more negotiable than their original list price suggests. For sellers, the path to a sale in June 2026 runs through the $455,000 to $515,000 range where buyers are actually transacting, not through the $610,000 level where the majority of the active inventory is currently listed.
What This Means for Multi Family Buyers
For buyers, June 2026 offers genuine price opportunity that has been rare in recent Austin history. Median sold prices at $455,000 are $180,000 below where the market was in June 2025, and price per square foot at $217 is near a two-year low. If you are looking to acquire Austin multi family property for investment purposes, the current price environment offers entry points that were not available 12 months ago.
The negotiation landscape also favors buyers in measurable ways. The average seller is netting only 90.19% of their original asking price, which means real negotiating room exists, particularly on properties that have been listed for more than 30 days. The sold-to-list ratio at 94.1% confirms that most transactions are settling below asking price, and with 190 active listings on the market against only 19 to 21 closings per month, sellers need buyers more than buyers need any particular property.
For investors, the investment math looks materially different today than it did at 2025 prices. At a median closing price near $455,000 to $483,000 and with Austin rents remaining relatively stable, the cap rate and cash-on-cash return calculations are more favorable than they have been in some time. Buyers who were unable to make the numbers work at 2025 pricing may find the current environment worth a serious look, particularly for well-located properties that have been sitting on the market and are therefore most likely to respond to a below-list offer.
Near-term price direction has not yet clearly reversed, which is worth acknowledging. Prices have declined significantly over the past year and have not shown definitive signs of stabilizing. If you are not under pressure to deploy capital immediately, monitoring one or two additional months of closing data will give you more certainty about whether June's price level represents a floor. If you have the financial capacity and the investment timeline to absorb continued near-term softness, the current environment may offer value that becomes clearer in retrospect.
What This Means for Multi Family Sellers
The demand signal from June 2026 is mixed for sellers, but it is not discouraging. On the positive side, 27 new contracts went pending in June, up 42.1% from May and above the prior year's pace. Buyer activity is real, and motivated buyers are in the market. The problem is not a shortage of buyers; it is the gap between what sellers are asking and what buyers are paying.
Competition among sellers is significant. With 190 active multi family listings and only 19 to 21 closings in June, the average listing has roughly a 1-in-10 chance of closing in any given month at the current pace. That is a challenging environment, and it rewards sellers who price decisively from the start. Properties priced at or below current market value are transacting. Properties anchored to 2025 comps are generating showings but not contracts, and in many cases are sitting for 50 or more days before eventually receiving a price reduction.
The CP/OLP% data is the most direct feedback the market can offer a seller: an average of 90.19% of original list price means the typical seller started too high, reduced their price, and still sold below their opening ask. The sellers who are faring best in this environment are those who skip this cycle by pricing at current market value from day one. A properly priced multi family property can still achieve 97% of its list price at closing, as the median CP/LP% shows. An overpriced property that requires a reduction typically achieves considerably less, and at a much slower pace.
There is reason for measured optimism looking forward. Active listings are 14% below June 2025 levels, months of inventory has declined from 10.05 to 7.92 year over year, and pending contracts are running ahead of last year. The market is gradually improving for sellers in terms of supply and demand balance, even if prices have not reflected that improvement yet. Sellers who need to transact now should price to today's data. Those with flexibility might monitor the next 60 to 90 days before deciding whether conditions are trending in a direction that justifies waiting.
Market Summary and Outlook
June 2026 was defined by a significant gap between seller expectations and buyer reality. Median sold prices fell to $455,000, down 28.3% from June 2025, while median active list prices moved up to $610,000 over the same period. With only 19 to 21 properties closing per month, each transaction carries outsized influence on the data, and the broad message from June is that buyers have reset their price expectations faster than sellers have been willing to follow.
The year-over-year comparisons show a market that is clearly softer on the seller-facing metrics: median sold price, price per square foot, and total sales volume are all down substantially from a year ago. On the buyer activity side, however, June showed meaningful green shoots. New pending listings at 27 are near a 12-month high, months of inventory is down 21.2% year over year, and active listings are 14% below June 2025 levels. The market is not stalled; buyers are transacting, but at prices that sellers have not broadly accepted yet.
The key variable for the months ahead will be whether the June surge in new pending contracts converts into closings. If July and August both record 24 or more closings, the market will signal that buyer demand at current prices is real and sustained, which could put a floor under values. If pending contracts do not convert at a normal rate, or if new listings continue to substantially outpace closings, inventory will rebuild and pricing pressure will continue.
Austin's multi family market fundamentals remain compelling for patient investors. Population growth, a diversified employment base, and long-term housing demand make the Austin market one worth watching in the Central Texas region over a 5 to 10-year horizon. The current period of price correction is difficult for near-term sellers and uncertain for buyers trying to time an entry, but it is also creating purchase opportunities that look more interesting today than they have in the past two years. The data will tell us in coming months whether June 2026 marks the bottom of this adjustment or simply another chapter in it.
Action Items for Multi Family Buyers
- Run updated investment analysis using current market data, with $455,000 to $483,000 as your baseline range for the median closed transaction, and recalculate your cap rate and return assumptions against today's numbers rather than 2025 comps.
- Target properties that have been on the market for 30 or more days, as these are the strongest candidates for meaningful price negotiation, particularly if the seller has already made at least one reduction from their original list price.
- Get pre-approval or proof of funds in place before writing offers, because the 27 pending contracts in June confirm that well-priced properties are attracting competition quickly and sellers are not waiting long for serious buyers to emerge.
- Use the CP/OLP% average of 90.19% as a negotiating reference when evaluating properties still listed at their original asking price, since June data confirms that buyers are routinely achieving 10% or more off original list in the current environment.
- Watch the July and August closing data closely: if those months produce 24 or more closings, it is a signal that current prices are finding support, which could indicate this is a favorable window to act before competition increases and the buyer's advantage narrows.
- Evaluate the $155,000 gap between the median list price and the median sold price when assessing any specific property, and structure your offer from the sold price side of the data rather than anchoring to the seller's original or current asking price.
Action Items for Multi Family Sellers
- Price from current closed data, not from active listings or prior-year comps: the $455,000 to $483,000 range where buyers actually transacted in June 2026 is the most accurate guide to where your property needs to be priced, not the $610,000 median list price that reflects where sellers are hoping to end up.
- If your property has been on the market for more than 30 days without a contract, pull comparable closed sales from the past 60 to 90 days and compare your price to what has actually closed, then adjust accordingly rather than waiting for a buyer to justify your current ask.
- Know your bottom line before you list, because with an average CP/OLP% of 90.19%, buyers are very likely to come in below your asking price, and being prepared to respond quickly with a realistic counteroffer keeps deals from falling apart during the negotiation phase.
- Factor holding costs into your pricing decision from the start: with an average of 50 days on market and June data showing sellers receiving 90.19% of their original list price, overpricing and then reducing costs money in carrying expenses that a realistic opening price would have avoided entirely.
- Invest in property condition and presentation, because in a market with 190 active listings competing for 19 to 21 closings per month, properties that show well, are priced accurately, and require minimal immediate work from a buyer attract stronger offers and fewer contingencies.
- Monitor the June pending contract data as it converts: 27 new pending contracts is one of the more encouraging monthly readings in recent months, and if July and August confirm that buyer activity is genuine and sustained, the market may be gradually improving in a way that rewards sellers who stay patient and priced correctly.
Final Word on the Market
June 2026 is a buyer's market in the clearest sense of the term. More properties are available than there are buyers actively closing, prices have declined substantially from their peaks, and buyers have time, options, and negotiating leverage that sellers do not. For buyers who have been watching from the sidelines while prices were elevated, the current environment represents one of the more accessible entry points Austin's multi family market has offered in recent years.
The honest read on timing, for buyers, is that opportunity is real but not risk-free. Prices have fallen 28.3% from June 2025, but that does not confirm they have reached a floor. If you are buying for a long-term investment horizon, the current price level likely offers solid value relative to where the market was trading 12 to 18 months ago. If you are buying with a plan to sell within one to two years, the near-term price trajectory introduces uncertainty that should be part of your decision-making process.
For sellers, the data is a direct call to act with realistic expectations. The market is moving: contracts are being signed, buyers are out there, and June's pending count is one of the stronger monthly readings in some time. But buyers are paying $455,000, not $610,000, and every additional week on the market at an above-market price erodes your eventual net proceeds. The best outcome for sellers in this environment comes from pricing honestly, presenting the property well, and letting the market work at its current level rather than last year's.
Questions About the June 2026 Austin Multi Family Real Estate Price Report?
Have questions about what the June 2026 Austin Multi Family Real Estate Price Report means for your specific situation? We are happy to help. If you are thinking about buying a multi family property in Austin, our Buyers page has resources to help you understand the process and get started. If you are thinking about selling, our Sellers page walks through what to expect in today's market.
Reach out to Rebecca Jacks and the team at Eleven Oaks Realty. Call or text (512) 827-8323 or email info@11OaksRealty.com. We have been helping buyers and sellers since 1978 and we are here to help you make the best decision for your situation, whatever that looks like.
Data sources: Realtors Property Resource (RPR), Austin Board of REALTORS MLS. All figures are for multi family residential properties (duplex, triplex, and quadplex) in the city of Austin. Reported figures reflect June 1, 2026 through June 30, 2026. Some variation between data sources may exist due to differing methodology and timing of data pulls.




Leave a Reply