
Eleven Oaks Realty is proud to present their April 2026 Austin Multi Family Real Estate Price Report measuring activity in the Austin multi family market. This report includes all multi family properties (duplex, triplex and quadplex) that sold in April 2026.
April brought a notable price reset to the Austin multi family market. The median sold price fell to $475,000, down 14.8% from March and down 25.3% from April 2025’s $636,000, marking one of the lowest readings in the past two years. At the same time, new pending listings surged 55% month over month to 31, the strongest demand signal in months, while the median time to sell dropped sharply from 65 days to 35. The market is moving in two directions at once: prices are softer but buyer activity is picking back up.
All data below covers multi family residential properties (duplex, triplex, and quadplex) in the city of Austin. Data is sourced from Realtors Property Resource (RPR) and the Austin Board of REALTORS MLS. Some metrics may vary slightly between sources due to differing methodology; where differences exist, they are noted.
The Austin Multi Family Market is a Buyer's Market
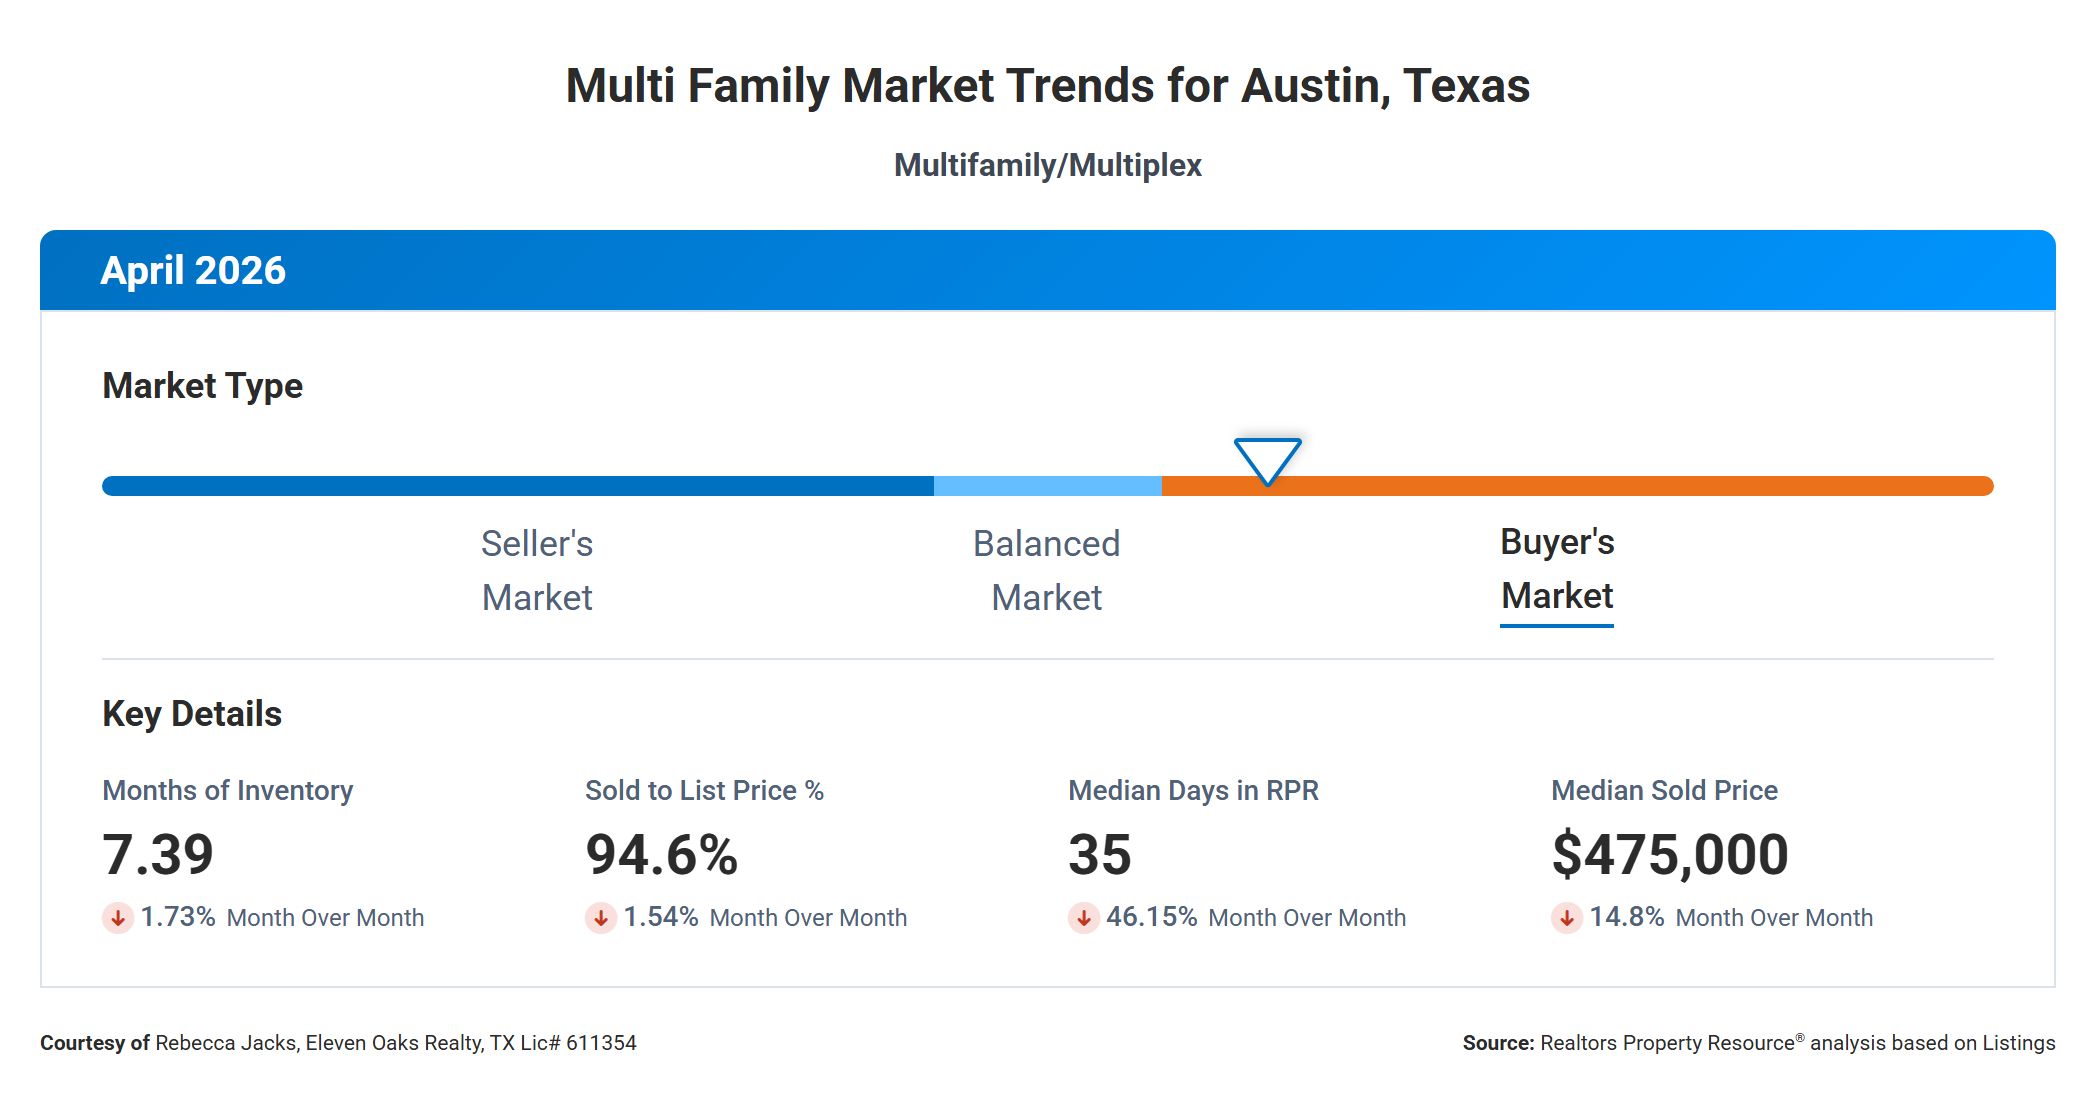
The RPR Market Trends dashboard placed Austin squarely in Buyer's Market territory in April 2026, with 7.39 months of supply on hand. Anything above roughly six months generally tips the scales toward buyers, and at 7.39, sellers are competing for a pool of buyers who have real options and time to be selective. That said, months supply did tick down 1.73% from March's 7.52 and is down 16.2% from April 2025's 8.82, so the trend is slowly improving for sellers.
The four key dashboard metrics tell a mixed story. Months of inventory at 7.39 confirms buyer-favorable conditions. The sold-to-list price ratio came in at 94.6%, down 1.54% month over month, meaning buyers are consistently negotiating below the asking price. Median days in RPR dropped dramatically from 65 to 35, a 46.15% improvement, which suggests that the properties that are selling are moving faster. The median sold price of $475,000 fell 14.8% month over month, though that figure can shift sharply in a thin market when the mix of properties sold changes from one month to the next.
Together, these signals say that buyers are in control but starting to engage more actively. Sellers who price accurately are finding takers; sellers who hold out at 2024 prices are watching their properties sit. For buyers, the window of maximum leverage may be narrowing as pending contracts accelerate.
Median Sold Price Down 25.3% Year Over Year
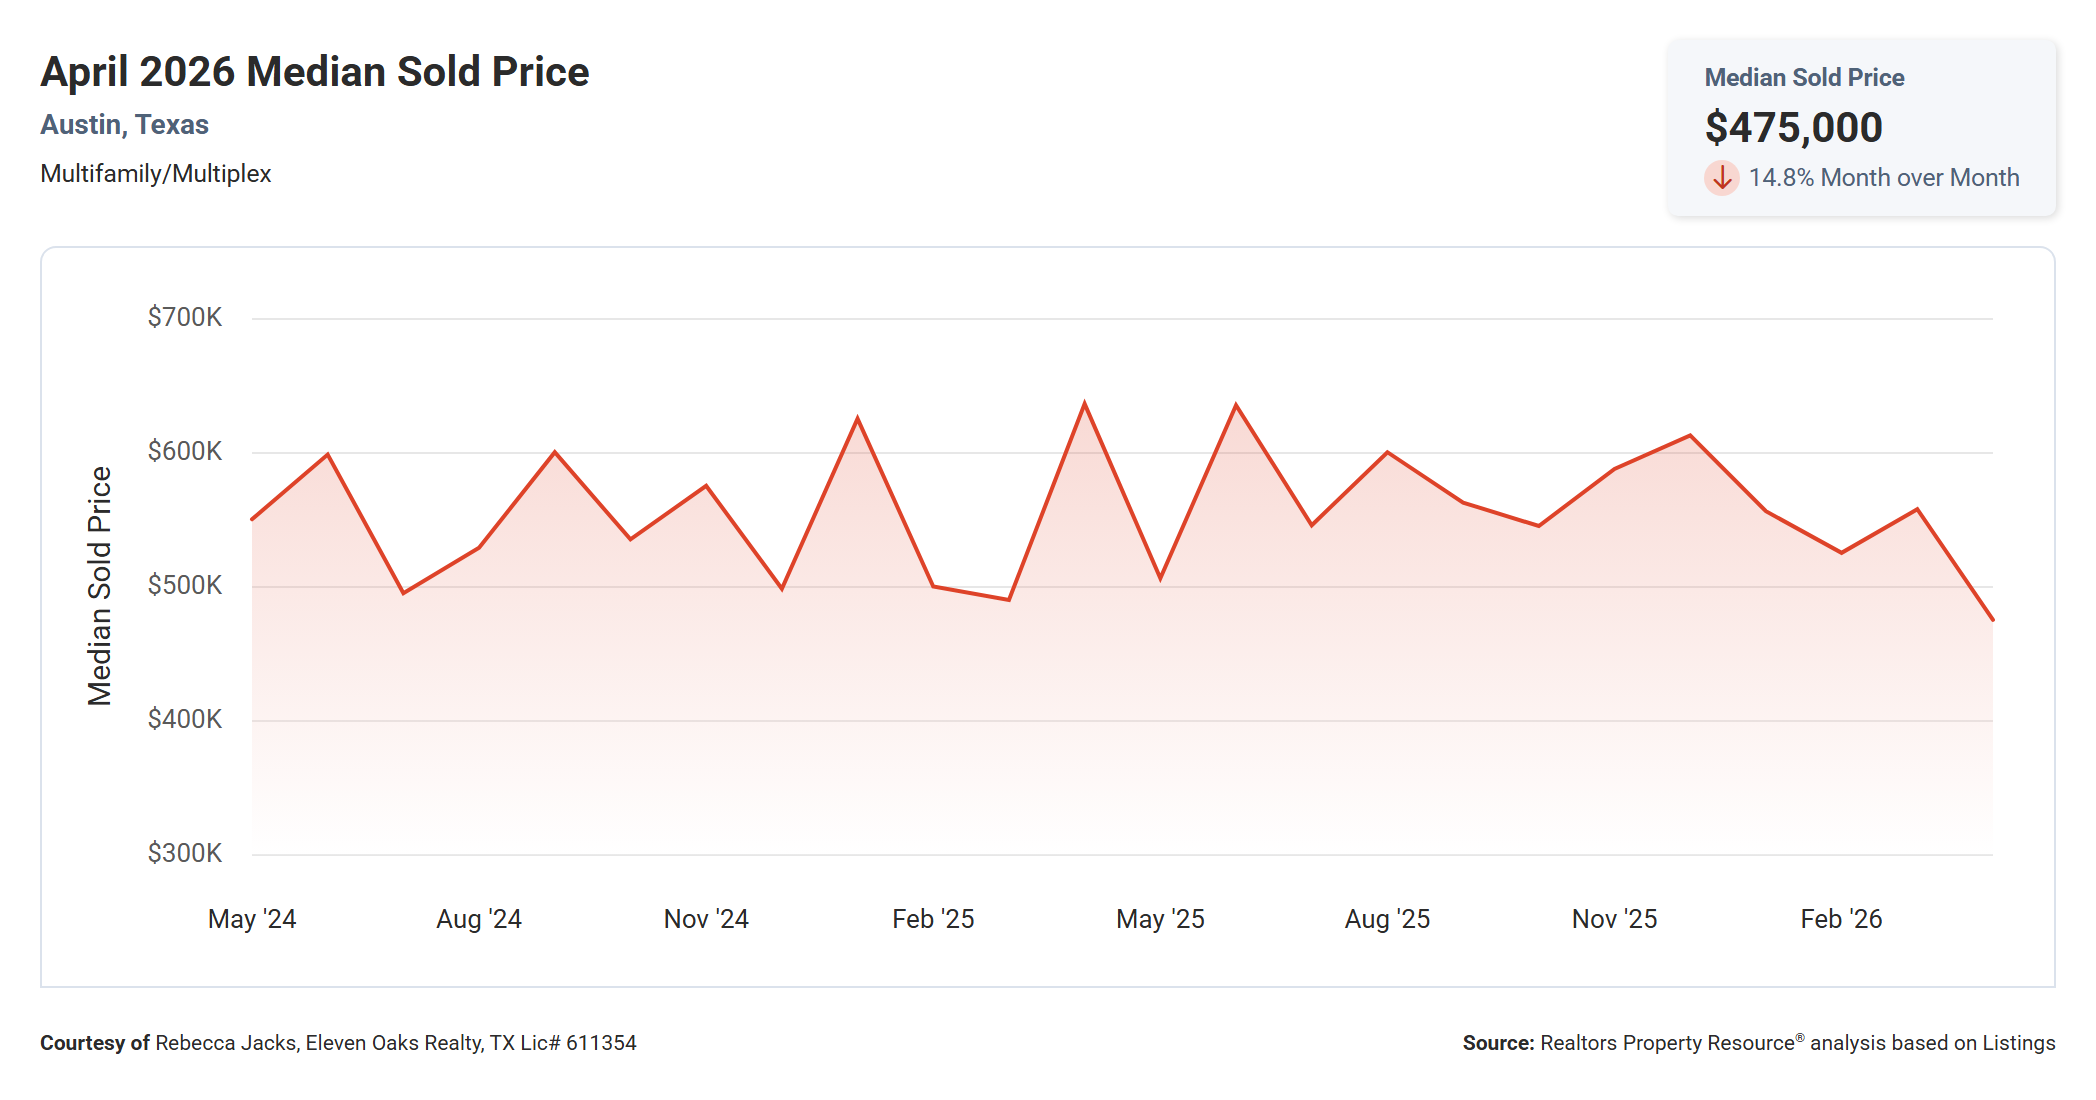
The median sold price for Austin multi family properties in April 2026 was $475,000, down 14.8% from March's $557,500 and down 25.3% from April 2025's $636,000.
Looking at the two-year chart, median sold price has ranged roughly between $475,000 and $640,000 since mid-2024, with no clear sustained upward trend. April 2026 sits at the lowest point of that range. In a market with only 18 sales per month, a single large or small transaction can move the median meaningfully, so one month's reading should be interpreted alongside the broader chart trend rather than in isolation.
In dollar terms, a 25.3% year-over-year drop translates to roughly $161,000 less than what the typical property sold for in April 2025. For buyers, that represents a real opportunity to enter the Austin multi family market at prices not seen in years. For sellers, it underscores the importance of pricing to today's market conditions rather than benchmarking to 2025 comps.
The gap between the median sold price ($497,500 per the MLS statistics) and the average sold price ($635,400) is notable and worth understanding. The average is being pulled upward by a handful of higher-priced transactions, including one that closed at $1,706,000. The median gives a more accurate picture of what the typical multi family buyer paid in April. Both numbers tell part of the story, but the median is the better measure of typical market conditions.
Number of Sold Properties Essentially Unchanged Year Over Year
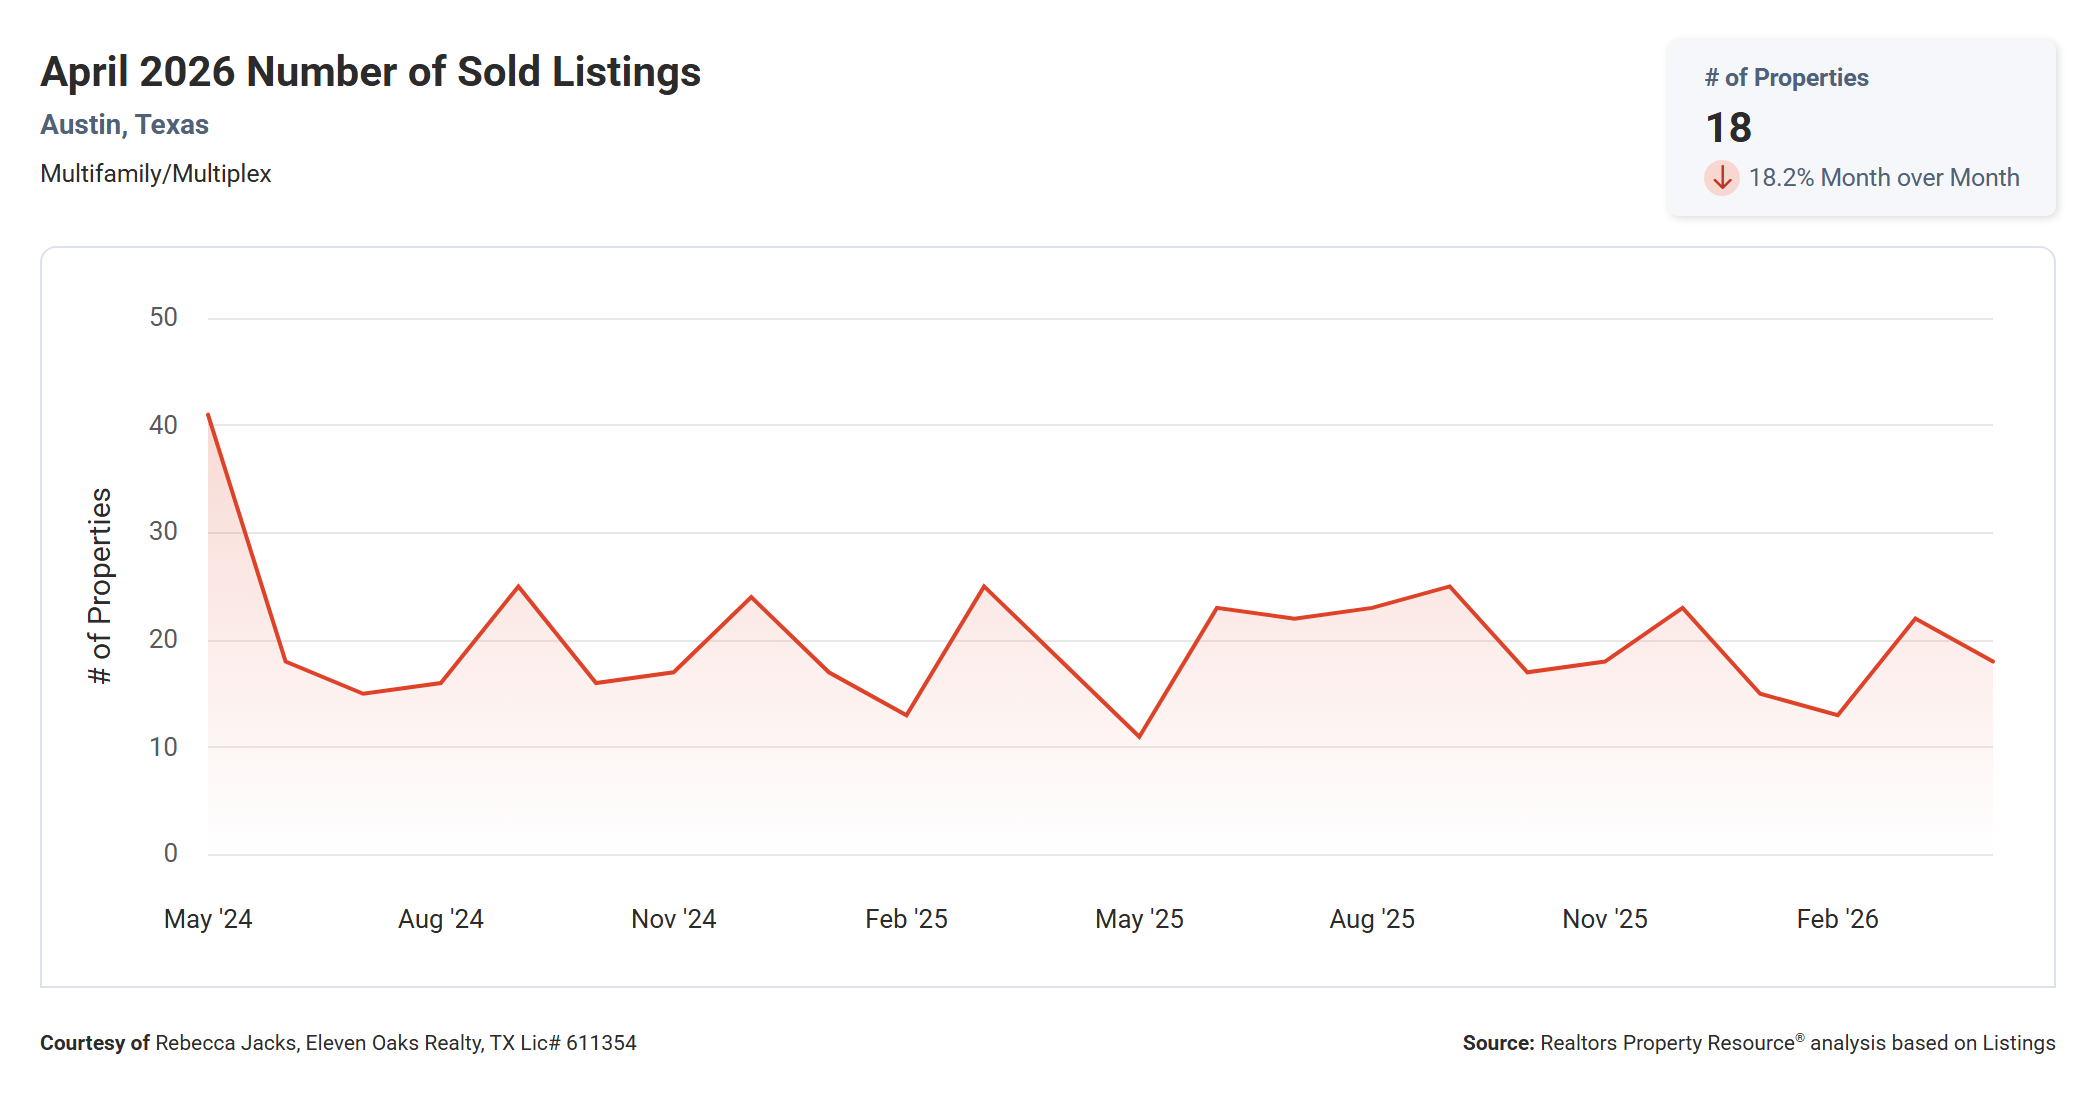
A total of 18 multi family properties sold in Austin in April 2026, down 18.2% from March's 22 sales but exactly in line with April 2025's 18 sales, leaving year-over-year volume essentially unchanged.
The two-year sales chart reflects the persistent thinness of this market. Volume peaked at roughly 41 in May 2024 and has generally settled into a range of 13 to 25 sales per month. Eighteen sits in the middle of that range, suggesting that demand is neither collapsing nor recovering in any dramatic way month to month.
For buyers, consistent transaction volume at these levels means the pool of available comps is limited, and comparable sale data can be influenced significantly by individual property characteristics. Underwriting carefully and relying on a current appraisal is especially important in a market this thin. For sellers, the fact that 18 buyers did transact in April confirms that willing buyers exist, but pricing and condition matter more here than in a higher-volume market.
Average Sold to List Price Down Slightly Year Over Year
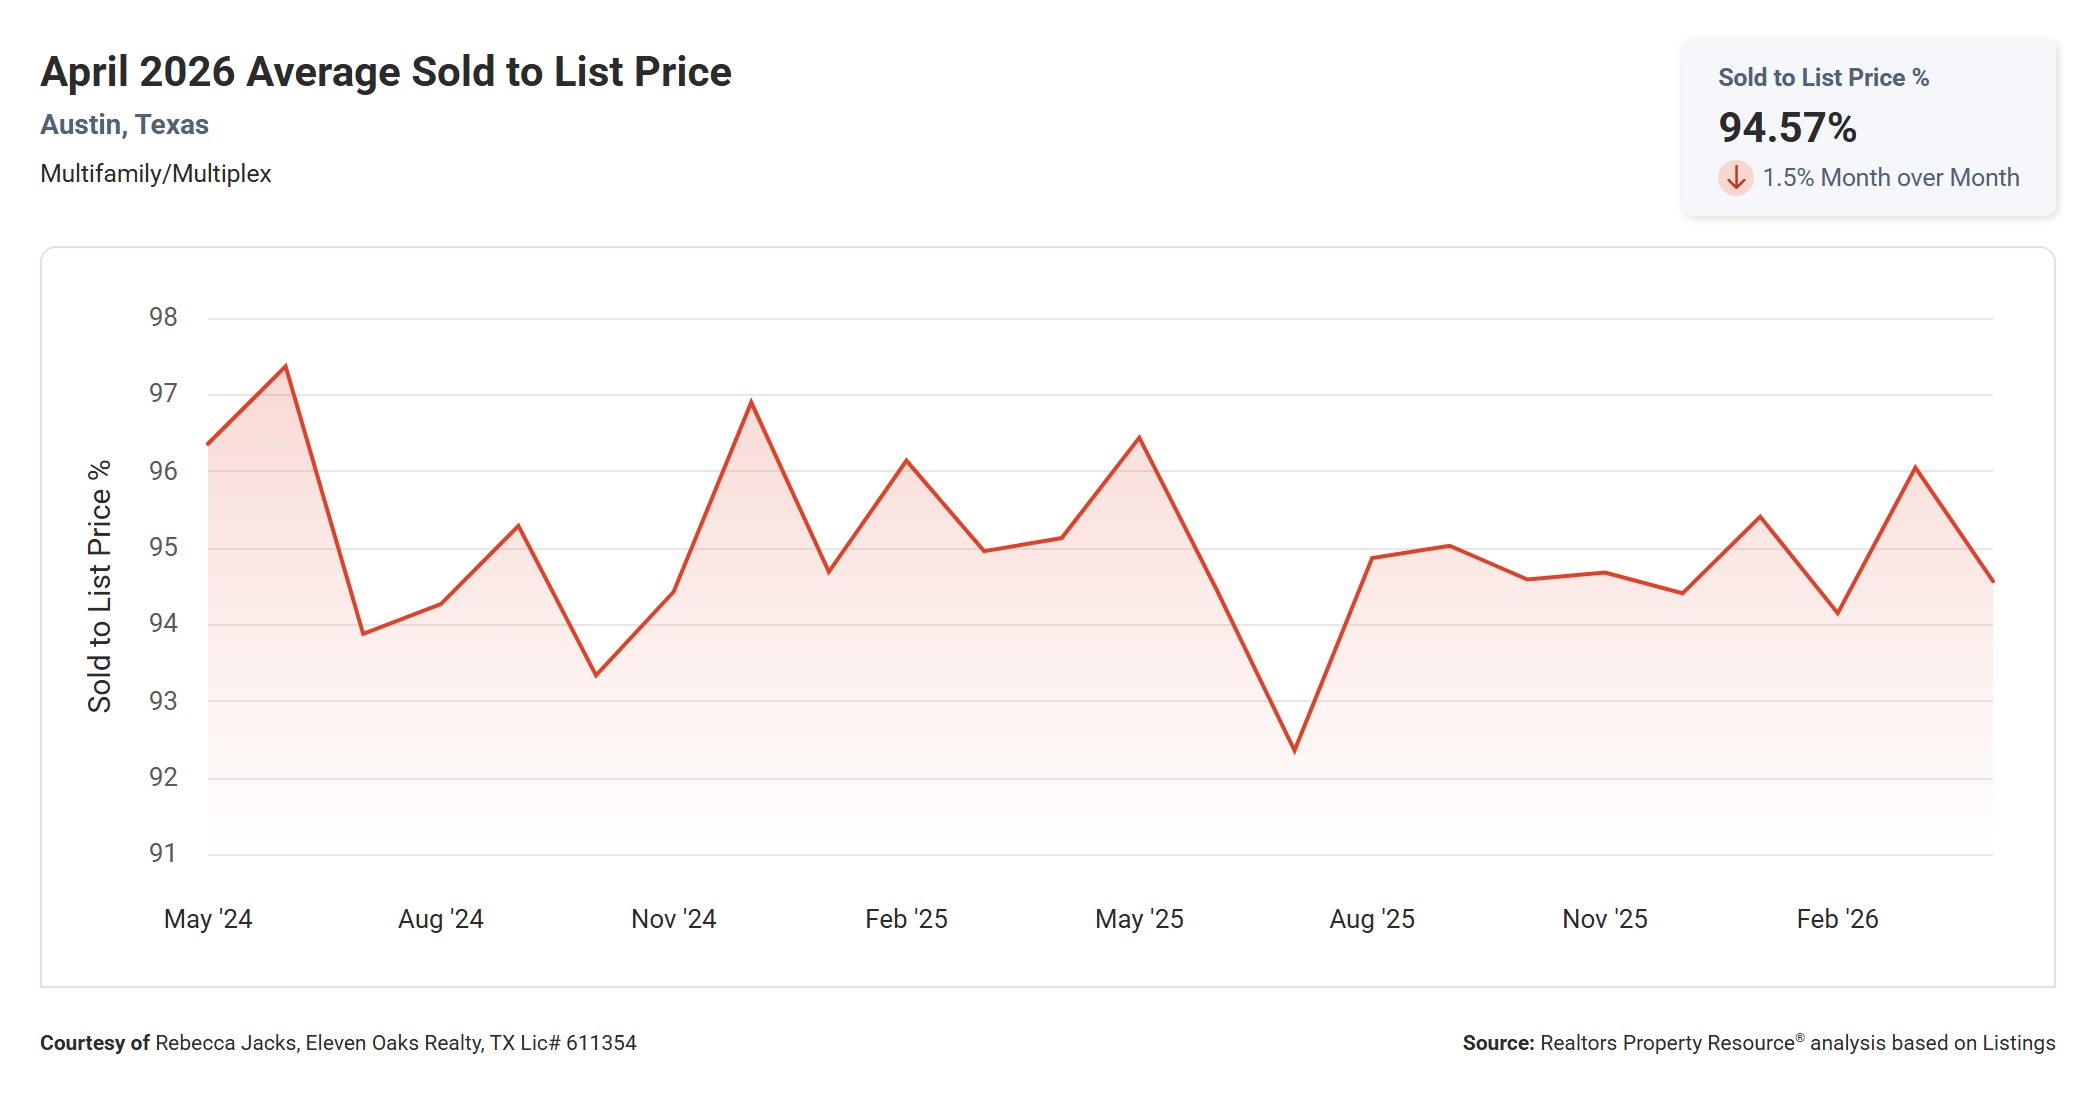
The average sold-to-list price ratio in April 2026 was 94.57%, down 1.5% from March's 96.05% and down slightly from April 2025's 95.13%, a year-over-year change of roughly 0.6 percentage points.
The two-year chart shows this metric has generally oscillated between 92% and 97%, with no sustained directional move in either direction. April's 94.57% sits comfortably in the middle of that range. The brief dip below 93% in summer 2025 appears to have been a temporary low; since then, the ratio has stabilized in the mid-94% to 96% band.
What this means in practical terms: multi family buyers in Austin are typically negotiating approximately 5.4% below the final list price before closing. That gap is meaningful on a $475,000 median transaction, representing roughly $25,700 in negotiated savings. For sellers, it reinforces the need to price precisely rather than leaving room for negotiation that buyers are increasingly unwilling to fill.
Median Time to Sell Up 169.2% Year Over Year
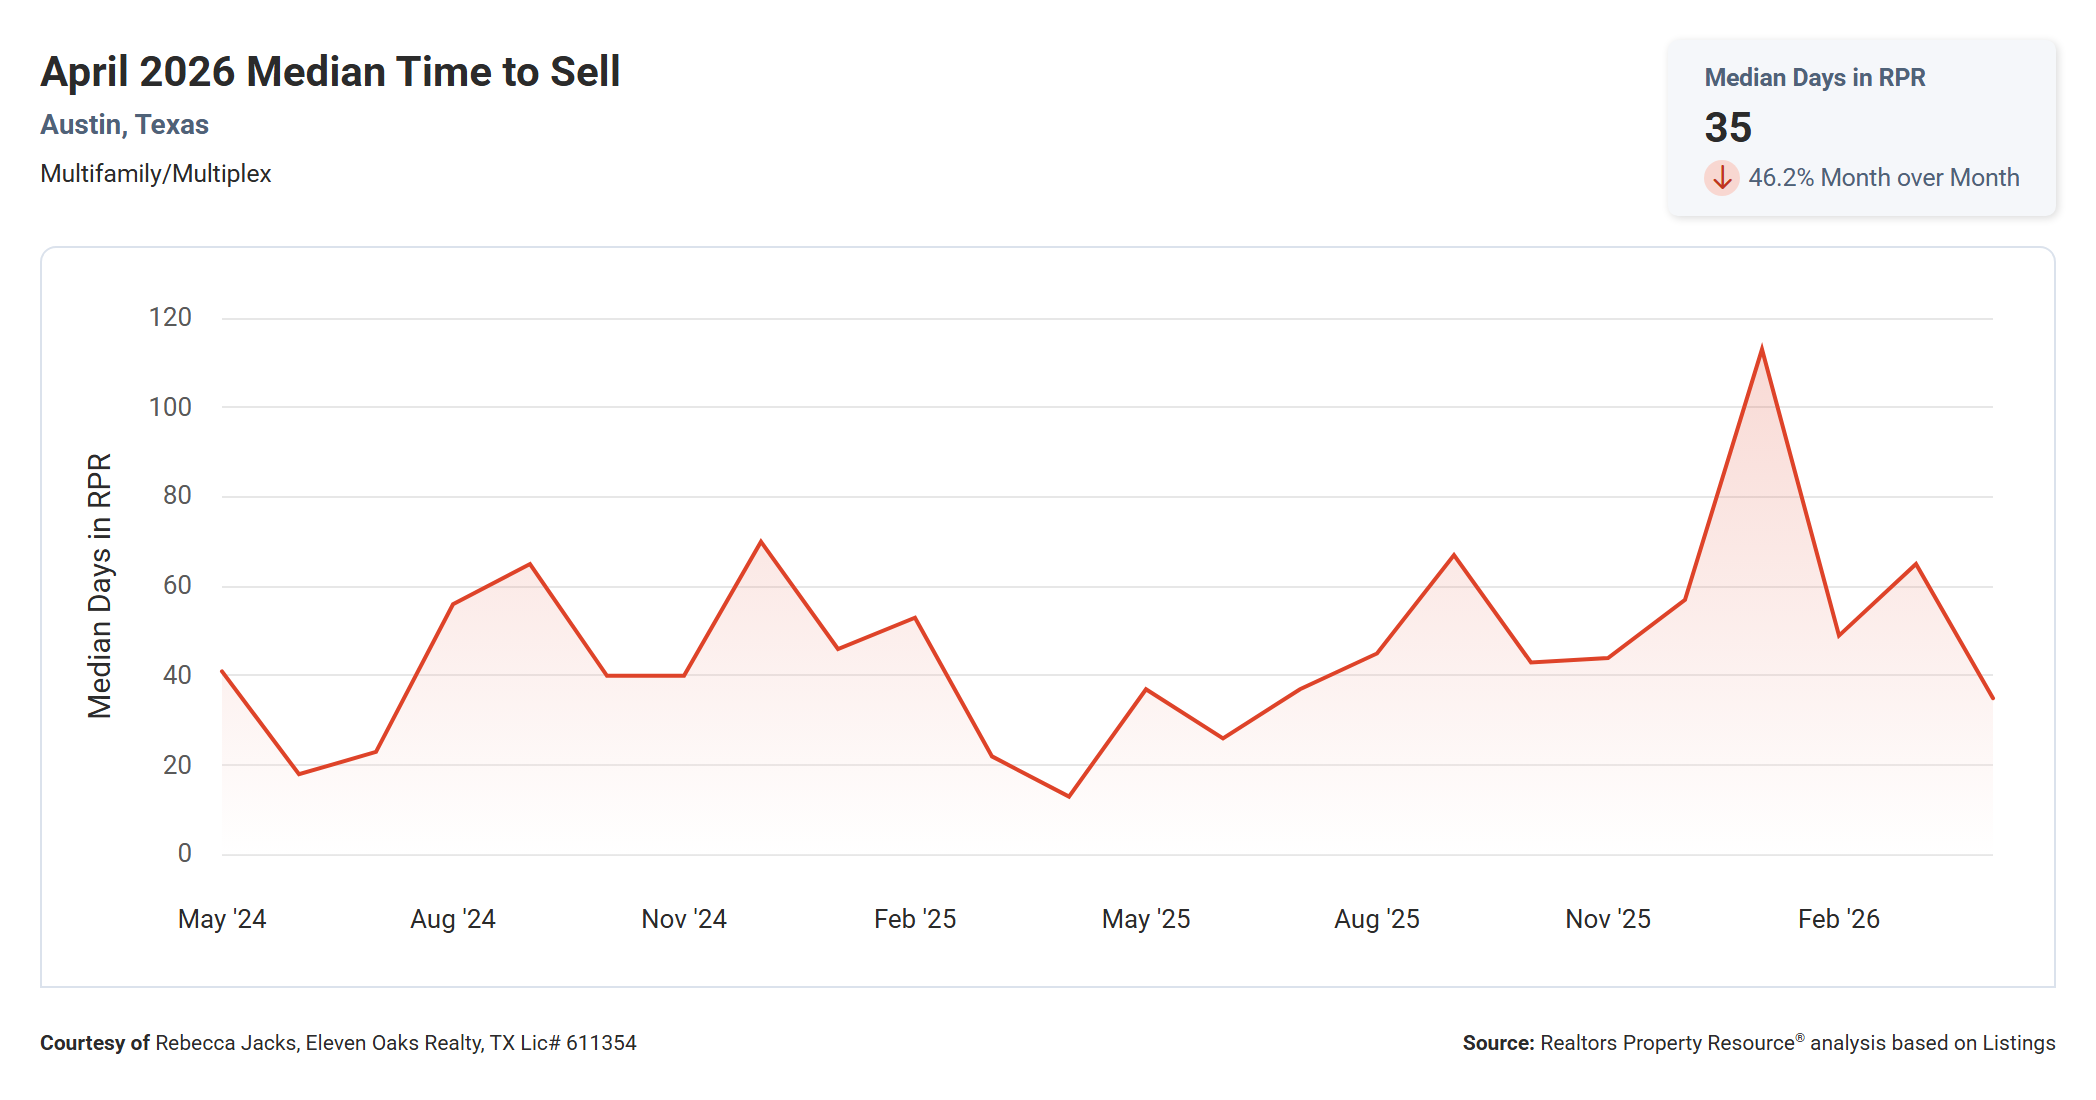
The median time to sell for Austin multi family properties in April 2026 was 35 days, down 46.2% from March's 65 days but up 169.2% from April 2025's 13 days.
Because multi family transaction volume is small, monthly and year-over-year percentage swings in this metric can be extreme and should be interpreted with that context in mind. A shift from 13 median days to 35 involves a relatively small number of transactions, and the mix of properties that happened to sell in each month influences the result significantly.
The two-year chart tells a more nuanced story. Days to sell spiked to a two-year high of roughly 113 in January 2026, then pulled back sharply to 35 in April. That swing likely reflects some cleared backlog of slower-moving properties closing after extended time on market, followed by faster-moving properties making up the April mix. The underlying trend from late 2024 through 2025 shows days to sell generally in the 25 to 65 day range. At 35 days, April is on the lower end of that range, which is an encouraging sign for sellers who price correctly.
Median Price Per Square Foot Down 12.8% Year Over Year
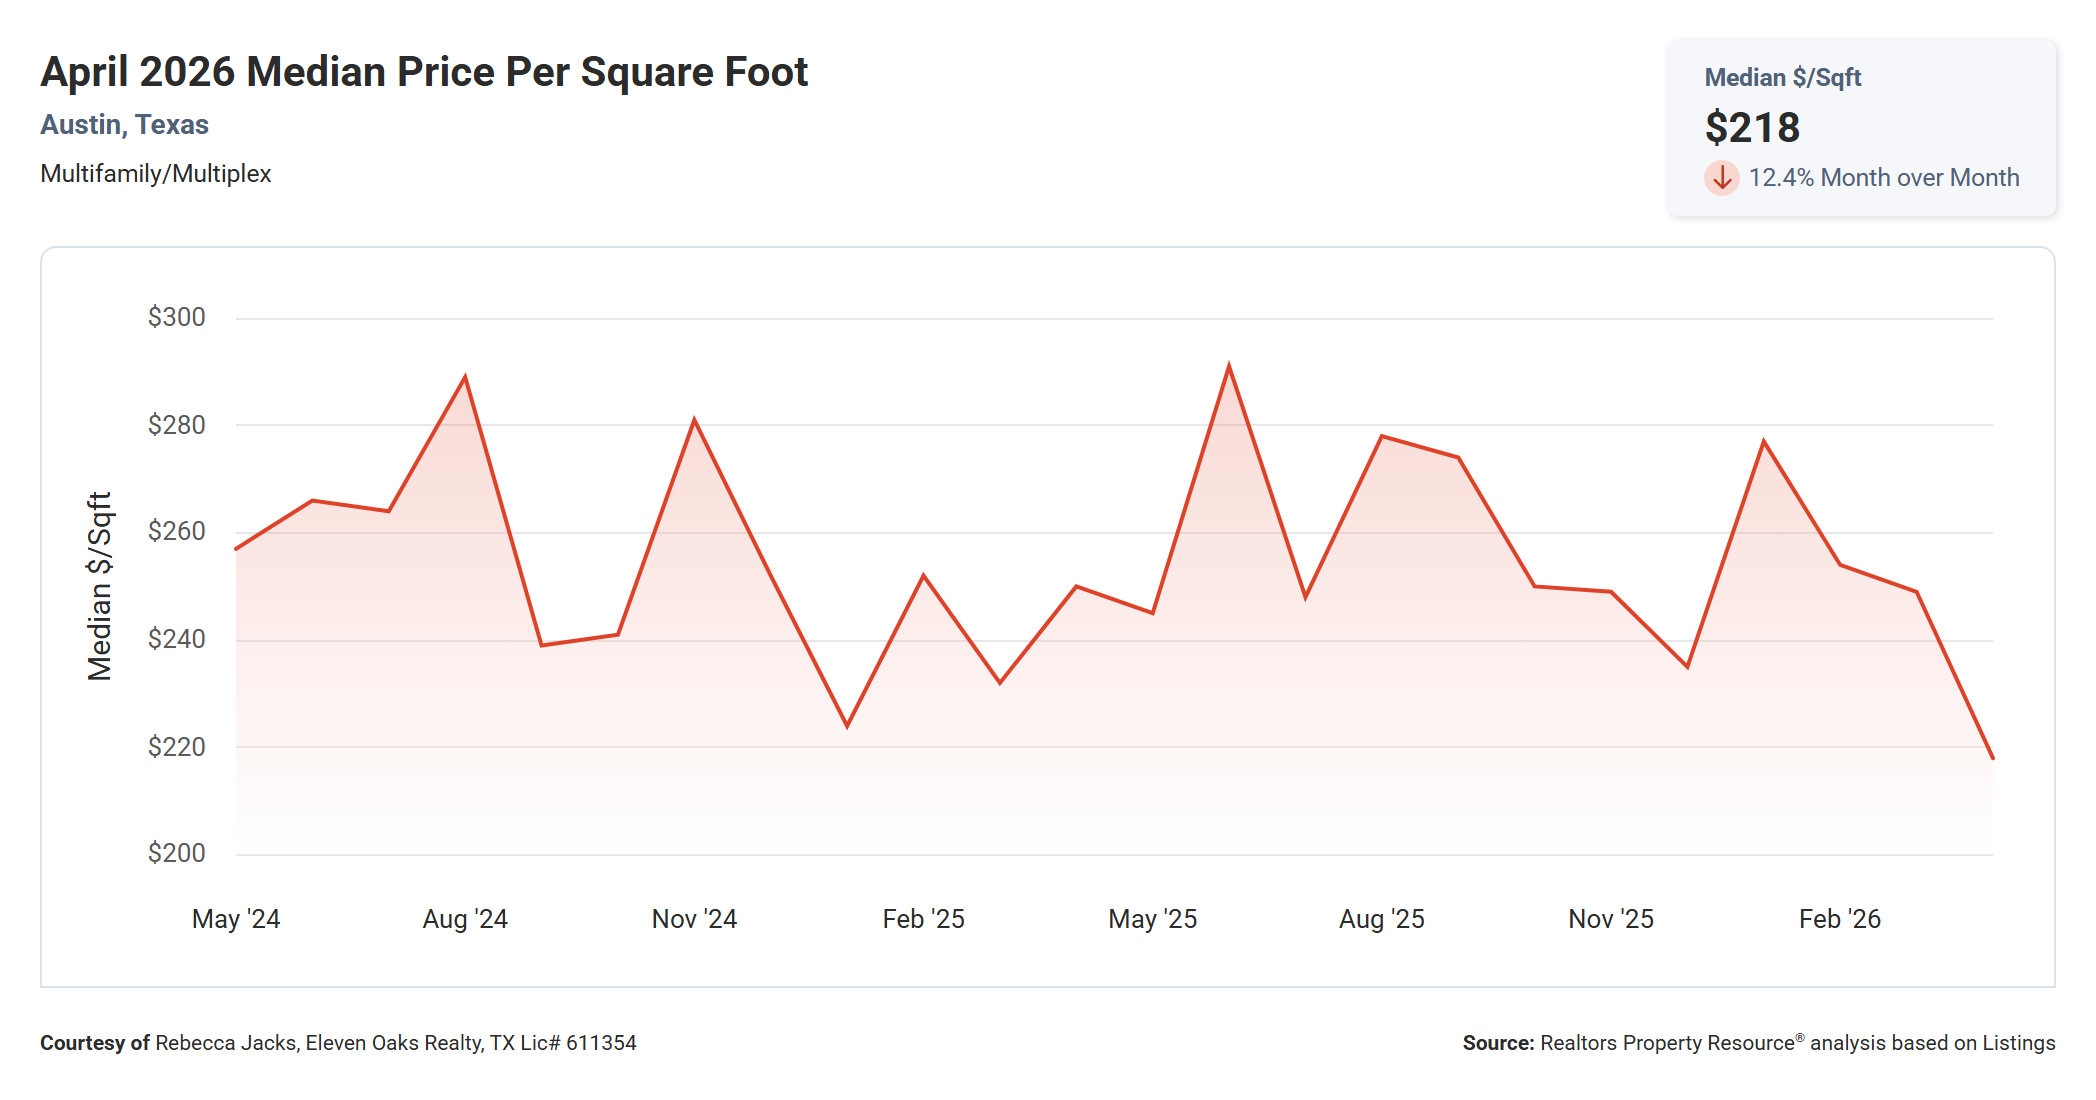
The median price per square foot for Austin multi family properties in April 2026 was $218, down 12.4% from March's $249 and down 12.8% from April 2025's $250.
The two-year chart shows median price per square foot has fluctuated in a wide band, ranging from roughly $220 to $290 since mid-2024. April 2026's $218 reading sits at the lower boundary of that range and is the lowest value on the chart. The spikes to $280 and above tend to coincide with months when higher-end or more compact properties make up a larger share of sales.
For buyers evaluating specific properties, $218 per square foot is a useful benchmark but should be weighed against the specific characteristics of each building, including unit mix, condition, and location. For sellers, this metric is a signal that buyers are applying real scrutiny to price-per-square-foot figures and are not accepting premiums without justification.
Total Sales Volume Down 11.6% Year Over Year
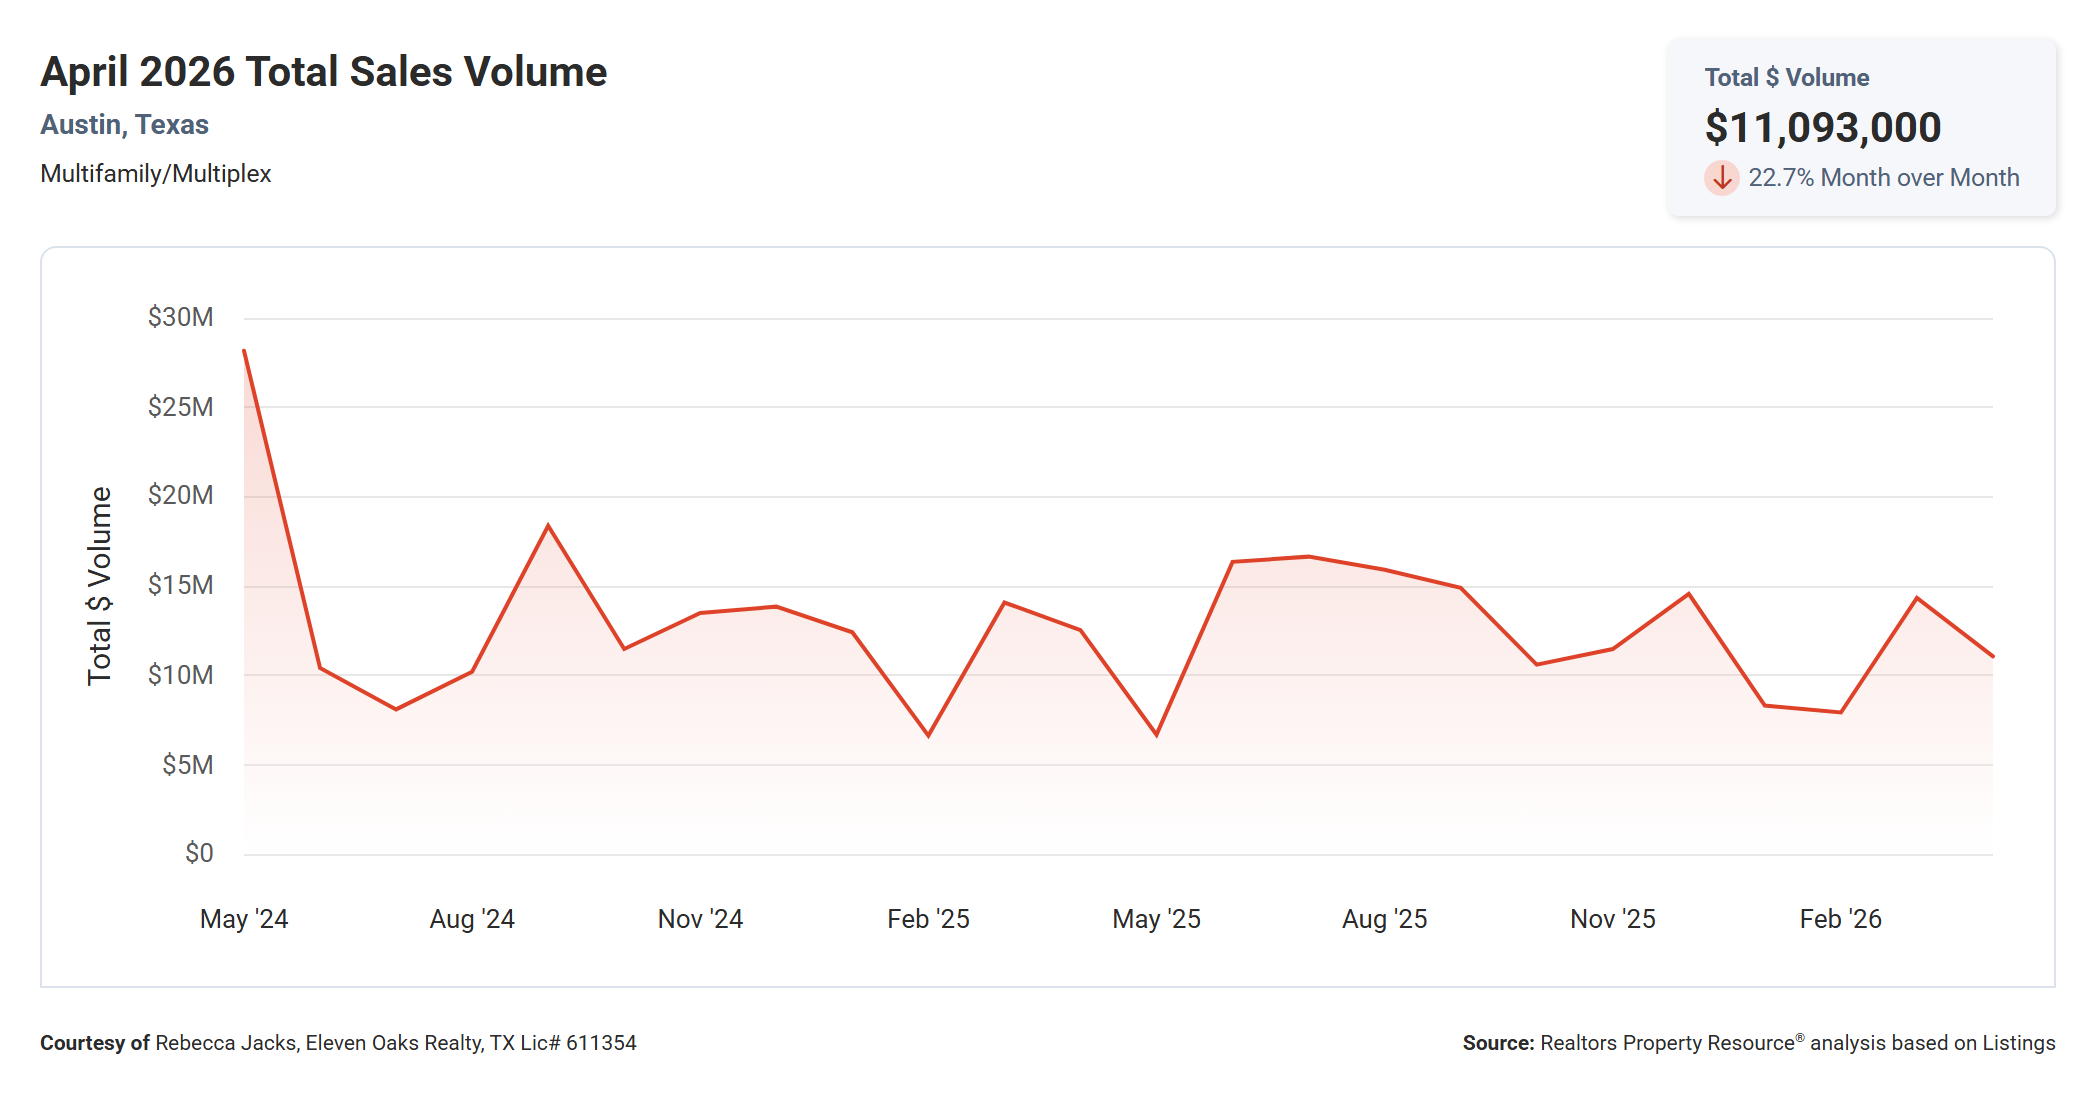
Total multi family sales volume in Austin in April 2026 was $11,093,000, down 22.7% from March's $14,350,000 and down 11.6% from April 2025's $12,550,000.
The two-year chart shows volume peaked at roughly $28 million in May 2024, a reading heavily influenced by transaction count that month. Since then, monthly volume has generally ranged between $7 million and $18 million. April's $11,093,000 sits below the midpoint of that range, consistent with the lower sold count and lower median price both pulling volume down.
Lower total volume in a thin market can be somewhat misleading as a standalone indicator. The more important question is whether buyer activity is picking up, and the surge in new pending listings to 31 in April suggests it is. Volume figures for May and June will be telling. If pending contracts from April convert to closings, total volume should recover.
Months Supply of Inventory Down 16.2% Year Over Year
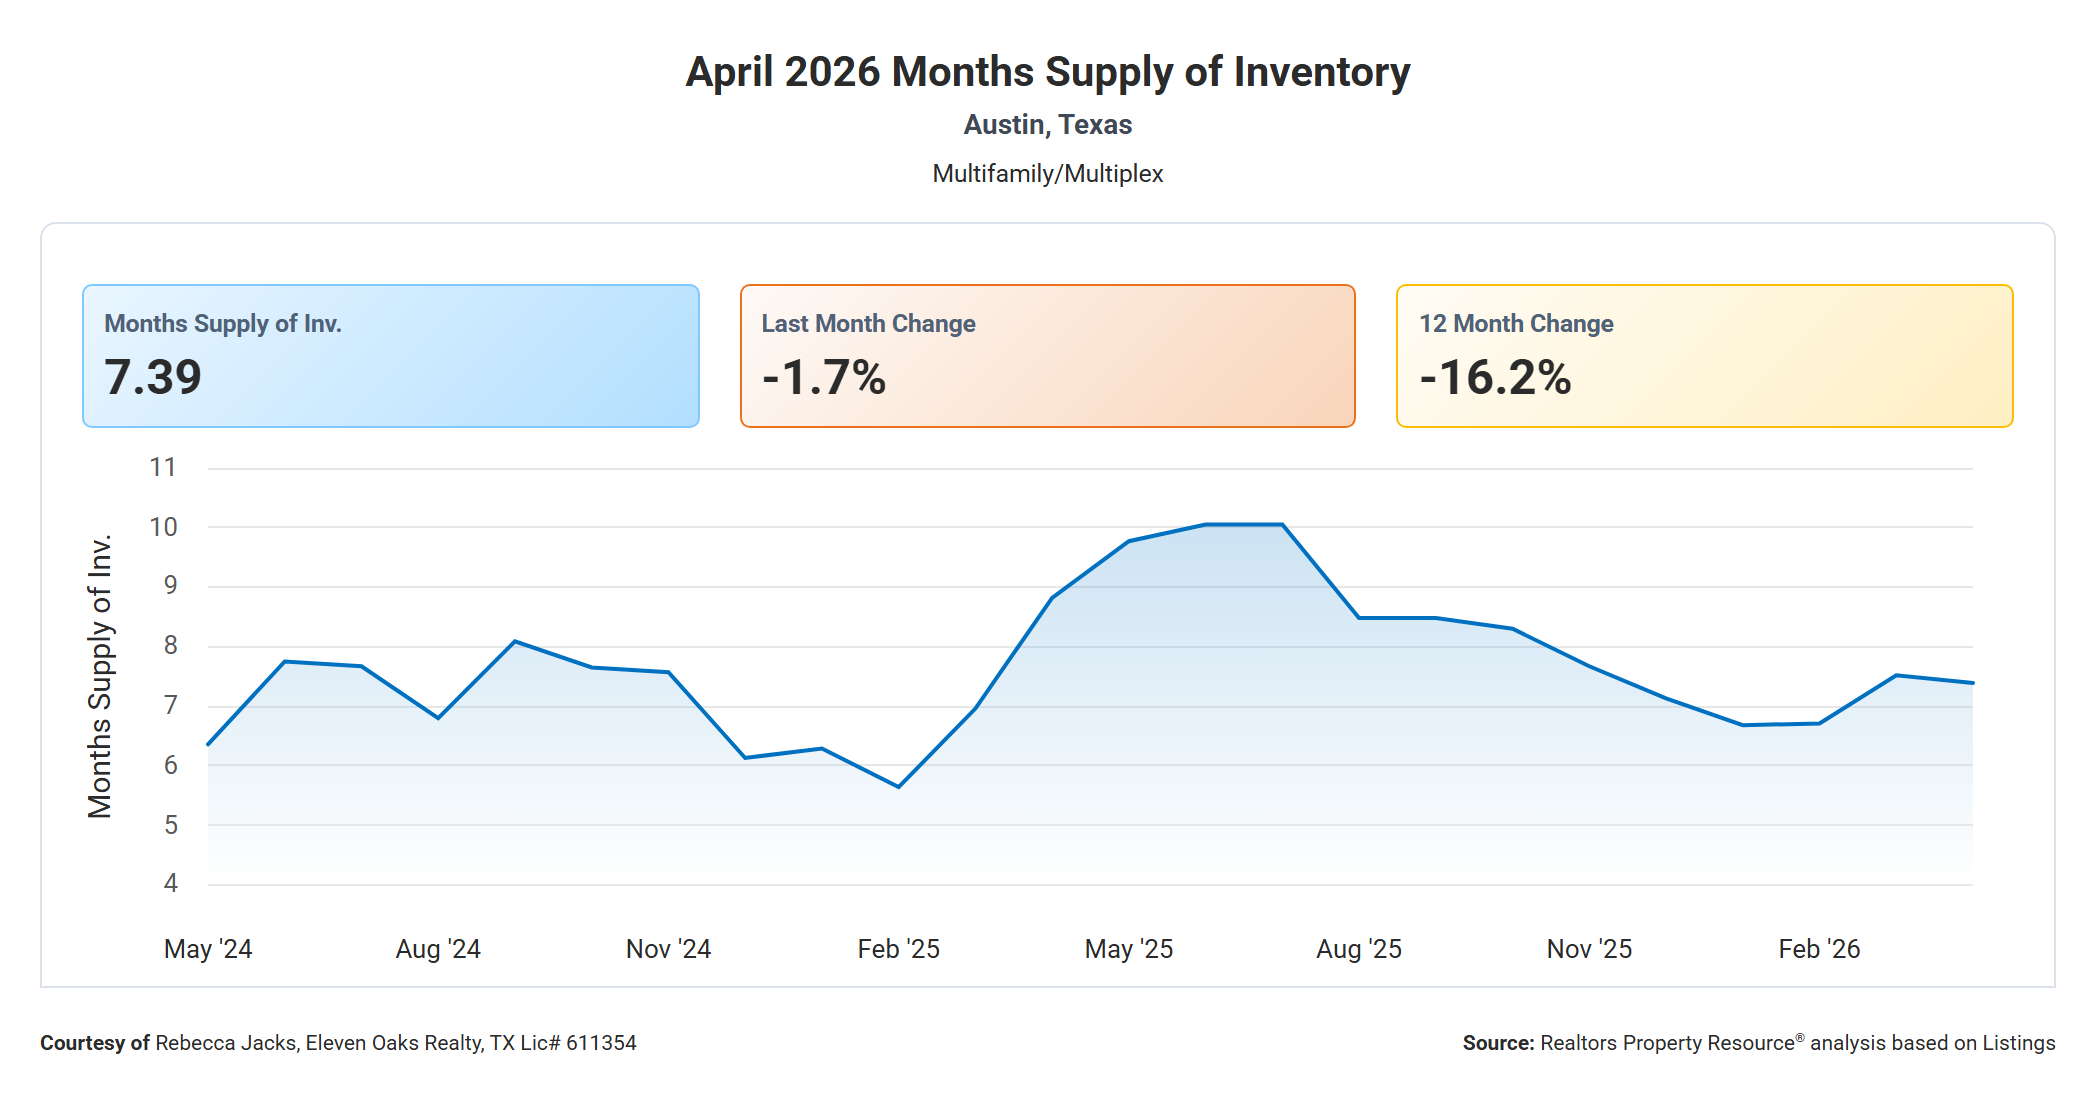
Months supply of inventory in Austin's multi family market in April 2026 was 7.39, down 1.7% from March's 7.52 and down 16.2% from April 2025's 8.82.
At 7.39 months, the market remains in Buyer's Market territory, but the year-over-year improvement of 16.2% is significant. A year ago, buyers had even more leverage with nearly 9 months of supply available. The trend since the 2025 peak of approximately 10 months (mid-2025) has been a gradual decline, which is consistent with supply normalizing and conditions slowly tilting back toward balance.
For buyers, 7.39 months still means meaningful negotiating power and time to evaluate options. For sellers, the direction of the trend is encouraging, even if the current reading still favors buyers. If months supply continues to decline toward the 5 to 6 month range over the coming months, pricing power will return more meaningfully to sellers.
New Pending Listings Up 138.5% Year Over Year
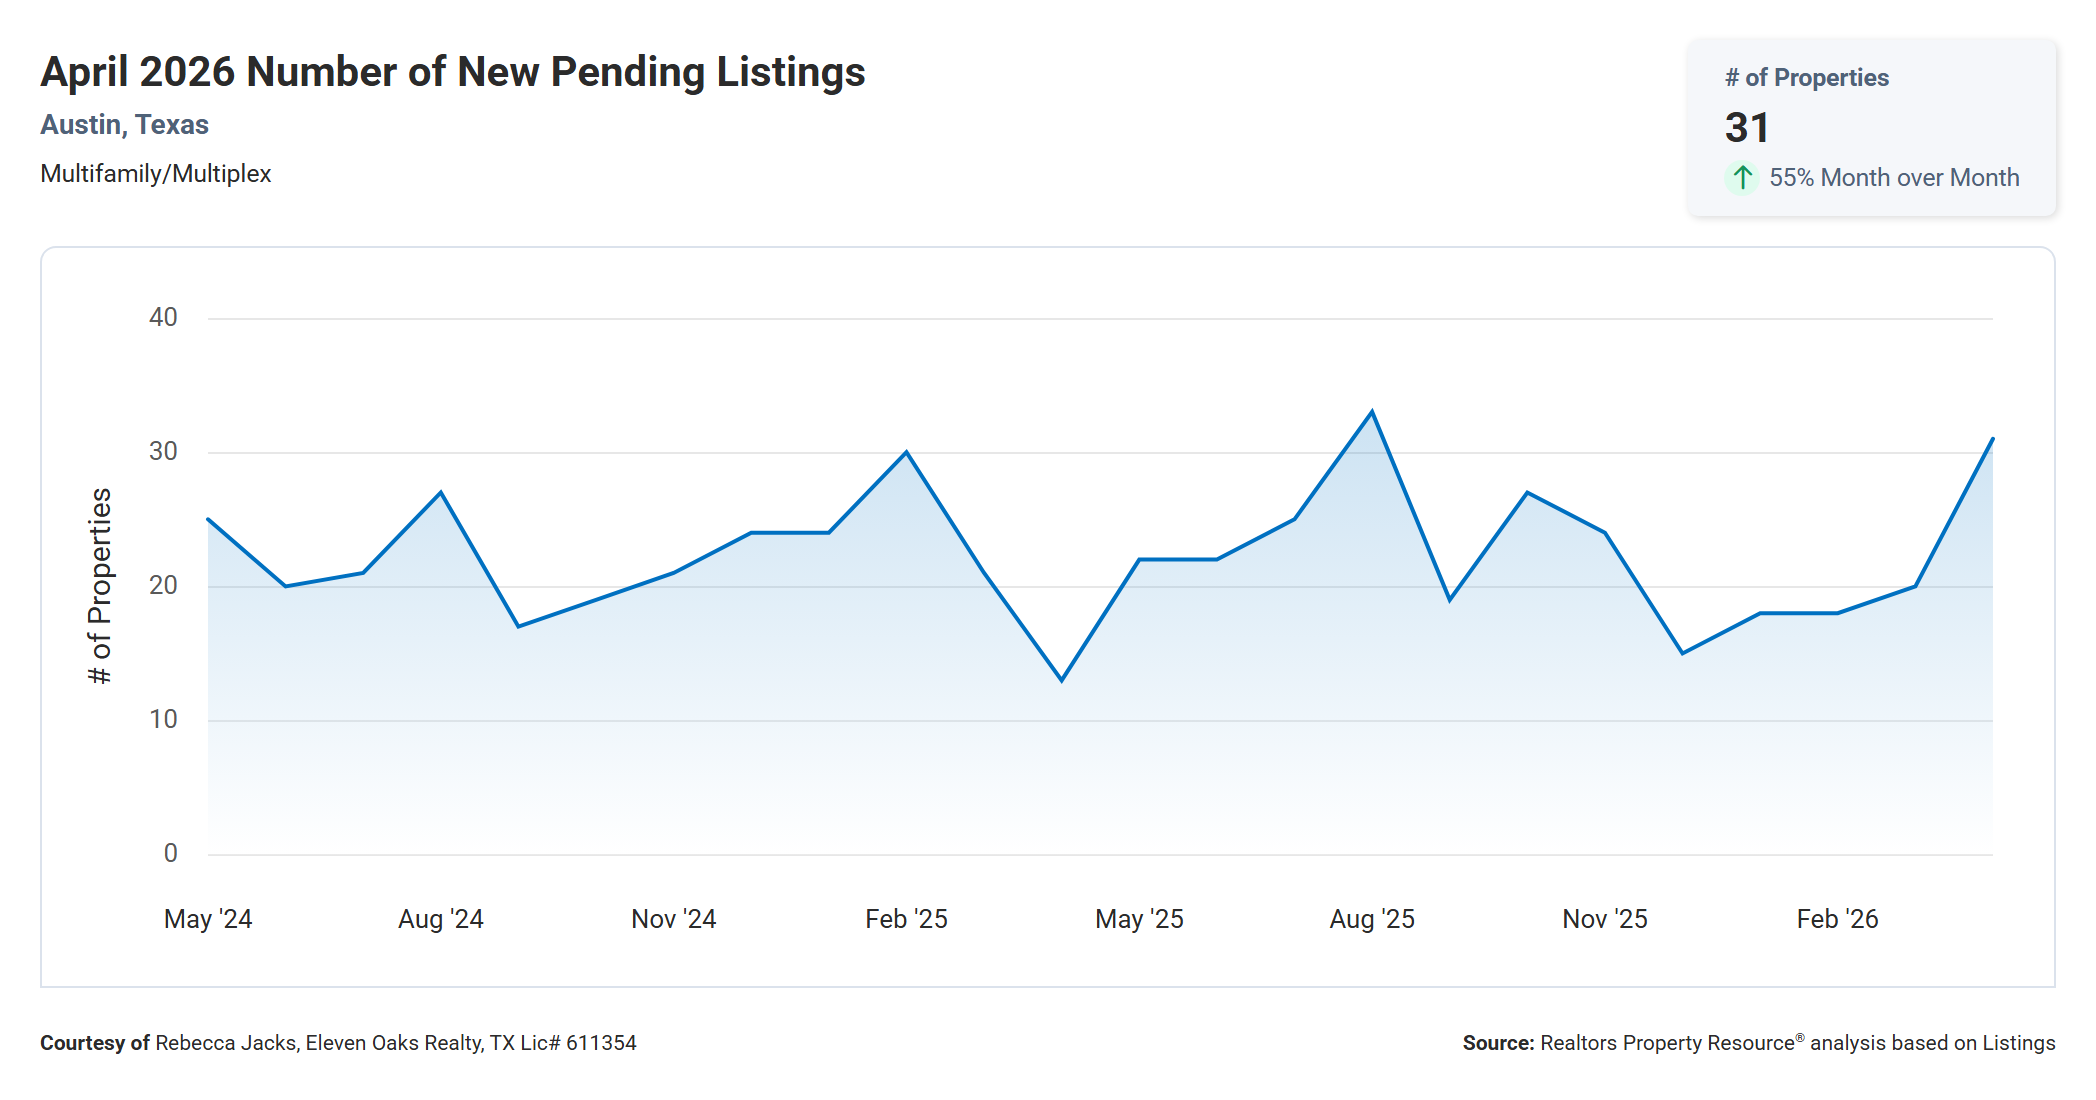
New pending listings in Austin's multi family market rose to 31 in April 2026, up 55% from March's 20 and up 138.5% from April 2025's 13.
Because multi family transaction volume is small, percentage swings in this metric can be dramatic, and the 138.5% year-over-year increase reflects in part the unusually low reading of 13 in April 2025 serving as the base. Still, 31 pending contracts is a genuinely strong number for this market. Looking at the two-year chart, the previous high was approximately 33 in August 2025, so April 2026 is approaching that peak.
This is the most encouraging data point in the April report. Pending contracts are a leading indicator of future closed sales, and a jump to 31 suggests that buyers who have been holding back are beginning to act. For sellers, this is a sign that demand exists at current price levels. For buyers, it may be an early signal that competition is starting to build, making it worth moving decisively on properties that meet investment criteria.
Median Active List Price Down 6.5% Year Over Year
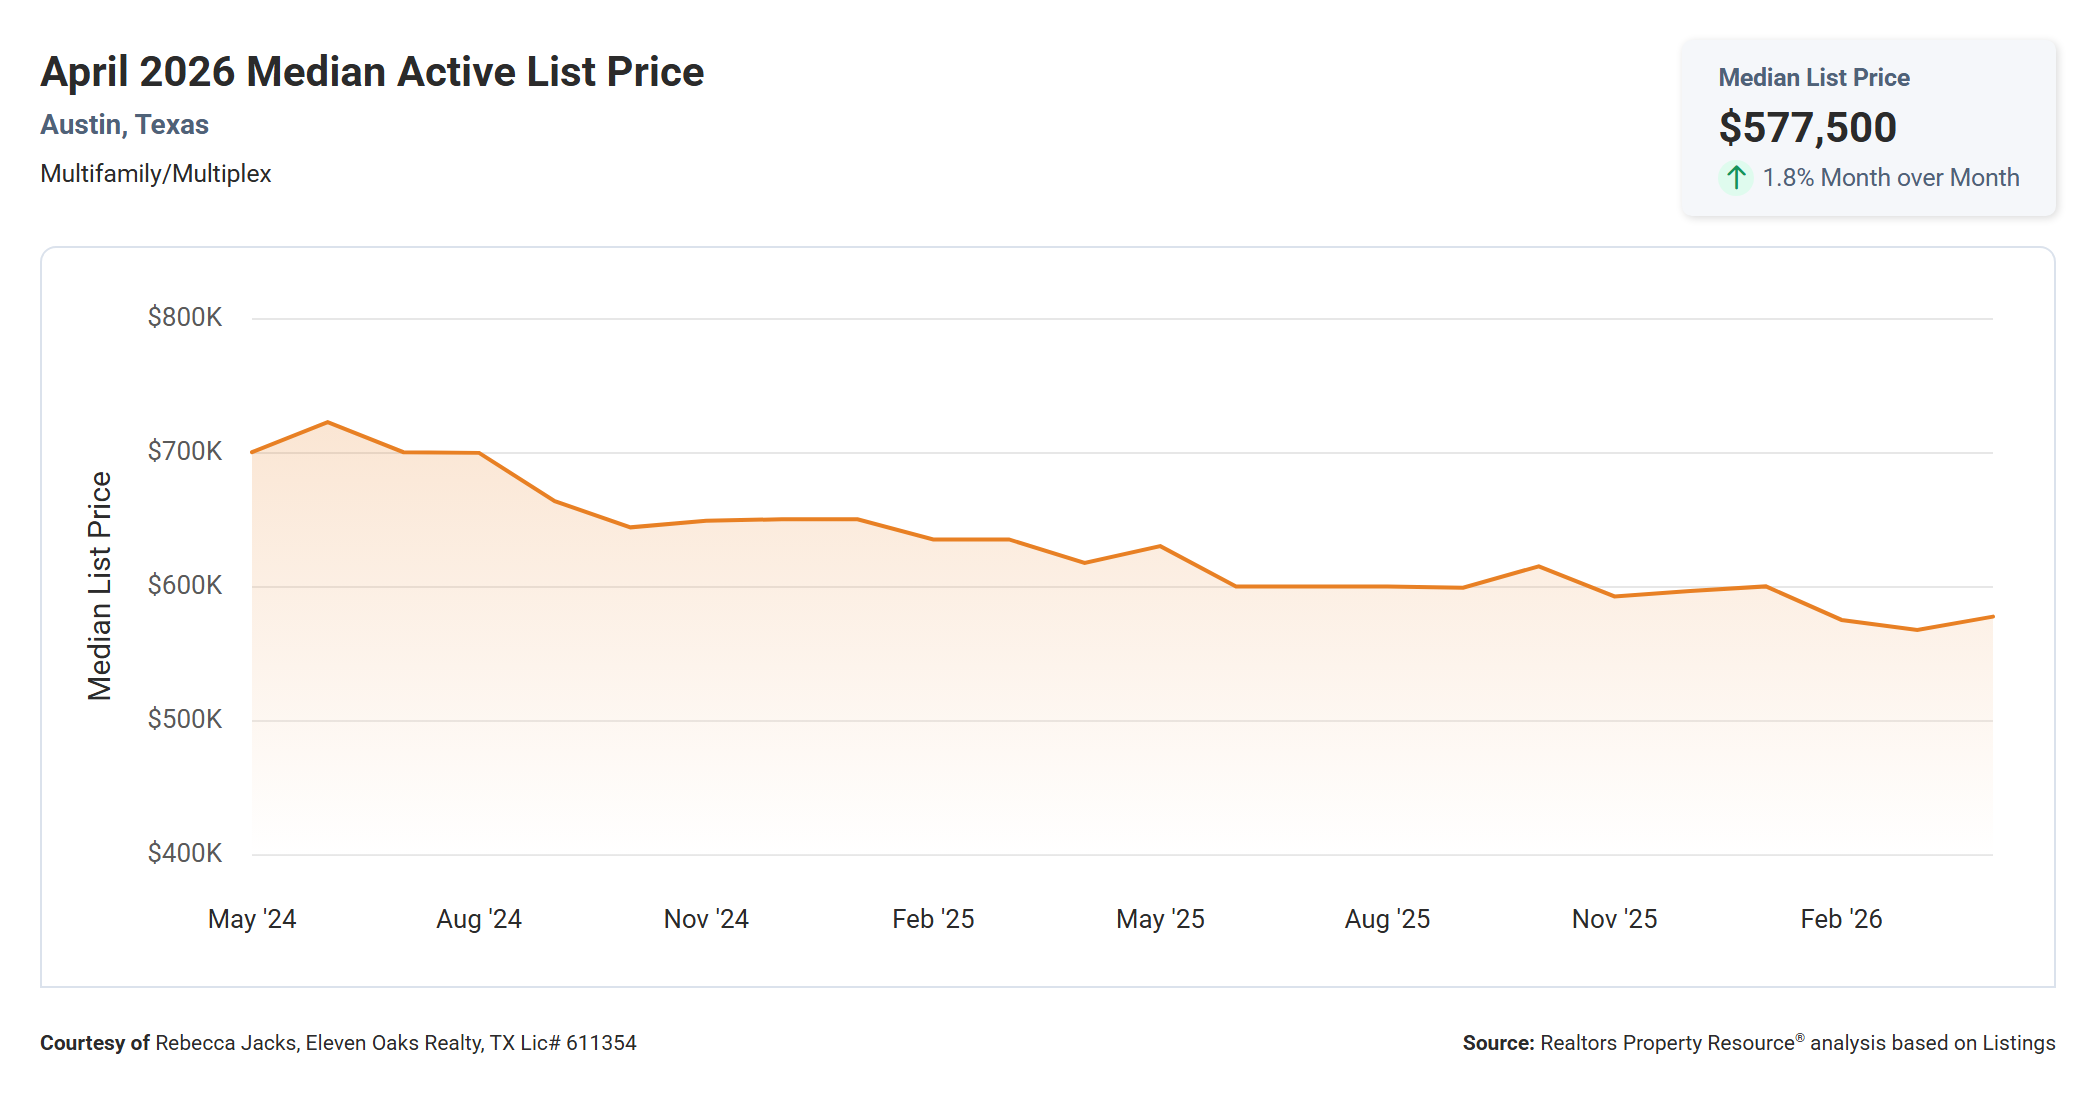
The median active list price for Austin multi family properties in April 2026 was $577,500, up 1.8% from March's $567,500 but down 6.5% from April 2025's $617,500.
The two-year chart shows a clear and steady downward trend in the median active list price, from roughly $700,000 to $725,000 in mid-2024 down to the current $577,500. This trend tells you something important: sellers have been gradually resetting their pricing expectations over the past two years in response to market conditions.
The $102,500 gap between the median active list price ($577,500) and the median sold price ($475,000 per RPR, $497,500 per MLS) is substantial. It suggests that a portion of the active inventory is still priced above where the market is transacting. Buyers have room to negotiate, and sellers who bridge that gap proactively with accurate pricing are the ones finding buyers. Those who hold firm at list prices near the current median of $577,500 are likely waiting longer or eventually reducing.
New Listings Down 13.4% Year Over Year
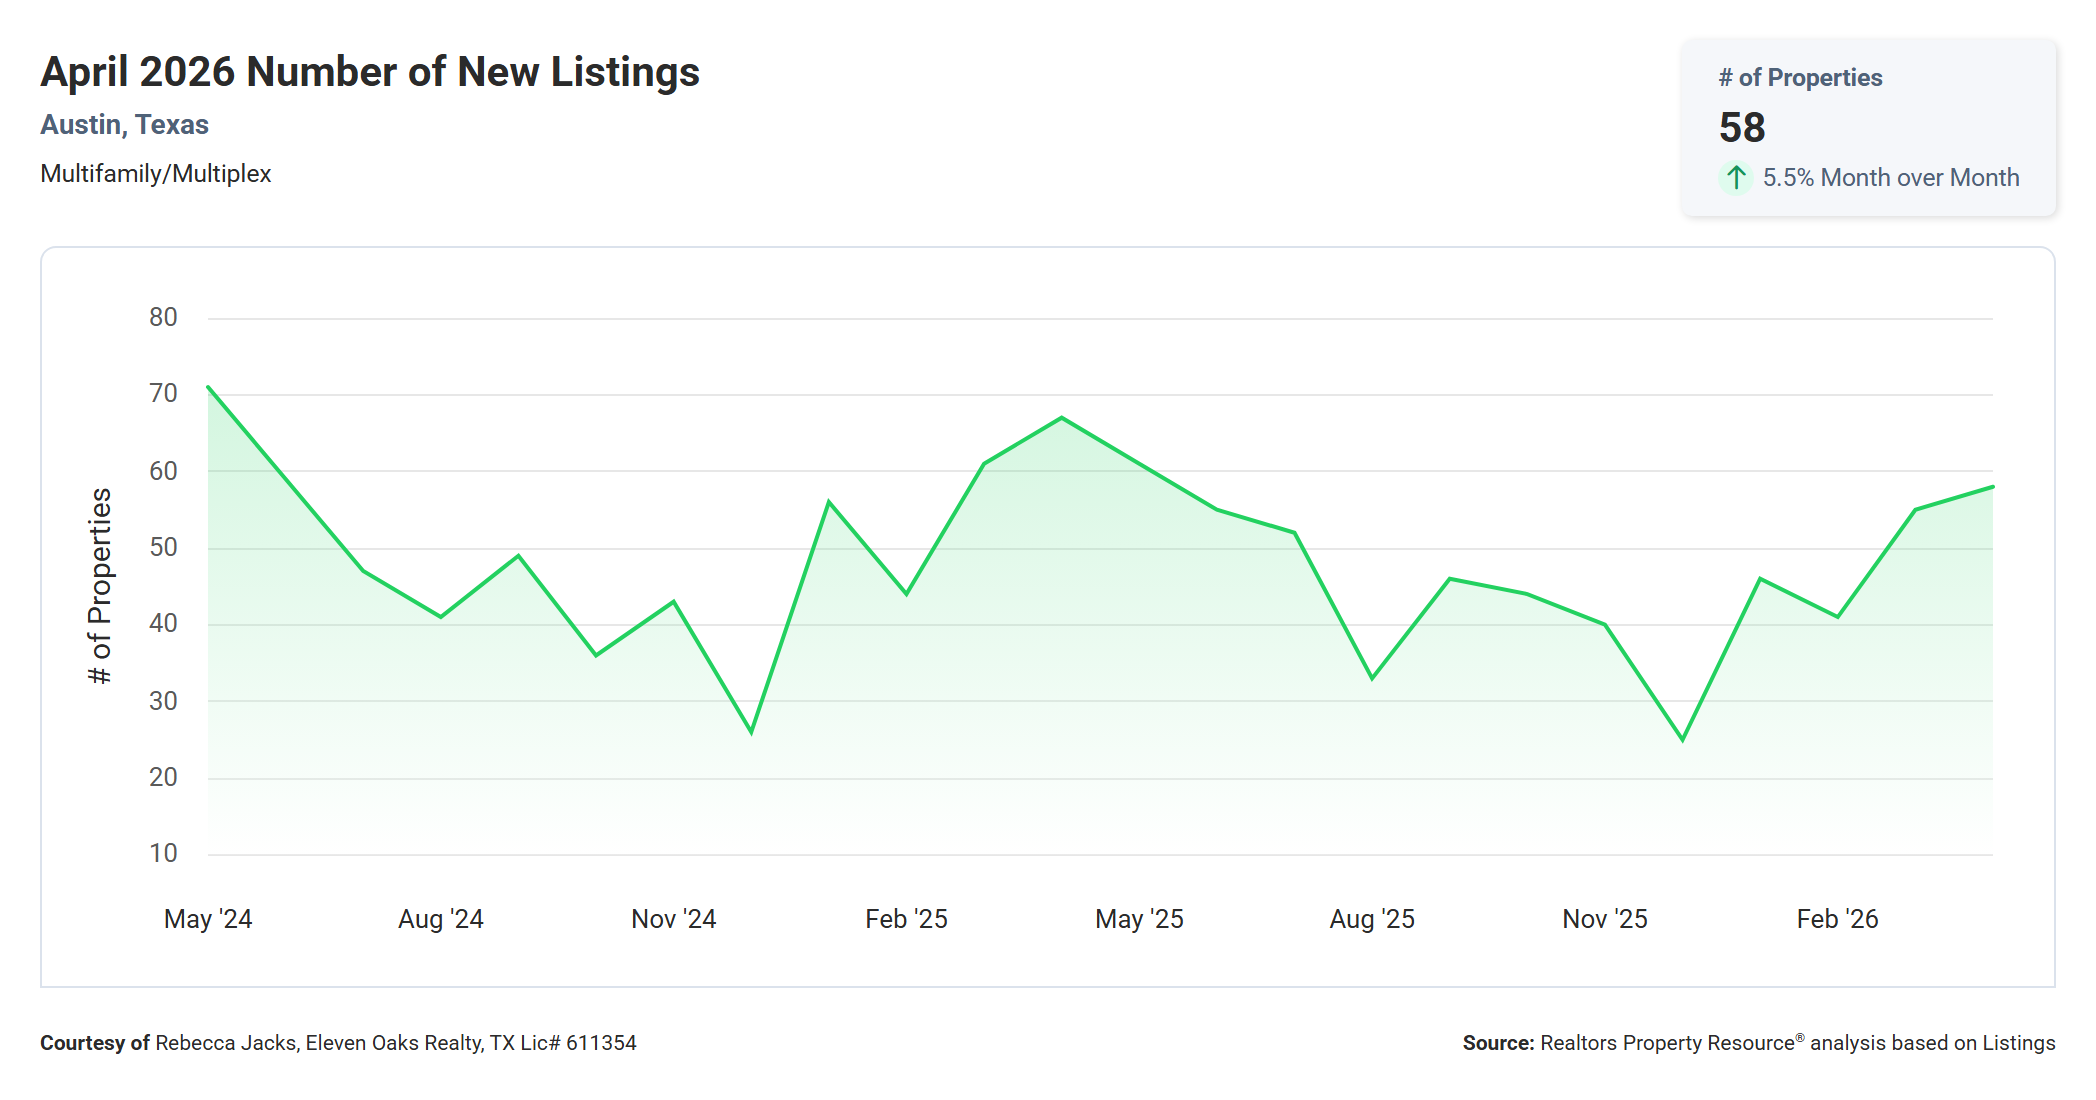
New multi family listings in Austin totaled 58 in April 2026, up 5.5% from March's 55 but down 13.4% from April 2025's 67.
Fewer new listings coming to market year over year is a positive signal for sellers. When supply additions slow, existing inventory has less competition. The two-year chart shows new listings peaked at roughly 70 in May 2024 and have trended lower overall since then, with the current reading of 58 sitting near the lower half of the two-year range.
For buyers, fewer new listings entering the market means the pace at which fresh options appear is slowing. If you have been waiting for the right property, April's jump in pending contracts combined with slower new supply entering the market suggests the window of maximum selection may not stay open indefinitely.
Active Listings Down 12.4% Year Over Year
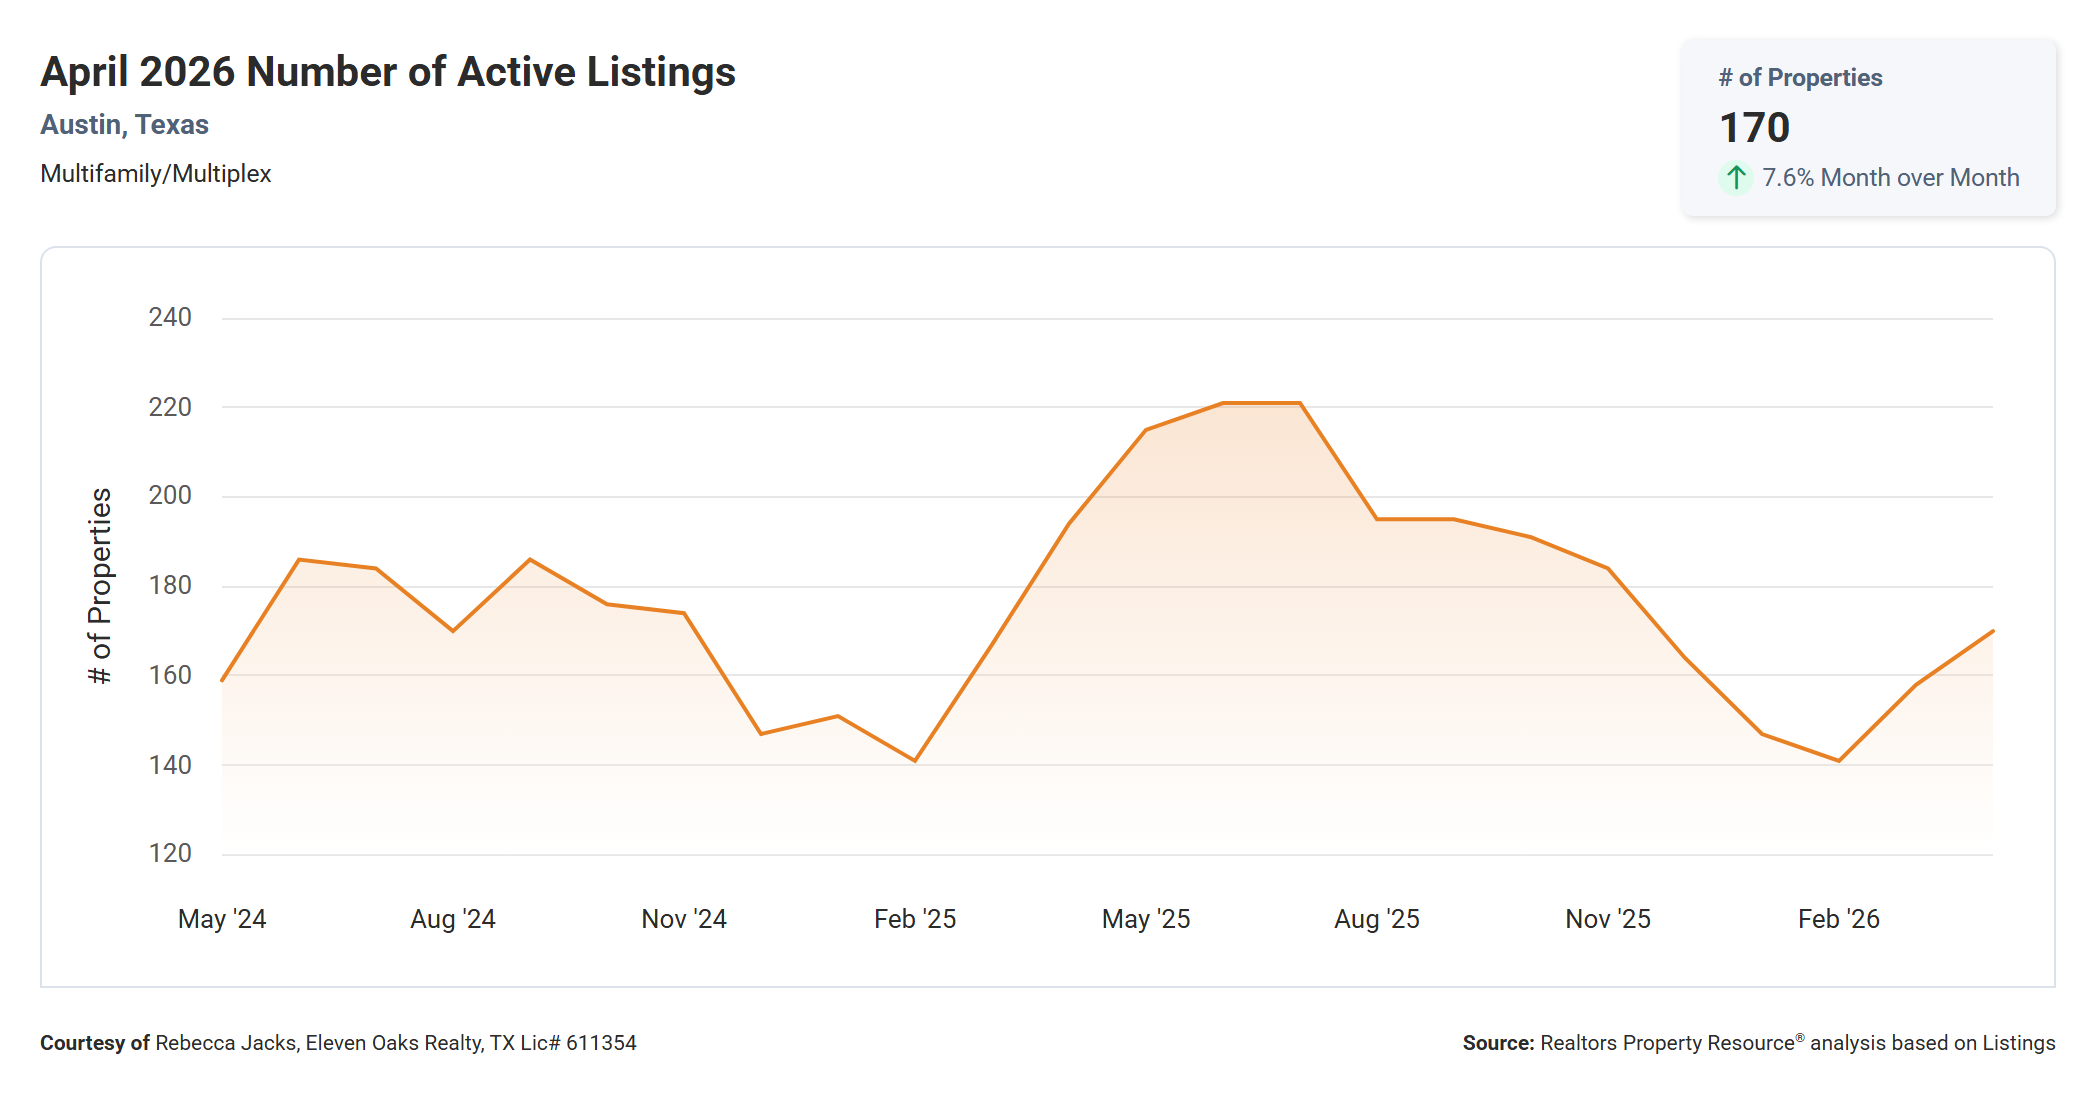
Active multi family listings in Austin totaled 170 in April 2026, up 7.6% from March's 158 but down 12.4% from April 2025's 194.
The two-year chart is telling here. Active listings peaked at roughly 220 in summer 2025 and have been declining since, reaching a recent low near 140 in early 2026 before bouncing back to 170. The year-over-year improvement of 12.4% is real: there are measurably fewer properties competing for buyers than there were a year ago.
At 170 active listings with 18 closings per month, the math behind the 7.39 months supply figure becomes clear. If new listings continue entering at a modest pace and pending contracts from April convert to closings, active inventory could pull back further in the coming months. A sustained move toward 130 to 140 active listings would meaningfully tighten conditions and support price stabilization.
April 2026 Austin Multi Family Real Estate by the Numbers
The table below is pulled directly from the Austin Board of REALTORS MLS statistics for April 2026 and covers 20 closed multi family transactions (duplex, triplex, and quadplex) in the city of Austin.
| Min | Max | Avg | Median | |
|---|---|---|---|---|
| Sq Ft | 1,633 | 4,977 | 2,434 | 2,041 |
| Lot SF | -- | 77,972 | 12,271 | 8,207 |
| List Price | $300,000 | $1,910,000 | $677,890 | $499,500 |
| LP/Sq Ft | $158.48 | $460.40 | $270.76 | $228.98 |
| Acres | 0.000 | 1.790 | 0.282 | 0.188 |
| Close Price | $265,000 | $1,706,000 | $635,400 | $497,500 |
| CP/Sq Ft | $148.88 | $445.54 | $254.66 | $210.73 |
| CP/LP% | 84.00% | 102.00% | 94.30% | 94.50% |
| CP/OLP% | 56.00% | 102.00% | 87.85% | 93.00% |
| ADOM | 4 | 280 | 61 | 23 |
The most expensive multi family property that sold in April 2026 sold for $1,706,000 and the least expensive sold for $265,000. Properties ranged in size from 1,633 to 4,977 square feet with an average size of 2,434 square feet. The average price per square foot was $254.66 with the lowest being $148.88 per square foot and the highest being $445.54 per square foot. It took, on average, 61 days to sell a multi family property in Austin and sellers received, on average, 87.85% of their original list prices.
The gap between the average CP/LP% (94.30%) and the average CP/OLP% (87.85%) deserves attention. CP/LP% measures what buyers paid relative to the final list price; CP/OLP% measures what buyers paid relative to the original list price. The 6.45 percentage point spread tells you that sellers are, on average, reducing their asking prices meaningfully before going under contract. In a market with just 20 transactions, one outlier can widen this gap significantly; the minimum CP/OLP% of 56.00% suggests at least one property sold far below its original ask, likely after an extended time on market or significant price reduction. For sellers, the data sends a clear message: properties priced correctly from the start spend less time on market and leave less money on the table.
The median ADOM of 23 days paints a more optimistic picture than the average of 61. That spread reflects a two-speed market: some properties sell in under a month while others sit considerably longer. Properties that are priced at or below market value and are in good condition are attracting buyers quickly; overpriced or condition-challenged listings are dragging the average up. The maximum of 280 days on market confirms that some listings are sitting for the better part of a year before closing or being removed.
What This Means for Multi Family Buyers
For buyers, the median sold price of $475,000 in April 2026 represents a 25.3% discount compared to what the median multi family property sold for in April 2025. In dollar terms, that is roughly $161,000 less than a year ago. If you have been tracking the Austin multi family market and waiting for prices to come down, the data suggests that correction has happened. Whether it marks the bottom or continues to drift lower depends largely on how quickly pending contracts convert to closings in May and June.
On negotiation, the data still tilts in your favor. The average sold-to-list price ratio of 94.57% means buyers are negotiating approximately 5.4% below the final list price on average, and the average CP/OLP% of 87.85% suggests even more room exists off original asking prices. That said, the spike in new pending listings to 31 in April is a meaningful signal that other buyers are beginning to act. The window of maximum leverage tends to narrow as pending activity picks up.
Multi family buyers in Austin are often investors, and the current market dynamics carry real implications for investment returns. Lower acquisition prices improve potential cap rates and cash-on-cash yields, assuming rents hold. Austin's rental market has faced its own pressure from new apartment supply, so underwriting conservatively on rental income assumptions is wise. Properties that are stabilized, have existing tenants, and require minimal capital investment are the most attractive positions in the current environment.
Timing-wise, the combination of lower prices, improving days-to-sell, and rising pending contracts suggests the market may be transitioning from softening to stabilizing. Buyers who move in the next few months may be catching prices near a cyclical low. That said, every investment decision should be evaluated on its own merits: the right time to buy is when the numbers work for your specific situation, not solely because of market timing.
What This Means for Multi Family Sellers
For sellers, the April data is challenging on price but more encouraging on demand. The median sold price fell to $475,000, well below where many sellers purchased or may have hoped to list. The year-over-year decline of 25.3% is real, and pricing a property based on 2024 or 2025 comps without adjustment is a path to a long, frustrating listing experience. The sellers who closed in April received, on average, 87.85% of their original list prices, which means the market is doing the pricing discipline for you if you hold out too long.
The competition picture is improving, at least directionally. Active listings at 170 are down 12.4% from a year ago, and new listings entering the market at 58 per month are below the pace seen in 2024. Fewer competing listings mean your property has more visibility. Still, with 7.39 months of supply, you are operating in a buyer's market, and buyers have alternatives. Standing out requires accurate pricing, strong presentation, and patience.
The CP/OLP% data makes the case for getting the price right from day one. Sellers who had to reduce their price before going under contract averaged 87.85% of their original ask; one property settled at just 56% of its original list price. In a market this thin, a price reduction can signal distress and invite lower offers. Starting at or slightly below market value, rather than testing the ceiling, gives your listing the best chance of attracting the buyers who are actively looking right now.
April's surge in new pending listings to 31 is the most positive data point for sellers in this report. More buyers engaging with the market means more potential offers. If you have been holding off on listing because buyer activity seemed slow, the trend in April suggests conditions may be turning. Sellers who get to market in May and June could benefit from the pipeline of buyers who went under contract in April and will be looking at inventory actively.
Market Summary and Outlook
April 2026 was a month of contrasts for Austin's multi family market. Prices fell sharply on both a month-over-month and year-over-year basis, with the median hitting $475,000, down 25.3% from a year ago. At the same time, new pending listings jumped to 31, the highest level in nearly a year, and the median time to sell dropped from 65 days to 35. The market is not collapsing; it is repricing, and buyers are beginning to respond to that repricing.
Year-over-year comparisons present a clear picture: this is a softer market than April 2025 across nearly every price and volume metric. Median sold price, price per square foot, total sales volume, active listings, and new listings are all down from a year ago. The one notable exception is new pending listings, which are up 138.5% year over year. That divergence, soft prices paired with rising buyer engagement, is exactly the pattern that tends to precede market stabilization.
The key variable for the coming months is whether the pending contract surge of April converts into closed transactions in May and June. If it does, volume metrics will improve, days to sell should remain manageable, and sellers who priced correctly will see results. If pending contracts fall out or fail to close at agreed prices, the market could remain rangebound. Interest rates for investment properties remain a significant headwind; any meaningful movement in rates will influence buyer purchasing power and investor return calculations directly.
Austin's multi family market fundamentals remain sound over the longer term. The city continues to attract population and economic activity, and the supply of duplex, triplex, and quadplex properties is inherently limited by zoning. The current period of price softness reflects the broader adjustment underway across many Texas markets rather than a structural decline in Austin's appeal. For investors with a multi-year horizon, April 2026 prices represent an entry point that was not available during the 2021 to 2023 run-up.
Action Items for Multi Family Buyers
Run the numbers at current prices, not 2025 comps: with the median sold price at $475,000, down 25.3% year over year, the acquisition cost picture has changed materially, and any investment analysis should be built on April 2026 market data.
Move with purpose on properties that pencil: new pending listings jumped to 31 in April, up 55% from March, which is an early signal that buyer competition is building, and the window of maximum leverage may be narrowing.
Negotiate from the CP/OLP% data: sellers averaged 87.85% of their original list price in April, so there is documented room to negotiate, particularly on properties that have been on the market for several weeks or have undergone price reductions.
Underwrite rental income conservatively: Austin's rental market has faced supply pressure from new apartment construction, and projections based on peak 2022 to 2023 rents may not be achievable today; build your analysis around current market rents, not historical peaks.
Pay close attention to the gap between median ($497,500) and average ($635,400) close price: the average is being pulled up by a small number of high-value transactions, and your comp analysis should focus on properties comparable in size, unit count, and location rather than relying on market-wide averages.
Use the ADOM data to identify motivated sellers: with a maximum ADOM of 280 days and an average of 61, some listings have been sitting for a long time, and sellers on extended listings are often the most willing to negotiate meaningfully on both price and terms.
Action Items for Multi Family Sellers
Price to April 2026 market conditions, not 2025: the median sold price fell 25.3% year over year, and buyers have access to current comps; a list price anchored to last year's values will generate showings at best and silence at worst.
Start at market value rather than testing the ceiling: the average CP/OLP% of 87.85% shows that sellers who overprice pay for it in the form of price reductions and lower final proceeds; one property in April sold for just 56% of its original list price, a cautionary result that reflects what extended time on market can do to negotiating position.
Use the median ADOM of 23 days as your benchmark: properties priced correctly in April were finding buyers in under a month; if your listing is approaching or past 30 days without a contract, that is a signal to reassess pricing promptly.
Take advantage of improving demand signals now: pending contracts jumped to 31 in April, the highest in nearly a year, and listing in May or June puts you in front of an active buyer pool while momentum is building.
Present the property in its best condition before listing: with 170 active properties competing for 18 to 22 monthly buyers, condition and presentation are differentiators; buyers in a buyer's market are selective, and deferred maintenance or poor photography gives them an easy reason to move on.
Consider the CP/LP% to CP/OLP% spread as a pricing diagnostic: if you find yourself reducing your price, you have already given up negotiating ground; sellers who closed in April at or above their original list price (the maximum CP/OLP% was 102%) priced accurately from the start.
Final Word on the Market
April 2026 rewards buyers who are willing to do their homework and sellers who are willing to price honestly. This is not a market that rewards wishful thinking on either side. Buyers have real negotiating leverage, but that leverage is starting to attract more buyers into the market, which means the window of maximum advantage may be shorter than it appears. Sellers have a real audience of buyers looking right now, but that audience is disciplined and data-aware.
The numbers collectively tell a story of a market in transition. Prices are at or near a multi-year low, days to sell have improved from their worst levels, and pending contract activity is the strongest it has been in months. That is not a market in freefall; that is a market that has found a new clearing price and is starting to transact around it. Whether that price is the bottom or a waypoint depends on rate movements and broader economic conditions that no one can predict with certainty.
The data is the guide. If you are a buyer and the numbers work at $475,000 or wherever you can negotiate a specific property, April 2026 is a compelling time to act. If you are a seller who needs to move and can price to the market, buyers are there. Make the decision that aligns with your investment goals and financial situation, and do not let perfect be the enemy of a good outcome in today's market.
Questions About the April 2026 Austin Multi Family Real Estate Price Report?
Have questions about what the April 2026 Austin Multi Family Real Estate Price Report means for your specific situation? We are happy to help. If you are thinking about buying a multi family property in Austin, our Buyers page has resources to help you understand the process and get started. If you are thinking about selling, our Sellers page walks through what to expect in today's market.
Reach out to Rebecca Jacks and the team at Eleven Oaks Realty. Call or text (512) 827-8323 or email info@11OaksRealty.com. We have been helping buyers and sellers since 1978 and we are here to help you make the best decision for your situation, whatever that looks like.
Data sources: Realtors Property Resource (RPR), Austin Board of REALTORS MLS. All figures are for multi family residential properties (duplex, triplex, and quadplex) in the city of Austin. Reported figures reflect April 1, 2026 through April 30, 2026. Some variation between data sources may exist due to differing methodology and timing of data pulls.




Leave a Reply