Eleven Oaks Realty is proud to present their January 2018 Austin Real Estate Price Report measuring activity in the Austin single family home market.
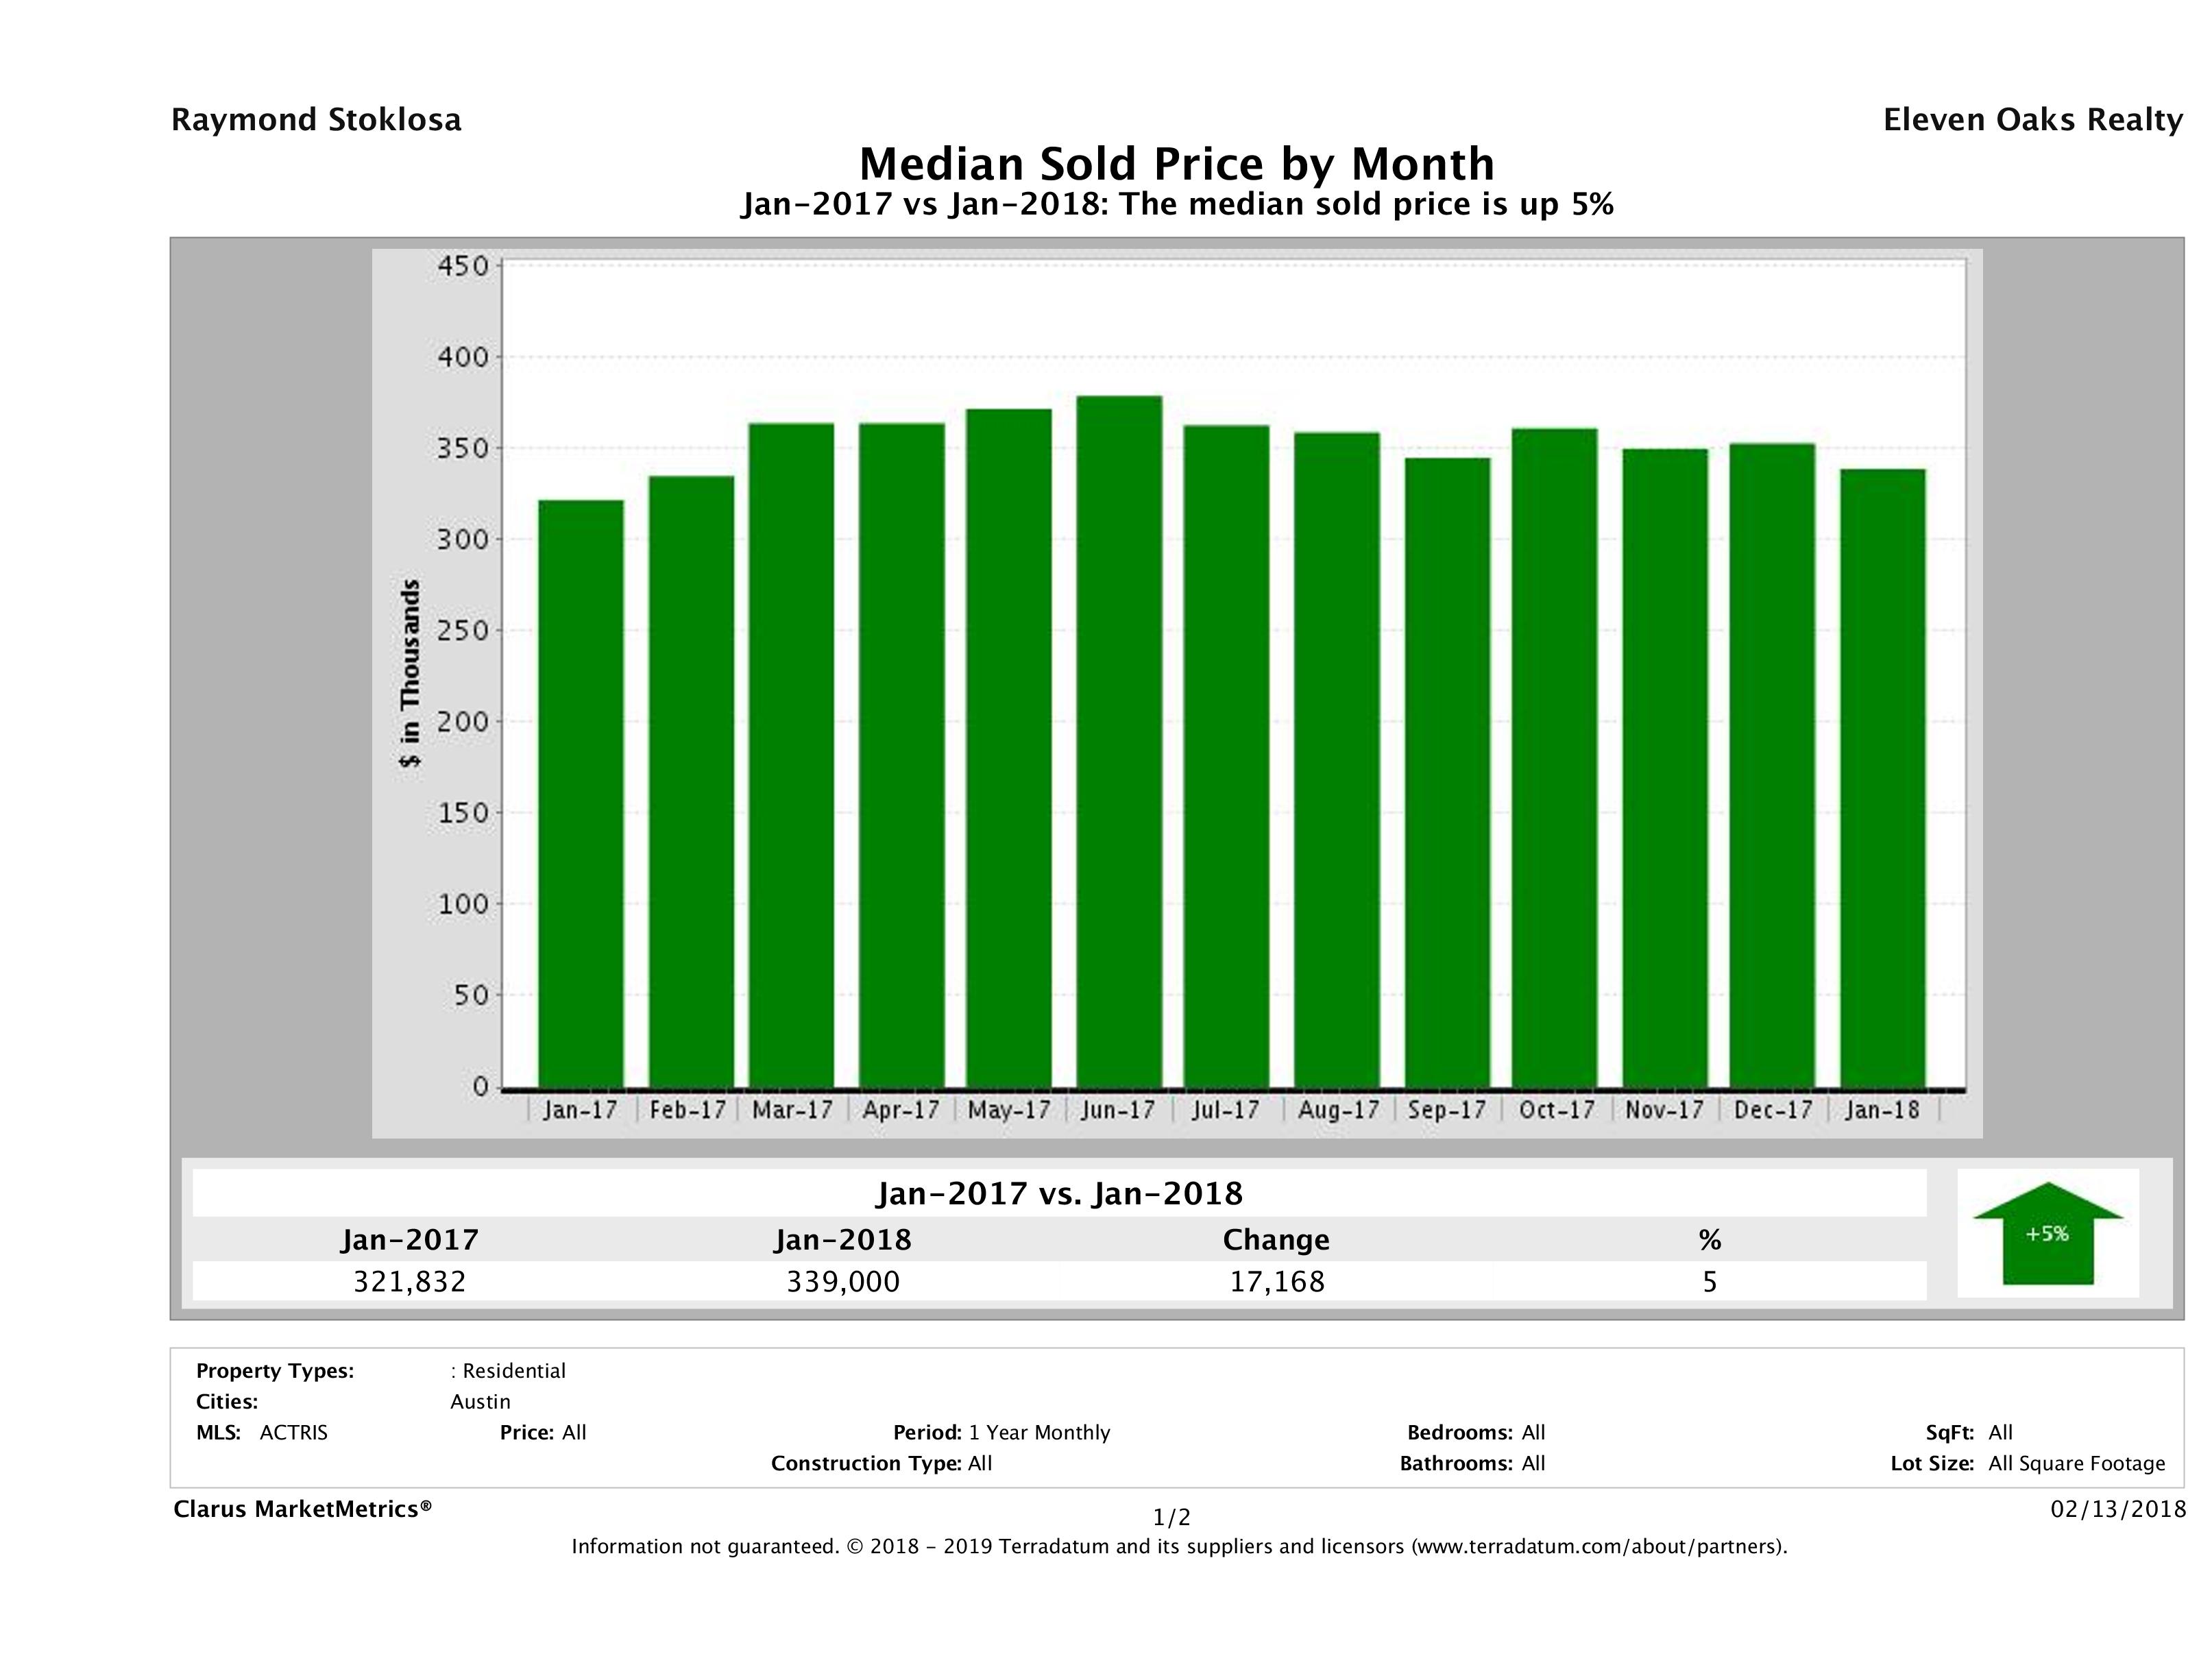
Austin Median Home Price Up 5%
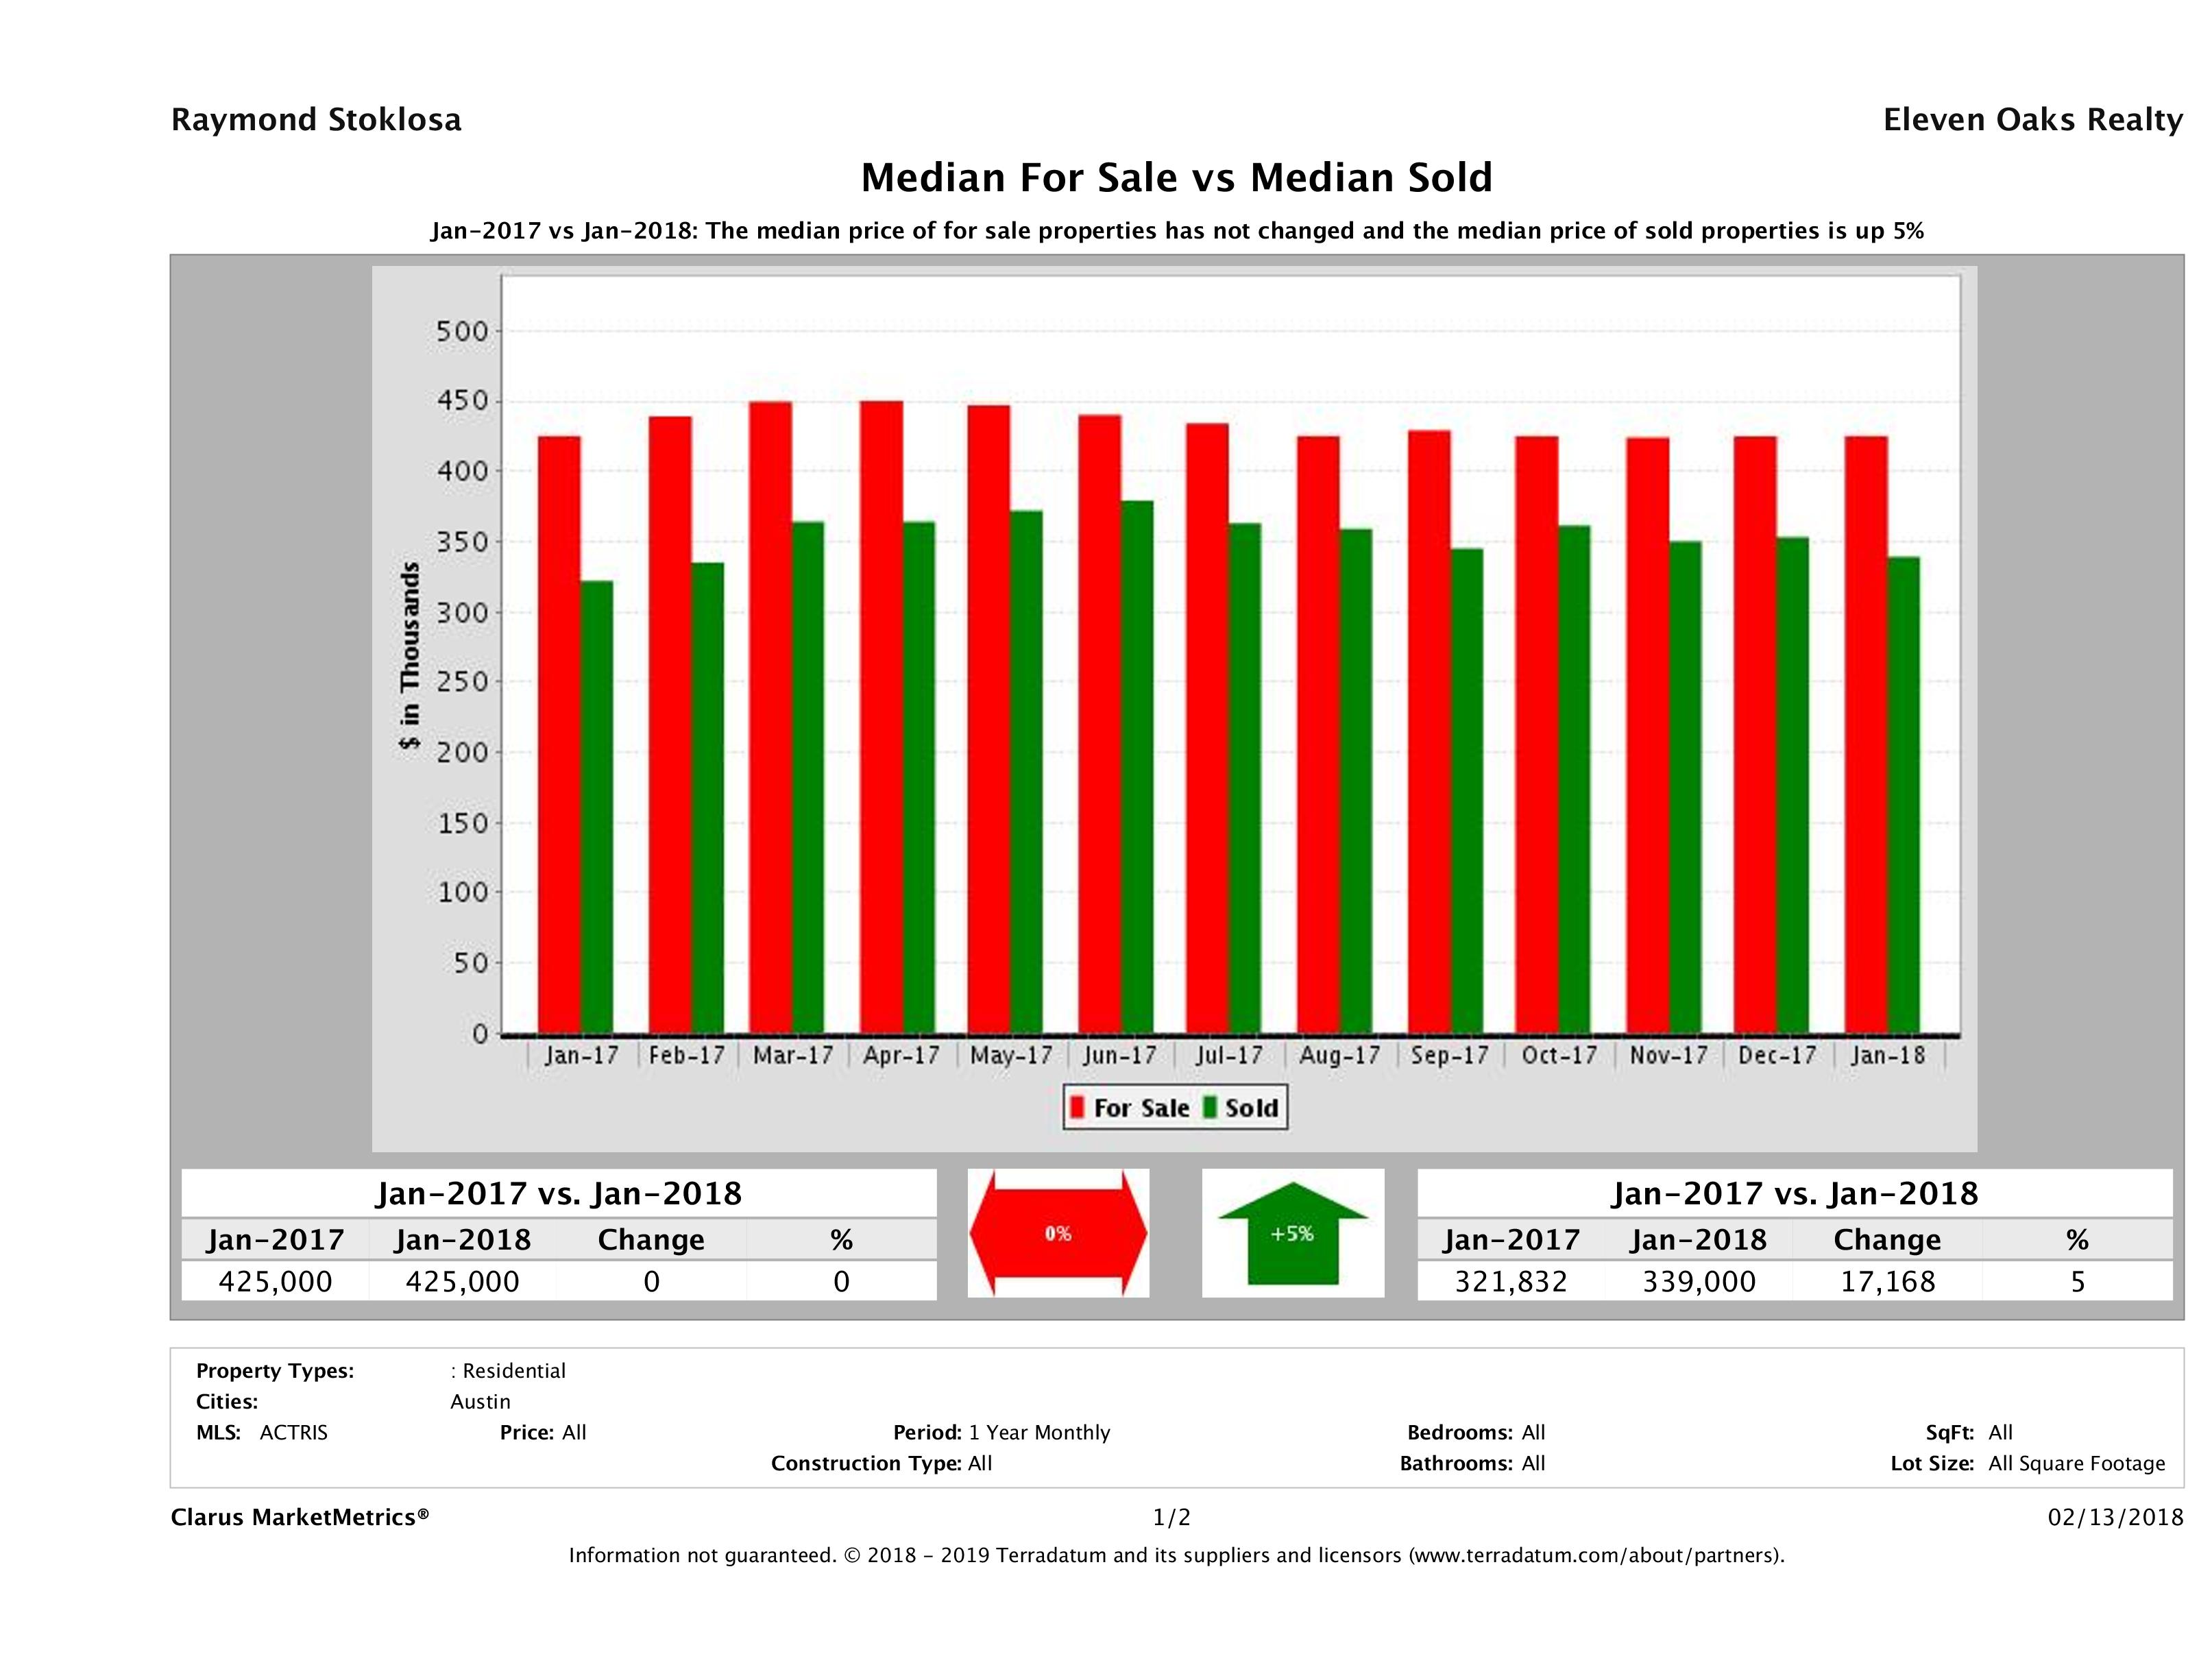
The biggest story in this month’s Austin Real Estate Price Report comes by way of median home prices. For the 41st month in a row, the median price of a home in Austin outpaced the previous year. The median price of an Austin home in January 2017 was $321,832 compared to $339,000 in January 2018, marking a 5% ($17,168) increase in year over year numbers.
Median home price helps us see the distribution of homes sold and does not really give us an indication of the increase or decrease in a particular home’s market value. To analyze market value, we’d have to take an in depth look at a neighborhood. If you’re looking for something like that, please check out our Austin Home Values Report.
What does this mean to buyers? With 41 straight months of price increases and no breaks, it doesn’t seem like this market is slowing down. This year was very healthy so if you’re looking to start a home search soon, the sooner the better.
What does this mean to sellers? In the winter, demand tends to take a dip. Sellers looking to get top dollar will want to wait until spring to officially list their home. Use the slower winter months to do a deep clean of your house. Throw away or pack everything you don’t absolutely need. This way, when you’re ready to sell, you won’t have to do much to prepare. Showings will be a lot easier when you have to stash a few things, not clean the entire house top to bottom. Do a few things a day and pretty soon, your house will be ready to meet the influx of buyers spring brings.
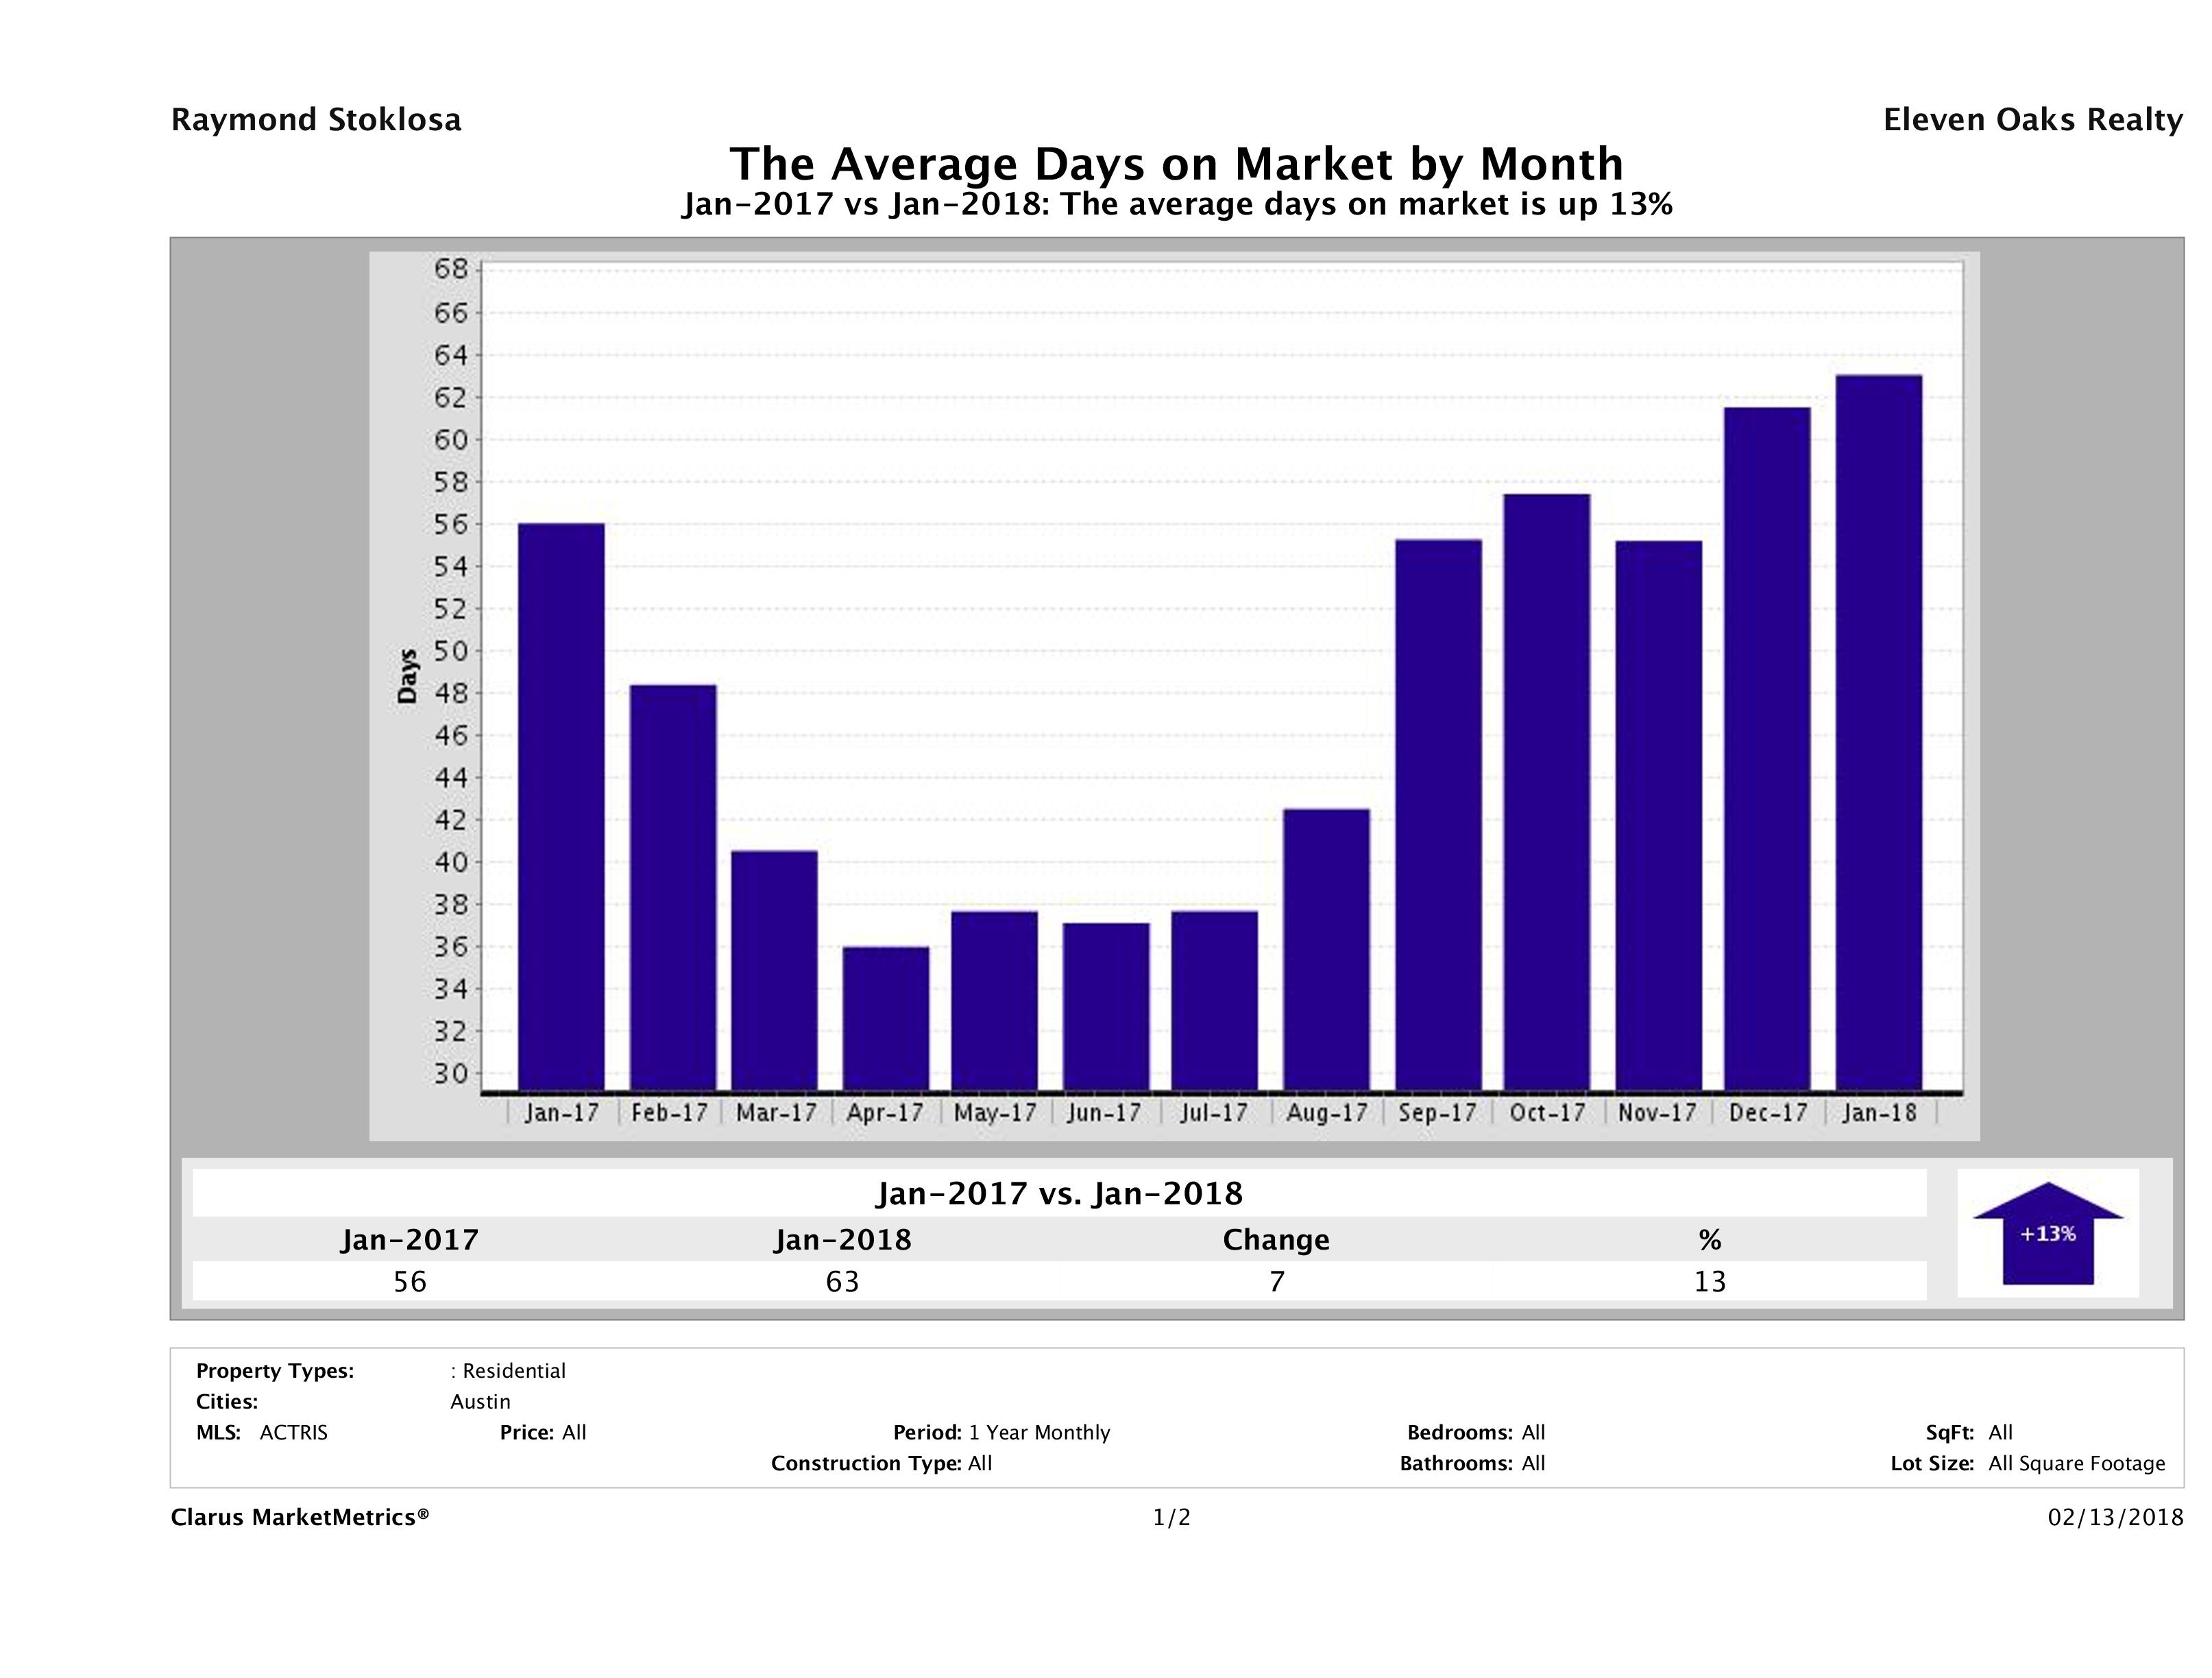
13% Increase in Time to Sell Home in Austin
In January 2018, it took 63 days to sell a home in Austin, on average, compared to 56 days in January 2017, marking a 13% (7 day) increase in year over year numbers.
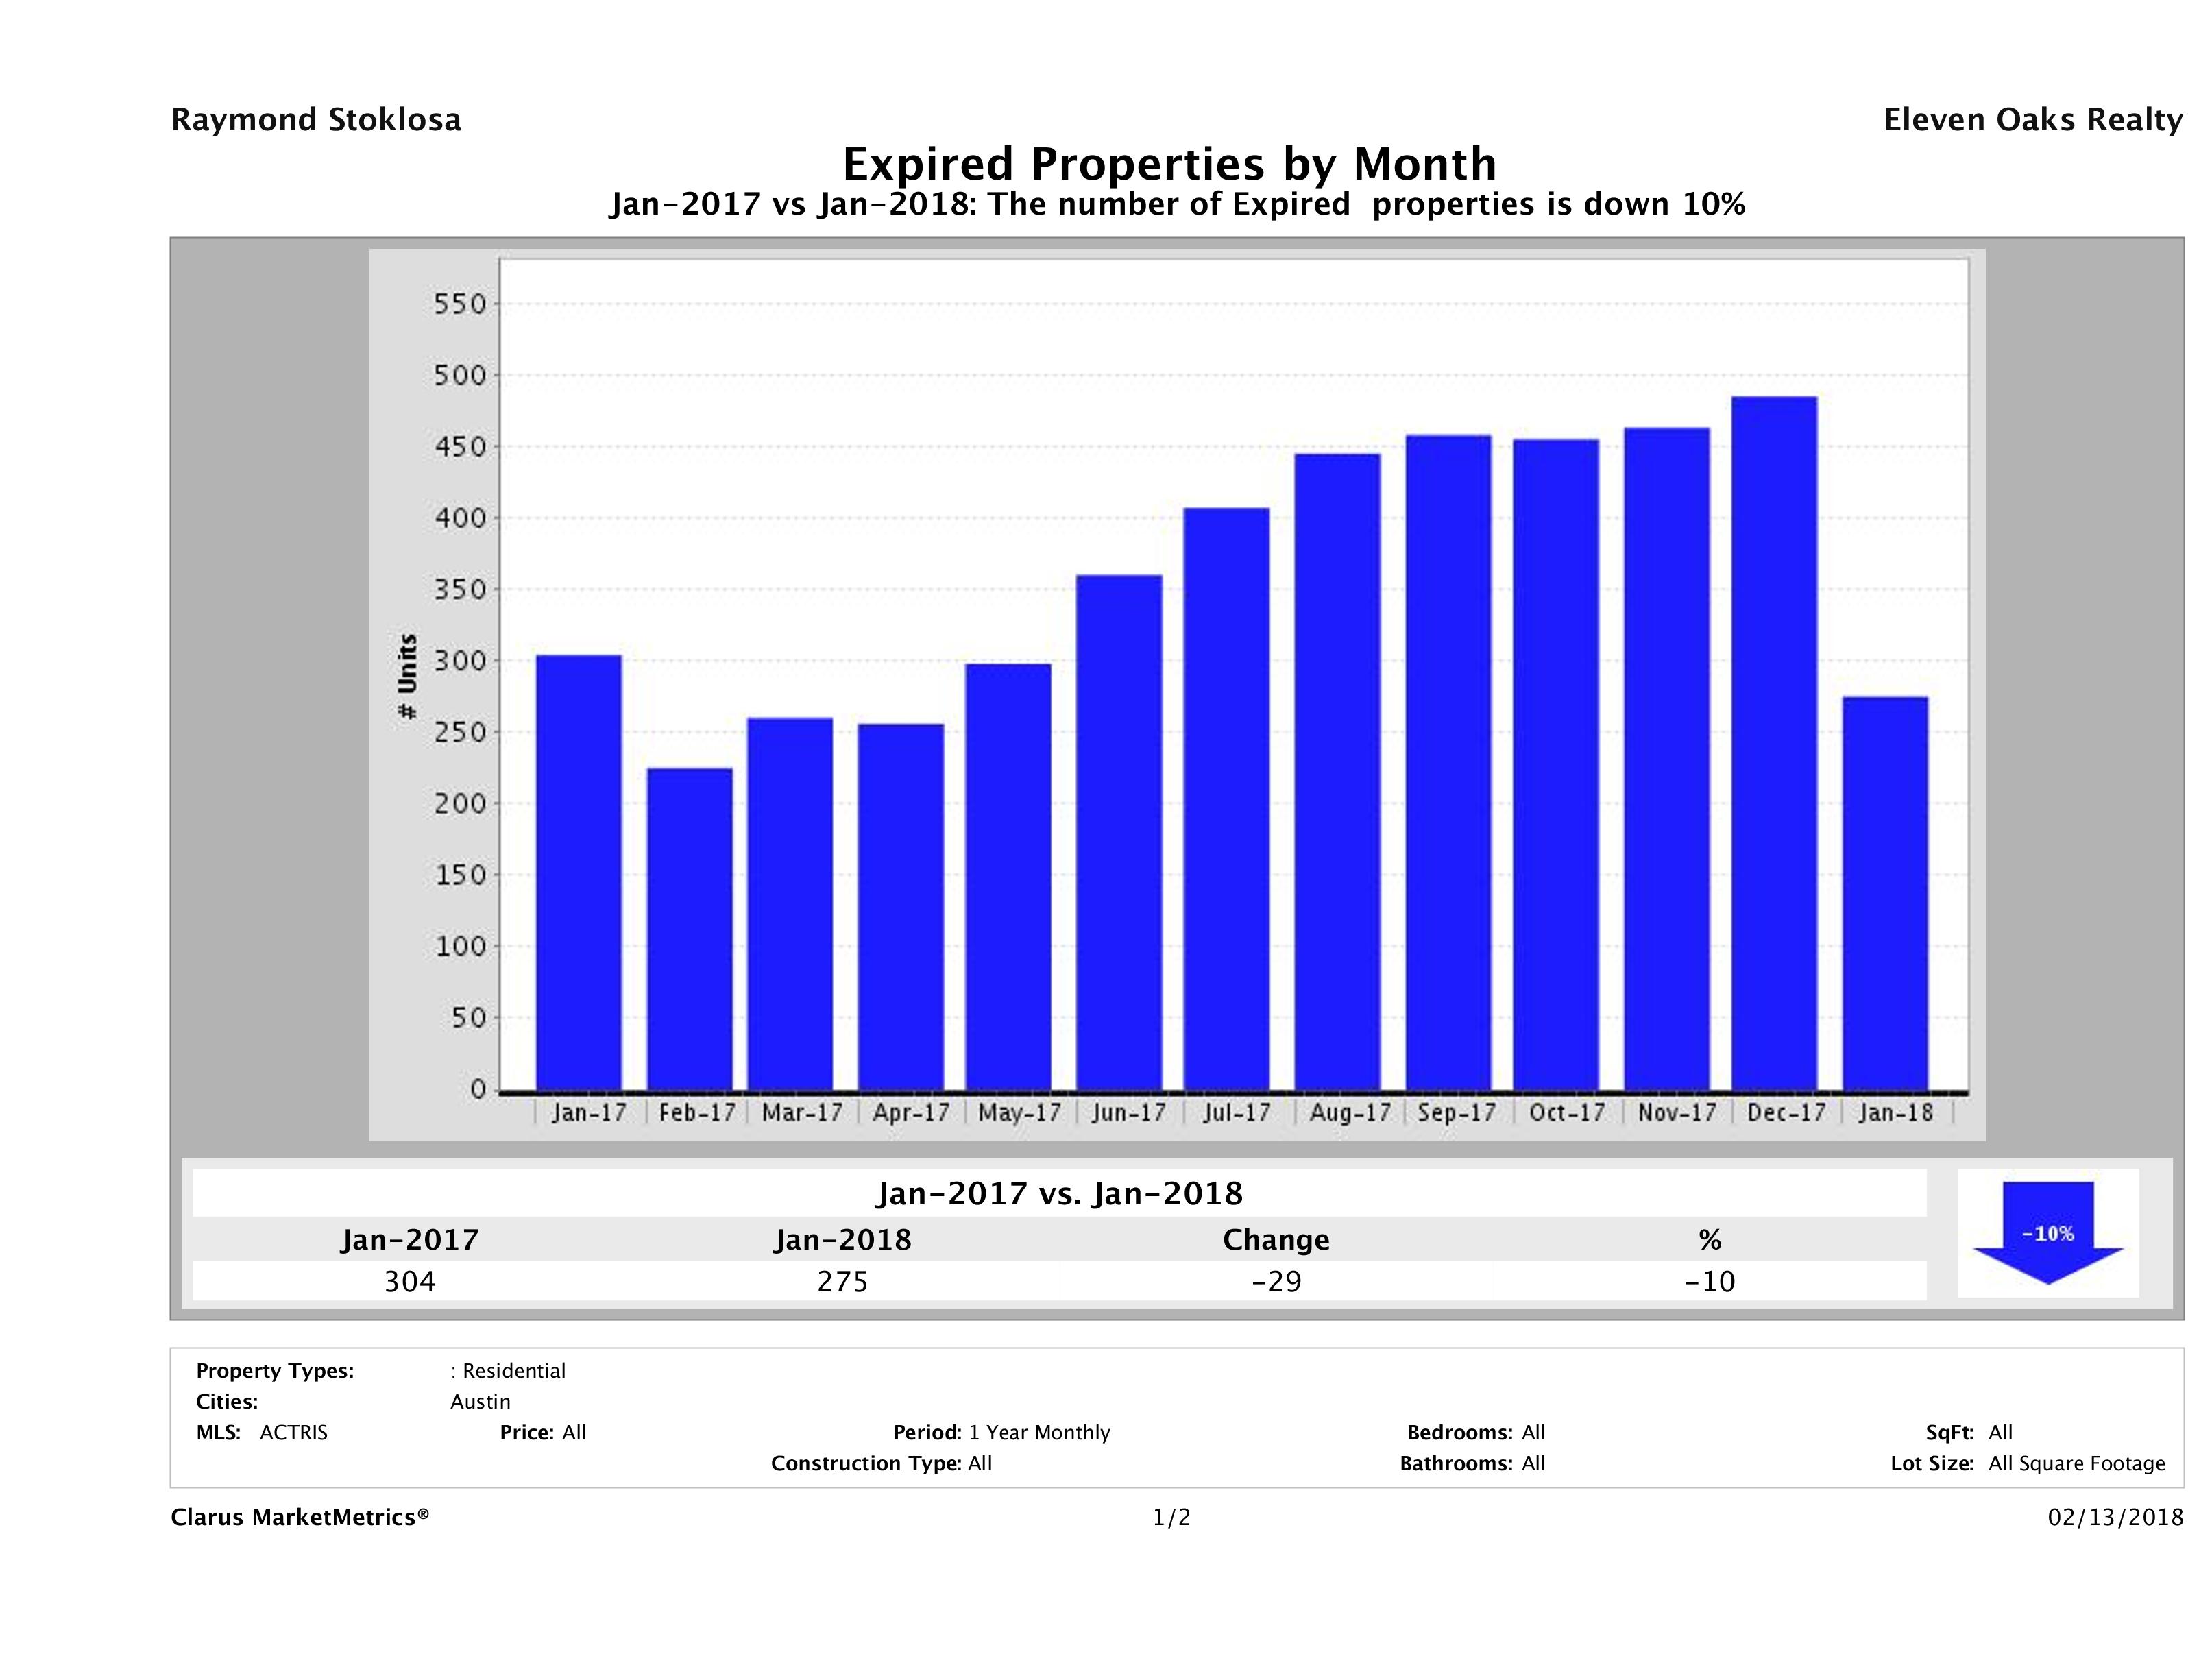
Number of Homes Taken Off the Market Down 10%
In January 2018, there were 275 homes taken off the market compared to 304 in January 2017. This marked a 10% (29 home) decrease in year over year numbers. This month marks the first to buck the trend of homes taken off the market. We had continued to see unrealistic sellers take their homes off the market rather than lower the price. It’s possible sellers are beginning to see that while the Austin market is still hot, buyers are not willing to pay over what they perceive to be market value.
If you need to sell and your home was priced right, maybe there was something else going on. The biggest culprits we see are incorrect info in the MLS and poor marketing. Check out our Austin Home Marketing Plan to see how your homes would be marketed.
Having trouble selling your home? Check out our Austin Home Not Selling resources page to find out why.
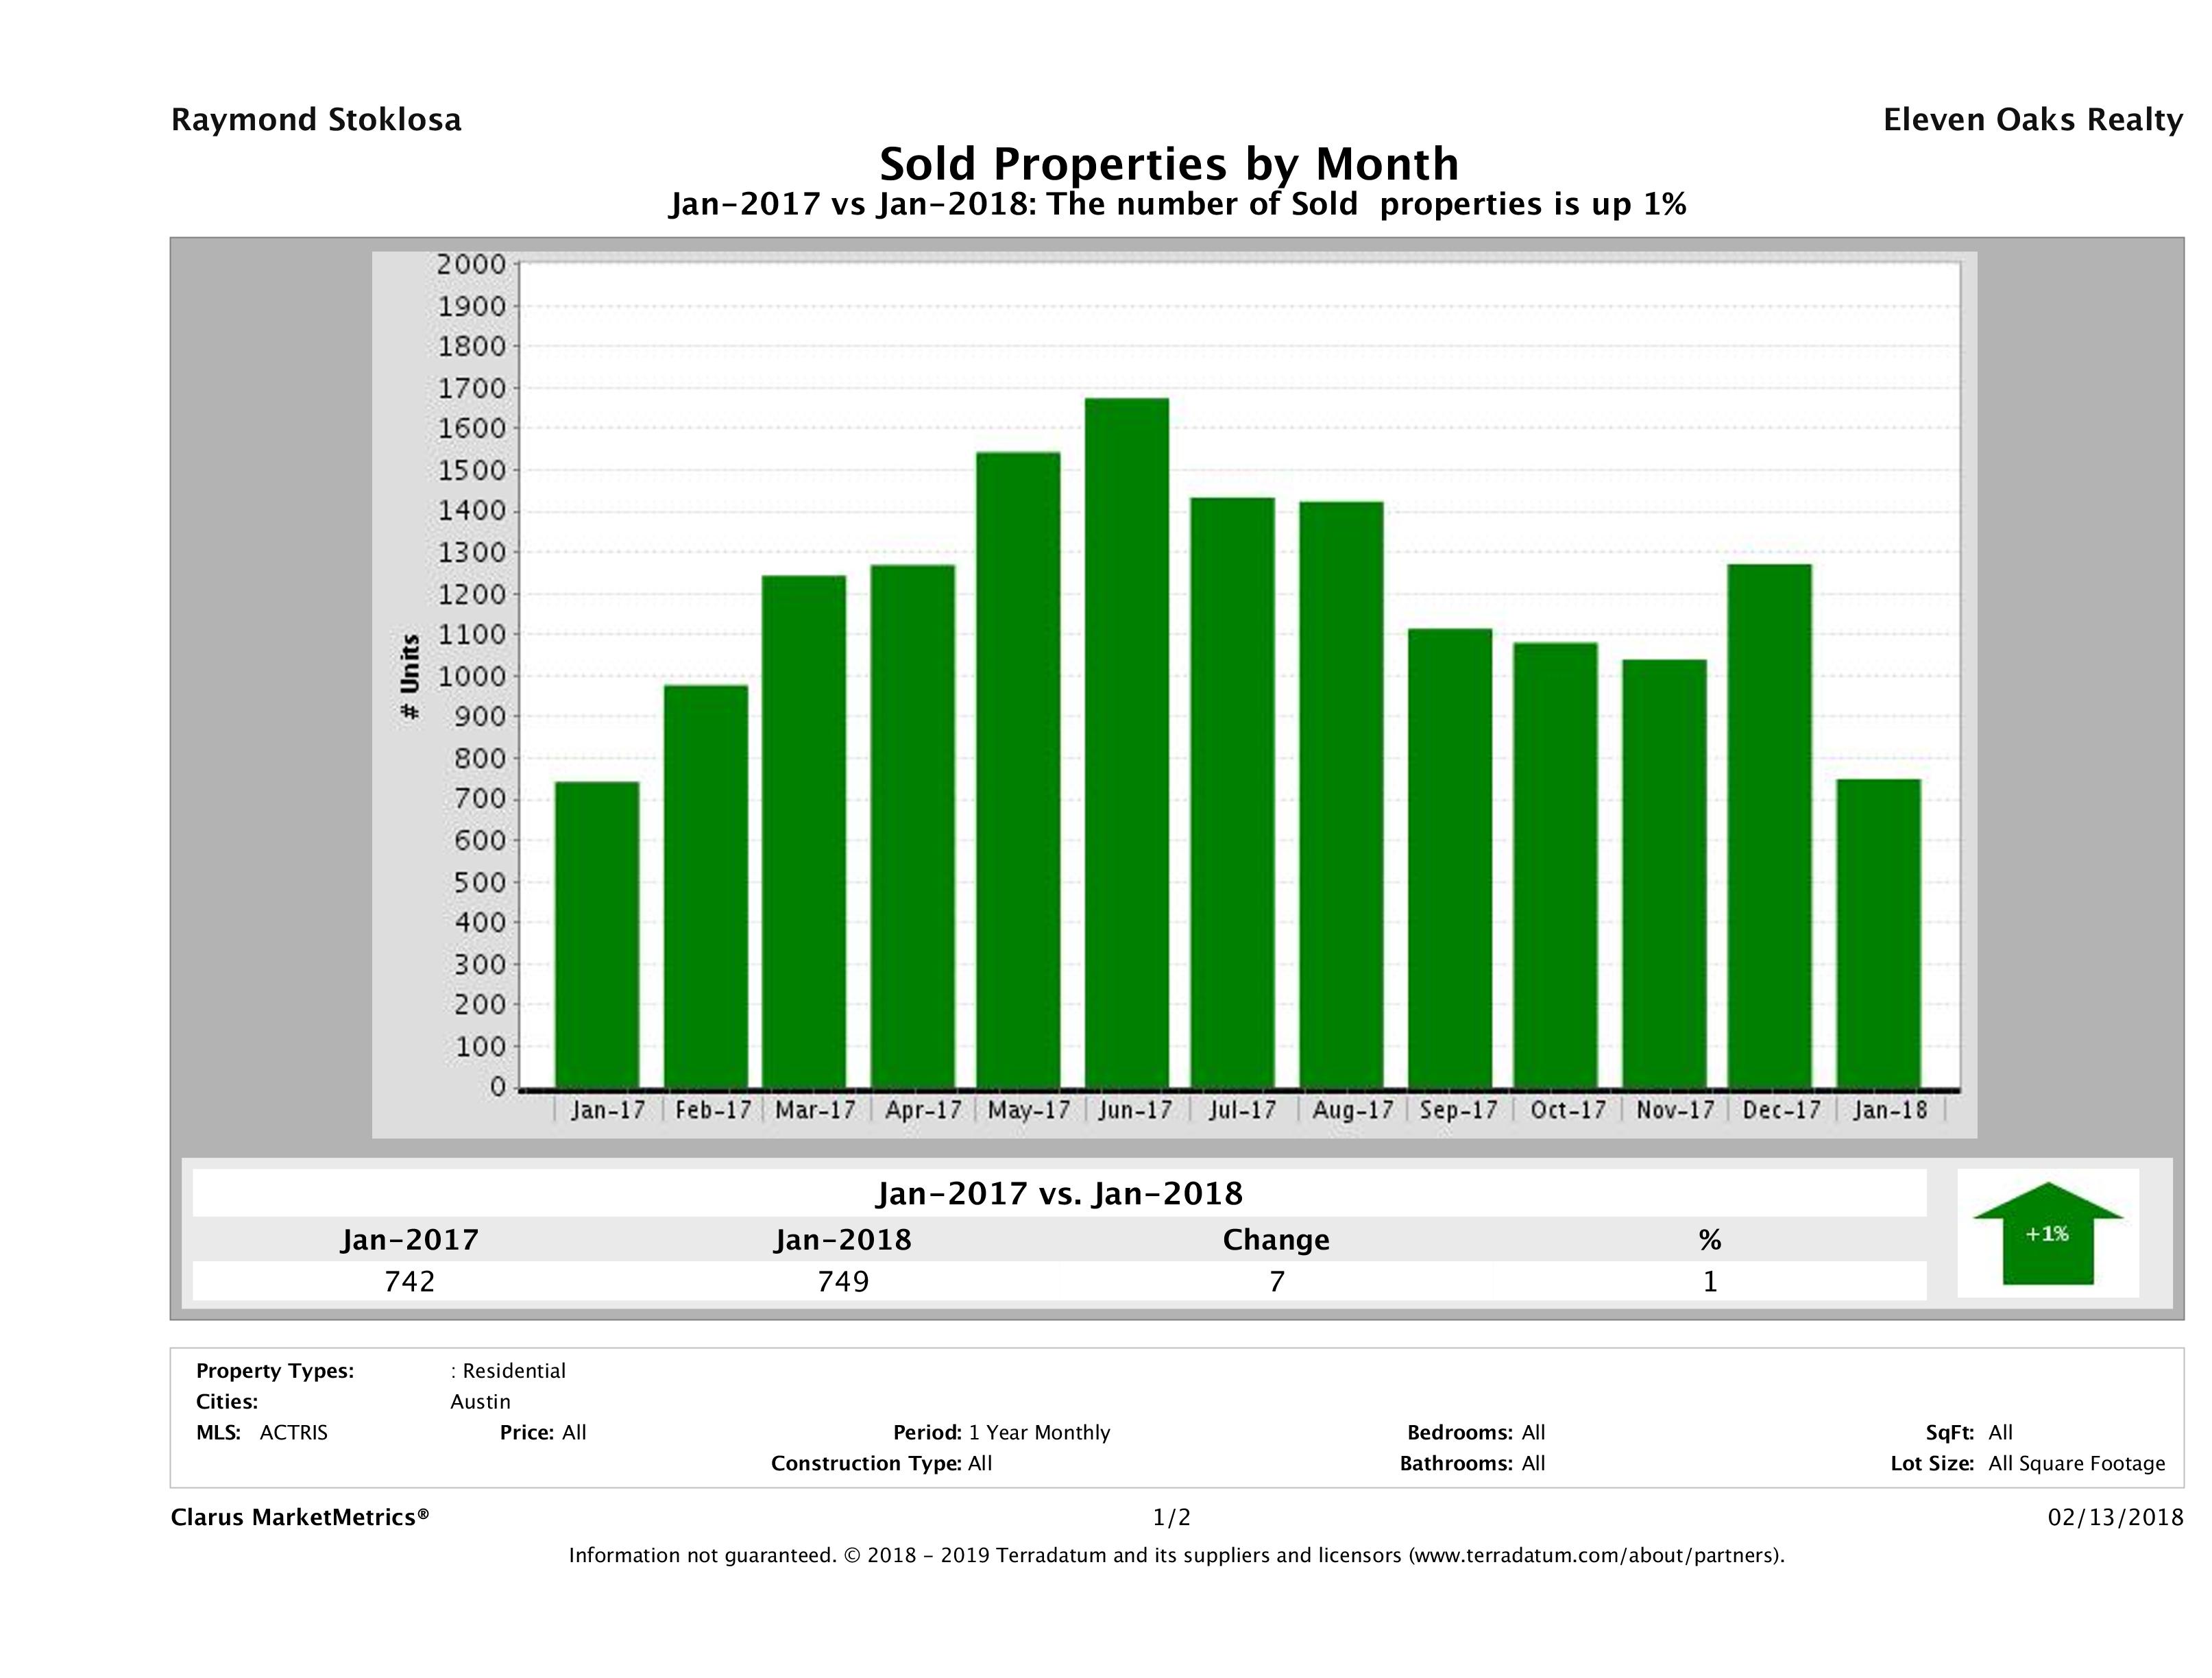
1% Increase in the Number of Sold Homes in Austin
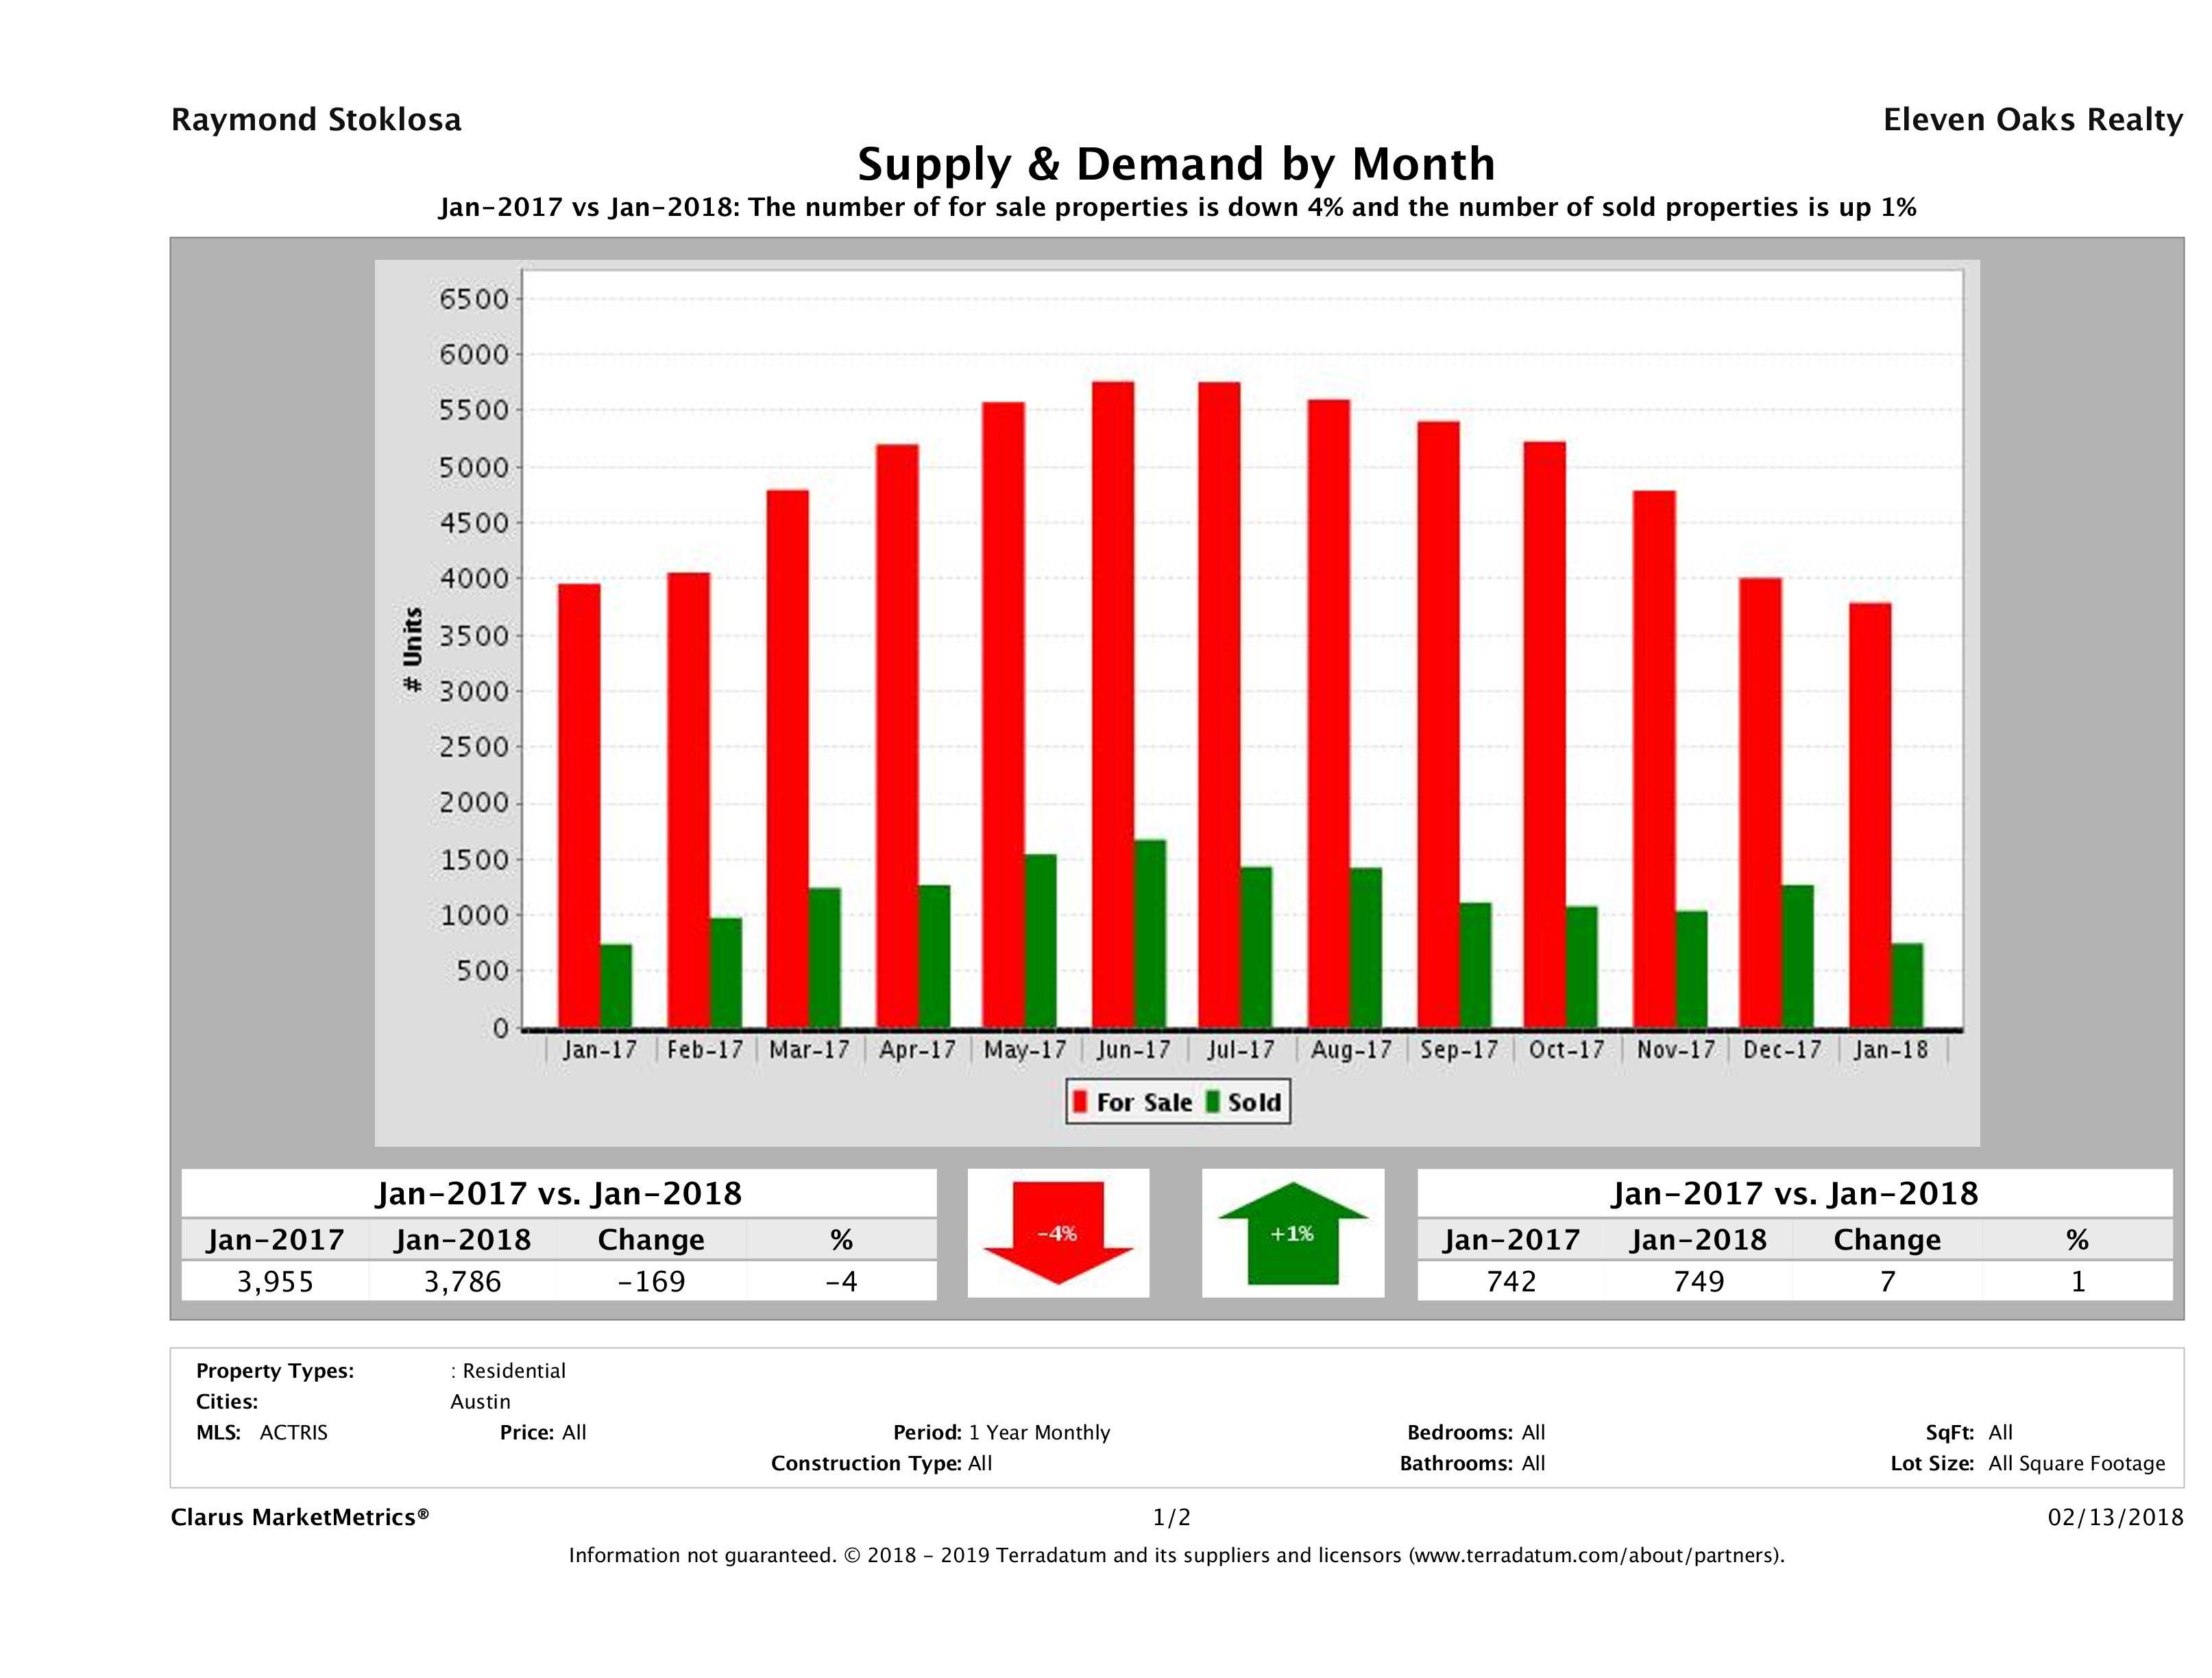
In January 2018, Austin saw a 1% increase in the number of homes sold from January 2017 to January 2018. In January 2018, we saw 749 homes sell in Austin compared to 742 in January 2017 marking a 1% (7 home) increase in year over year numbers.
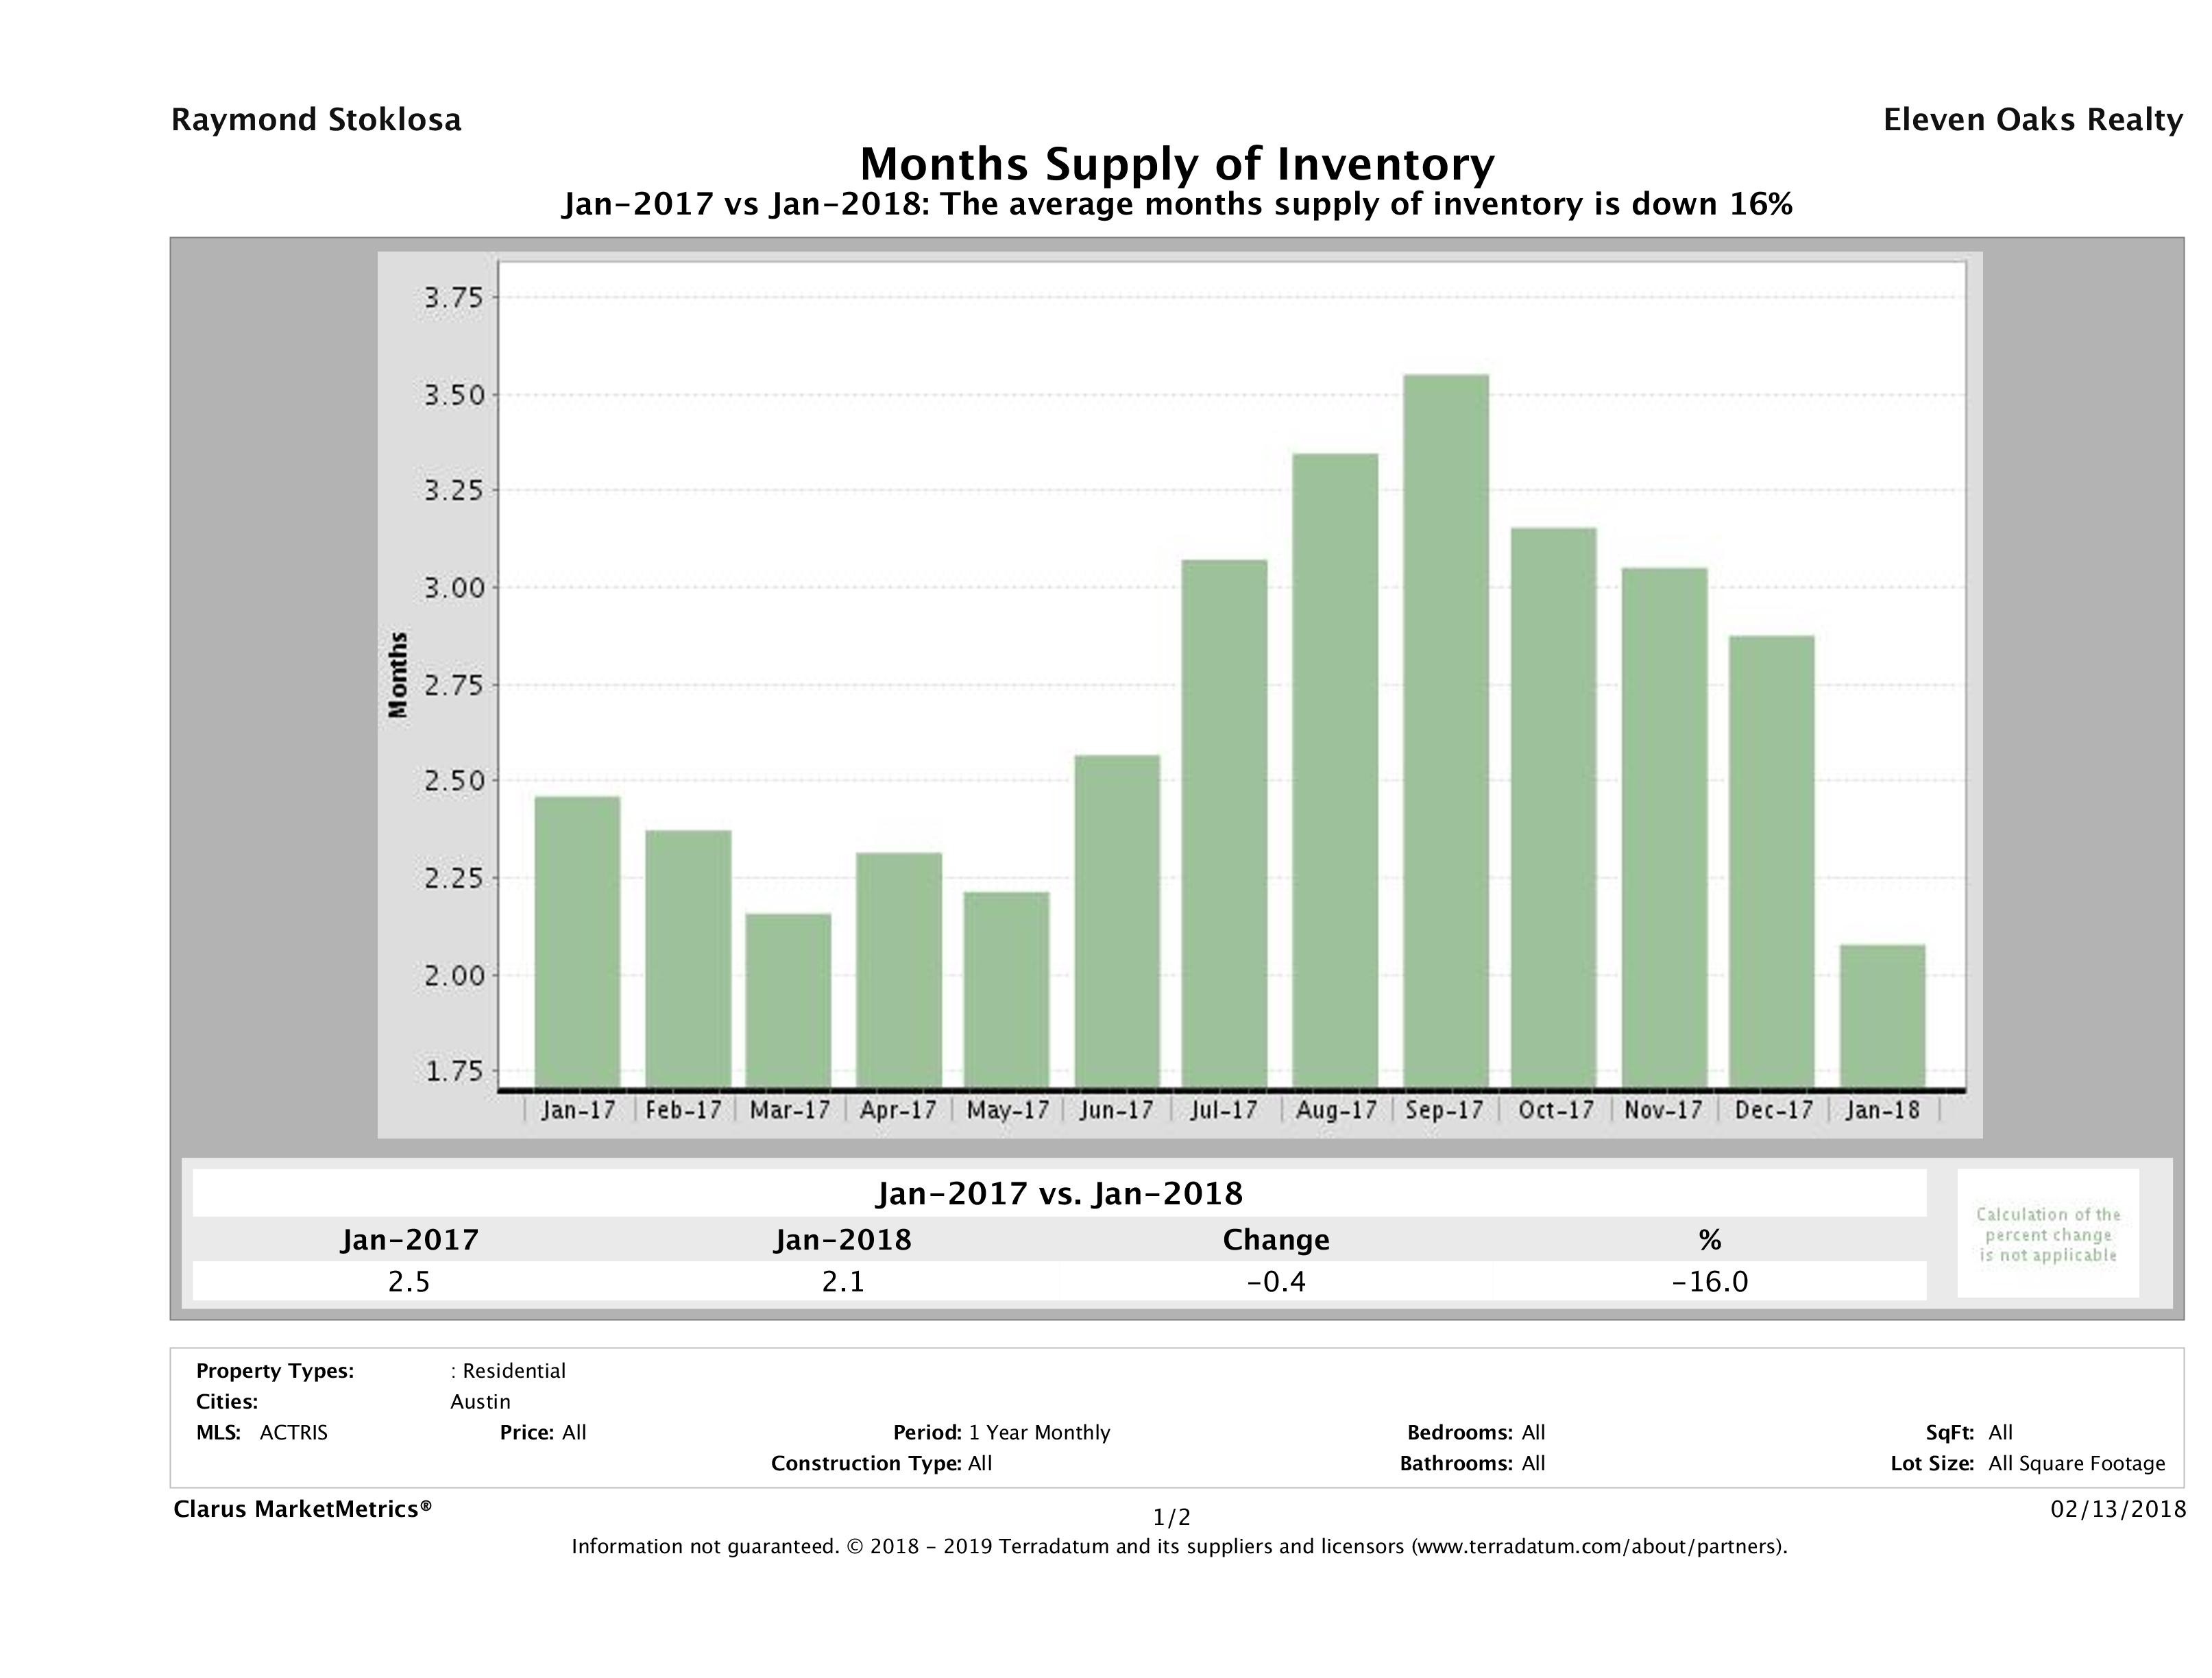
16% Decrease in Austin Housing Inventory
In January 2018, we saw 2.1 months of inventory on the market, compared to 2.5 months of inventory in January 2017, marking a 16% decrease in year over year numbers. For the past year, we’ve consistently seen extremely low inventory levels.
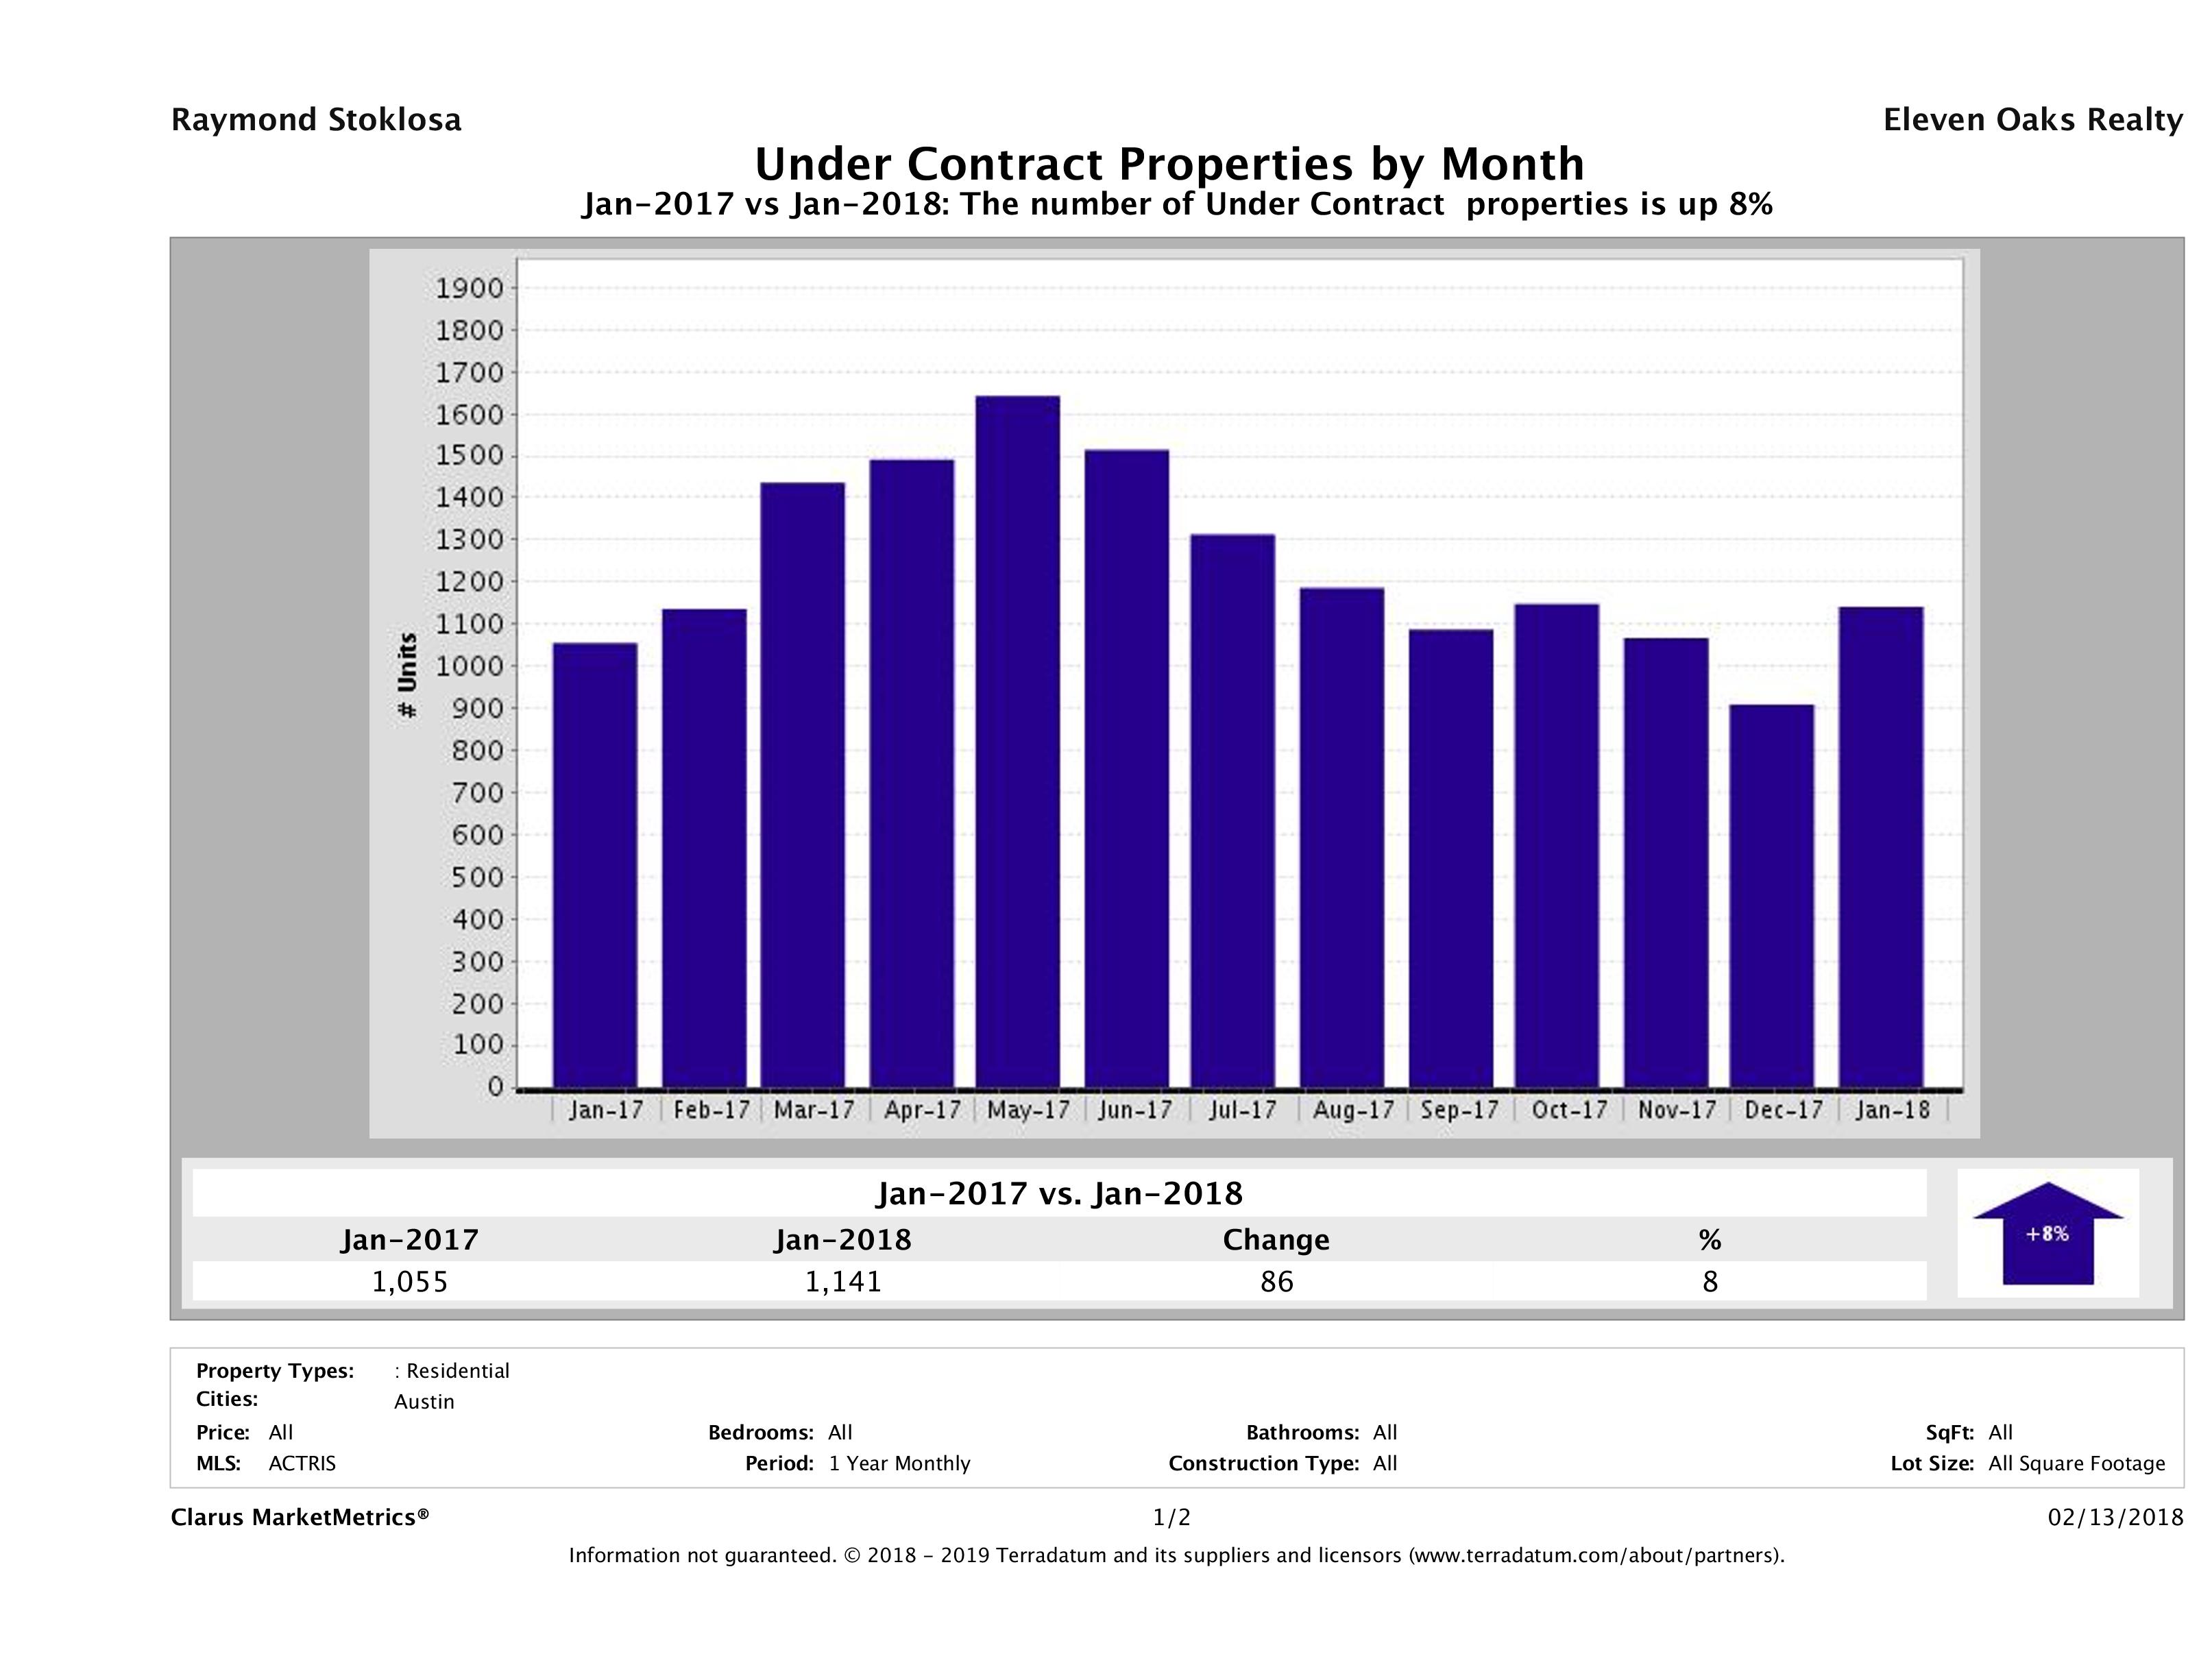
Austin Homes Under Contract Up 8%
In January 2018, 1,141 homes went pending (under contract) in Austin compared to 1,055 in January 2017, marking an 8% (86 home) increase in year over year numbers.
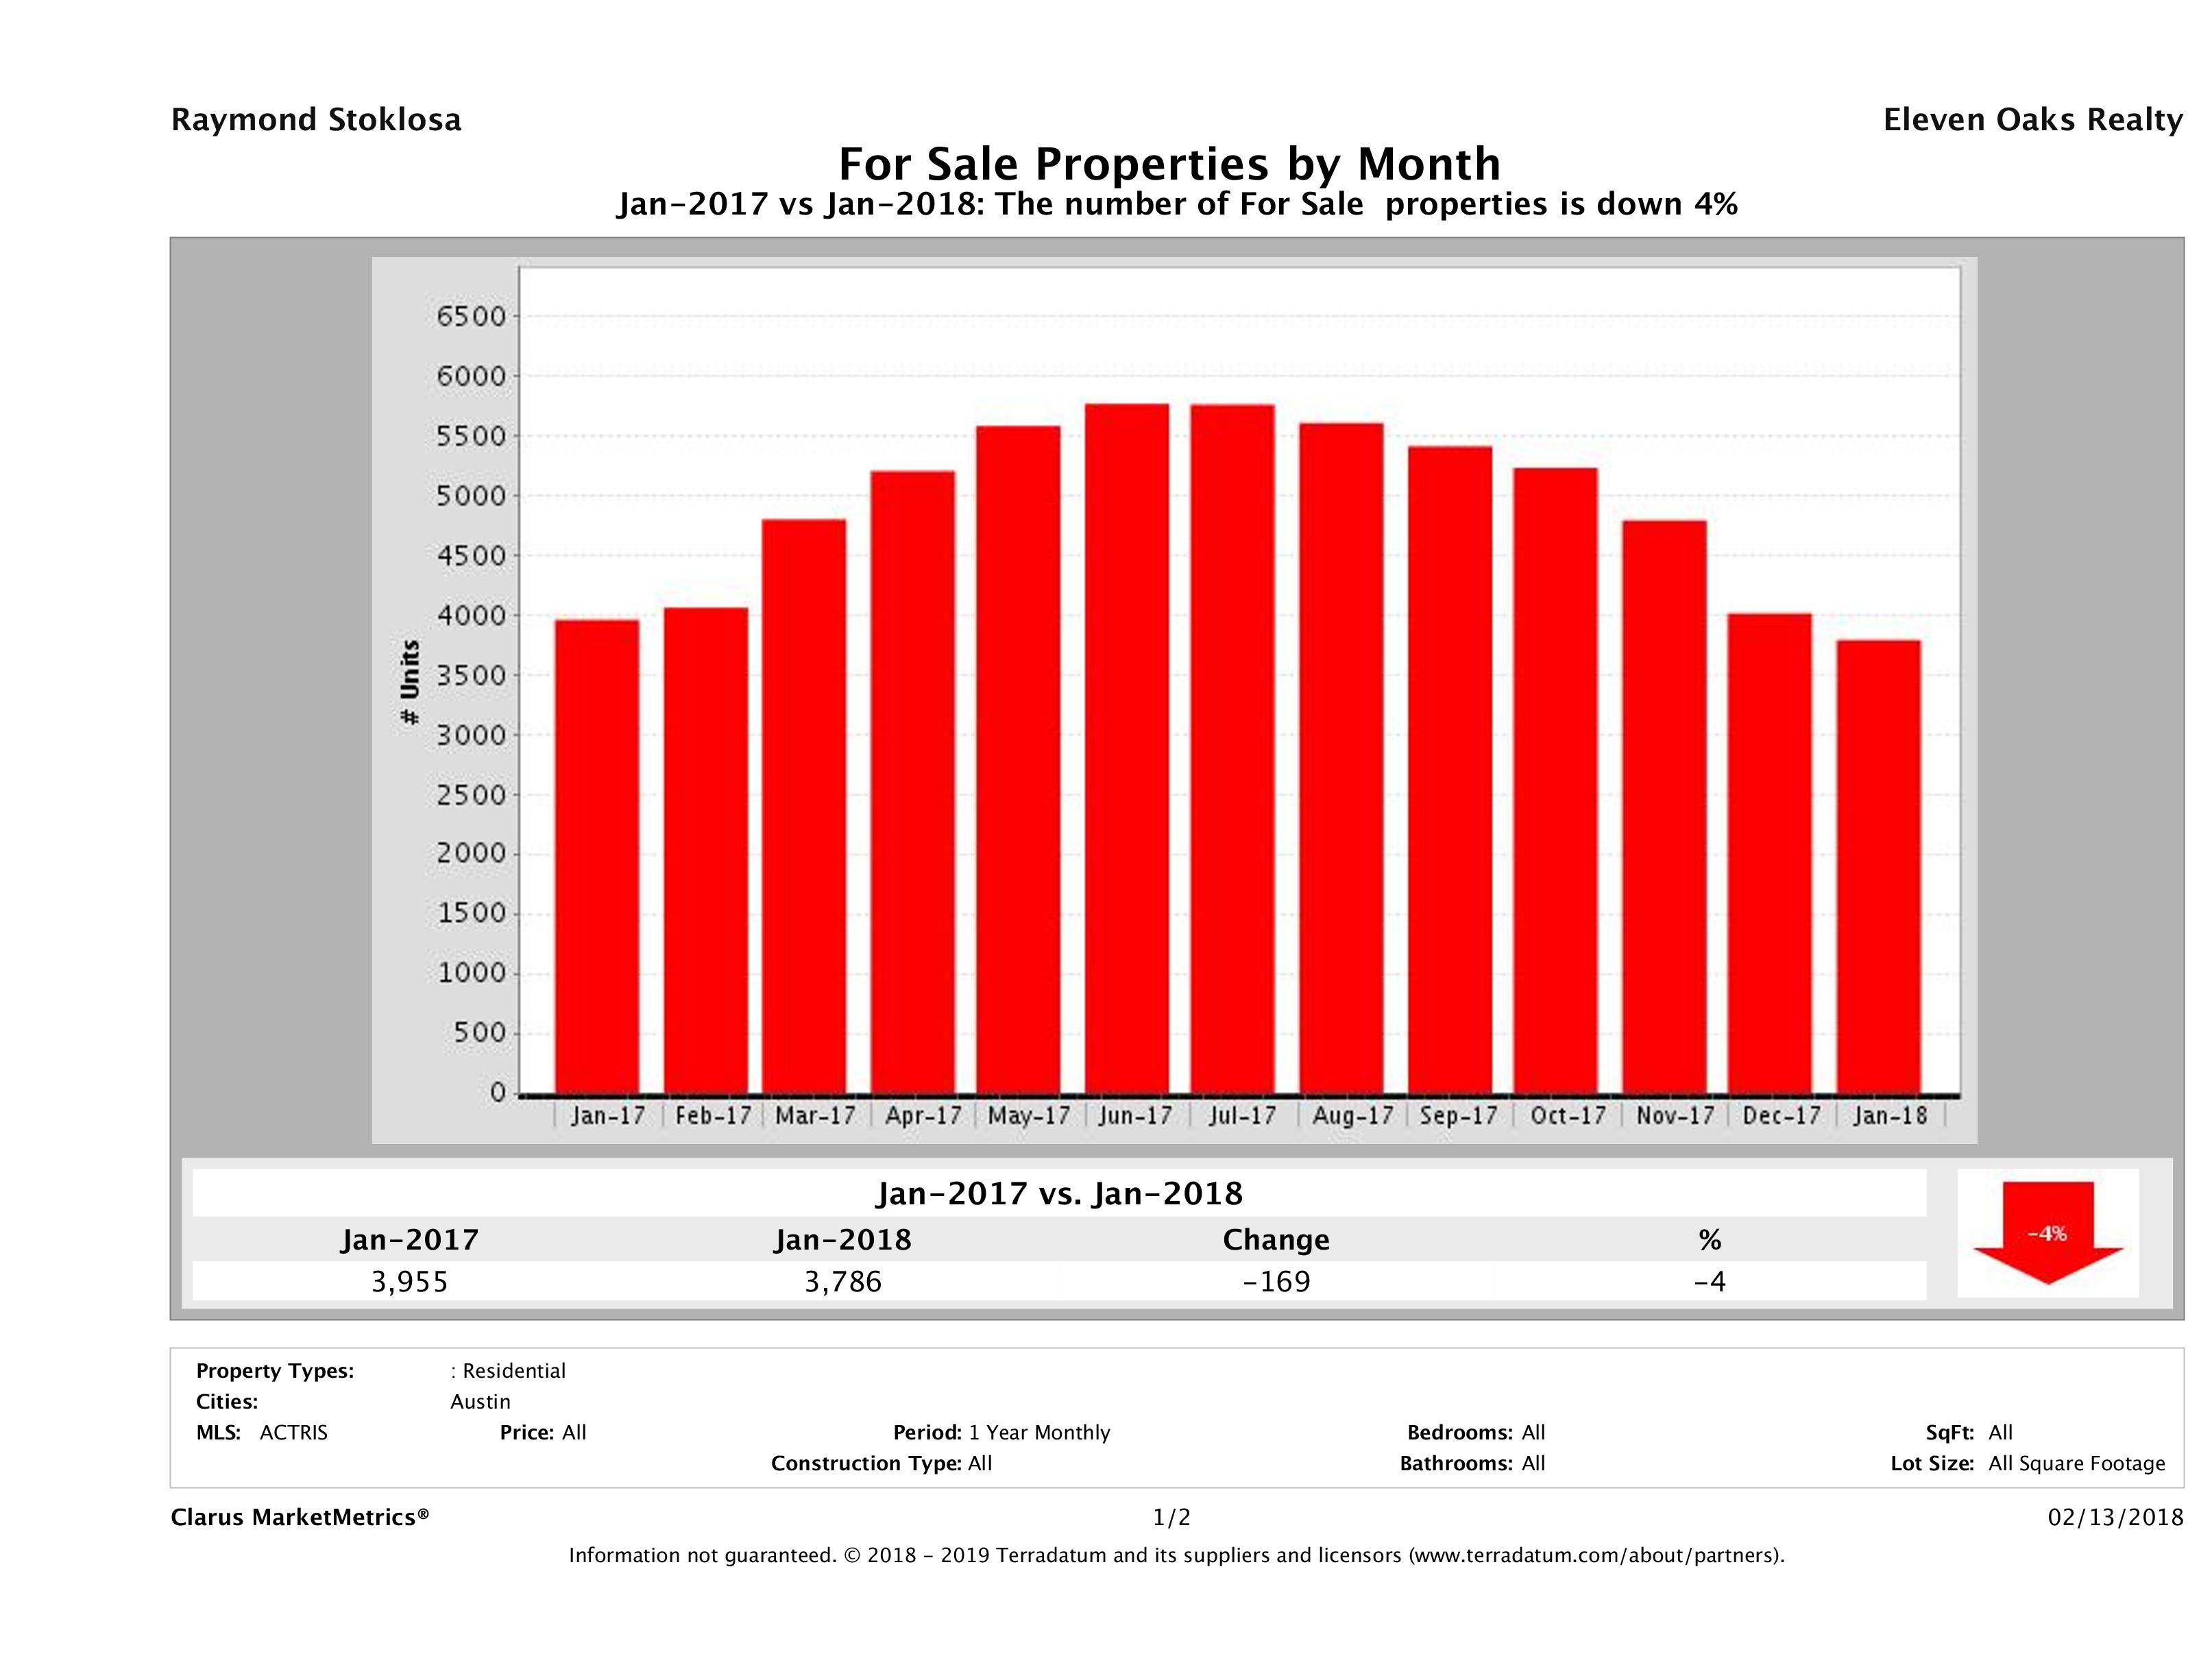
4% Decrease in Number of Homes on the Market
In January 2018, we had 3,786 homes for sale in Austin, compared to 3,955 in January 2017, showing a 4% (169 home) decrease in year over year numbers. With inventory numbers already low this year, even a small drop will be felt by buyers looking for more choices.
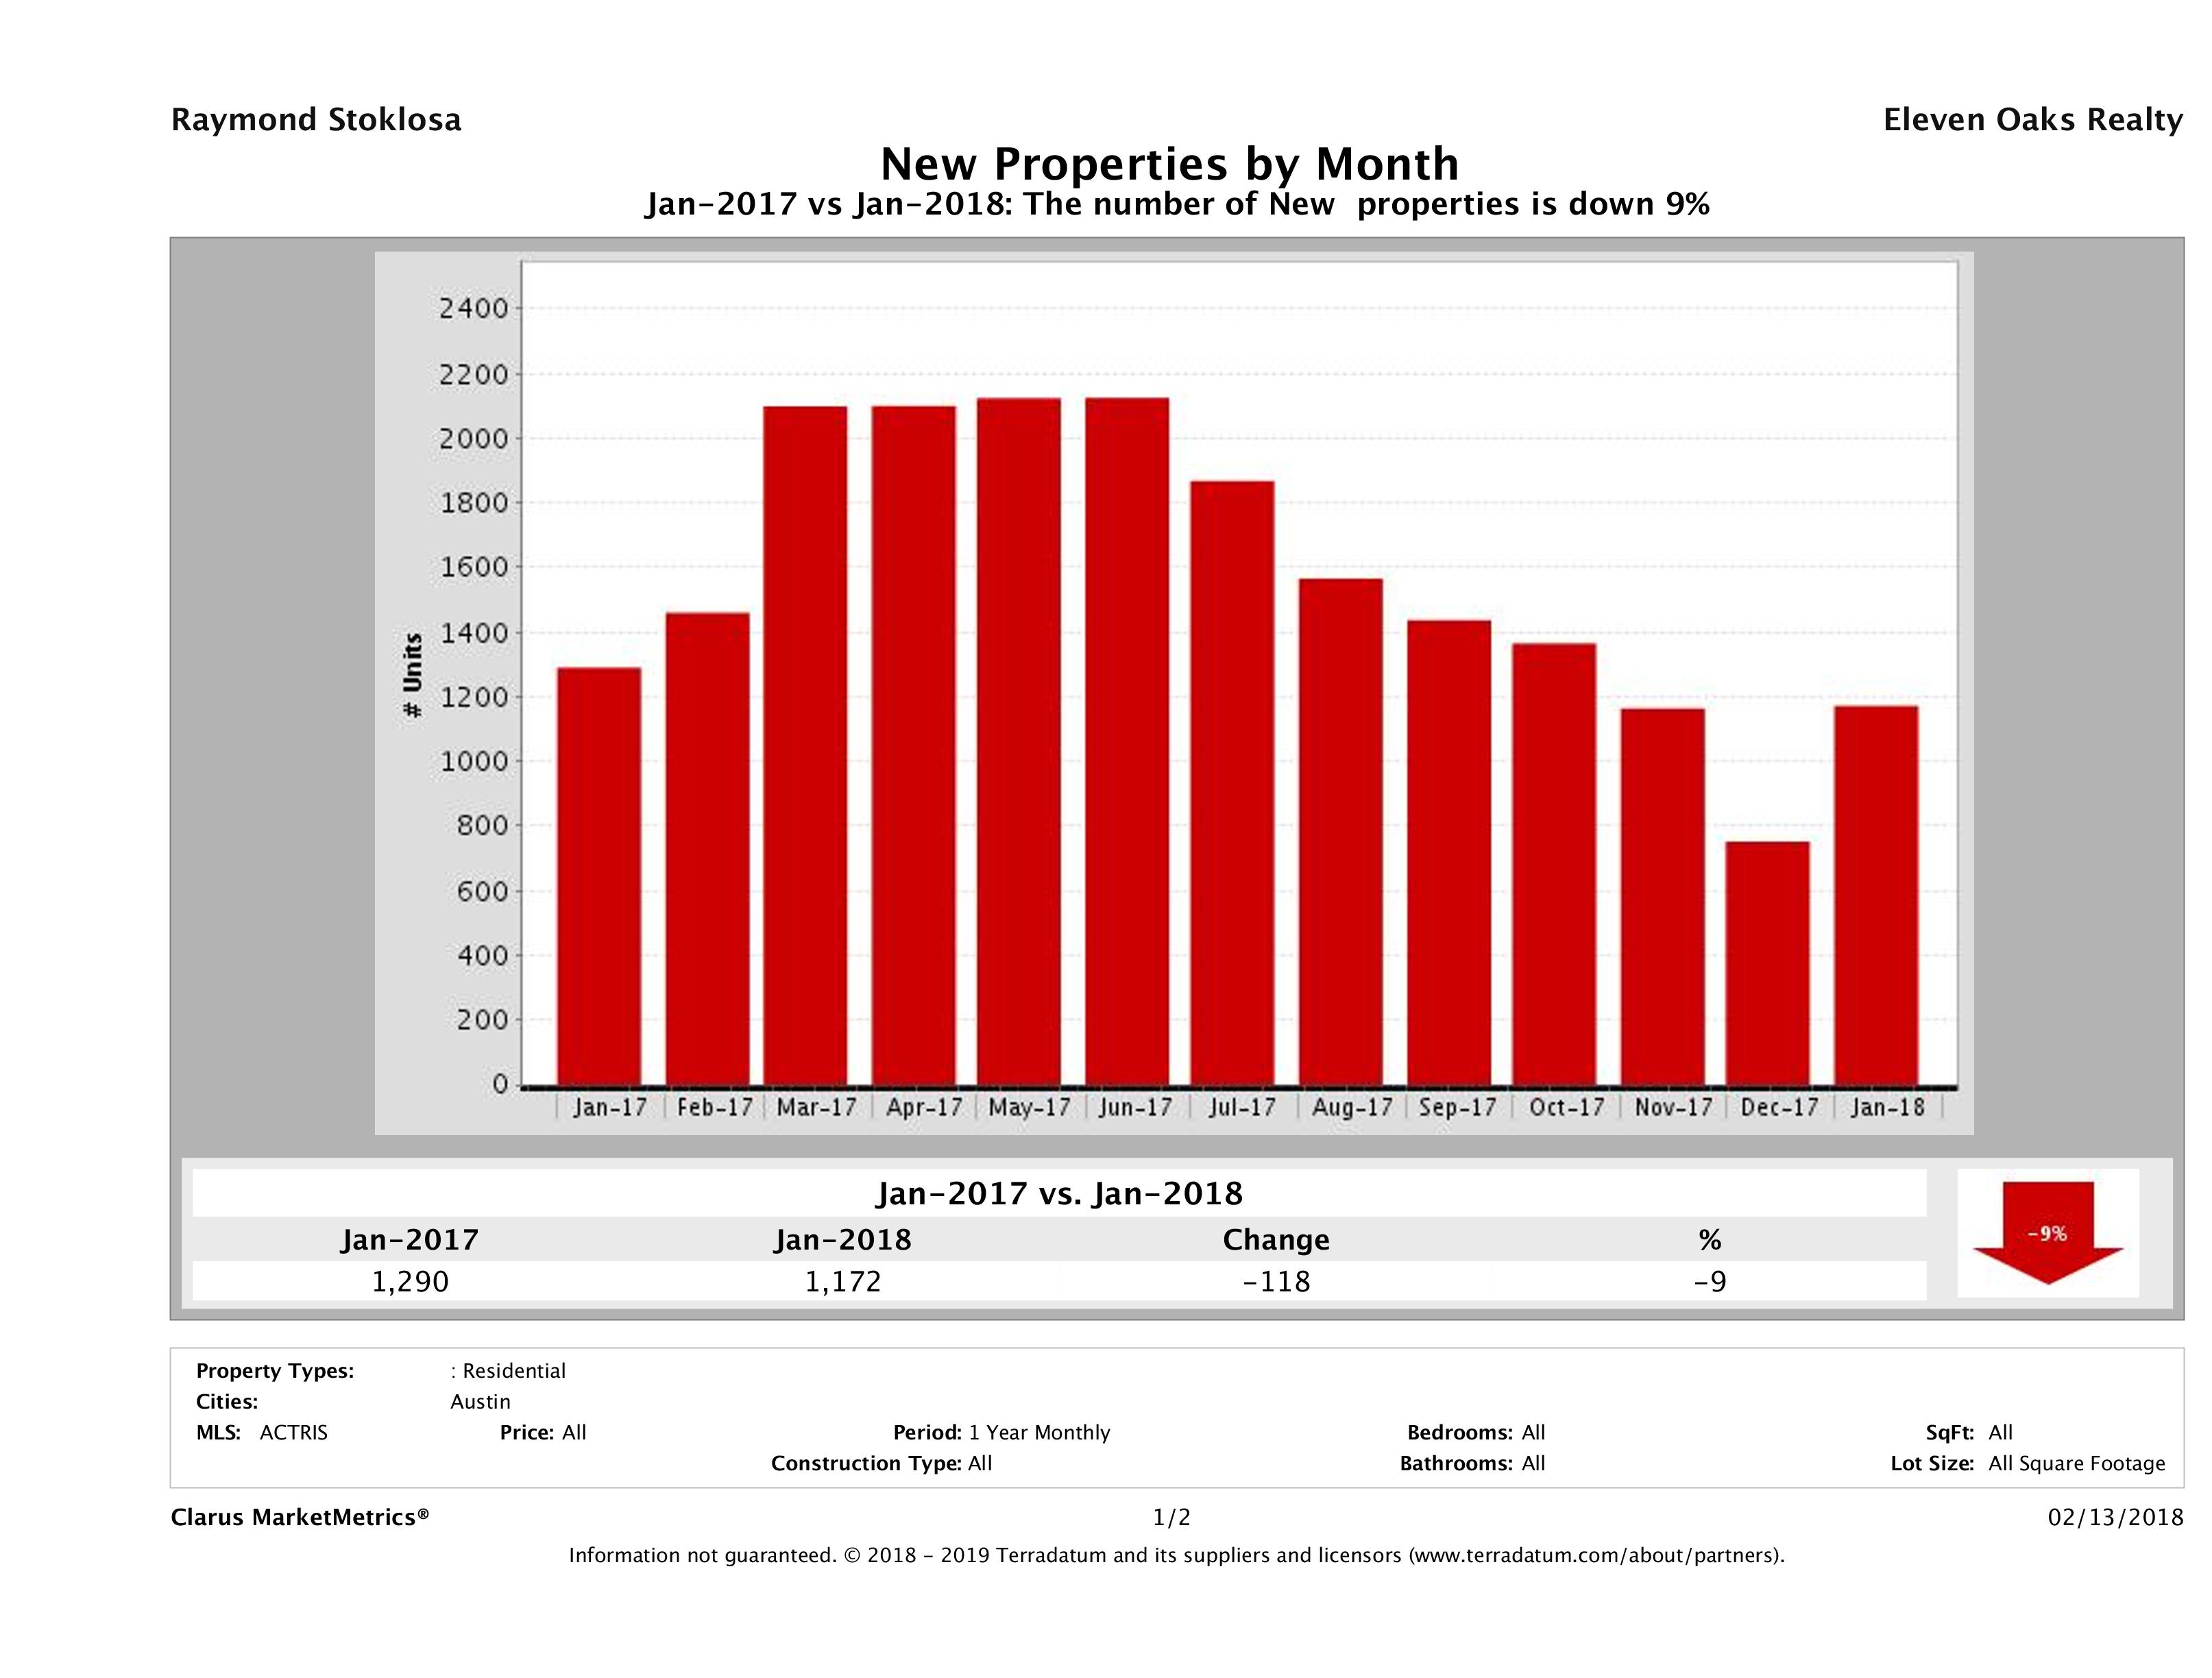
9% Decrease in Number of Homes Listed for Sale
In January 2018, we saw 1,172 homes introduced to the market compared to 1,290 in January 2017, a 9% (118 home) decrease in year over year numbers. This is fairly typical for winter when activity slows dramatically due to the holidays.
Supply Down 4% and Demand Up 1%
This month we saw a 4% decrease in supply (number of properties for sale) and a 1% increase in demand (number of sold properties). The market is fairly even this month as supply and price are supported by a slight increase in demand.
Median for Sale Flat vs Median Sold Price Up 5%
This chart compares the Median for Sale Price vs the Median Sold Price to show their relationship. In Austin, we saw no change in the median for sale price and a 5% increase in the median sold price of a single family home in year over year numbers.
Source: Clarus Market Metrics, ACTRIS Sold Data
January 2018 Austin Real Estate Price Report – Strictly Numbers
For those of you who prefer to see the actual numbers, we’ve included the figures for January 2018 Austin home sales below. The most expensive home that sold in January 2018 sold for $2,550,000 and the least expensive home sold for $125,000. Homes ranged in size from 324 sqft – 7,142 sqft with an average size of 2,129 sqft. The average price per square foot for a home that sold in Austin in January 2018 was $212.58 with the lowest being $76.88/sqft and the highest being $820.06/sqft. It took, on average, 53 days to sell a home in Austin and sellers received, on average, 95.67% of their original list prices.
| Beds | Baths | SqFt | List Price | LP/SqFt | Sold Price | SP/SqFt | SP/LP | SP/OLP | ADOM | |
|---|---|---|---|---|---|---|---|---|---|---|
| Min | 1 | 1 | 324 | $125,000 | $82.57 | $120,000 | $76.88 | 39.98% | 39.98% | 0 |
| Max | 6 | 9 | 7,142 | $2,550,000 | $868.06 | $2,325,000 | $820.06 | 112.89% | 112.89% | 398 |
| Avg | 3 | 3 | 2,129 | $449,952 | $218.41 | $436,840 | $212.58 | 97.64% | 95.67% | 53 |
| Median | 3 | 3 | 1,951 | $369,250 | $187.37 | $360,825 | $181.52 | 98.35% | 97.08% | 33 |
| Search Criteria | |||
|---|---|---|---|
| Status | Sold | Sold Date | Jan-18 |
| Property Type | Single Family Homes | Number Sold | 578 |
| Source: | ABoR Sales Data | Area | Austin |
Time to Buy? Sell?
As we always say, the best time to buy or sell a home is when you need to buy or sell. If you have a house to buy, buying when its a sellers market may hurt you on the buying end, but you’ll make it up on the selling end. If you’re trying to get into the market for the first time, the only way you’ll know that we’ve “hit bottom” is when its in the rear view mirror. Work with professionals who can help you analyze your financial and lifestyle to determine if now is the right time to buy or sell.
Looking strictly at the numbers, it appears the recommendation for this month is – it’s time to sell. The market is in a weird in-between time, but sellers should be positioned well for the spring market uptick. Though supply is up and demand is slightly down now, we typically see demand start to pick up in February and March. So, by the time you are done getting your house ready to put on the market, buyers will be ready to buy. Spend the next few weeks getting your home ready for the busiest time of year. If you’re a seller who needs to sell now, work with a professional Realtor who can help you position your home as the best value on the market. Though we aren’t seeing as much activity, median price is up, showing there are still highly motivated buyers in the market. Check out our 88 Ways to Sell Your Home Faster and For More Money for some tips on how you can prepare your home to meet the market. For more info about our Home Selling Program and why it is the best in Austin, check out Sell My Austin Home.
If you’re looking to buy, get started now. The earlier in the season you can start your home search, the more likely you are to be able to negotiate a better deal. As demand increases, sellers will start to see more showings and they will be less motivated to negotiate. Get your search set up and start looking at new listings now. If you’re looking to buy, we can help you be successful. We know the market and know how to get the best deal for a buyer. For more info about buying a home, visit Buy a Home in Austin.
Curious How Much You Could Sell Your Austin Home For?
Our Market Snapshot Tool is for you. With just your zip code, we’ll email you a detailed report showing what homes in your neighborhood sold for, how long it took to sell and how the market is trending. Though our Austin Real Estate Price Report is helpful in gauging the overall trend of the market, it doesn’t address neighborhoods specifically. If you’re looking for that type of report, put in your name and zip code below and our system will email you a Neighborhood Market Report.
Questions About the Austin Real Estate Price Report?
Do you have questions about this Austin Real Estate Price Report? Call us at (512) 827-8323 or email us at info@11OaksRealty.com and we’ll help you in any way we can. If you’re looking to buy or sell Austin real estate, don’t forget to check out our Buyer Resources and our Seller Resources for more tips.
Leave a Reply