The Dream Home Realty Group at Sky Realty is proud to present their January 2011 Austin Real Estate Price Report measuring activity in the Austin single family home market.
Looking for another area of town? Contact Us at (512) 827-8323 and we’ll get it over to you.
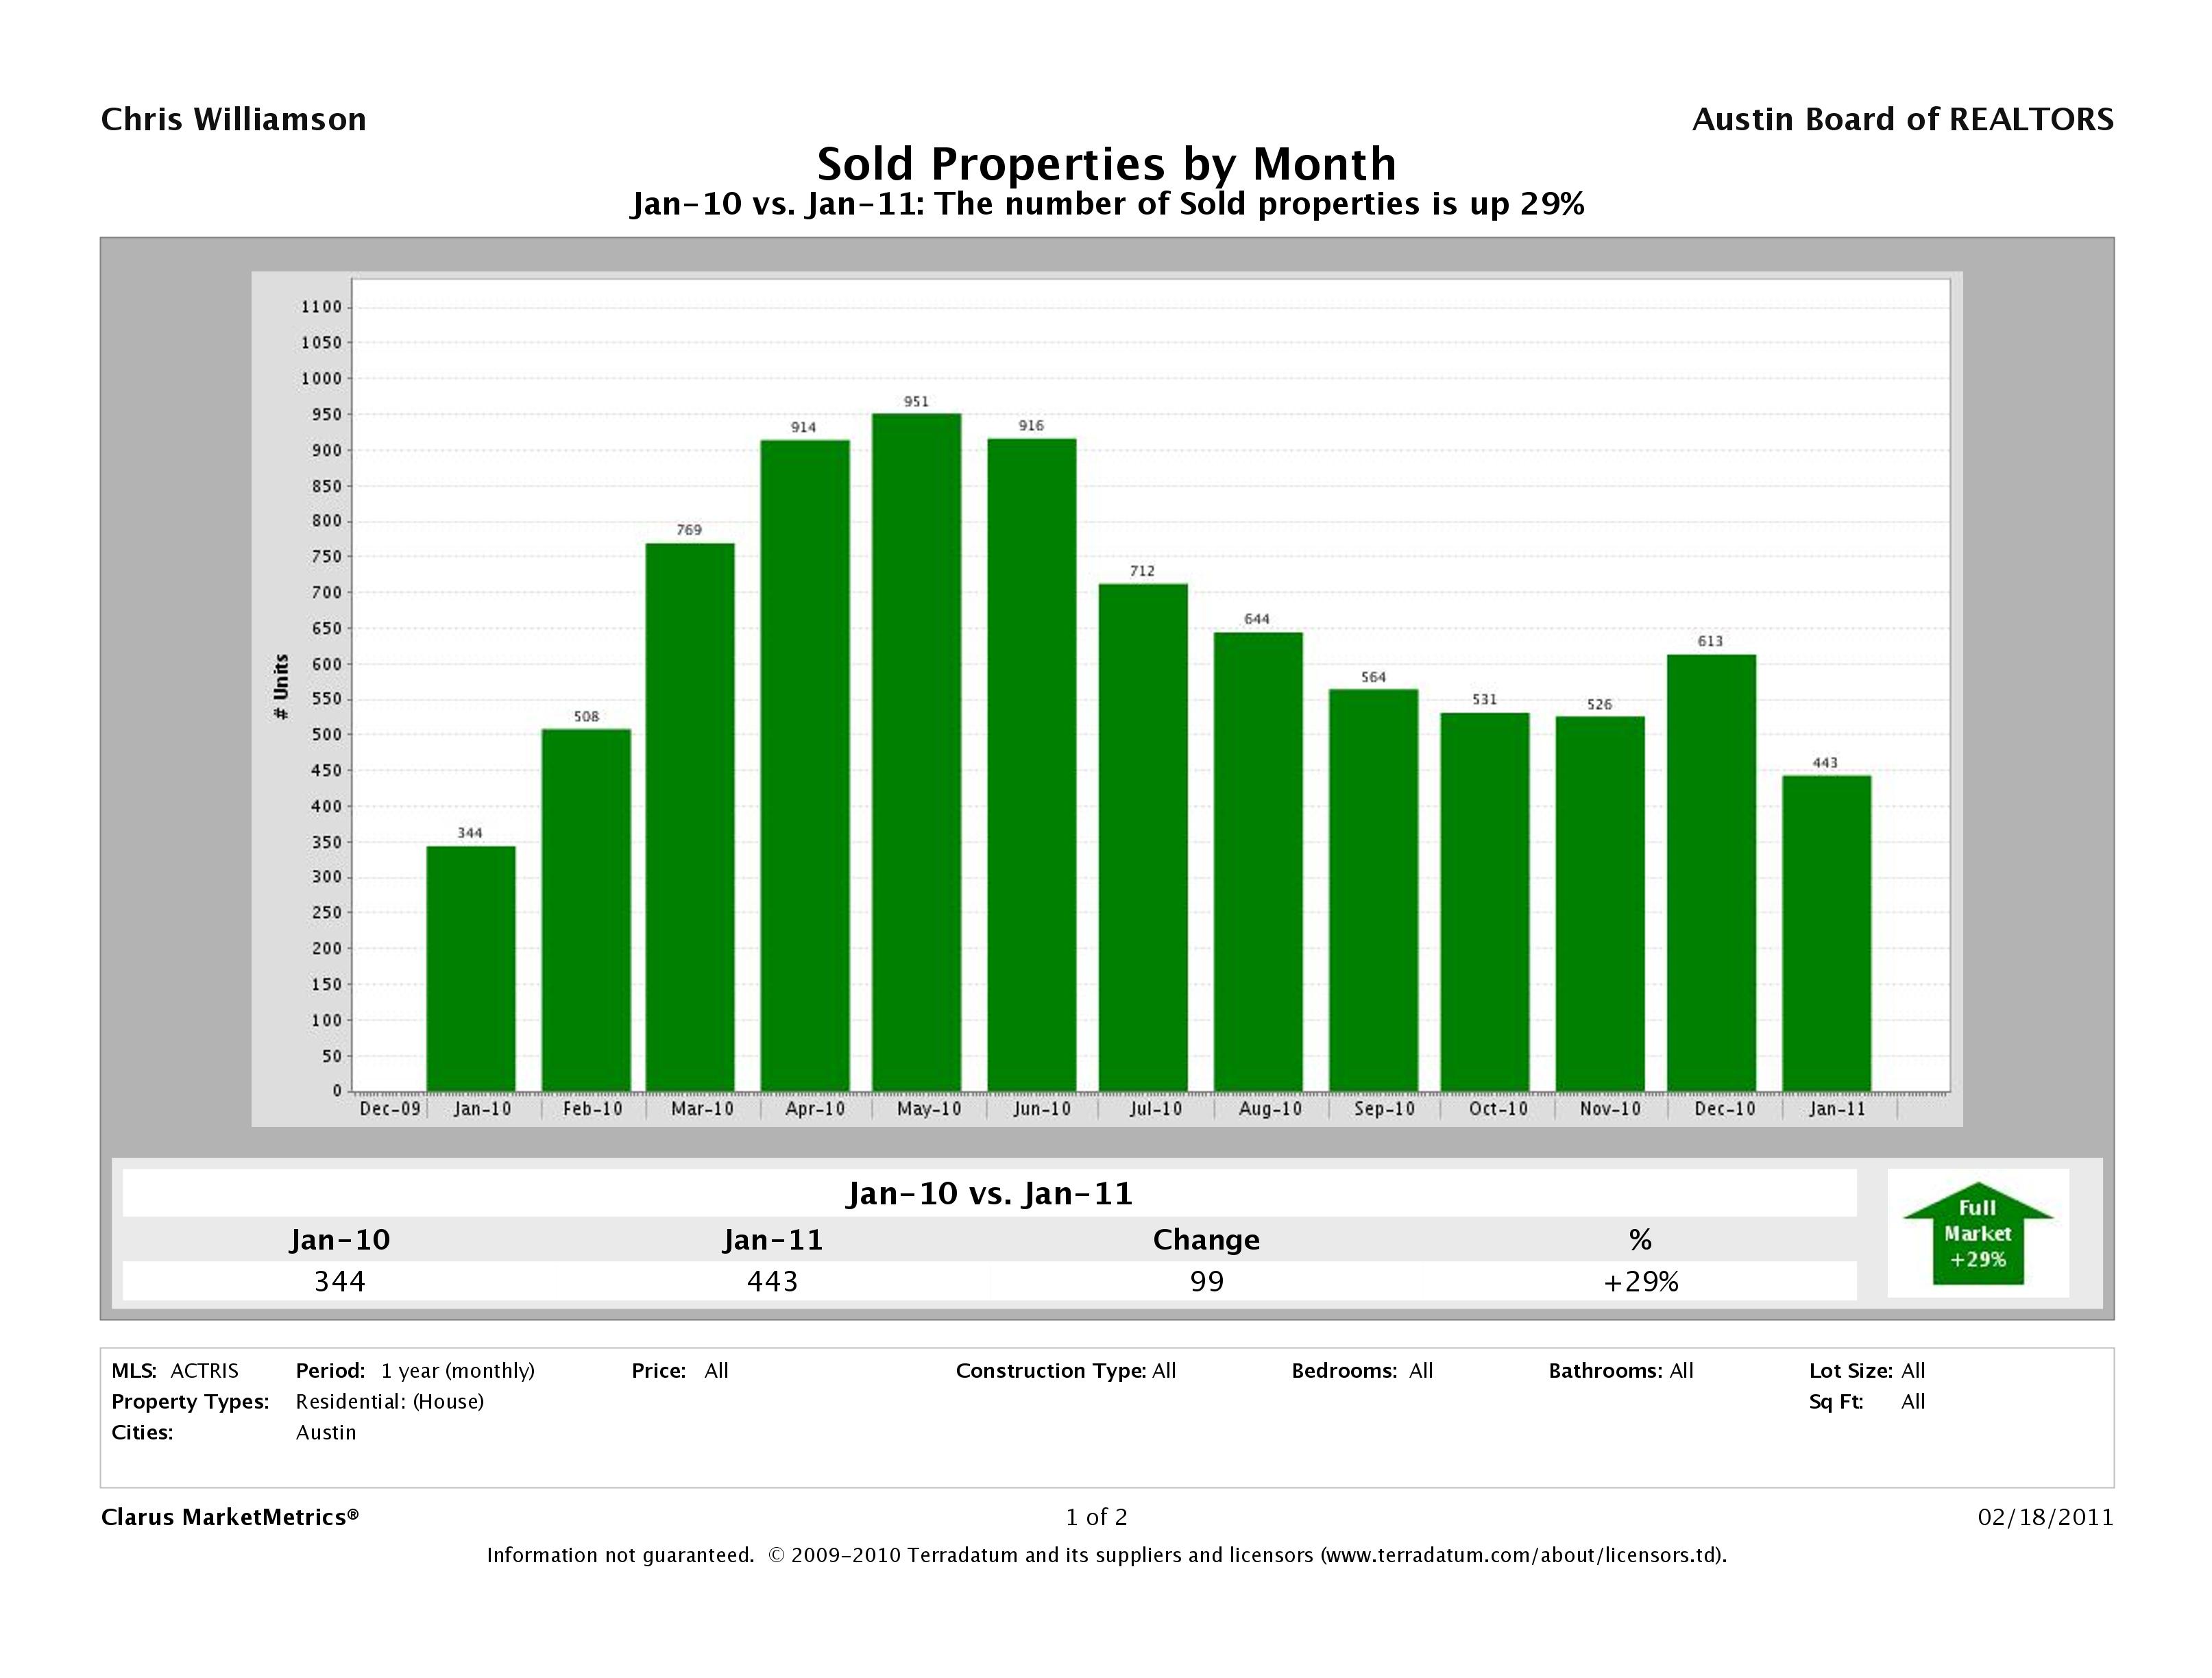
Austin Home Sales Up 29%
Confidence seems to have moved back into the Austin real estate market with number of single family homes sold seeing a 29% improvement in January year over year numbers. Bucking seasonal trends, investors and home buyers alike are getting up off the sidelines and making a run for Austin homes.
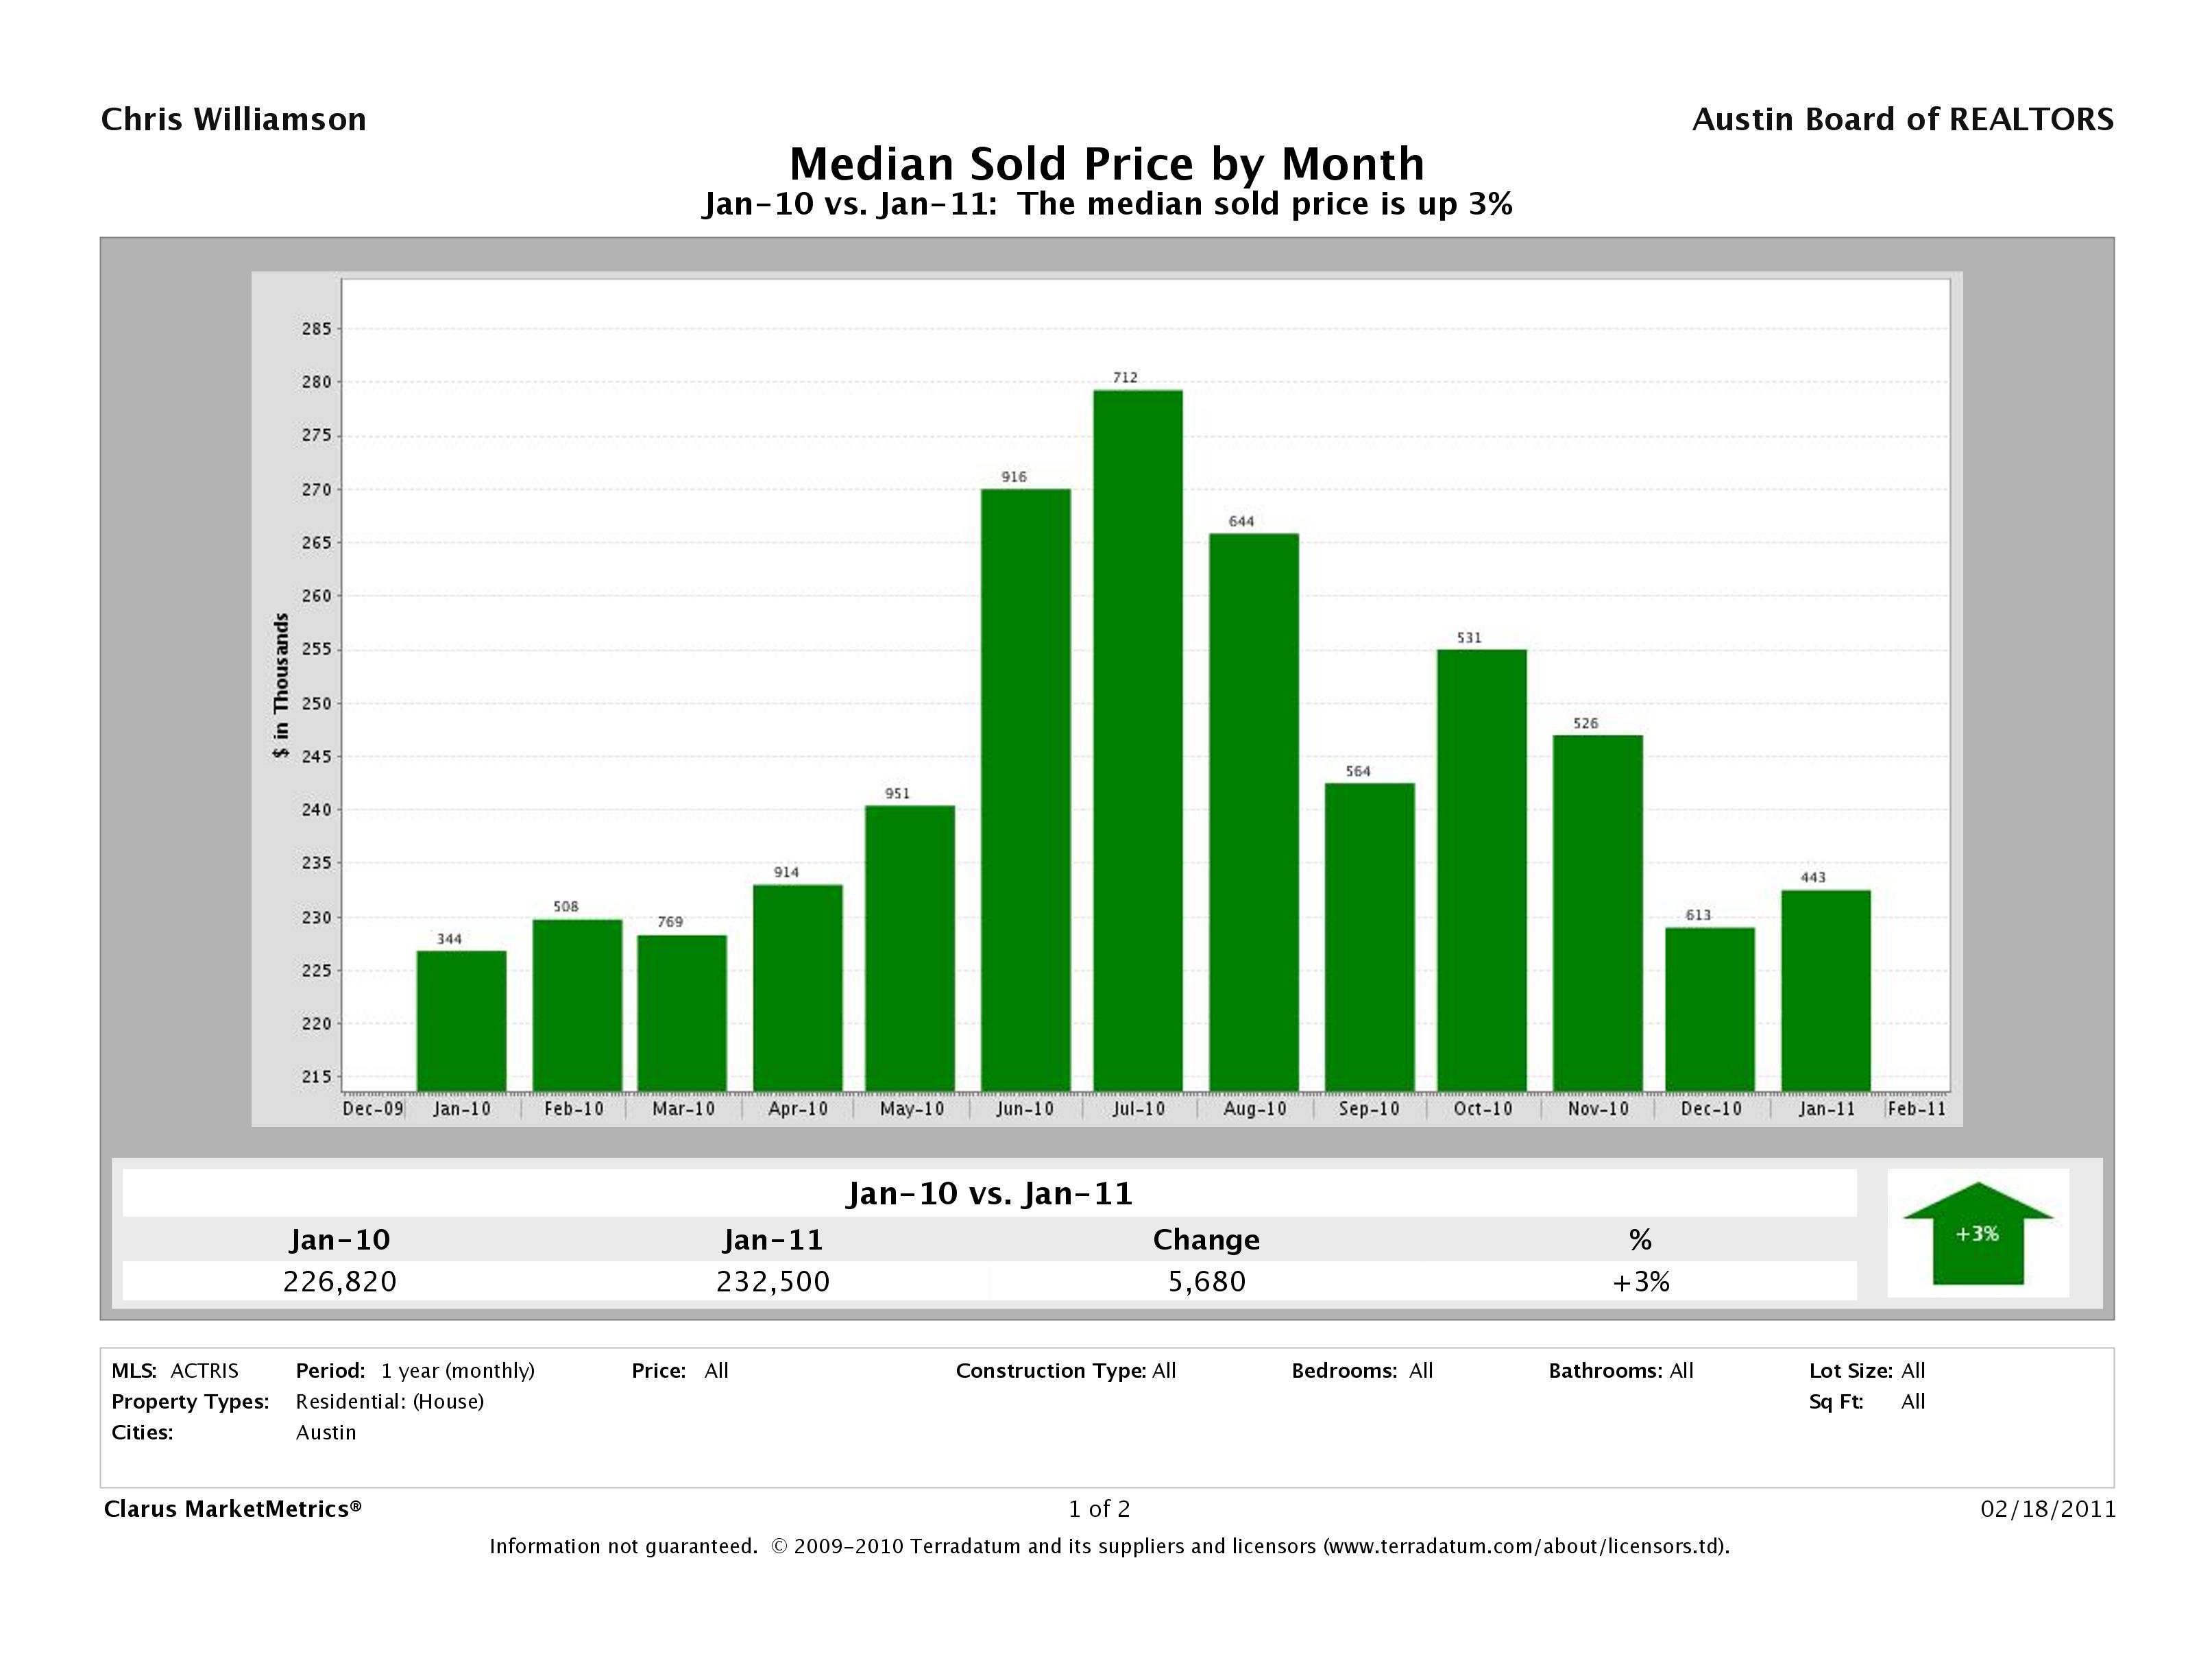
Median Sold Price Up 3%
The median sold price, up 3% in January year over year numbers shows the improvement in the Austin single family home market. June, July and August saw the highest median price in 2010, which is expected. Summer is the peak buying season and also a time you’ll find more home buyers looking for personal residences. Home buyers are more likely to spend more on a home than investors looking at it as a straight dollars and cents transaction. And, home buyers generally buy more expensive homes overall than investors.
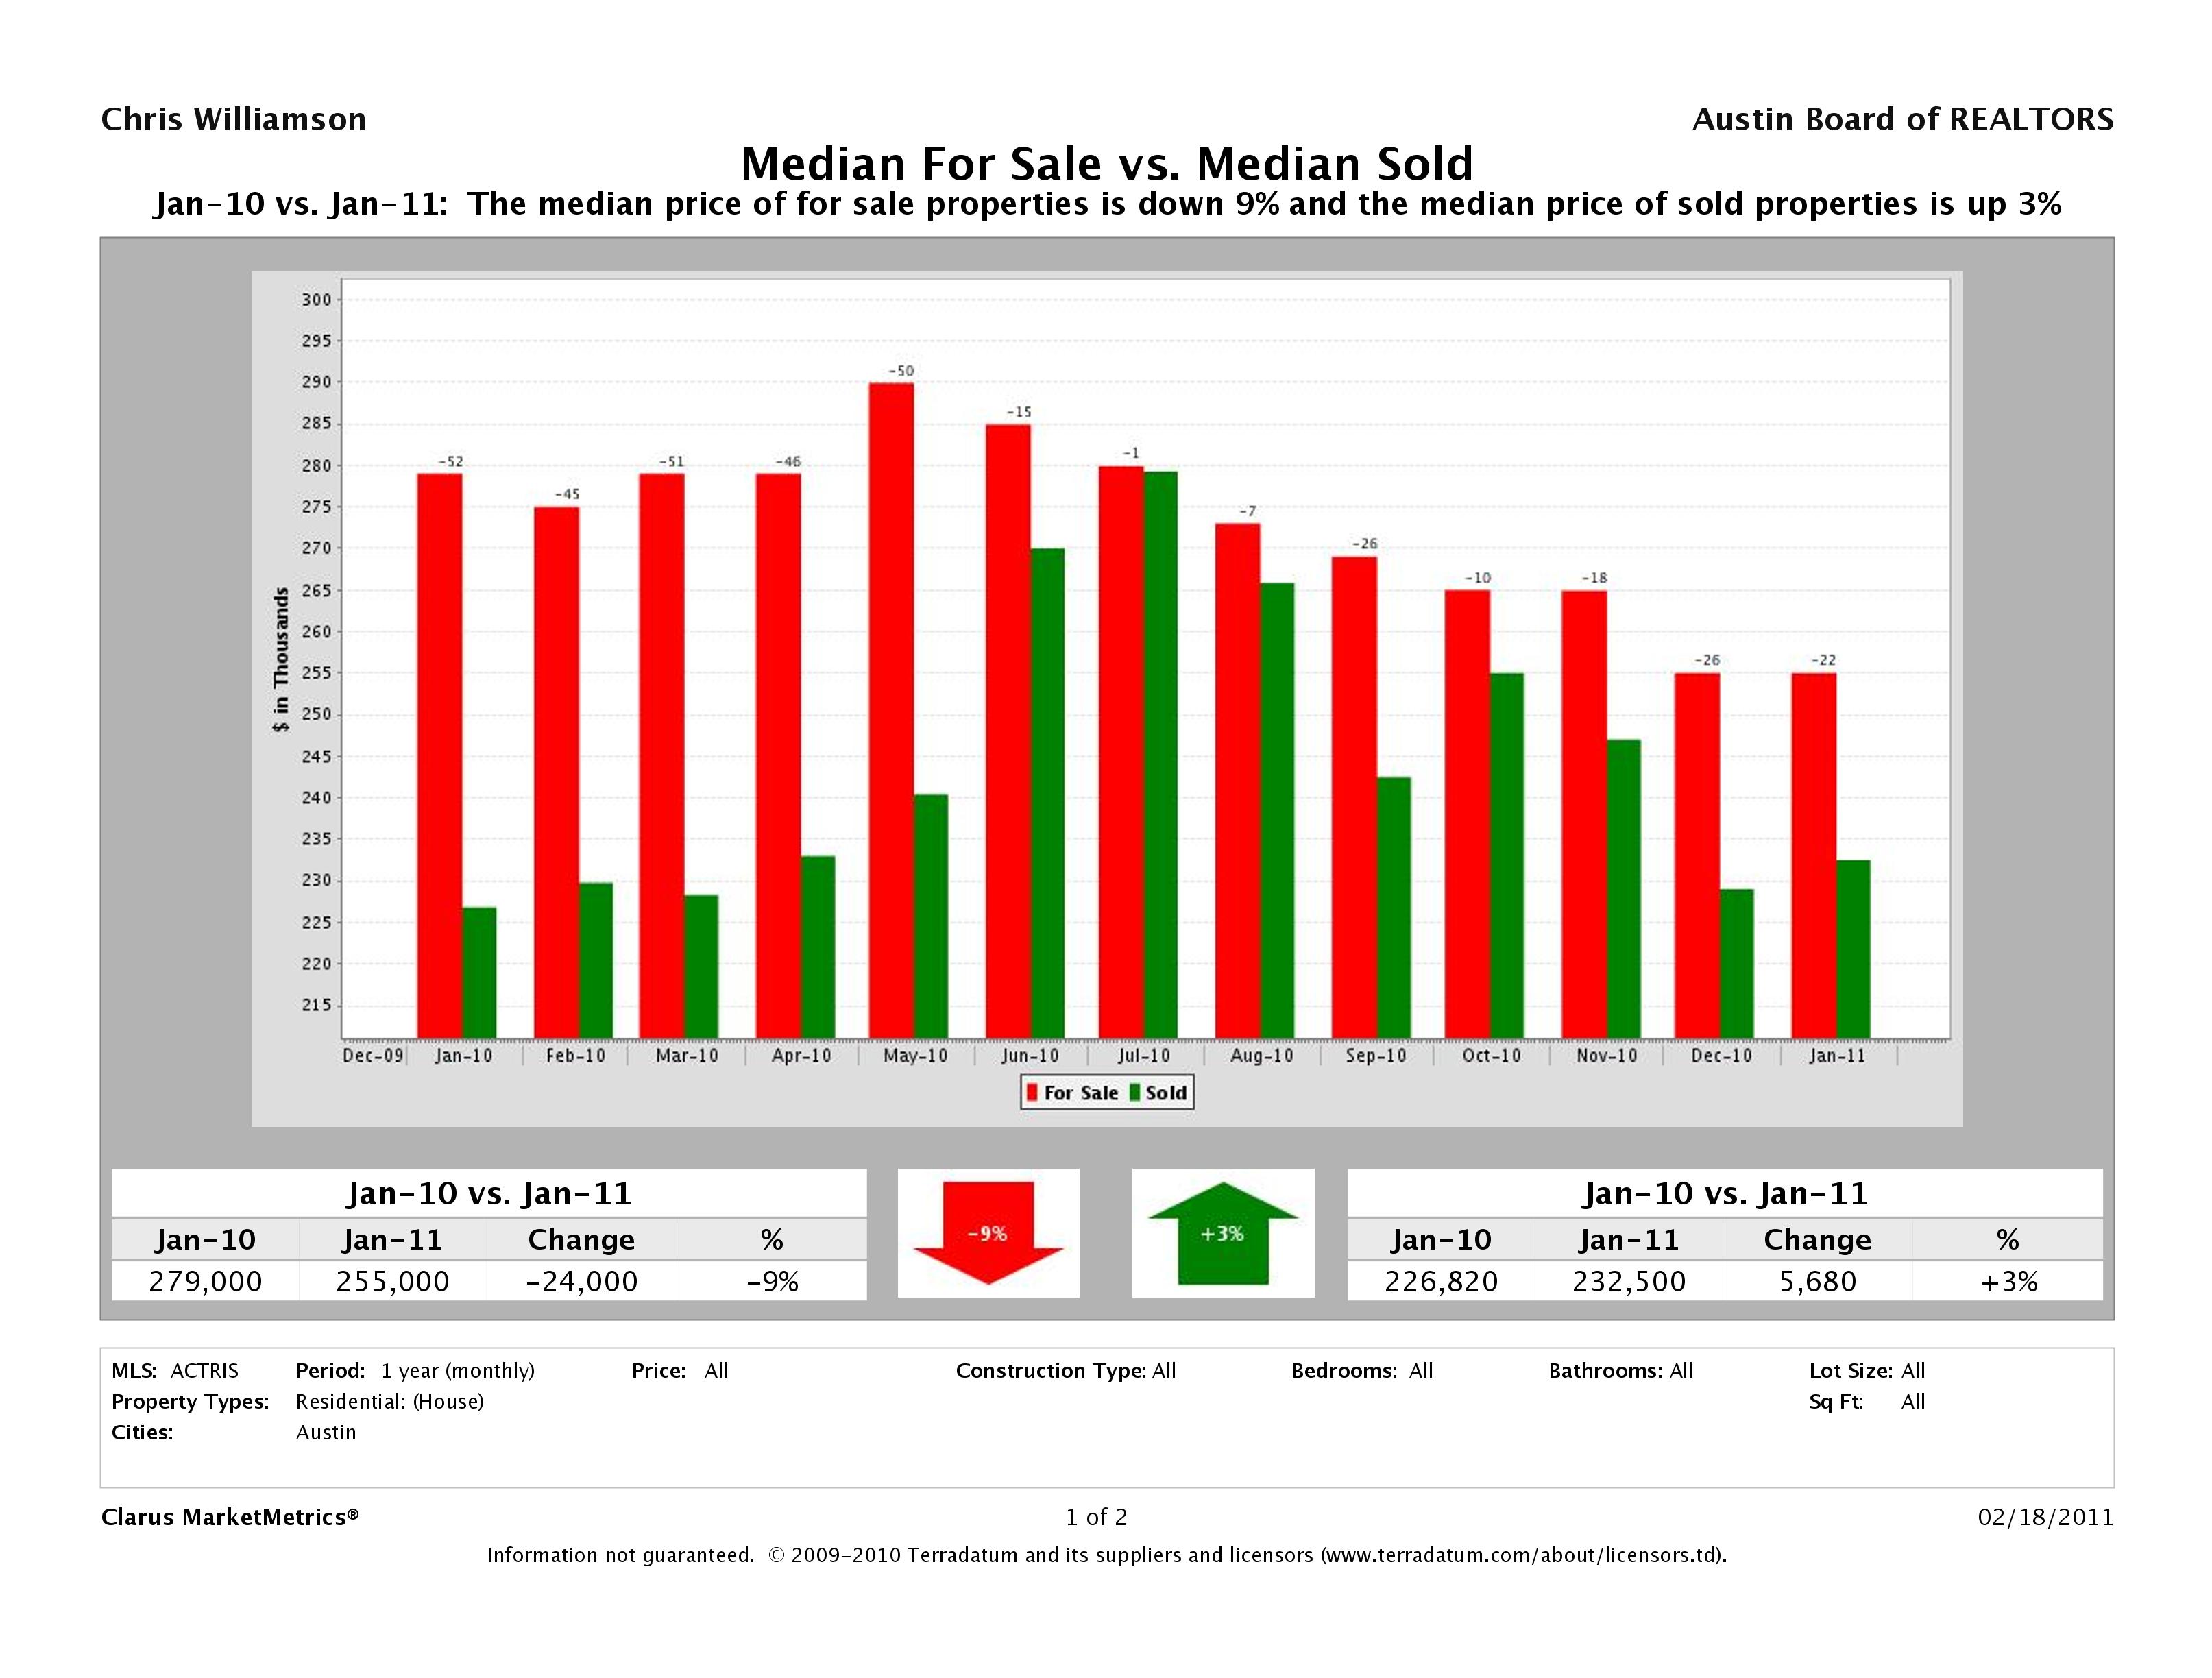
Gap Between For Sale and Sold Prices Tightening
The gap between Median for Sale vs. Median Sold Price is tightening. The median for sale price of Austin homes is down 9% in January year over year numbers while the median sold price is up 3%. Austin home sellers’ expectations seem to have caught up with the market and they are pricing their homes to sell.
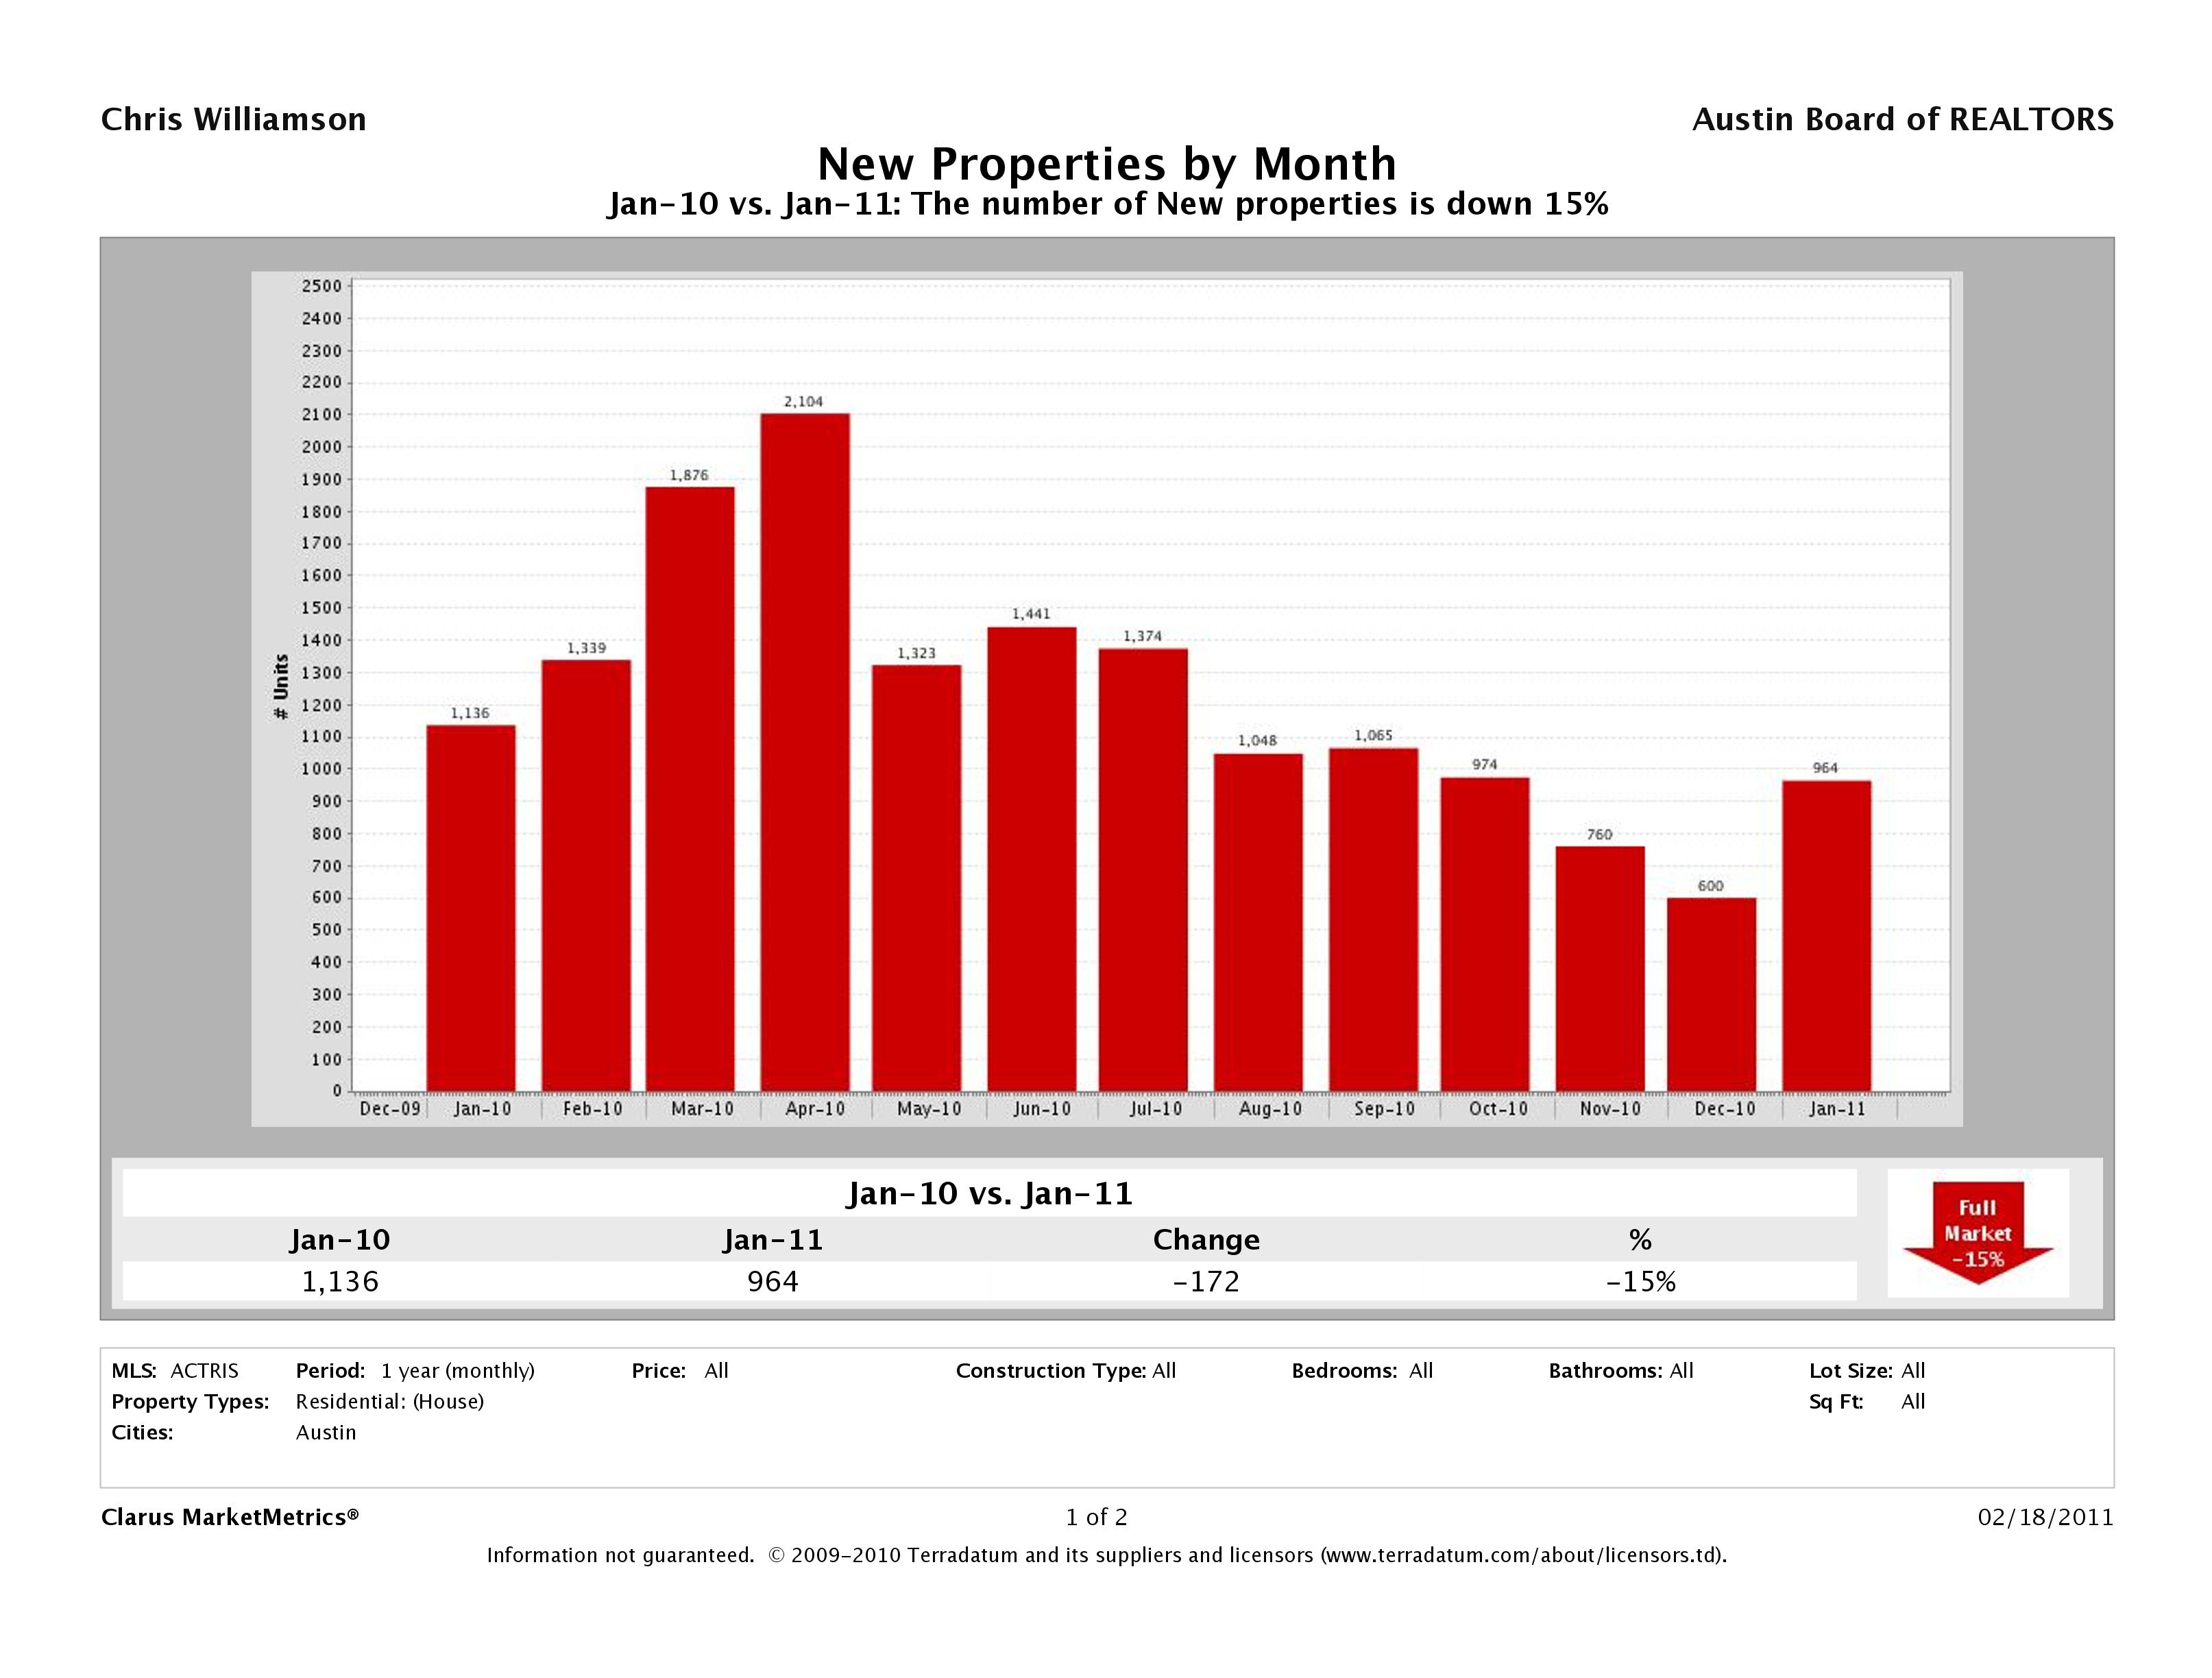
Fewer Homes Listed in Austin
15% less inventory was listed on the market in January 2011 (964 homes) vs. January 2010 (1,136 homes).
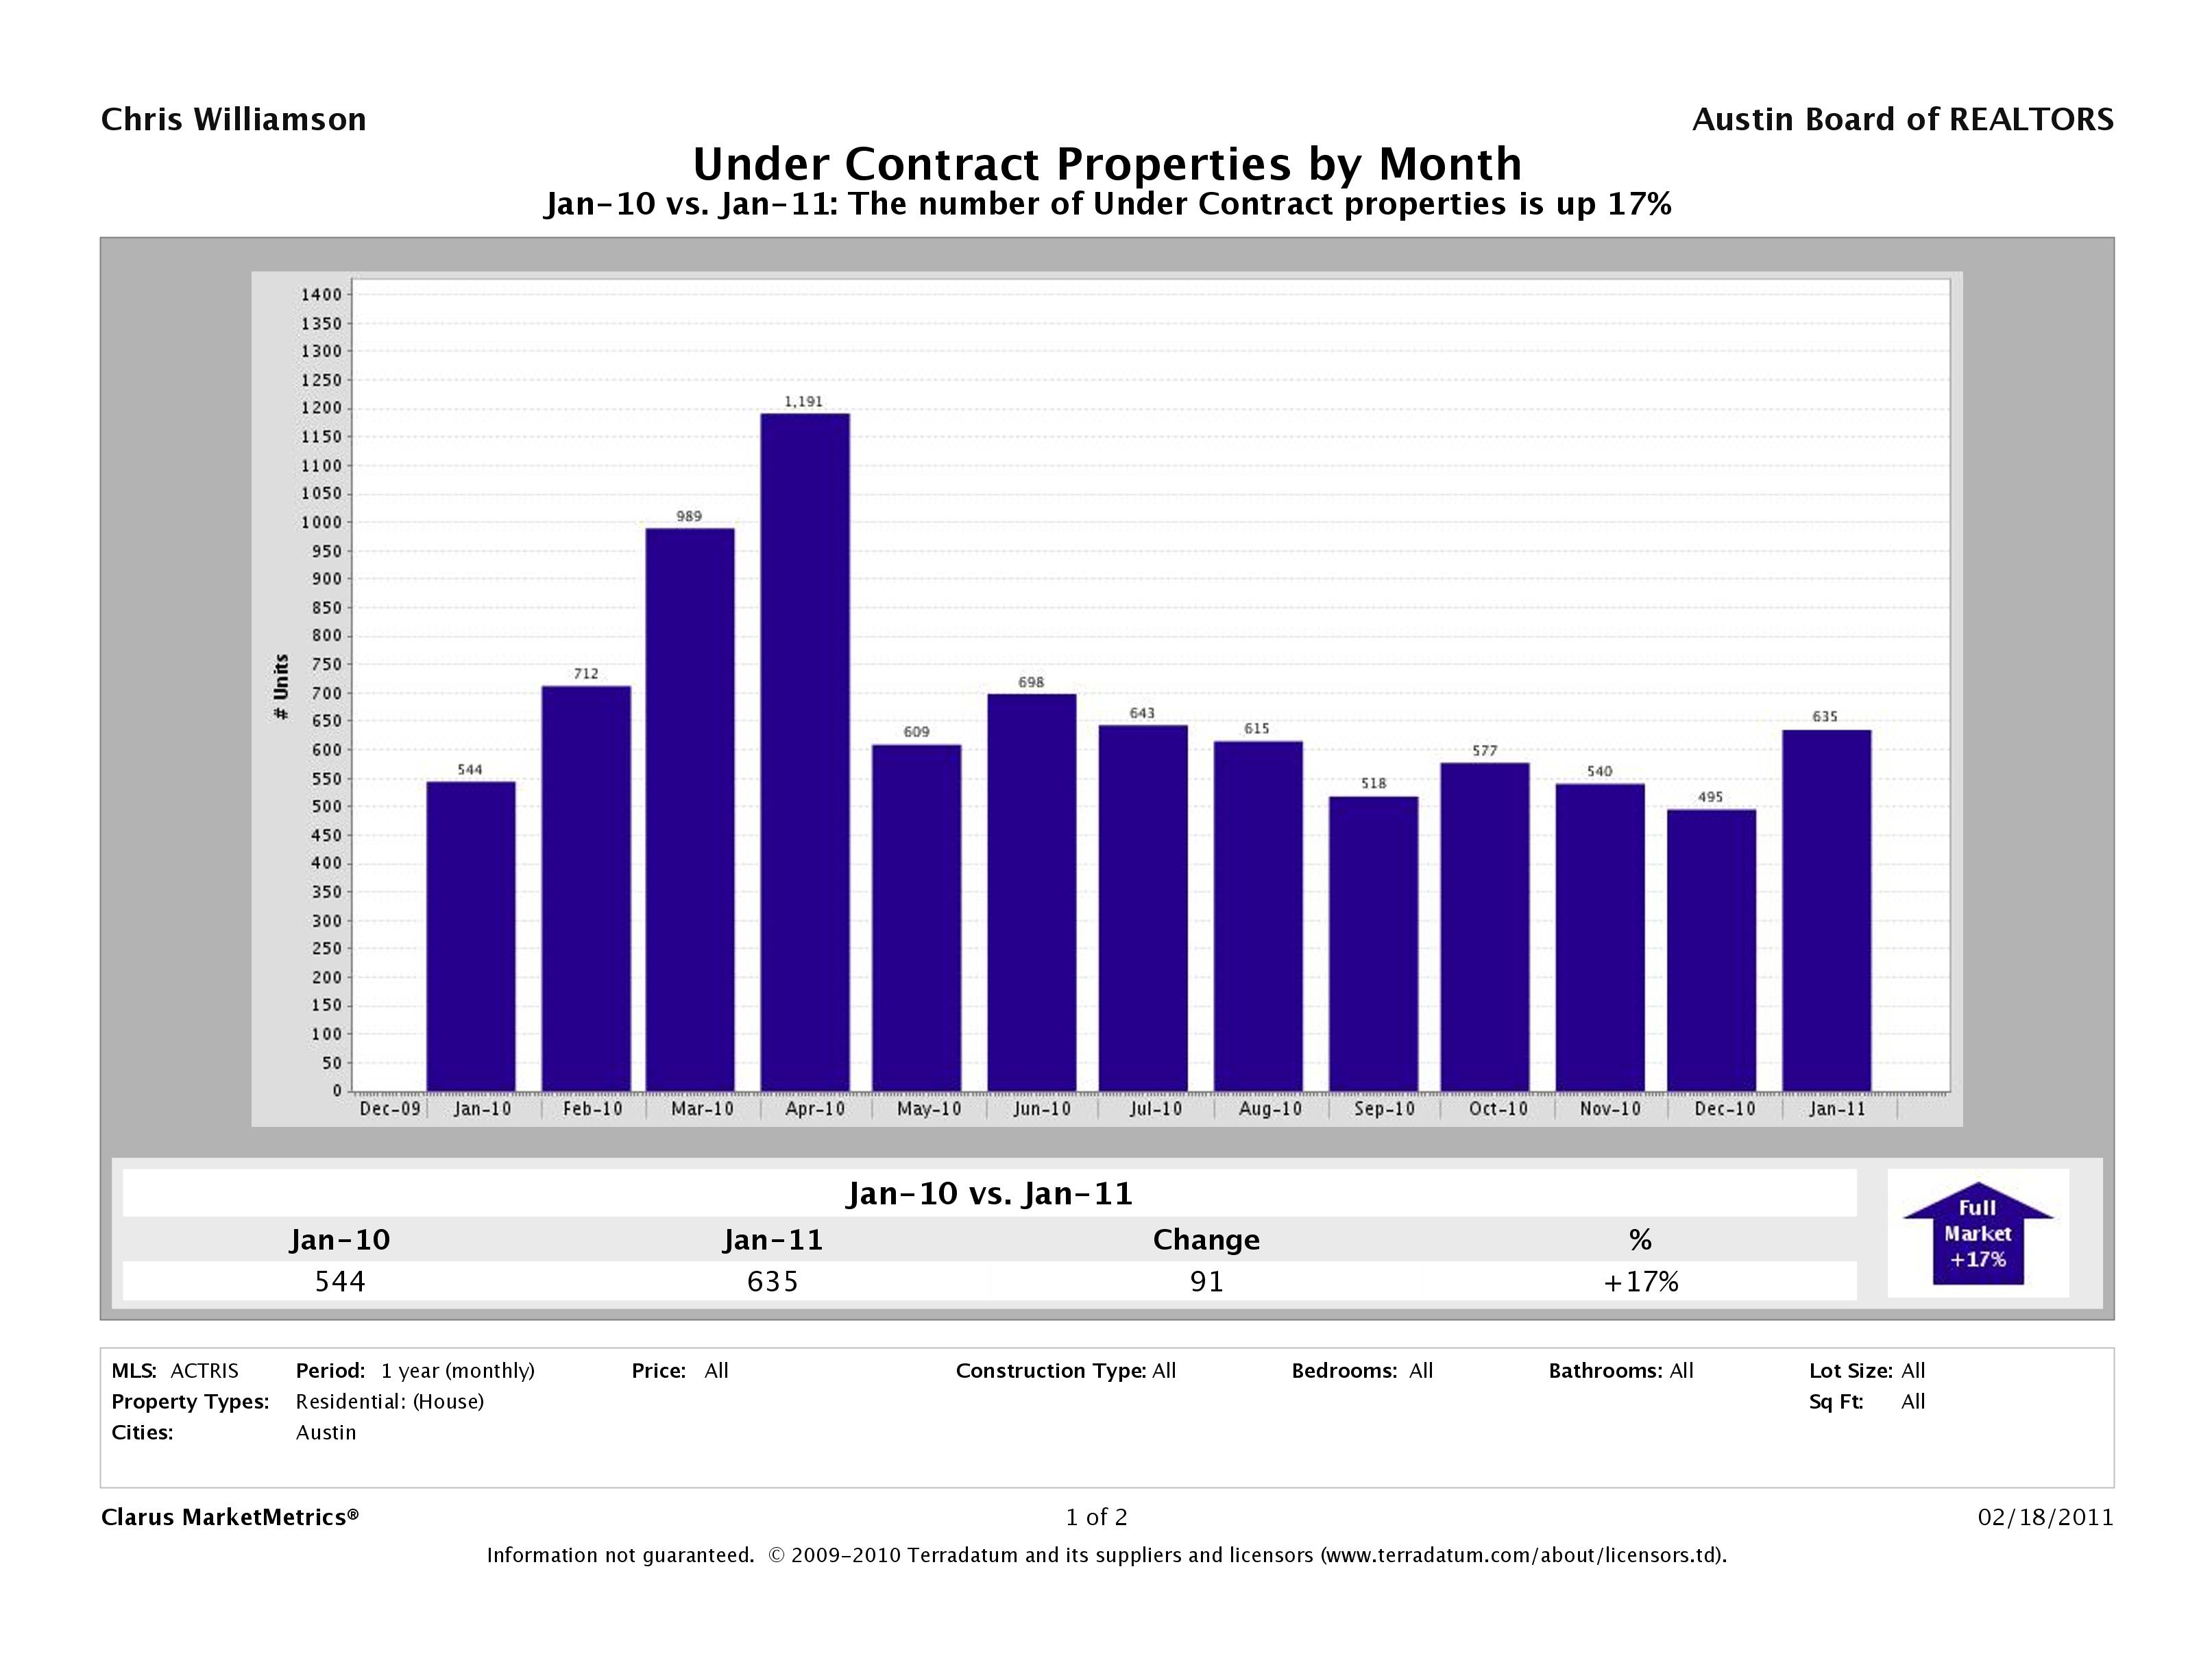
Highest Number of Pending Sales Since July 2010
The number of Austin homes that went pending increased by 17% going from 544 in January 2010 to 635 in January 2011. January 2011’s number was the highest number of pending contracts Austin homes have seen since July 2010, bucking all seasonal trends.
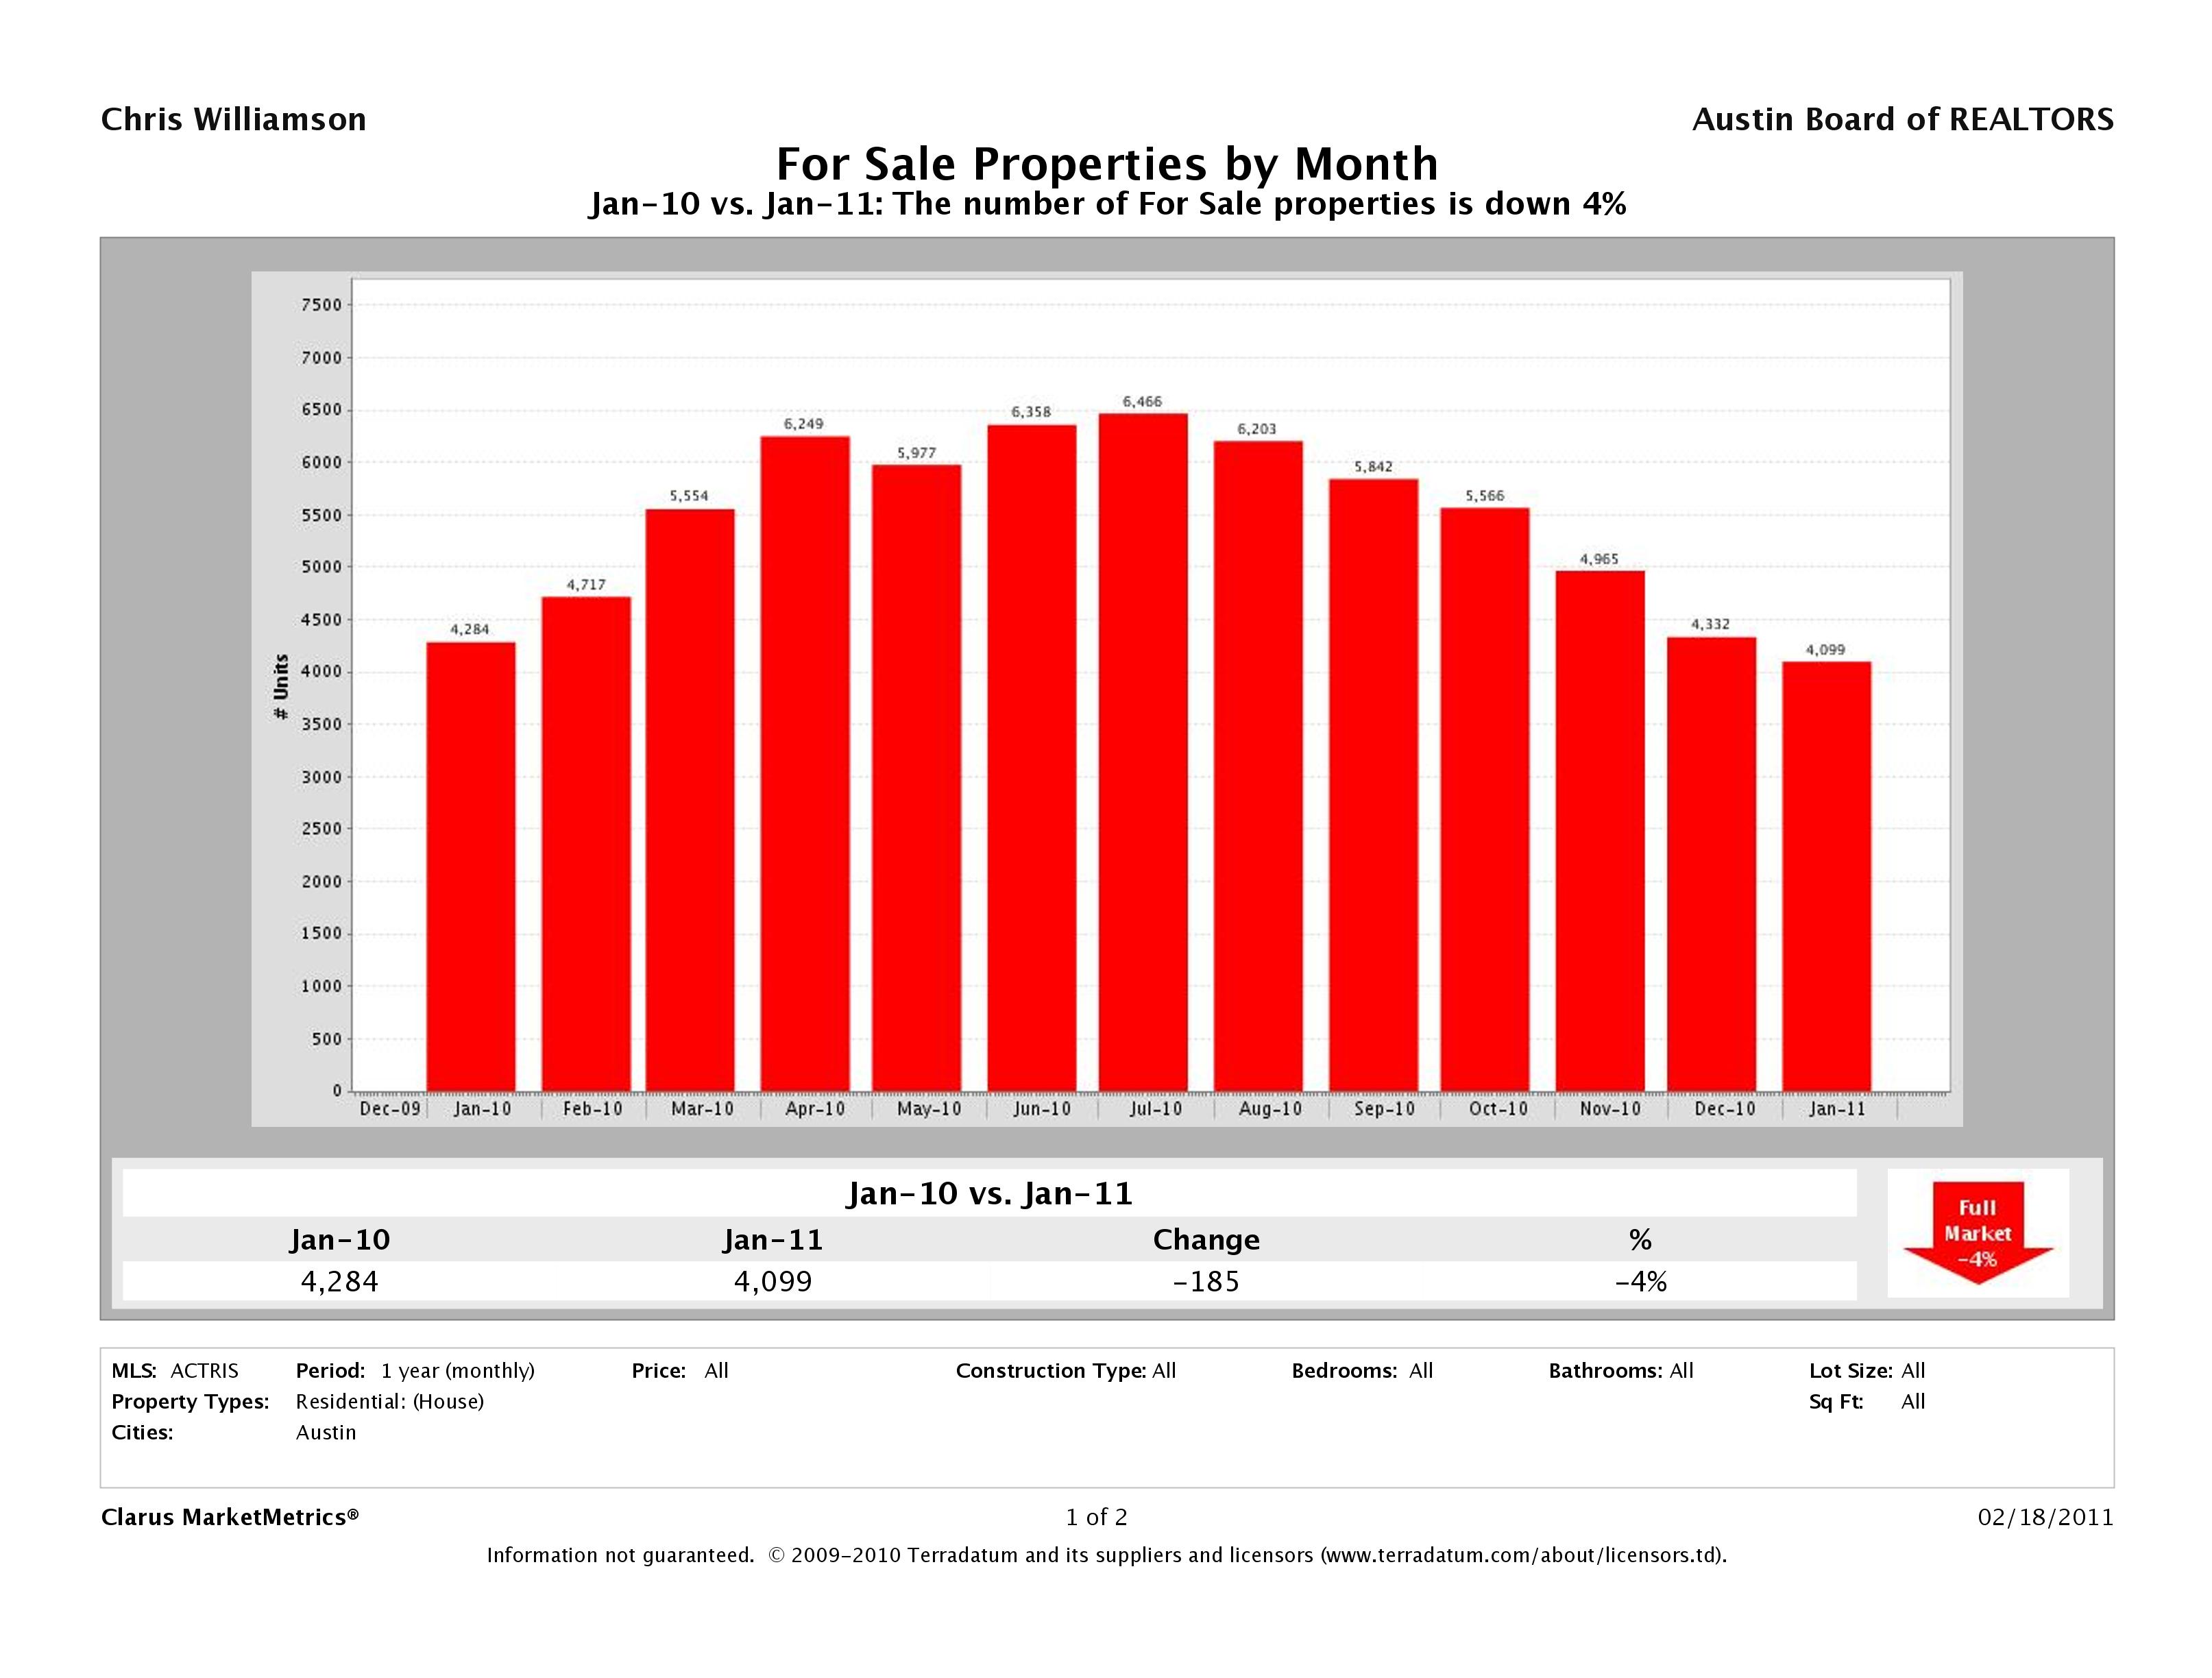
Number of Austin Homes for Sale Dropped 4%
The number of Austin homes for sale decreased 4% in year over year numbers which is what we’d expect given other market conditions.
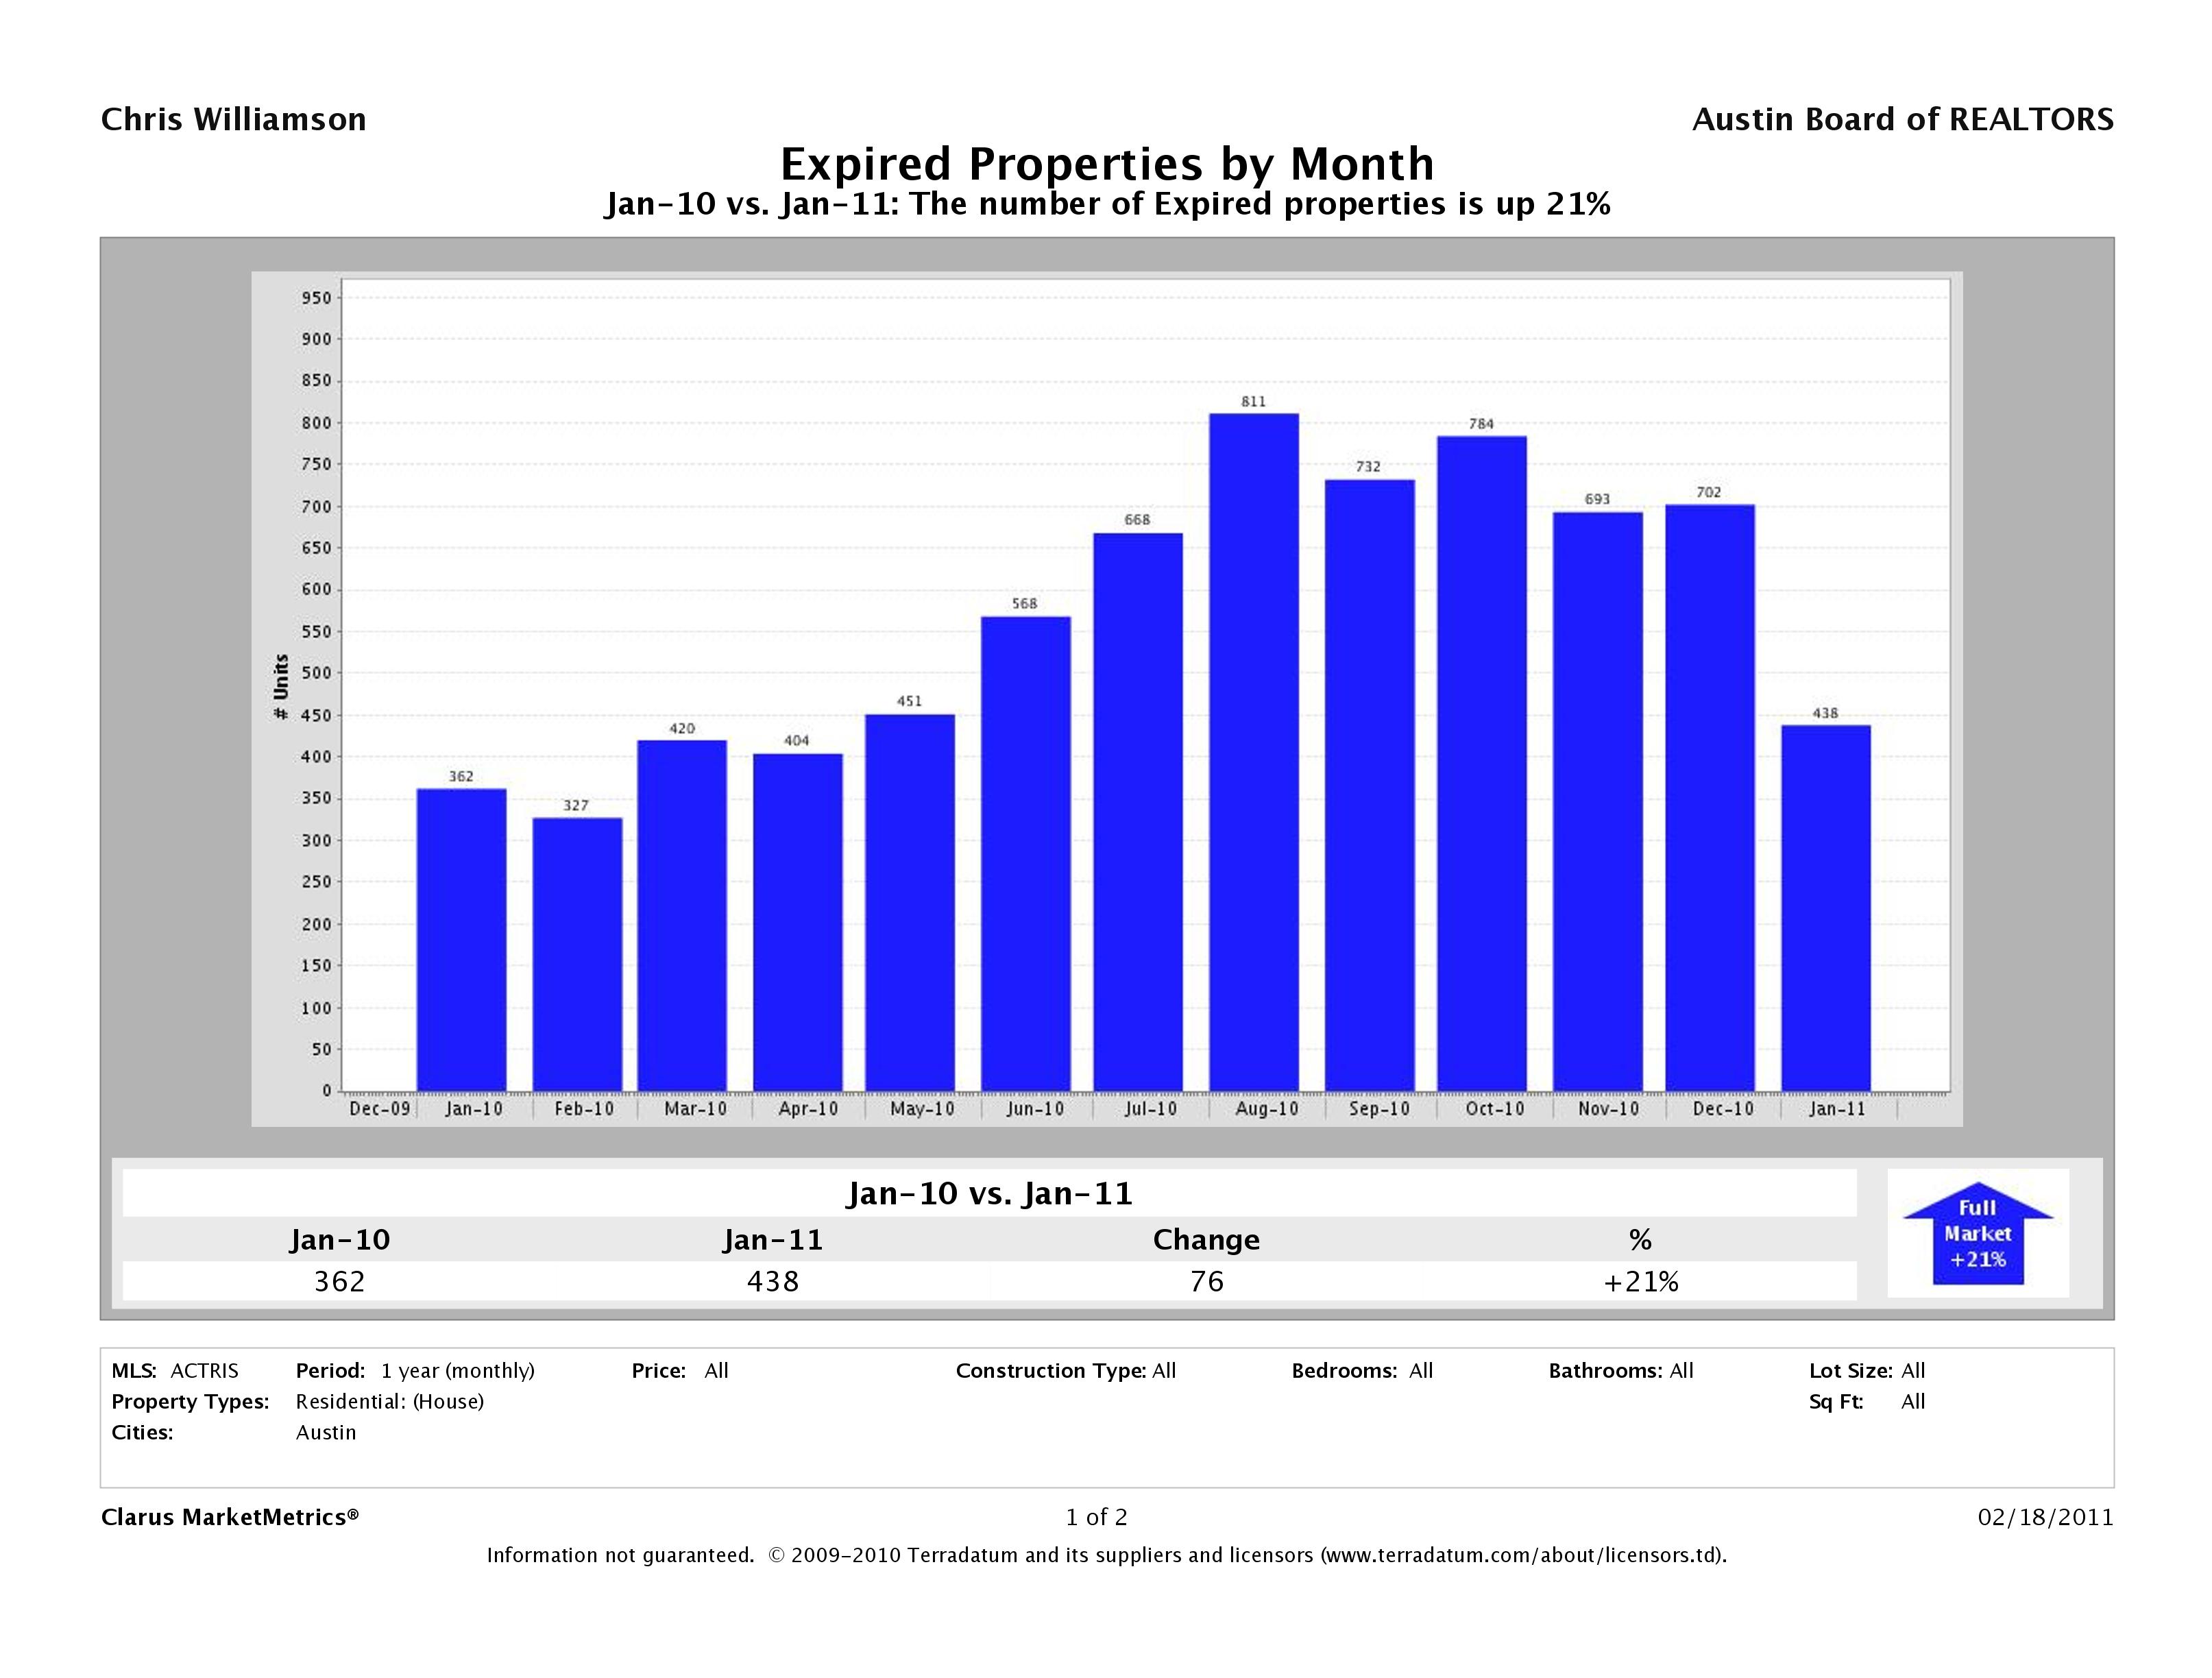
Number of Expired Austin Homes Up 21%
The number of expired homes in Austin was also up 21% from 362 in Jan 2010 to 438 in Jan 2011 indicating there is still a group of sellers who are unrealistic about their price. Sellers who are realistic and have done the work to prepare their homes to sell are seeing the benefits while others who did not prepare their homes nor set a realistic price are hanging onto their homes longer.
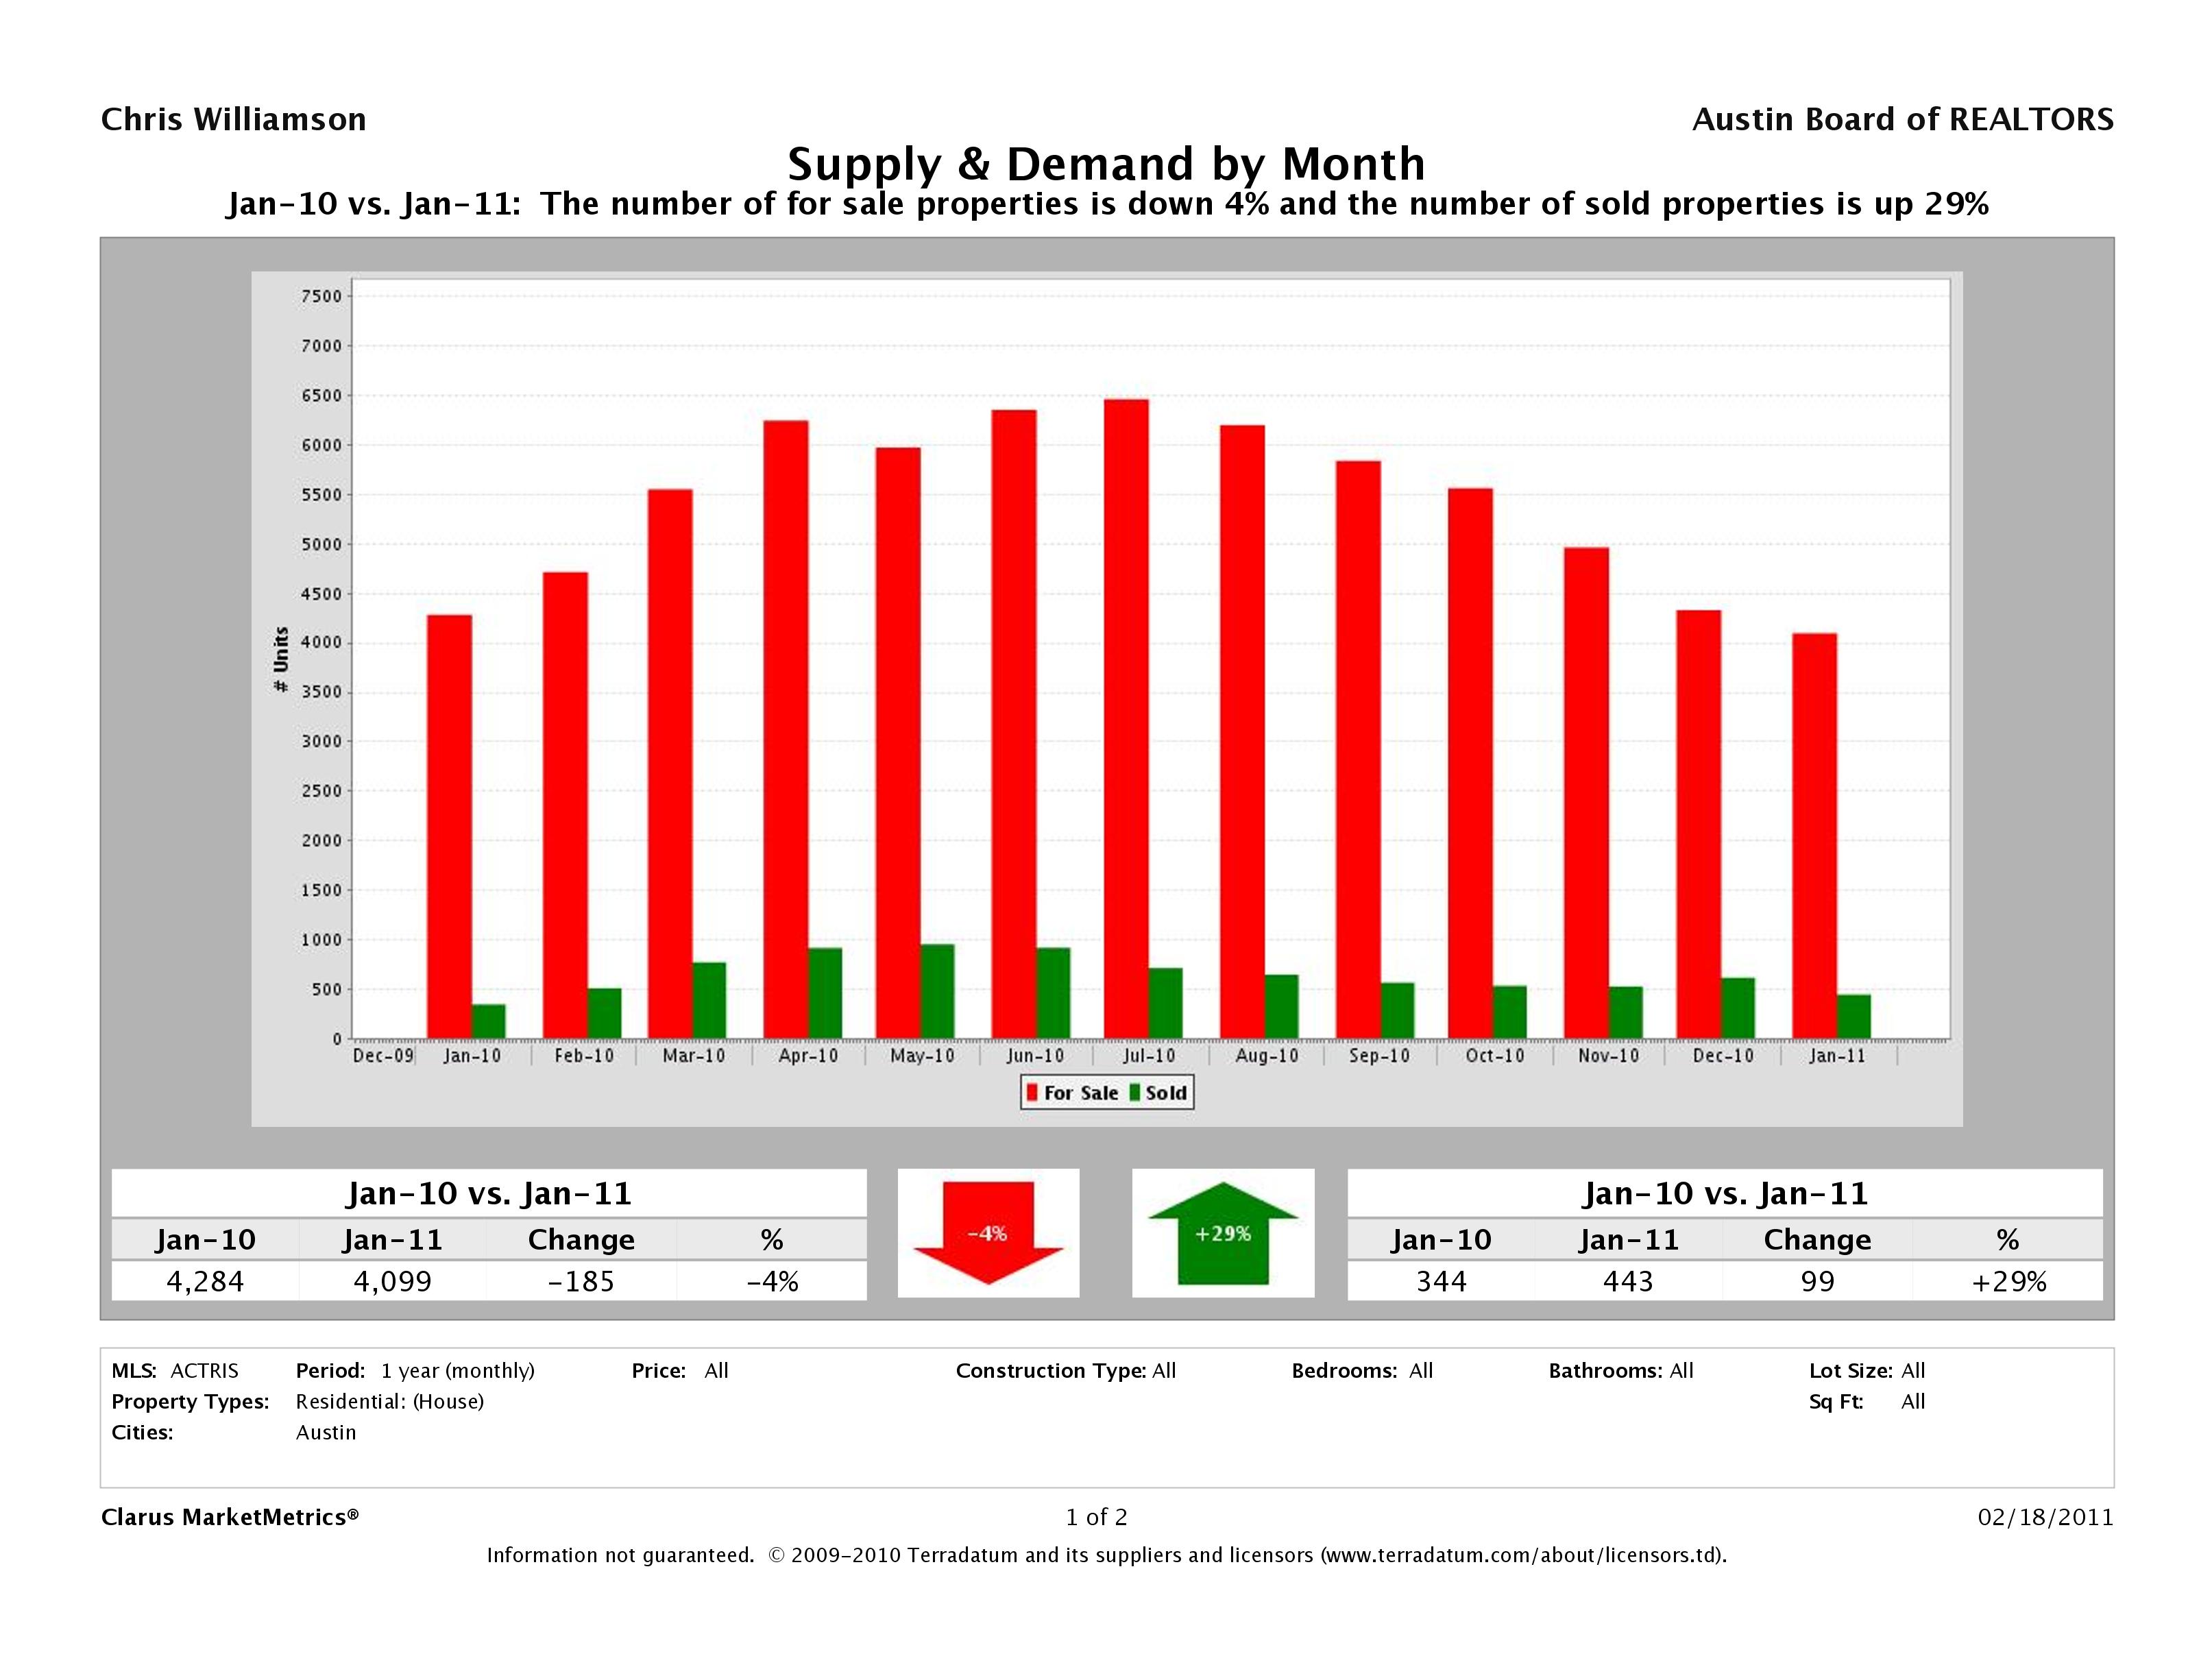
Supply and Demand – Austin Homes
As we saw in previous graphs, the number of for sale homes in Austin is down 4% and the number of Austin homes sold is up 29%. This supply and demand graph allows you to compare these two numbers visually.
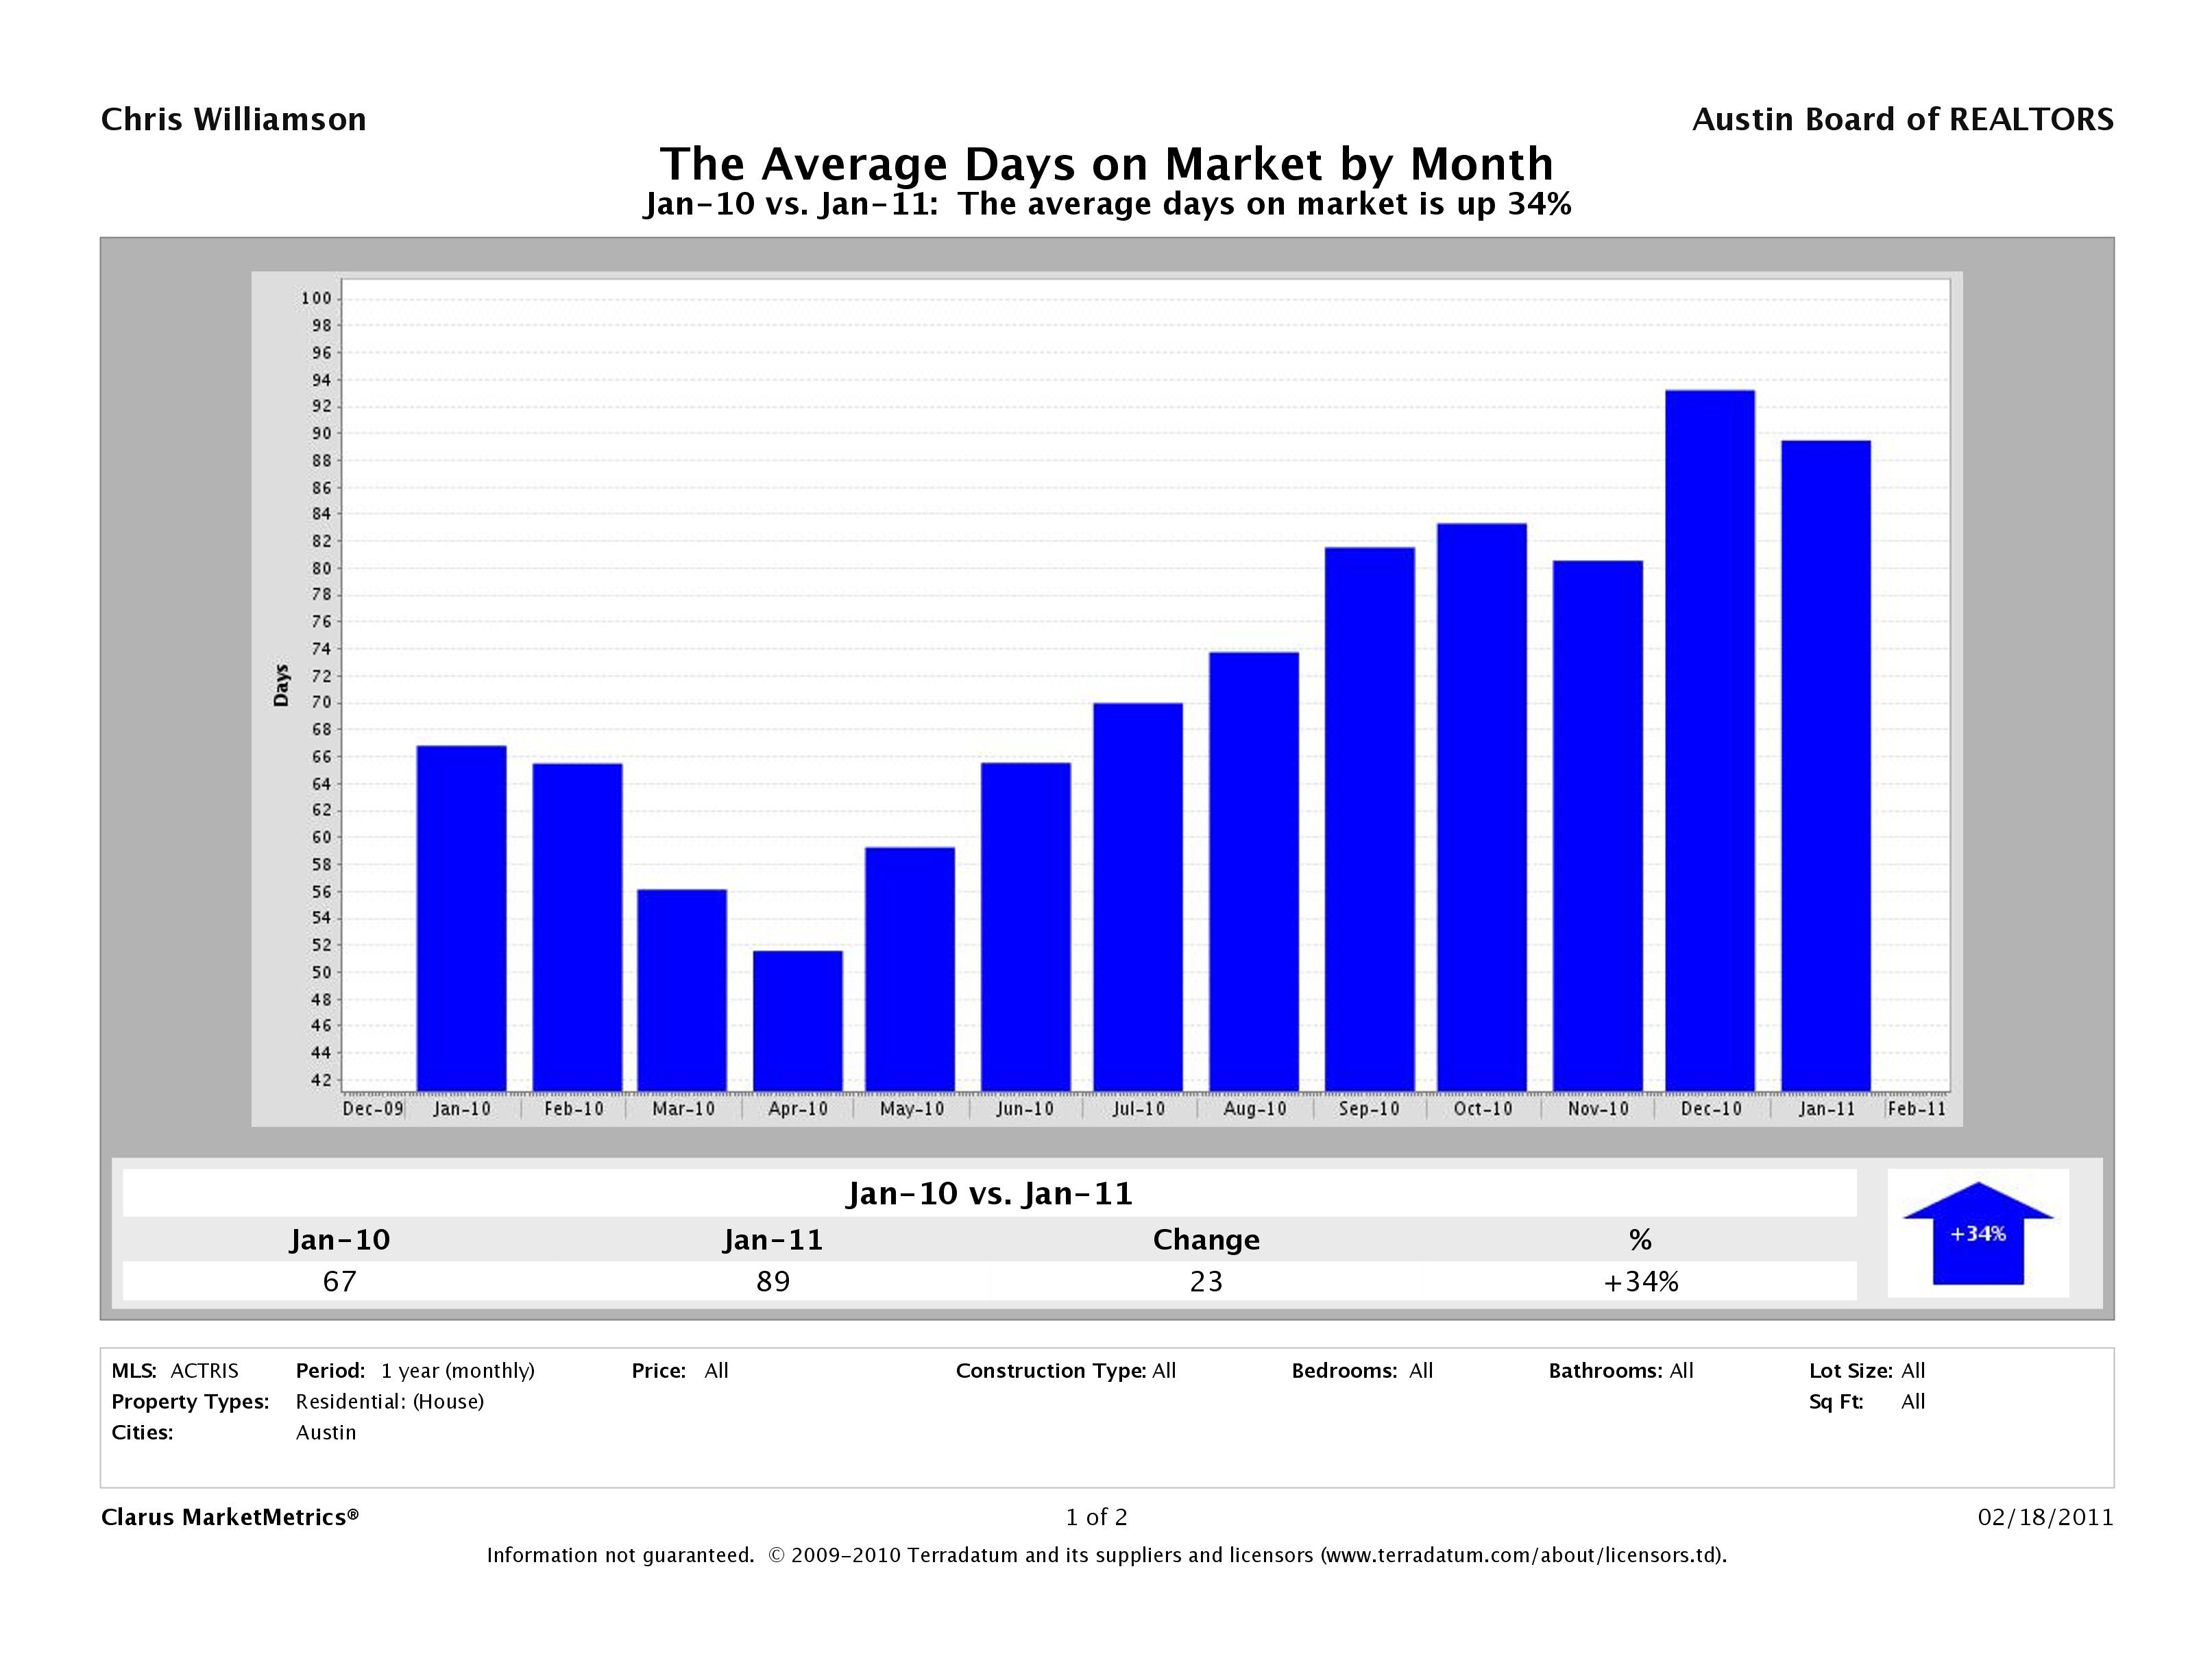
Average Days on Market Up 34%
Average days on market increased 34% in year over year comparisons. I’d attribute this to the seasonal dip we see around the holiday season in November and December. Homes that were listed 3 months ago at the start of the Holidays languished on the market waiting for buyers to get serious about home buying again. With the apparent improvement in investor confidence, I’d expect this number to improve as we finish out Quarter 1 of 2011.
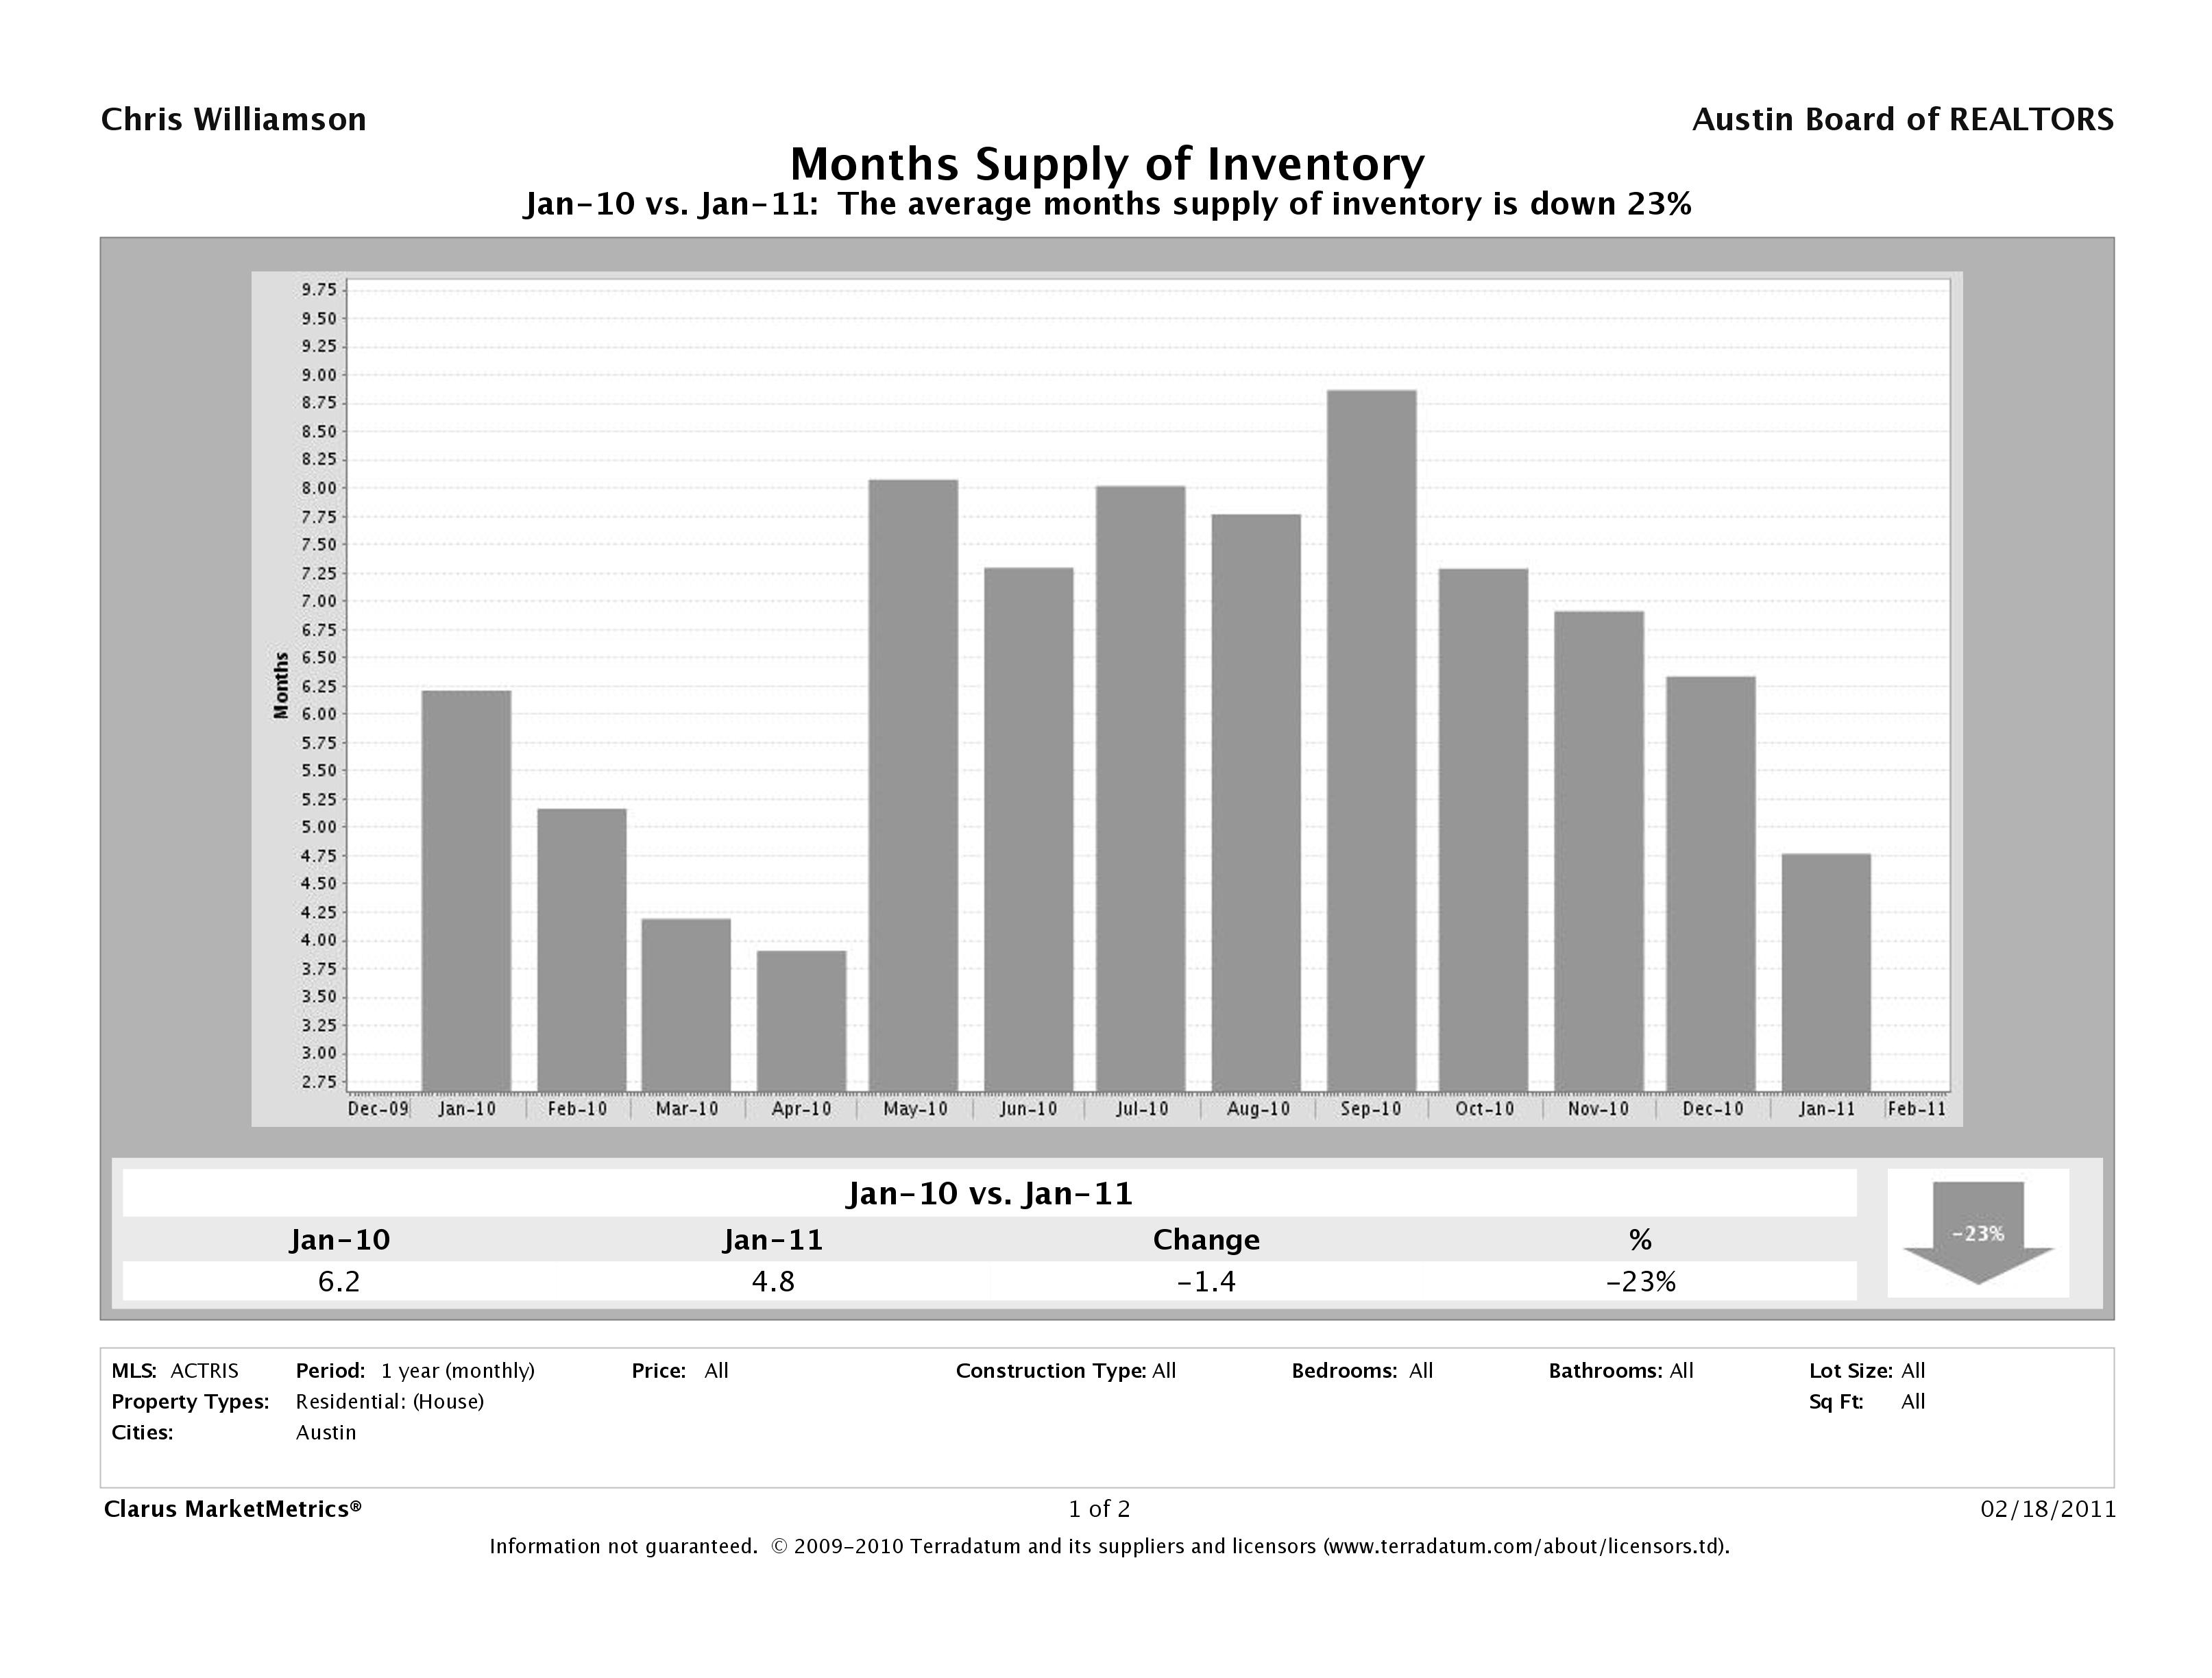
Months Supply of Inventory Down 23.3%
With all the inventory purchased in January 2011, our months supply of single family home inventory in Austin is down 23.3% to just below 5 months in January 2011 from over 6 months available in January 2010. This decrease is what we’d expect given the decrease in new homes listed and a sharp increase in number of homes purchased.
Source: Clarus Market Metrics, ACTRIS Sold Data
Questions About the Austin Real Estate Price Report?
Do you have questions about this Austin Real Estate Price Report? Call us at (512) 827-8323 or email us at info@AustinRealEstateHomesBlog.com and we’ll help you in any way we can. If you’re looking to buy or sell Austin real estate, don’t forget to check out our Buyer and Seller Resources for more tips.
Leave a Reply